Magnetic anisotropy of Fe1-yXyPt–L10 [X=Cr,Mn,Co,Ni,Cu] bulk alloys.
Abstract
We demonstrate by means of fully relativistic first principles calculations that, by substitution of Fe by Cr, Mn, Co, Ni or Cu in FePt–L10 bulk alloys, with fixed Pt content, it is possible to tune the magnetocrystalline anisotropy energy by adjusting the content of the non–magnetic species in the material. The changes in the geometry due to the inclusion of each element induces different values of the tetragonality and hence changes in the magnetic anisotropy and in the net magnetic moment. The site resolved magnetic moments of Fe increase with the X content whilst those of Pt and X are simultaneously reduced. The calculations are in good quantitative agreement with experimental data and demonstrate that models with fixed band structure but varying numbers of electrons per unit cell are insufficient to describe the experimental data for doped FePt–L10 alloys.
The chemically ordered face–centred tetragonal (fct) FePt–L10 phase has attracted much interest because of its large magnetocrystalline anisotropy energy (MAE) value of 7107 ergs/cm3 and hence its potential applications such as ultra–high density magnetic recording media weller ; ivanov . From the experimental side there are two principal challenges to the production of high density recording media. First is the large values of the MAE to overcome the superparamagnetic limit so as to avoid the loss of recorded information Yan arising from thermal instability. One solution to this problem is the use of L10 bimetallic alloys as magnetic recording media. This leads to a second challenge in that the preparation of such alloys generally leads to the deposition of the disordered fcc A1 phase with low anisotropy. Transformation into the L10 phase with large MAE requires elevated annealing temperature, leading to problems with maintaining the granular structure necessary for high density recording.
Some studies have proposed using FePt–based ternary alloys to lower the kinetic ordering temperature leading to reduced annealing temperatures thereby improving the orientation and granular structure yang ; bwang ; bwang1 . However, this has the detrimental effect of reducing the MAE. This problem was studied in a related theoretical paper by Sakuma sakuma , who used a fixed band structure corresponding to FePt and varied the number of electrons/unit cell , finding that the MAE had its maximum value for , corresponding to pure FePt. These predictions were verified experimentally by Suzuki et.al. suzuki . More recent work has studied the effect of substituting Fe by Cu gilbert , Mn Xu ; meyer ; burkert , Ni Berry ; Thiele . Gilbert et. al.Thiele conclude that Cu doping gives a relatively simple approach to achieve high quality L10 FeCuPt films that have greater MAE values than current media and therefore are desirable for future magnetic recording technologies. Also, the magnetic properties can be smoothly tuned by Cu-substitution into Fe sites of the ordered alloy. The experiments are generally supported by the rigid band model calculations of Sakuma sakuma . However, it is debatable as to how realistic such models are, given the chemical and structural changes induced by alloying. This question can only be answered by a detailed investigation taking account of the nature of the alloys produced. This is the aim of the current letter. Our calculations are in good agreement with experiment and demonstrate a doping–species dependence of the MAE reduction and also, importantly, variations in the local MAE arising from the different lattice sites available to the impurity atoms.
Consistent with the experimental studies we proceed by replacing the Fe content in bulk FePt–L10 by Cr, Mn, Co, Ni and Cu keeping the Pt concentration fixed. Within Fe1-yXyPt bulk alloy, we take the concentration as 0, 0.25, 0.50, 0.75 and 1, being the amount of non–magnetic species, whose introduction changes the effective number of valence electrons, , in the cell. The effective valence electrons are computed as , where is the number of atoms of each species, , and the total number of atoms in the simulation cell. This systematic Fe replacement of similar 3 elements serves to control since for the above mentioned species, the valence charge is 6, 7, 9, 10, 11, respectively. Note that only the 3 electrons are included in the current definition; the 5 contribution from the Pt is constant and is not taken into account here.
All the geometric, electronic and magnetic structure calculations of Fe1-yXyPt–L10 alloys have been done by means of DFT using the SIESTA siesta code. As exchange correlation (XC) potential we have employed the generalized gradient approximation (GGA) following the Perdew, Burke, and Ernzerhof (PBE) version pbe . To describe the core electrons we have used fully separable Kleinmann-Bylander kb and norm-conserving pseudopotentials (PP) of the Troulliers-Martins tm type. As a basis set, we have employed double-zeta polarized (DZP) strictly localized numerical atomic orbitals (AO). The so–called electronic temperature –kT in the Fermi-Dirac distribution– was set to 50 meV. The magnetic anisotropy energie (MAE) has been obtained using a recent fully relativistic (FR) implementation LS-paper in the GREEN green ; greenp code employing the SIESTA framework. As usual, the MAE is defined as the difference in the total energy between hard and easy magnetization directions. Convergence of the MAE convergence is dependent on the sampling points. Within the present work we performed an exhaustive analysis of the MAE convergence in order to achieve a tolerance below microelectron volts. We employed more than 5000 points in the calculations for each geometric configuration, which was sufficient to achieve the stated accuracy.
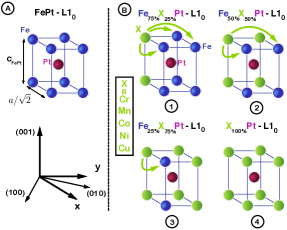
The binary L10 alloys are formed by alternating planes of two distinct species which generates a vertical distortion as a result of which two quantities define the geometric structure: the in–plane lattice constant, , and the out–of–plane parameter, . Specifically, in FePt–L10 the experimental values are = 3.86Å and =0.98. What we pursue is to study the variation of the anisotropy of bulk FePt–L10 via the substitution of Fe atoms by other 3 species keeping Pt fixed. In doing this we are able to scan two possible ways to control the MAE: on the one hand, the species and on the other, the concentration of the impurity (See Fig. 1). Each one of the Cr, Mn, Co, Ni and Cu atoms has different number of valence electrons, so that it gives the possibility to control the number of total valence electrons in the cell depending on whether one, two, three or four atoms are replaced on the Fe sites.
It is complicated in DFT to deal with this kind of calculation due to the large cells that one has to use to have a good approximation of the real material in a computer model, so we doubled the unit cell in X, Y and Z axis in order to be able to substitute the X atoms one by one. The minimum unit cell for a XPt–L10 bulk is composed of two atoms (see Fig. 1–B) and in our case the simulation cell has 16. This permits to move X atoms on different in–plane and out–of–plane positions as the green arrows depict in Fig. 1–B. The number of different geometric configurations keeping the X content fixed were: three for B–1 and B–3 and six for B–2. For each configuration we performed a fully relaxation using the conjugate gradient (CG) method without any constraint. Special attention is needed for the Fe(Cr,Mn)Pt alloys inasmuch as the lower energy configuration corresponds to antiferromagnetic (AF) alignment of the Mn atoms between different atomic planes lu , so we include this restriction in our calculations as a magnetic constraint.
Geometric, electronic and magnetic properties have been calculated by means of the mean value of fixed X:Fe composition unless explicitly expecified, for example, the density of states (DOS) for a fixed X:Fe ratio is
where runs up to the total number of configurations for a fixed X composition, , is the spin–up/–down states and the energy, usually shifted to the Fermi level, .
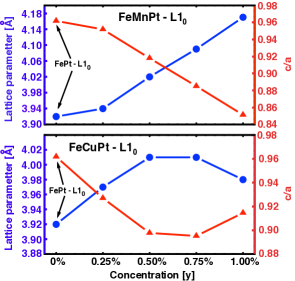
As was pointed out in the experimental work of Gilbert et al gilbert , the substitution of Cu into the bulk FePt–L10 phases promotes an increase of the in–plane lattice parameter values as we observe in Fig 2 (blue dots), which is therefore in agreement with experiment. The out–of–plane parameter is simultaneously reduced with increasing Cu content. Consequently, the tetragonal distortion of FeCuPt–L10 increases with Cu content leading to an in–plane (out–of–plane) lattice constants of 3.98Å(3.64Å). In the case of FeMnPt–L10(AF), increases with decreasing , in agreement with the experimental results of Meyer et almeyer .

Fig. 3 shows the averaged spin resolved density of states for the Fe1-y(Mn,Cu)yPt alloys as the concentration of the Fe and (Mn,Cu) changes, left and right panel, respectively. From top to bottom is shown the evolution of the total (solid black), Fe (solid blue), Pt (dashed red) and the X(=Mn,Cu) (filled green) DOS as the Fe, Mn, Cu species is varied. As pointed out earlier, the lower energy configuration for the FeMnPt–L10 corresponds to AF coupling of the Mn atoms on alternating planes so that the up/down charges are equal and the net magnetic moment (MM) is zero which is reflected in the green DOS curves.
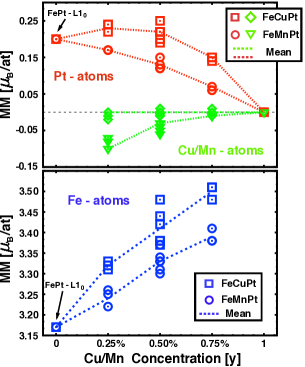
The DOS curves aid the interpretation of the behavior of the magnetic moments. In bulk FePt–L10, the net MM is 3.37 , mainly dominated by the Fe species as depicted the blue line in the upper graphs. Only a fraction of this net value is contributed by the Pt sites, as has been pointed out in previous work mryasov . The Fe–Pt–Fe indirect interactions promote the polarization of the Pt atoms. In our case, the substitution of the the Fe by non–magnetic species such as Mn or Cu reduces principally the Fe down–states tending to leave the Fe atoms embeded in a non–magnetic environment, becoming almost magnetically isolated with increasing Mn/Cu content. This is the reason behind the increase of MMFe with Cu/Mn content (see Fig. 4). Simultaneously, the MMPt diminishes due to the reduction in Fe neighbors until the up and down charges compensate. The MMCu is close to zero independent of the amount present in the alloy. On the contrary, a small concentration of Mn gives a MMMn value of -0.12, its magnitude reducing to zero with increasing Mn content. In summary, both the (Mn,Cu)Pt–L10 bulk alloys have a zero net MM as we see in the bottom panel. The addition of the Fe atoms to these alloys enhances the value of the total MM, partly from the Fe and partly from the induced Pt polarization. It should be noted that in Fig. 4 the scatter of points for a given impurity concentration indicates the variation of the magnetic moment across the different lattice positions hosting the impurity. A similar dispersion is also seen in the local MAE values, which are considered next.
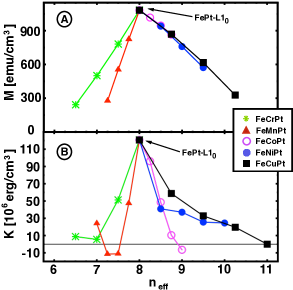
The effect on magnetization, M, and magnetic anisotropy of X = Cr, Mn, Co, Ni, Cu substitution in FePt–L10 as a function of the is shown in Fig. 5. The variations with of both the magnetization and MAE are in good agreement with the experimental data reported by Gilbert gilbert et al although a detailed comparison is difficult as will be discussed shortly. Consider first the magnetization , which is calculated taking account of the variation of the MMs between substitution sites. It can be seen that has a maximum for FePt and falls off more rapidly for than for . This is consistent with experimental data. We note also that the rate of reduction for is faster than predicted by Sakuma sakuma emphasizing the importance of taking specific account of the AF coupling of the impurity spins. The MAE also has a maximum for FePt as expected and falls off rapidly on either side of the optimum band filling. Consistent with experiment, the dependence of the MAE on is slower for Ni and Cu impurities, allowing a more controlled tuning of the anisotropy. Some configurations change their easy axis from out–of–plane to in–plane, specifically in Fe0.50Mn0.50Pt, Fe0.25Mn0.75Pt and CoPt. This is not observed experimentally, where the range of does not extend into the region of the predicted in–plane anisotropy. Finally, we note that there is an important dependence of the MAE on the species of the impurity atoms, which is not predicted by the (fixed band) calculations of ref sakuma . The experimental data cannot reliably be used to test this prediction since the results summarised in ref gilbert were all made on different samples using different measurement techniques. For example, the MAE for FePtMn differ as much as a factor of 2–3 between laboratories, suggesting that the current FePtNi and FePtCu data (again measured in different laboratories) cannot be used to test the species-dependence predicted here.
In summary, we have developed a theoretical method to investigate the MAE of the FePt–L10 phase following gradual substitution of Fe by Cr, Mn, Co, Ni and Cu keeping the Pt content fixed. The inclusion of the doping elements changes the in–plane and the out–of–plane lattice constants characterising the fct phase. In general, a increases with the reduction of the Fe content promoting a decrease of c. The magnetic moment of the magnetic and non–magnetic species also changes substitution. Due to the low Fe–Fe in–plane coordination that emerges after replacement of the Fe atoms, the indirect polarization of Pt and other species is reduced substantially, disappearing for large dopant concentrations. On the other hand, the Fe tends to be magnetically isolated in a non–magnetic environment and hence its MM tends to increases. The predicted variation of the magnetization as well as the MAE with the effective valence charge is in good general agreement with prior experiments. The calculations also predict that the local, site resolved, anisotropy constant has a dispersion arising from differences in the local environment of doping atoms situated at different lattice sites. We also predict a species-dependence of the variation of MAE with band filling, which requires further experimentation to evaluate, but which certainly suggests that fixed band models are insufficient to study the MAE of FePtX alloys and that a full treatment of the nature of the alloys is necessary.
The authors are grateful to Prof. Chih-Huang Lai and Prof Kai Liu for helpful discussions. Financial support of the EU Seventh Framework Programme under Grant No. 281043, FEMTOSPIN is gratefully acknowledged.
References
- (1) D. Weller and A. Moser IEEE Trans. Magn., 36, 10 (1999).
- (2) O. A. Ivanov, L. V. Solina, V. A. Demshina and L. M Magat Fiz. Metal Metalloyed 35, 92 (1973).
- (3) M. L. Yan, H. Zeng, N. Powers, and D. J. Sellmyer J. Appl. Phys. 91, 8471 (2002)
- (4) W. Y. Zhang, H. Shima, F. Takano, H. Akinaga, X. Z. Yu, T. Hara, W. Z. Zhang, K. Kimoto, Y. Matsui, and S. Nimori, J. Appl. Phys. 106, 033907 (2009).
- (5) B. Wang, K. Barmak, and T. J. Klemmer, IEEE Trans. Magn. 46, 1773 (2010).
- (6) B.Wang, K. Barmak, and T. J. Klemmer, J. Appl. Phys. 109, 07B739 (2011).
- (7) Dustin A. Gilbert, Liang-Wei Wang, Timothy J. Klemmer, Jan-Ulrich Thiele, Chih-Huang Lai, and Kai Liu Appl. Phys. Lett. 102, 132406 (2013)
- (8) Zhihong Lu, Roman V. Chepulskii, and W. H. Butler Phys. Rev. B 81, 094437 (2010)
- (9) D. B. Xu, J. S. Chen, T. J. Zhou, and G. M. Chow Appl. Phys. Lett. 109, 07B747 (2011).
- (10) Gereon Meyer, and Jan–Ulrich Thiele Phys. Rev. B 73, 214438 (2006).
- (11) Till Burkert, Olle Eriksson, Sergei I. Simak, Andrei V. Ruban, Biplab Sanyal, Lars Nordstr’́om, and John M. Wills Phys. Rev. B 71, 134411 (2005).
- (12) D. C. Berry, and K. Barmak J. Appl. Phys. 102, 024912 (2007).
- (13) J.-U Thiele, K. R. Coffey, M. F. Toney, J. A. Hedstrom, and A. J. Kellock J. Appl. Phys. 91, 6595 (2002).
- (14) Takao Suzuki, Hiroshi Kanazawa, and Akimasa Sakuma. IEEE Trans. Mag. 38, 0018 (2002)
- (15) Akimasa Sakuma. J. Phys. Jap. 63, 3053 (1994) (2008).
- (16) J.M. Soler, E. Artacho, J.D. Gale, A. García, J. Junquera, P. Ordejón and D. Sánchez-Portal, J. Phys.: Condens. Matter, 14, 2745, (2002).
- (17) L. Kleinman and D. M. Bylander, Phys. Rev. Lett., 48, 1425, (1982).
- (18) N. Troullier and J. L. Martins, Phys. Rev. B, 43, 1993, (1991).
- (19) J. P. Perdew, K. Burke and M. Ernzerhof, Phys. Rev. Lett., 77, 3865, (1996).
- (20) R. Cuadrado and J. I. Cerdá J. Phys.: Condens. Matter 24, 086005 (2012).
- (21) J.I. Cerdá, M.A. Van Hove, P. Sautet, M. Salmerón, Phys. Rev. B, 56, 15885, (1997).
- (22) J.I. Cerdá http://www.icmm.csic.es/jcerda/
- (23) O.N Mryasov, U. Nowak, K.Y. Guslienko and R.W. Chantrell, Europhysics Letters 69, 805 (2005).