Monopole ordered phases in dipolar and nearest-neighbours Ising
pyrochlore:
from spin ice to the “all-in–all-out” antiferromagnet
Abstract
We study Ising pyrochlores by means of Monte Carlo simulations. We cover a set of exchange constants ranging from the frustrated ferromagnetic case (spin-ice) to the fully-ordered “all-in–all-out” antiferromagnet in the dipolar model, reinterpreting the results –as in an ionic system– in terms of a temperature vs. magnetic charge density phase diagram. In spite of its spin nature and the presence of both double and single non-conserved magnetic charges, the dipolar model gives place to a phase diagram which is quite comparable with those previously obtained for on-lattice systems of electric charges, and on spin ice models with conserved number of single magnetic charges. The contrast between these systems, to which we add results from the nearest-neighbours model, put forward other features of our phase diagram –notably, a monopole fluid with charge order at high monopole densities that persists up to arbitrarily high temperatures– that can only be explained taking into account construction constraints forced by the underlying spin degrees of freedom.
pacs:
75.10.Hk, 02.70.Uu, 75.50.-yI Introduction
Describing a complex material in terms of low-lying particle-like collective excitations –quasi-particles– is one of the key approaches in condensed matter physics Anderson (1997). Phonons, magnons, electrons and holes in semiconductors, are some of the better known examples of these excitations. But quasi-particles form a very rich set, including topological excitations and fractionalisation. In a first approximation, these excitations are considered as non-interacting, with all the complexity of the system hidden in the quasi-particles themselves. The next layer of description, where interactions between quasi-particles are included, leads to a great variety of behaviours: from an-harmonic effects in crystals to the stabilization of higher hierarchies of order such as magnon binding Khomskii (2010) or magnon-mediated heavy fermion superconductivity Steglich et al. (1979). Recently, a new kind of fractional point-like topological excitation has been proposed theoretically Castelnovo et al. (2008) and evidence of its existence found experimentally Morris et al. (2009); Kadowaki et al. (2009); Fennell et al. (2009) in the spin ice compounds. These new quasi-particles are sources of magnetic field and interact via a Coulomb-like potential, whence their name magnetic monopoles Castelnovo et al. (2008). This approach allows for a very effective description of the thermodynamics, the dynamics and the out of equilibrium behaviour of spin-ice systems Castelnovo et al. (2008); Ryzhkin (2005); Jaubert and Holdsworth (2009); Slobinsky et al. (2010); Klemke et al. (2011); Petrenko et al. (2011); Jaubert and Holdsworth (2011); Castelnovo et al. (2011); Sen and Moessner (2014).
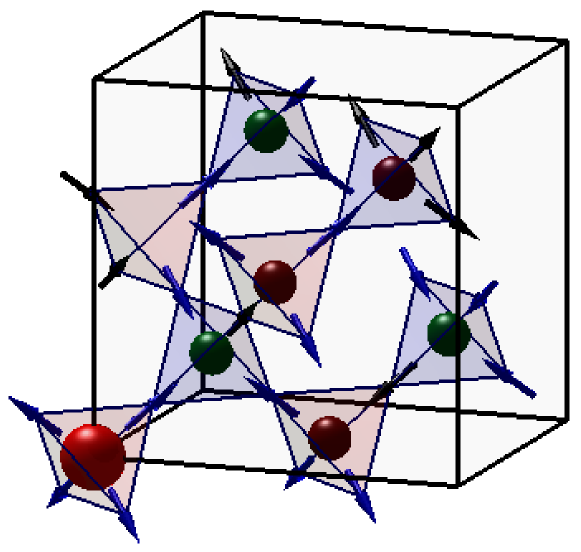
The magnetic properties of spin ice materials can be described by classical magnetic moments in a pyrochlore lattice, occupying the vertices of corner-sharing tetrahedra. They behave at low temperatures as Ising-like spins Bramwell and Gingras (2001) with , pointing along the directions (Fig. 1). The magnetic interactions of exchange and dipolar origin –of strengths and , respectively– are well accounted for by the dipolar spin ice model (DSIM) Hamiltonian:
| (1) |
where is the temperature, is the lattice spacing, means that the sum is carried over nearest neighbours, is the distance between spins and and .
The nearest neighbours spin ice model (NNSIM) Hamiltonian is derived from the DSIM by keeping only the nearest neighbour contributions of the dipolar interaction:
| (2) |
with and , i.e. an effective exchange interaction of strength . For the spin ice materials, in (2) is positive () and imposes the spin-ice rule (named after Bernal and Fowler’s ice rules Bernal and Fowler (1933)): two spins should point in and two out of a tetrahedron. This rule can be translated into field theory language as a divergence free condition, which gives rise to a “Coulomb phase” Henley (2010). Following Ref. Castelnovo et al., 2008, a violation of this law can be interpreted as the creation of a charge –a monopole– sitting in the tetrahedron; within the DSIM, a Coulomb-like magnetic charge proportional to the divergence of the spin vectors can be associated to each of these excitations. Single excitations of opposite signs are related to “3-in/1-out” or “1-in/3-out” configurations, while double excitations (with double charge) correspond to the “all-in” or “all-out” configurations. The antiferromagnetic version of this model, with negative (i.e. ), has an unfrustrated ground state corresponding precisely to an ordered zinc-blende structure of double charges: spins in alternating tetrahedra are in configurations “all-in” and “all-out”. Though much searched for, no Ising pyrochlore with this spin ordering has been found yet Matsuhira et al. (2009).
At zero magnetic field the density of monopoles is regulated by the sign and magnitude of which, in the currently known materials, leads at best to moderately correlated monopole fluids Zhou et al. (2011, 2012). In order to explicitly show the effect of these correlations at low temperatures while stressing the role of charge degrees of freedom, some of us recently reported the results of simulations on a dipolar spin ice model where a new ingredient was introduced: while keeping the dipolar Hamiltonian (1), our approach in the conserved monopole dipolar spin ice model (CDSIM) was to use the density of conserved single monopoles as the main control parameter Borzi et al. (2013). Our finding of phases with different degrees of long range charge-like ordering reinforced the beauty and simplicity of the monopolar scenario introduced by Castelnovo and collaborators Castelnovo et al. (2008). A very recent contribution addresses this same issue in a wider scope Brooks-Bartlett et al. (2014). Excluding double charges in the dumbbell model (which –unlike the previous approach– takes magnetic charges and not spins as their interacting simple entities), they show that a Coulomb phase can still be defined beneath a crystal of magnetic single charges. One drawback of these approaches is that the explicit omission of double defects is somewhat contrived: in real materials, the limit implies the proliferation of both single and double excitations. Furthermore, within the CDSIM model, the ordered ground state expected for negative is not allowed den Hertog and Gingras (2000).
In this paper we return to the usual DSIM in order to address these shortcomings in the previous analysis and to extend it in order to include the antiferromagnetic case. Building up on previous results by den Hertog et al. den Hertog and Gingras (2000), we show that when examined using the framework of monopolar excitations both the DSIM and the CDSIM lead to the same physics, and in particular to very similar phase diagrams. Since within the NNSIM one would naively expect no monopole-monopole interaction, one would think charge degrees of freedom to play no role. In spite of this, we will see that the phase diagram obtained for the NNSIM model can be reinterpreted in terms of effective nearest-neighbours interactions between double charges. We will also show that these effective interactions (neither dipolar nor exchange in origin, but arising from correlations imposed by the internal degrees of freedom of the charges) also affect the phase diagram in the presence of dipolar interactions.
Simulation details
We performed Monte Carlo simulations with single spin-flip Metropolis algorithm, using Ewald summations to take into account the long-range interactions Melko and Gingras (2004). We used a conventional cubic cell for the pyrochlore lattice, which contains spins, and simulated systems with cells. Thermodynamic data were collected by starting at high temperatures and cooling very slowly, for different values of (as this ratio will be negative throughout this work, we will usually refer to its absolute value). Typically, we needed Monte Carlo steps for equilibration and for averaging at each temperature for , but we used up to steps for bigger lattices. First order transition points deserve to be mentioned separately; there, full equilibration was only achieved after longer times (up to Monte Carlo steps) for sizes below .
II Charge degrees of freedom in the dipolar model
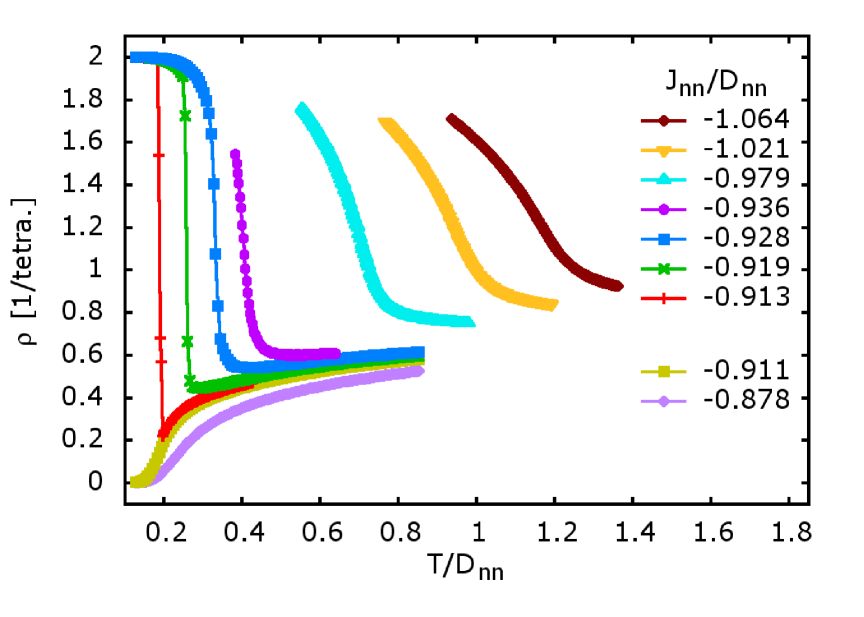
Fig. 2 shows the monopole density as a function of temperature for . We define as the number of single charges per unit tetrahedron, thus counting double monopoles as the superposition of two single charges of the same sign in a tetrahedron. In a similar way to Fig. 2 of Ref. Brooks-Bartlett et al., 2014, where only single charges were considered, we can distinguish two families of curves according to their limit as . The first type, which tend to (with ), were characterised as spin ices by determining their residual entropy, via numerical integration of the specific heat divided by temperature. The second type are curves that tend to when , meaning that they reach a state in which all the tetrahedra are occupied by double monopoles (i.e. the non-frustrated antiferromagnetic phase). For certain values of in the latter group of curves, the monopole density per tetrahedron suffers a sudden change at low temperatures from to . It is straightforward to associate the appearance of this zinc-blende structure Borzi et al. (2013) to the presence of Coulomb-like interactions between monopoles. However, later we will show that this phase (which is no other than the “all-in–all-out” phase mentioned on the title and in the introduction) can also be stabilized in the NNSIM, where these interactions are absent.
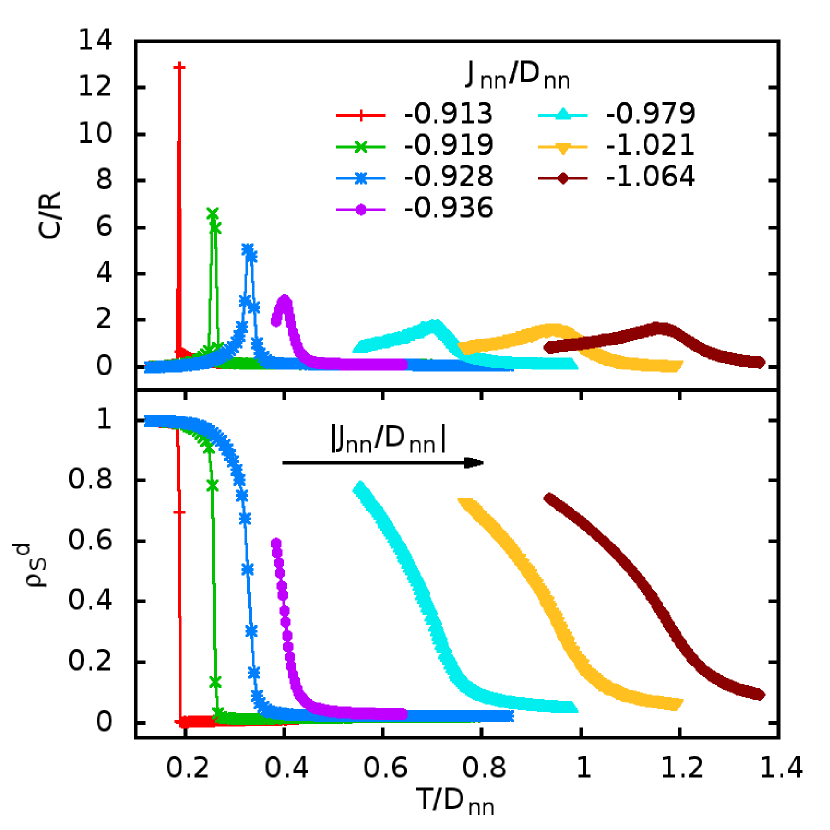
The curves in Fig. 3 (upper panel) represent the molar specific heat as a function of temperature for different values of and (i.e. corresponding only to curves in the second branch of Fig. 2). We see sharp, delta-like peaks that become wider and shorter as increases, correlated with the jumps we noticed in . With the development of a zinc-blende structure in mind, we also present our results of the double monopole staggered density , defined as the average of the modulus of the total magnetic charge due to double monopoles in up tetrahedra per sublattice site per unit charge. A nearly zero value of this quantity implies that there is no symmetry breaking between the up and down tetrahedra sublattices, while is the result of a staggered ordering of the magnetic charges: positive and negative double monopoles alternating in the sublattices, occupying all the tetrahedra. In Fig. 3 (lower panel) we observe a jump between these two states, which is sudden and step-like for low values of and slowly changes into continuous as that ratio increases. It is interesting to note that these step-like jumps are correlated to the ones in : the system becomes dense and charge-ordered suddenly and simultaneously, just as it happens in the crystallisation transition of ionic fluids. On the other hand, the continuous developing of both the staggered density and the number density at higher indicates the transition to a phase in which the local density is homogeneous (fluid-like) but charge-ordered.
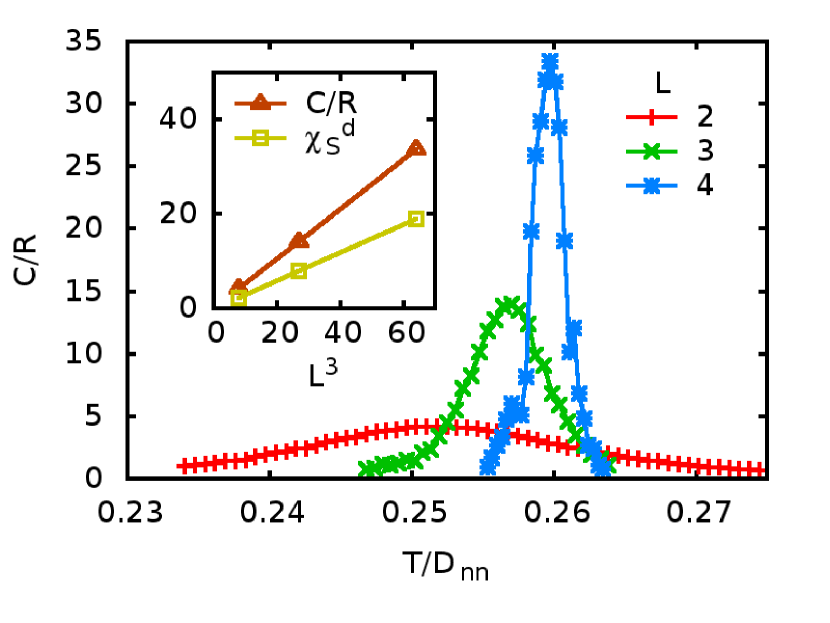
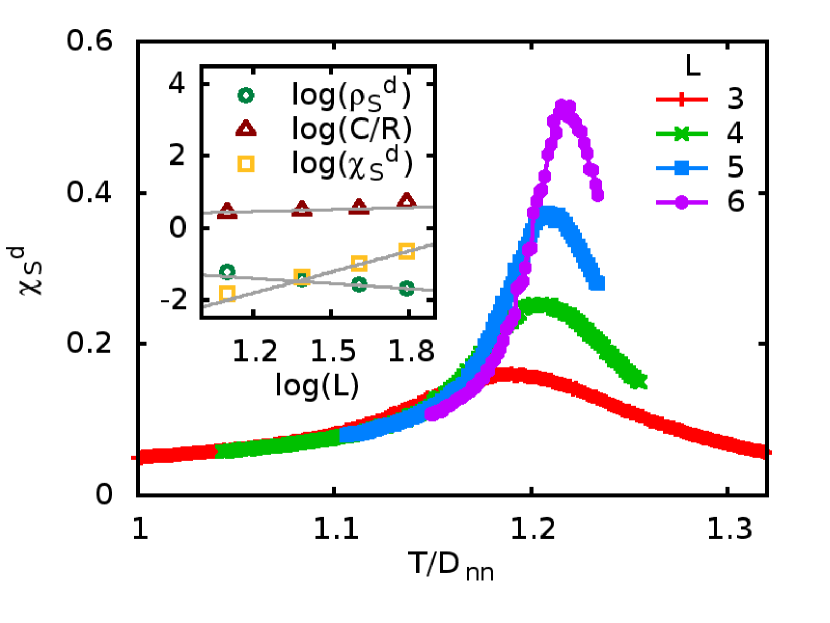
To confirm the existence of these transitions and determine their order we performed finite size analysis over values of representative of the two behaviours. In Fig. 4 we present our results of the molar specific heat for . The previous suggestion of a first order transition taking place for these values of is backed up by the fact that the value of the specific heat and the double monopole susceptibility (defined as the fluctuations of the corresponding staggered density over the temperature) at their maximum are proportional to the volume of the system (Fig. 4, inset). We also studied , in which the double monopole susceptibility (Fig. 5), as well as the specific heat and the double monopole staggered density (not shown), evolve with the size of the system as in a second order phase transition. The critical exponents are consistent with the three-dimensional Ising universality class (Fig. 5, inset). Since this line of second order transitions becomes first order, there must be a tri-critical point of the Blume-Emery-Griffiths universality class Blume et al. (1971).
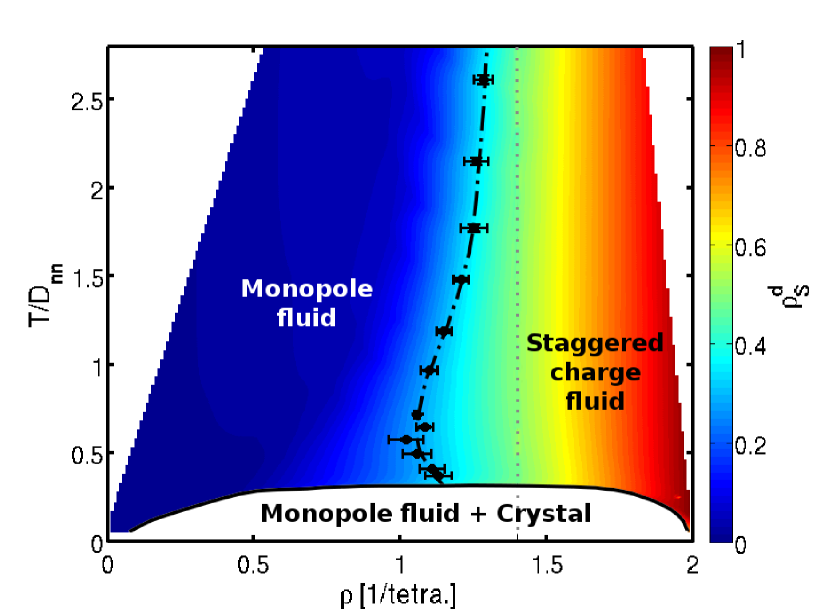
A nice way to summarise all the previous results while emphasising the importance of charge degrees of freedom is to construct a phase diagram in terms of the monopole density and the temperature (Fig. 6). The colour map corresponds to the interpolated value of the double monopole staggered density as a function of temperature and monopole number density (for ). The graph was obtained by combining a set of more than thirty vs. curves (of which those shown on Fig. 3, bottom, constitute a subset) with vs. curves (like those on Fig. 2). The filled circles represent the location of the maximum on the specific heat for various values of (see Fig. 3, top). Note that the vertical asymptote observed for this curve at high temperature corresponds to the limit in which antiferromagnetic exchange dominates over the dipolar interactions. The white dome (drawn by estimating the region where discontinuities would be observed for the infinite system) represents a forbidden region in parameter space in which, in the thermodynamic limit , the system cannot stay homogeneous. A system with at is exactly at the edge of the dome; if cooled down, it would separate into two phases occupying different parts of the material. On one hand, we would get a low-density monopole fluid, in which most of the tetrahedra are empty. On the other hand, a phase with a high double monopole density would crystallise into the zinc-blende ionic structure. In a tri-critical point around and the first order transition becomes second order, separating the monopole fluid and a staggered charge fluid in which local density is homogeneous but negative and positive charges display a tendency to occupy different sublattices, thus breaking the symmetry without phase separation. 111It should be stressed that the right part of this diagram corresponds to a single phase. The use of different names for two regions of it –which follows Ref. Borzi et al., 2013– does not imply that a different symmetry is broken, but intends to emphasise their different dynamical properties and the fact that, while the double monopole crystal may coexist with a low density charge-disordered fluid, the staggered charge fluid is homogeneous and occupies the whole space. It is interesting to note that both this staggered charge fluid and the crystal phase are more natural, double charge analogs of the single monopole ordered fluid and crystal found in the slightly artificial CDSIM (see Fig. 4 of Ref. Borzi et al., 2013). The apparent differences between this phase diagram and that presented on Fig. 1 of Ref. den Hertog and Gingras, 2000 (of which we give our own version on Fig. 9) should not mask the fact that they both describe the same physics.
On the other hand, despite the great similarity between the phase diagram of Fig. 6, and that for the CDSIM, several differences arise. Since we used a single spin flip algorithm and did not fix the number of monopolar defects, the Melko-Gingras-den Hertog first order transition Melko and Gingras (2004) at to an “ordered vacuum” of magnetic charges Borzi et al. (2013) is not visible. Also, Fig. 6 exhibits a re-entrant behaviour of the monopole fluid at temperatures just above . Finally, one would expect that a disordered phase should always be found at high temperatures () for any charge density, when entropic forces overcome monopole attraction. While this is true both for a system of real Coulomb charges in a lattice Dickman and Stell (1999) and for the CDSIM Borzi et al. (2013), we do not see the line of second order transitions joining in the present case. Instead, this line reaches an asymptotically vertical behaviour, parallel to the temperature axis. This fact, which seems to point to an infinitely high interaction energy between charges, could hardly be explained by the monopolar Hamiltonian on its own Castelnovo et al. (2008). These last two cases deserve special attention, and will be analysed in depth in the next sections.
III Comparison between the dipolar and the nearest-neighbours model
In order to better understand the limits of the magnetic charges picture and the energetics of the models we have introduced, we also studied the NNSIM (Eq. (2)) for different ratios . Similar to the previous case, we found a peak in the specific heat and the double monopole susceptibility, and a steep rise in the double monopole staggered density as a function of temperature (not shown), suggesting a phase transition. In this case the behaviour of these quantities is typical of a second order transition for each value of studied, with no delta-like peaks or discontinuities.
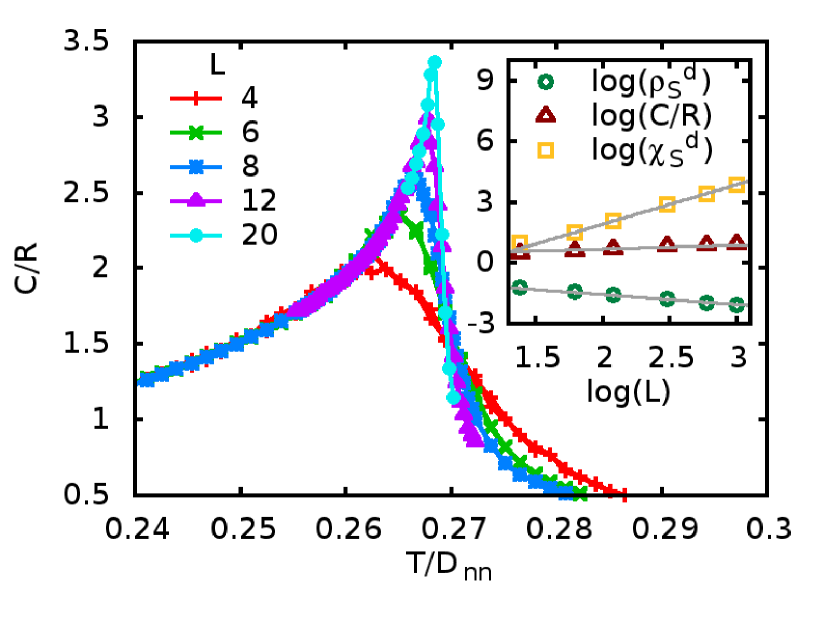
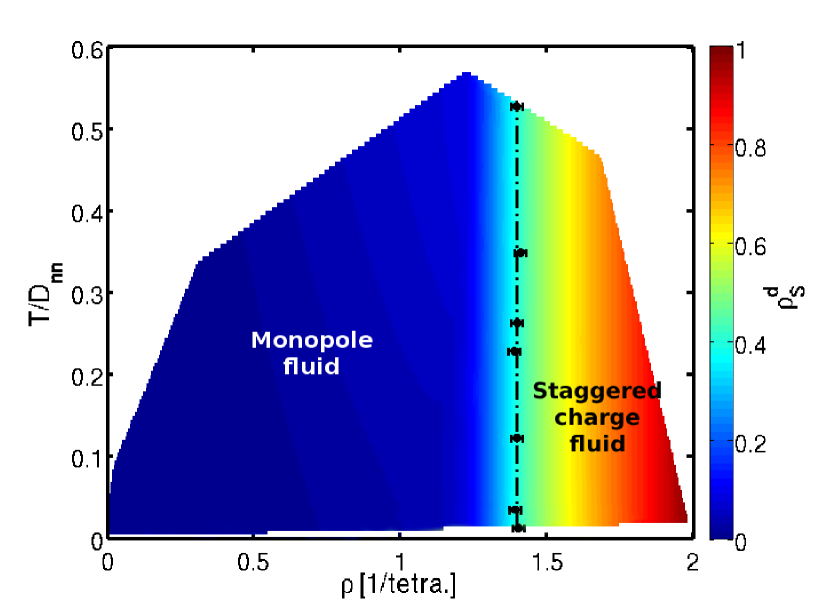
In Fig. 7 we show the peak in the the molar specific heat for and different sizes of the system. The inset shows that its value at the critical temperature –as well as the order parameter and its fluctuations – evolves with size as a power law. As expected, we determined that the transition again belongs to the three-dimensional Ising universality class. Furthermore, since only one energy scale is present in this model (see Eq. (2)), the vs. phase diagram shown in Fig. 8 does not depend on .
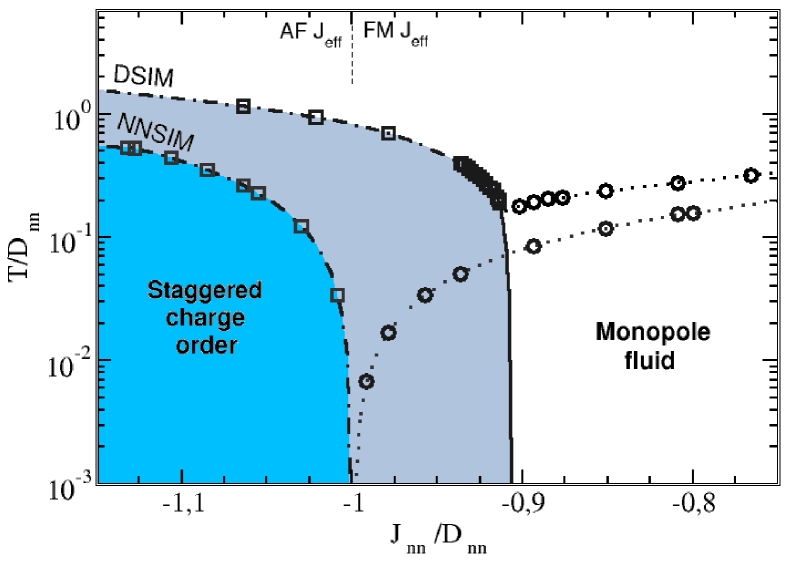
The dependence of the critical temperature on the relative strength of the exchange and dipolar interactions has already been explored for the DSIM den Hertog and Gingras (2000); Melko and Gingras (2004). In order to explicitly show the effect of dipolar interactions, we now present our version of the vs. phase diagram for both the DSIM and the NNSIM (Fig. 9). The first thing we note is that in the DSIM the staggered charge fluid extends to a region with small but ferromagnetic (or, equivalently, ); this does not happen in the NNSIM. This can be easily understood within the monopole picture: in the same way as neutral atoms of Na and Cl ionize to form NaCl, the energy spent in the creation of the monopoles can be compensated by the attraction between them. As a matter of fact, comparing the Madelung energy of a zinc-blende lattice of oppositely charged double monopoles and the energy needed to create these charges out of the vacuum Castelnovo et al. (2008) results in a zero-temperature limiting value of Brooks-Bartlett et al. (2014), which is reasonably close –within the monopole picture approximation– to the value found by us (Fig. 9) and Ref. Melko and Gingras, 2004 –both in spin systems. This quantitative agreement provides additional support for the monopole picture of spin ice.
IV Role of the spin degrees of freedom
IV.1 Charge interactions vs. correlations
The strength of the monopole picture, that allows not only a qualitative but also a quantitative understanding of the phase diagram, seems at first sight to be weakened by a plain fact: no Coulomb attraction between oppositely charged monopoles is expected in the NNSIM (note that we continue calling the excitations “monopoles” despite the fact that they have lost their main quality as charges). While it is simple to understand why the spins would order in the alternating “all-in–all-out” configuration when only a negative nearest-neighbours interaction is considered (Fig. 9), it is much harder to rationalise, limiting ourselves to the monopole picture, why non-attracting monopoles would experience any sort of staggered ordering.
This simple puzzle can be solved by taking into account the correlations between monopoles, which transcend any Coulomb-like interactions. It is not energetic disfavour, but construction constraints that prevent more than one double charge in a single diamond site. In the same way, the underlying spin configuration (“all-in” or “all-out”) forbids two double monopoles with the same double charge to be placed in adjacent tetrahedra. A similar reason makes more probable to find single monopoles with the opposite charge around any double monopole. Provided there are enough double charges in a diamond lattice, this correlation –quite equivalent to an infinite repulsion between double charges of the same sign at nearest neighbour sites– will induce staggered ordering on the system, irrespective of the system temperature.
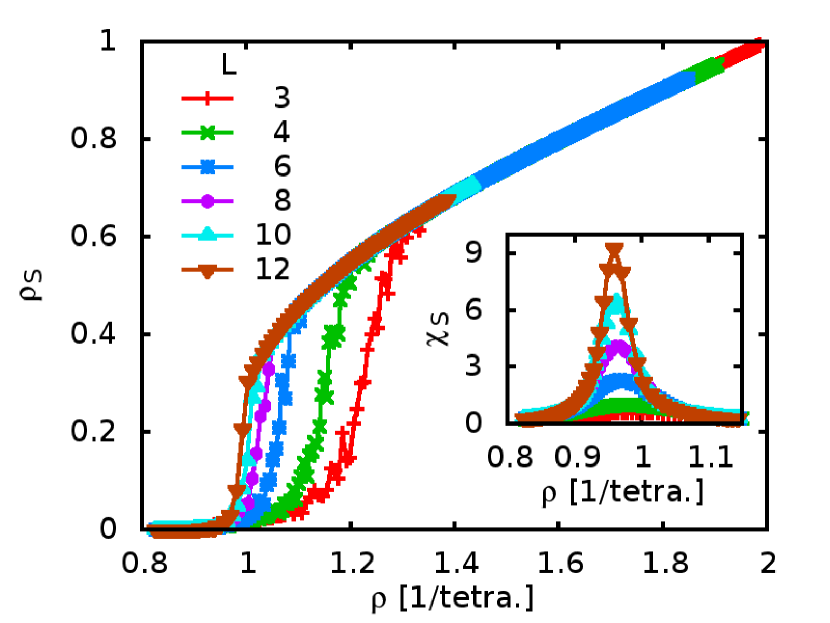
In order to test this point quantitatively, we have simulated a system of nominal “plus” and “minus” hard spheres in the diamond lattice within the Grand Canonical Ensemble. In analogy to the NNSIM, we included no interactions between spheres, but a constraint was imposed forbbiding two like spheres to be placed in neighbouring sites. Figure 10 shows the staggered charge density for the spheres as a function of total average sphere density 222In order to make a closer analogy between the hard spheres and the double charges, we have given each sphere a value of in number, thus reaching a saturation value for the density of . , for different system sizes –a cubic unit cell of side is again implied. The sudden increase in reflects the charge-like order being stabilised in the system as a consequence of sphere correlations. A previously known example of this kind of symmetry breaking in hard-sphere systems can be found in binary mixtures with a radius ratio of and , where () is the radius of the small (large) spheres. Driven by differential excluded volume effects, these systems present and structures, respectively Kummerfeld and Hudson and Harrowell (2008); Filion and Dijkstra (2009), in which every particle is surrounded only by particles, and vice versa, resembling the staggered ordering of our non-interacting double “monopoles”.
Once more, finite size scaling of the order parameter and its fluctuations (Fig. 10, inset) allowed us to identify the three dimensional Ising universality class. The extrapolated critical density is near the critical value found for in Fig. 8 for the NNSIM. The differences between these two critical monopole concentrations can be explained realising that our simple sphere model does not consider single monopoles, which add extra charge with smaller correlations. Considering then that even the NNSIM involves an effective contact interaction between monopoles, we can now understand the independence of with temperature observed in Fig. 8 as a result of a construction constraint.
This reasoning gains in depth when we contemplate its implications to the dipolar model studied before. While the low temperature region of the phase diagram in Fig. 6 is, as discussed, obviously dominated by the Coulomb attraction between monopoles, the ordered phase seen for at high monopole density can now be trivially explained in terms of the aforementioned charge correlations. Indeed, the vertical asymptote we noticed in Fig. 6 shows the equivalence between the DSIM and NNSIM in the limit of high .
As mentioned, correlations beyond charge interactions are much smaller for single charges. Indeed, using our conserved-monopole algorithm Borzi et al. (2013) for nearest neighbours spin interactions we have proved that a system of single monopoles remains charge-disordered, even in the limit of . This explains the observation of a high temperature limit for the stability of the fluid of single monopoles observed in Ref. Borzi et al., 2013.
IV.2 Discussion: re-entrance near the tri-critical point
Figure 6 suggest the re-entrance of the charge-disordered phase near the dome. Indeed, we have observed that this behaviour persists for bigger lattices, of which we have explored up to . Though not in a conclusive way, this suggests that this behaviour is not the mere consequence of the tri-critical fluctuations. As in the previous discussion, we propose an explanation for the re-entrant behaviour –which is not observed in the Blume-Emery-Griffiths model Blume et al. (1971) nor in lattice models of real charges Dickman and Stell (1999); Kobelev et al. (2002) nor in the CDSIM Borzi et al. (2013)– which transcends the mere charge-like degrees of freedom.
A clue of the entropic origin of the re-entrance can be obtained by noticing that the charge-ordered phase extends its region of stability on increasing temperature, reaching lower densities. We have checked that along the transition line the reduction in is related with an increase in the number of empty (“2-in/2-out”) tetrahedra, while keeping an approximately constant concentration of single-charge monopoles. This mechanism, which necessarily decreases the number of double-defects, is very efficient in increasing the entropy of the system. This entropic contribution –which can be related to internal degrees of freedom of the charges– can outweigh the expected decrease in energy, reducing the free energy of the staggered phase. The balance is no longer possible for low enough densities, and the previously observed charge-like behaviour Dickman and Stell (1999); Kobelev et al. (2002); Borzi et al. (2013) is recovered, with increasing with temperature.
IV.3 Charge order with spin disorder: best chance within an Ising pyrochlore material
We have already mentioned the impossibility of stabilising in a real Ising pyrochlore material a perfect single-monopole crystal at zero magnetic field. As stated in Ref. Brooks-Bartlett et al., 2014, such a crystal would imply the existence of charge order coexisting with a Coulomb phase. We believe that the staggered charge-ordered phase near the re-entrant region is the closest we can get in this system to this situation. At and (see Fig. 1 for a snapshot of a part of the system at these values) almost of the diamond lattice sites are occupied by single-defects, while only are double monopoles. This leftmost transition point, in which the staggered charge-order is impending, is quantitatively compatible with the phase diagram obtained for the CDSIM (since only single charges are allowed in this model, a double monopole in the DSIM must be equated to a single monopole in the CDSIM, then the total density in the first model corresponds to in the latter). Indeed, Fig. 4 in Ref. Borzi et al., 2013 shows that for occupation staggered order is established near , plainly consistent with the value we find for the unrestricted DSIM. This coincidence implies that double monopoles for this level of dilution contribute to the staggered-charge order similarly to single monopoles. An important consequence of this fact is that a neutron scattering measurement of an Ising pyrochlore material with at (so as to have inside the ordered phase, but with a significant fraction of single-charged monopoles) should give a structure factor quite similar to that simulated in Fig. 4 of Ref. Brooks-Bartlett et al., 2014. This pattern shows signs of spin fragmentation, combining Bragg peaks from an “all-in–all-out” structure with the pinch points which characterise the underlying Coulomb phase.
V Conclusions
The path we have taken in this work has been two-fold. Firstly, we have shown how the monopole picture arises naturally as a tool to reinterpret and understand the physics of dipolar Ising pyrochlore systems, encompassing both spin ice and antiferromagnetic materials. The magnetic phase diagram for classical Ising pyrochlores calculated by den Hertog and collaborators den Hertog and Gingras (2000), separating the “all-in–all-out” antiferromagnet from the spin ice systems in terms of the effective exchange constant values, has been recast into temperature vs. density, in analogy to the phase diagrams in molecular systems. Notably, in spite of its underlying spin nature and the presence of four types of different non-conserved magnetic charges (plus and minus, single and double), the dipolar model gives rise to a phase diagram which is quite comparable with those previously obtained for on-lattice systems of electric charges Dickman and Stell (1999), and on spin ice models with conserved number of single magnetic charges Borzi et al. (2013). Thinking just on monopoles and their interactions made it simple to justify quantitatively the extent to which the antiferromagnetic phase gets into the region of ferromagnetic first neighbours effective exchange interaction, by evaluating the Madelung energy of a double monopole crystal. This plainly exemplifies how the power of the picture does not limit itself to the qualitative understanding of the phases present. Within the nearest-neighbours model, the stabilisation of the antiferromagnetic phase was interpreted within the monopole picture in terms of the proliferation of monopoles with no Coulomb interactions but which implicitly force a nearest-neighbour exclusion condition between like types. This exclusion condition mimics an attraction/repulsion between like/different charges, maintaining the idea of monopole as a useful concept even within the NNSIM.
We also encountered certain aspects on the phase diagrams which cannot be explained in terms of simple charges. Like the discovery of internal degrees of freedom in particles previously thought as indivisible building blocks, these findings are far from making the monopole picture less interesting. Among these peculiarities we found a re-entrance of the disordered fluid, and a staggered charge-ordered fluid phase which –for high enough densities– can be stable at temperatures arbitrarily much higher than the energy scale characterising charge interactions. This second fact could be understood in terms of construction constraints –the exclusion condition we referred to in the previous paragraph– inherent to the spin nature of the excitations. The local constraint (as opposed to Coulomb-like monopole attraction) is the predominant correlation mechanism between monopoles at high temperatures and high monopole density, and the only interaction for the NNSIM. We explained the re-entrance noticing that lowering the density of double charges induces a reduction in the energy, but a boost in this energy’s degeneracy. A final remark is the identification near the re-entrance of a good candidate for a state where charge order can coexist with a Coulomb phase Brooks-Bartlett et al. (2014) (an Ising pyrochlore material with , at ). The scattering pattern of this state should show signs of spin fragmentation, combining Bragg peaks from an “all-in–all-out” structure with the pinch points which characterise the underlying Coulomb phase Brooks-Bartlett et al. (2014).
Acknowledgements.
We thank T. S. Grigera for helpful discussions. This work was supported by Consejo Nacional de Investigaciones Científicas y Técnicas (CONICET) and Agencia Nacional de Promoción Científica y Tecnológica (ANPCyT), Argentina.References
- Anderson (1997) P. Anderson, Concepts in Solids: Lectures on the Theory of Solid, World Scientific Lecture Notes in Physics (World Scientific, 1997).
- Khomskii (2010) D. Khomskii, Basic Aspects of the Quantum Theory of Solids: Order and Elementary Excitations (Cambridge University Press, 2010).
- Steglich et al. (1979) F. Steglich, J. Aarts, C. D. Bredl, W. Lieke, D. Meschede, W. Franz, and H. Schäfer, Phys. Rev. Lett. 43, 1892 (1979).
- Castelnovo et al. (2008) C. Castelnovo, R. Moessner, and S. L. Sondhi, Nature 451, 42 (2008).
- Morris et al. (2009) D. J. P. Morris, D. A. Tennant, S. A. Grigera, B. Klemke, C. Castelnovo, R. Moessner, C. Czternasty, M. Meissner, K. C. Rule, J. U. Hoffmann, K. Kiefer, S. Gerischer, D. Slobinsky, and R. S. Perry, Science 326, 411 (2009).
- Kadowaki et al. (2009) H. Kadowaki, N. Doi, Y. Aoki, Y. Tabata, T. J. Sato, J. W. Lynn, K. Matsuhira, and Z. Hiroi, J. Phys. Soc. Jpn. 78, 103706 (2009).
- Fennell et al. (2009) T. Fennell, P. P. Deen, A. R. Wildes, K. Schmalzl, D. Prabhakaran, A. T. Boothroyd, R. J. Aldus, D. F. McMorrow, and S. T. Bramwell, Science 326, 415 (2009).
- Ryzhkin (2005) I. Ryzhkin, Journal of Experimental and Theoretical Physics 101, 481 (2005).
- Jaubert and Holdsworth (2009) L. D. C. Jaubert and P. C. W. Holdsworth, Nat. Phys. 5, 258 (2009).
- Slobinsky et al. (2010) D. Slobinsky, C. Castelnovo, R. A. Borzi, A. S. Gibbs, A. P. Mackenzie, R. Moessner, and S. A. Grigera, Phys. Rev. Lett. 105, 267205 (2010).
- Klemke et al. (2011) B. Klemke, M. Meissner, P. Strehlow, K. Kiefer, S. A. Grigera, and D. A. Tennant, J. Low Temp. Phys. 163, 345 (2011).
- Petrenko et al. (2011) O. A. Petrenko, M. R. Lees, and G. Balakrishnan, J. Phys. Condens. Matter 23, 164218 (2011).
- Jaubert and Holdsworth (2011) L. D. C. Jaubert and P. C. W. Holdsworth, J. Phys. Condens. Matter 23, 164222 (2011).
- Castelnovo et al. (2011) C. Castelnovo, R. Moessner, and S. L. Sondhi, Phys. Rev. B 84, 144435 (2011).
- Sen and Moessner (2014) A. Sen and R. Moessner, (2014), arXiv:1405.0668 .
- Bramwell and Gingras (2001) S. T. Bramwell and M. J. P. Gingras, Science 294, 1495 (2001).
- Bernal and Fowler (1933) J. D. Bernal and R. H. Fowler, J. Chem. Phys. 1, 515 (1933).
- Henley (2010) C. L. Henley, Annu. Rev. Condens. Matter Phys. 1, 179 (2010).
- Matsuhira et al. (2009) K. Matsuhira, C. Sekine, C. Paulsen, M. Wakeshima, Y. Hinatsu, T. Kitazawa, Y. Kiuchi, Z. Hiroi, and S. Takagi, Journal of Physics: Conference Series 145, 012031 (2009).
- Zhou et al. (2011) H. D. Zhou, S. T. Bramwell, J. G. Cheng, C. R. Wiebe, G. Li, L. Balicas, J. a. Bloxsom, H. J. Silverstein, J. S. Zhou, J. B. Goodenough, and J. S. Gardner, Nat. Commun. 2, 478 (2011).
- Zhou et al. (2012) H. D. Zhou, J. G. Cheng, A. M. Hallas, C. R. Wiebe, G. Li, L. Balicas, J. S. Zhou, J. B. Goodenough, J. S. Gardner, and E. S. Choi, Phys. Rev. Lett. 108, 207206 (2012).
- Borzi et al. (2013) R. A. Borzi, D. Slobinsky, and S. A. Grigera, Phys. Rev. Lett. 111, 147204 (2013).
- Brooks-Bartlett et al. (2014) M. E. Brooks-Bartlett, S. T. Banks, L. D. C. Jaubert, A. Harman-Clarke, and P. C. W. Holdsworth, Phys. Rev. X 4, 011007 (2014).
- den Hertog and Gingras (2000) B. C. den Hertog and M. J. P. Gingras, Phys. Rev. Lett. 84, 3430 (2000).
- Melko and Gingras (2004) R. G. Melko and M. J. P. Gingras, J. Phys. Condens. Matter 16, R1277 (2004).
- Blume et al. (1971) M. Blume, V. J. Emery, and R. B. Griffiths, Phys. Rev. A 4, 1071 (1971).
- Huang (1987) K. Huang, Statistical Mechanics (John Wiley & sons, 1987).
- Note (1) It should be stressed that the right part of this diagram corresponds to a single phase. The use of different names for two regions of it –which follows Ref. \rev@citealpnumBorzi2013– does not imply that a different symmetry is broken, but intends to emphasise their distinct dynamical properties and the fact that, while the double monopole crystal may coexist with a low density charge-disordered fluid, the staggered charge fluid (composed of both single and double monopoles) is homogeneous and occupies the whole space.
- Dickman and Stell (1999) R. Dickman and G. Stell, AIP Conf. Proc. 492 (1999).
- Note (2) In order to make a closer analogy between the hard spheres and the double charges, we have given each sphere a value of in number, thus reaching a saturation value for the density of .
- Kummerfeld and Hudson and Harrowell (2008) J. K. Kummerfeld, T. S. Hudson, and P. Harrowell, J. Phys. Chem. B 112, 10773-10776 (2008).
- Filion and Dijkstra (2009) L. Filion and M. Dijkstra, Phys. Rev. E 79, 046714 (2009).
- Kobelev et al. (2002) V. Kobelev, A. B. Kolomeisky, and M. E. Fisher, J. Chem. Phys. 116, 7589 (2002).