Galaxy cosmological mass function
Abstract
Aims. This paper studies the galaxy cosmological mass function (GCMF) in a semi-empirical relativistic approach that uses observational data provided by recent galaxy redshift surveys.
Methods. Starting from a previously presented relation between the mass-to-light ratio, the selection function obtained from the luminosity function (LF) data and the luminosity density, the average luminosity , and the average galactic mass were computed in terms of the redshift. was also alternatively estimated by means of a method that uses the galaxy stellar mass function (GSMF). Comparison of these two forms of deriving the average galactic mass allowed us to infer a possible bias introduced by the selection criteria of the survey. We used the FORS Deep Field galaxy survey sample of 5558 galaxies in the redshift range and its LF Schechter parameters in the B-band, as well as this sample’s stellar mass-to-light ratio and its GSMF data.
Results. Assuming as the local value of the average galactic mass, the LF approach results in and . However, using the GSMF results to calculate the average galactic mass produces . We chose the latter result because it is less biased. We then obtained the theoretical quantities of interest, such as the differential number counts, to finally calculate the GCMF, which can be fitted by a Schechter function, but whose fitted parameter values are different from the values found in the literature for the GSMF.
Conclusions. This GCMF behavior follows the theoretical predictions from the cold dark matter models in which the less massive objects form first, followed later by more massive ones. In the range the GCMF has a strong variation that can be interpreted as a higher rate of galaxy mergers or as a strong evolution in the star formation history of these galaxies.
Key Words.:
galaxies: luminosity function, mass function — cosmology: theory, observations1 Introduction
The galaxy cosmological mass function (GCMF) is a quantity defined in the framework of relativistic cosmology that measures the distribution of galactic masses in a given volume within a certain redshift range of an evolving universe defined by a spacetime geometry. This is, nevertheless, a generic definition that can be turned into an operational one by following the approach advanced by Ribeiro & Stoeger (2003; hereafter RS03), which connects the mass-energy density given by the right-hand side of Einstein field equations, and the associated theoretically derived galaxy number counts, with the astronomically determined luminosity function and mass-to-light ratio. In this way, the GCMF contains information about the number density evolution of all galaxies at a certain , as well as their average mass in that redshift. Therefore, provides the number density of galaxies with mass in the range , . Since is the average mass at a specific redshift value, the quantity is given in the redshift range , .
In the astrophysical literature one can a find a quantity bearing similarities to the GCMF, the galaxy stellar mass function (GSMF), which describes the number density of galaxies per logarithmic stellar mass interval. It can be computed using the galaxy stellar masses obtained from galactic luminosities (e.g., Larson & Tinsley 1978; Jablonka & Arimoto 1992; Bell & de Jong 2001; Kauffmann et al. 2003; Panter et al. 2004; Gallazzi et al. 2005; McLure et al. 2009; Mortlock et al. 2011). The observed GSMF is well fit by a simple or double Schechter function (Baldry et al. 2008, 2012; Bolzonella et al. 2010; Pozzetti et al. 2010) down to low mass limits (), and its analysis can be separated into more massive galaxies, , and less massive ones. Although the GSMF is a well-established tool to study galaxy evolution, our aim here is to develop a methodology capable of estimating the GCMF using observational data, since the GCMF itself is a derived quantity and is therefore directly linked to the underlying cosmological theory. The study of this function could provide some insights about how, or even if, effects of relativistic nature can affect the mass evolution analysis.
The GCMF can be seen as an application of the general model connecting cosmology theory to the astronomical data, introduced by RS03, and further developed by Albani et al. (2007; hereafter A07) and Iribarrem et al. (2012; hereafter Ir12). These authors aimed at providing a relativistic connection for the observed number counts data produced by observers and studying its relativistic dynamics. In this paper we extend both goals to the mass function of galaxies. This theoretical connection allows us to study these quantities in other spacetime geometries than Friedmann-Lemaître-Robertson-Walker (FLRW), as we intend to do in the future, and then trying to ascertain to what extent the underlying choice of spacetime geometry affects these quantities, that is, to what extent galaxy evolution might be affected by the spacetime geometry. Here we analyze the mass function for the average galactic mass at some redshift interval and provide an illustration of our methodology by means of deep galaxy redshift survey data. We use available observations of the galaxy luminosity function (LF), luminosity density, and stellar masses to estimate the redshift evolution of the average galactic mass and luminosity. These two pieces of information are crucial to our analysis because they cannot be obtained through cosmological principles, but have direct implications for a range of theoretical considerations and the determination of an important quantity, the differential number counts of galaxies. With the redshift evolution of and the equations presented in RS03 we can obtain the GCMF.
We used the LF parameters of the FORS Deep Field (FDF) galaxy survey presented by Gabasch et al. (2004; hereafter G04) in the B band and redshift range to calculate the selection function and the luminosity density , to then obtain the average luminosity evolution, . Next we computed the galaxy stellar mass-to-light ratio using the galaxy stellar masses presented by Drory et al. (2005). These two results lead to a redshift evolution of the average galactic mass. Alternatively, we estimated using the ratio between the stellar mass density and number density, both quantities derived from the GSMF presented by Drory & Alvarez (2008) for the same FDF sample of galaxies. A comparison between these two methodologies to calculate enables us to discuss the intrinsic biases introduced by , and the mass-to-light ratio in the calculation of the average galactic mass. The next step was to calculate and the theoretical quantities of interest, such as the cumulative number counts and the differential number counts . Finally, the GCMF was computed assuming a comoving volume, which allowed us to compare its results with predictions from galaxy evolution models found in the literature.
The plan of the paper is as follows: §2 presents the relevant theoretical concepts to the analysis, §3 discusses the LF, selection function, and luminosity density, and the general features of the FDF survey. §4 summarizes the semi-empirical relativistic approach to obtain a GCMF, along with our results, and §5 presents our conclusions. Here we adopted an FLRW cosmology with the following parameter values: , , .
2 Theoretical framework
We begin by assuming the spherically symmetric FLRW cosmology given by the following line element,
| (1) |
where is the time coordinate and are the spatial coordinates, is the cosmic scale factor, is the curvature parameter (), and is the light speed. The Einstein field equation with this line element yields the Friedmann equation, which, if the cosmological constant is included, may be written (e.g. Roos 1994)
| (2) |
where is the gravitational constant, is the matter density, and the Hubble parameter can be defined as
| (3) |
in which is the scale factor at the present time, and is the Hubble constant. Note that the index zero is used to indicate quantities at the present time. Following Ir12, who used the law of conservation of energy in the matter-dominated era and the past radial null geodesic, we find a first-order ordinary differential equation for the scale factor in terms of the radial coordinate ,
| (4) |
where
| (5) |
in which the critical density at the present time given by
| (6) |
and the vacuum energy density in terms of the cosmological constant is
| (7) |
Notice that since is a constant, then . To find numerical solutions for we adopt and the cosmological parameters , and km s-1Mpc-1. We also used the fourth-order Runge-Kutta method with the initial condition set to zero.
2.1 Distances and volumes
The area distance , also known as angular diameter distance, is defined by a relation between the intrinsically measured cross-sectional area element of the source and the observed solid angle (Ellis 1971, 2007; Plebánski & Krasiński 2006),
| (8) |
The luminosity distance , which is defined as a relation between the observed flux and the intrinsic luminosity of a source, can be easily obtained from , Eq. (8), by invoking the Etherington reciprocity law (Etherington 1933; Ellis 1971, 2007),
| (9) |
resulting in
| (10) |
The observations are usually obtained assuming a comoving volume , but the theory often assumes a proper volume . From metric (1) the conversion of volume units can be given by
| (11) |
Hence, the relation between and , which are the number densities of cosmological sources respectively given in terms of comoving volume and proper volume, can be written as
| (12) |
2.2 Differential number counts
The general, cosmological model-independent, relativistic expression for the number counts of cosmological sources in a volume section at a point down the null cone, and considering that both source and observer are comoving, is given by Ellis (1971). This general expression was specialized to the FLRW cosmology by Ir12, yielding the following expression:
| (13) |
where is the number density of sources per unit of proper volume in a section of a bundle of light rays converging toward the observer and subtending a solid angle at the observer’s position. It can be related to the matter density and the average galactic mass by means of
| (14) |
If we use the law of conservation of energy applied to the zero pressure in the matter-dominated era, Eq. (14) becomes
| (15) |
Considering , Eqs. (8) and (15), we can rewrite Eq. (2) at present time as follows:
| (16) |
and Eq. (13) as
| (17) |
The redshift can be written as
| (18) |
where a numerical solution of the scale factor immediately gives us a numerical solution for . In this way, we can obtain the differential number counts by means of the following expression:
| (19) |
These derivatives can be taken from Eqs. (4), (17), and (18), enabling us to write
| (20) | |||||
3 Galaxy luminosity function and stellar mass function
The galaxy LF gives the number density of galaxies with luminosity at redshift . In the Schechter (1976) analytical form it is written as,
| (21) |
where , is the observed luminosity, is the luminosity scale parameter, is the normalization parameter, and is the faint-end slope parameter. These parameters are determined by careful analysis of data from galaxy redshift surveys. The selection function in a given waveband above the lower luminosity threshold is written as
| (22) |
where
| (23) |
| (24) |
Here is the absolute magnitude scale parameter (it is connected to ), is the luminosity distance, is the limiting apparent magnitude of the survey, and is the reddening correction.
The luminosity density provides an estimate of the total amount of light emitted by galaxies per unit volume in a given band. It can be obtained from the following integral of the observed LF in a given band:
| (25) |
where is the incomplete gamma integral such that .
Similarly to the LF, the GSMF can be written in a Schechter form,
| (26) |
where is the GSMF normalization parameter, is the faint-end slope and is the characteristic mass that separates the exponential part of the function, dominant at high masses, and the power-law part, important at low masses. The GSMF can also be represented by a double-Schechter function that includes a second power-law. Here we only use the simple Schechter function.
From the GSMF, two other quantities can be defined, the stellar mass density,
| (27) |
and the number density of galaxies
| (28) |
for galaxy stellar masses above a given . This lower mass limit is uncertain and related to the magnitude limit of the survey, which in itself depends on the redshift, just as the lower luminosity was used to calculate the luminosity and number density from the LF. However, for our purposes here, to avoid a bias caused by selection effects introduced by the limits of the survey, we derived the total number and mass densities extrapolating the integrals above to the lower masses, independently of the redshift. The choice of is addressed in the next sections.
3.1 FORS Deep Field Galaxy Survey dataset
The FDF is a multicolor photometric and spectroscopic survey of a region near the south galactic pole. According to G04, the sample is composed of 5558 galaxies selected in the I band and photometrically measured to an apparent magnitude limit of . The absolute magnitude of each galaxy in the sample was computed by G04 using the best-fitting spectral energy distribution (SED) given by the photometric redshift convolved with the appropriate filter function and K-correction. The stellar mass-to-light ratios for the galaxies in the catalog were estimated with a log-likelihood-based SED-fitting technique, using a library of SEDs built with the stellar population evolution model given by Bruzual & Charlot (2003) and a Salpeter (1955) initial mass function. These data were obtained via private communication with Niv Drory, and are based on the analysis described in Drory et al. (2005). Note that at might be overestimated because of less reliable information on the rest-frame optical colors at young mean ages.
The LF parameters derived from this sample for the B band by G04 are for the redshift range . The authors also proposed the following equations for the redshift evolution of these parameters:
| (29) | |||||
| (30) | |||||
| (31) |
The GSMF for the same FDF galaxy sample was calculated by Drory et al. (2005) and further analyzed by Drory & Alvarez (2008) in the context of the contribution of star formation and merging to galaxy evolution. These authors assumed the mass function to be of a simple Schechter form. For the present work, we used the table with the Schechter fit parameters from Drory & Alvarez (2008), which were obtained using the method in seven bins from to . It is interesting to note that the faint-end slope is constrained to the redshift range , where the authors considered the data to be deep enough and found it to be given by a constant, . Because the data do not allow to be constrained at higher redshifts, this value of the faint-end slope is extrapolated to .
4 The galaxy cosmological mass function
4.1 Average galactic mass
To discuss the semi-empirical relativistic approach to estimate the mass function, we start with the proposal of RS03 for an expression of the mass-to-luminosity ratio at a given redshift value,
| (32) |
From the observational point of view, LF catalogs only give us information about the stellar mass and stellar mass-to-light ratio of the galaxies. But, assuming that is proportional to , we can write the following expression,
| (33) |
Since we have for each galaxy in the FDF sample, we can calculate the average galaxy stellar mass-to-light ratio using a subsample of 201 galaxies per redshift bin. Next, we can employ Eq. (32) to estimate the average galaxy luminosity in a given passband,
| (34) |
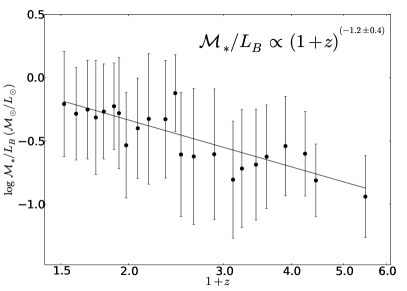
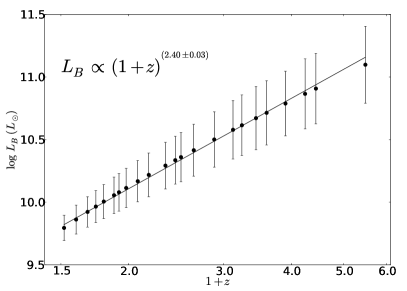
and use LF data from the FDF survey to ascertain the general behavior of the average luminosity in terms of the redshift. Fig. 1 shows the results of the average galaxy stellar mass-to-light ratio and the average luminosity in the B band. Both quantities can be fitted by power-law relations, and the results are as follows:
| (35) | |||
| (36) |
The error bars for were obtained by Monte Carlo simulations. Hence, Eq. (33) allows us to estimate the average galactic mass from observations. The result is as follows:
| (37) |
This expression entails that in general the total galactic mass follows its luminous mass evolution, that is, more dark matter implies more stars when one considers galaxies as a whole and not regions of galaxies, for example, extended dark matter halos. We are aware that the previous assumption seems to be reasonable for early-type galaxies, that is, for ellipticals and lenticulars (e.g., Magain & Chantry 2013), but it contrasts with rotation curves from spirals. Because our data do not have any morphological classification, the present approach is suitable to our sample.
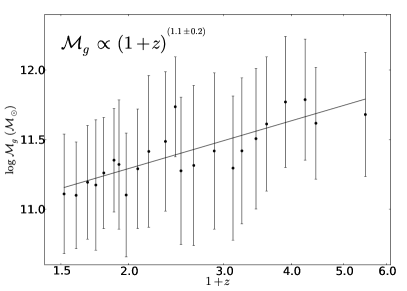
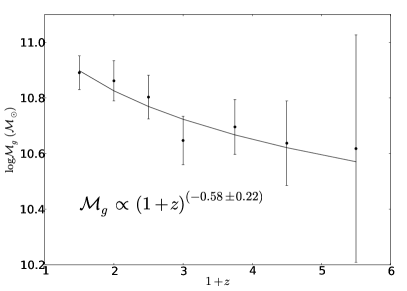
We emphasize that the derived from depends on the variation in the spectral type of the galaxy: early-type galaxies have more tightly constrained masses than late-type galaxies. This means that the resulting may present a large dispersion due to the lack of morphological classification in our sample. However, at high the uncertainty in increases because objects drop out in the blue bands and stellar populations become younger. The behavior of can be seen in Fig. 2, in which the simplest description is as a single power-law, given by
| (38) |
where is the assumed local value of the average galactic mass (Sparke & Gallagher 2000). Nevertheless, other interpretations than a single power-law are possible because of the large dispersion in .
The average galactic mass can also be derived by following the alternative approach of using quantities derived from the GSMF, and , which yield the average galactic stellar mass .111We are grateful to the referee for suggesting this procedure. Still under the assumption that the total galactic mass evolves as the luminous mass, one may write the following expression,
| (39) |
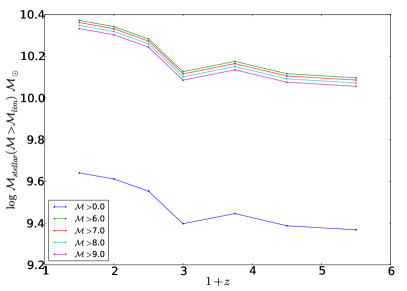
As these quantities depend on the lower mass limit used in the integration of Eqs. (27) and (28), we tested different values for to check the possible influence of this limit in our results. The results are presented in Fig. 3 and clearly show that the various values for will only affect the amplitude of , but not its general behavior. Our goal is to obtain a general form for the average galactic mass, hence assuming that the mass evolves as a power-law we can freely choose a lower mass limit in our calculations. We adopted and to carry out our power-law fitting. The results are shown in Fig. 4 and the fitted expression is written as
| (40) |
Comparing this expression with Eq. (38) shows that the two methodologies discussed produce different results when they are employed to calculate the average galactic mass in terms of the redshift. This is due to the survey limits, since the former method explicitly depends on these limits, as can be seen in the definition of the selection function and the luminosity density, respectively given by Eqs. (22) and (25). Moreover, the average mass-to-light ratio can also introduce a bias because one cannot distinguish the changes in as being due to either real changes of the stellar population with redshift or due to the fact that brighter objects are selected as having different values. The stellar mass data were obtained with the latter metthod, using the SED fitting, which used a large range of wavelength observations, and therefore produced less biased results than the former. This is expected to make the second method more reliable, and we therefore use Eq. (40) from this point on.
The negative power index in Eq. (40) indicates a growth in mass from high to low redshift values. Indeed, from this equation we can see that galaxies at had on average from 25% to 50% of their present masses at . This growth might be caused by the galaxy mergers within the FDF redshift range, by the star formation history itself, or even by a combination of these two effects. However, one cannot separate these two mechanisms using stellar mass data.
Finally, we stress that Fig. 4 shows the redshift evolution of based on the FDF survey. Nevertheless, results obtained by means of data from a single survey are uncertain and, therefore, a more robust estimate requires data from different surveys. We intent to do so in forthcoming papers.
4.2 Observational quantities
The differential number counts in the expression (20) is directly linked to the underlying cosmological model, since this is a theoretical quantity given by relativistic cosmology. Therefore, we need to write in terms of observational quantities, which can be achieved by using the methodology developed by RS03, and further extended in A07 and Ir12, which connects this theoretical quantity to the LF. The link between relativistic cosmology theory and observationally determined LF is achieved by using the consistency function , which represents the undetected fraction of galaxy counts in relation to the one predicted by theory as follows:
| (41) |
Here the observed differential number counts is the key quantity for our analysis because other quantities require its previous knowledge.
From expressions (12) and (13), we obtain
| (42) |
Then, to derive we need the observational counterpart of , which is, according to its definition, the selection function . Therefore,
| (43) |
The substitution of Eqs. (42) and (43) into Eq. (41) yields
| (44) |
For our purposes it is more convenient to express the number counts in terms of the redshift,
| (45) |
and considering Eq. (44), it can be rewritten as
| (46) |
where the two volume definitions appear in the expression above because the relativistic number counts are originally defined in a proper volume, therefore one requires a suitable volume transformation. , , , and are theoretical quantities obtained from the underlying spacetime geometry and, hence, they need to be determined in the chosen cosmological model so that we can obtain the observational differential number counts of Eq. (46). The only nontheoretical quantity in this equation is the selection function. In addition, as already discussed in A07 and Ir12, if we substitute Eqs. (15) and (20) into Eq. (46), the term cancels out and renders mass independent on first order.
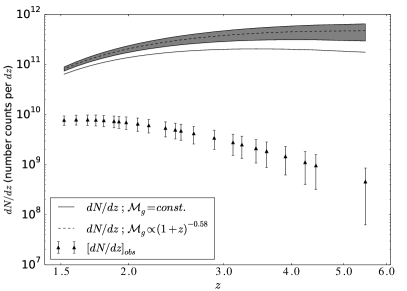
Now, considering Eq. (40) we assume two possible cases for the average galactic mass: for all redshift ranges and . Substituting both cases in Eq. (20), we can see the implication on the differential number counts of an evolving average galactic mass. Fig. 5 shows the behavior of the theoretical differential number counts using a constant and evolving , as well the values of . The change from constant to evolving does not affect the general behavior of in a significant way. Therefore, assuming a constant value for , as was done in RS03, A07, and Ir12, can be considered as a very reasonable analytical simplification of the problem and, hence, the conclusions reached by these authors hold in general, at least as far as the FDF survey is concerned.
4.3 The cosmological mass function of galaxies
As stated above, the GCMF contains information about the galactic number density at a certain redshift in terms of the average galactic mass . It can be defined as follows:
| (47) |
Here we followed the standard practice in GSMF calculations of writing the galaxy mass function in terms of logarithmic mass and the comoving volume in which the GCMF is derived, since it is now standard practice to calculate in terms of .
Substituting Eq. (45) into Eq. (47), we can write the following expression
| (48) |
Then, we can also define
| (49) |
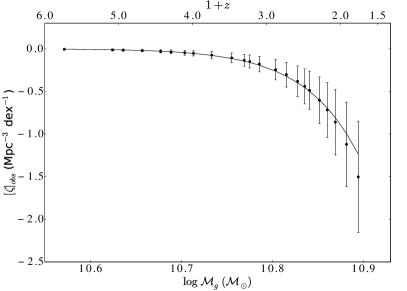
Fig. 6 shows the relationship between the GCMF and , as well as its redshift dependence. We note that the GCMF is negative, which is not caused by a logarithmic effect, but a consequence of the method used to infer . Thus, the number density of galaxies whose masses lie in the range , at the redshift range , is given by , and not simply by the function .
The GCMF vs. data can be fitted by a Schechter function of the form given by Eq. (26). The best-fit parameters are
| (50) | |||||
| (51) | |||||
| (52) |
Although functionally similar to the GSMF, was derived using a different methodology and, therefore, it is not directly comparable with the GSMF mass function found in the literature. Hence, the Schechter parameters from both functions are, in principle, unrelated. In addition, a direct comparison with the GSMF (e.g., Drory et al. 2004, 2005; Bundy et al. 2006; Pozzetti et al. 2007) is not possible because we analyze the average mass where we cannot see this differential behavior for the different bins of mass, this being a standard approach used to study the galaxy stellar masses. However, we intend to extend our analysis to use different bins of mass and include the study of the barionic matter evolution instead of only using the stellar mass.
The result obtained for the GCMF suggests that on average galaxies were less massive in the past than in the present, a behavior that agrees with predictions from the “bottom-up” (small objects form first) assembly of dark matter structures in cold dark matter models. We also note that there is a strong variation on the GCMF in the range , which can be interpreted as being a result of galaxy mergers or the evolution of the galaxy star formation history itself, as mentioned above.
As last remarks, we recall the limitations of the sample used and that the lack of morphological classification might imply that two or more different types of galaxies may cause different effects in the GCMF. Therefore, more analyses with different datasets need to be made.
5 Conclusion
We discussed a semi-empirical relativistic approach capable of calculating the observational galaxy cosmological mass function (GCMF) in a relativistic cosmology framework. The methodology consists of employing the luminosity function results obtained by G04 using the B-band FORS Deep Field galaxy survey data in the redshift range to calculate the selection function and luminosity density, which led us to conclude that the galaxy average luminosity in this sample behaves according to . From the stellar mass-to-light ratio of the same galaxy sample, we found that on average this quantity presents a power-law behavior, . These results led to a redshift evolution of the average galactic mass given by , that is, a power-law behavior with positive power index.
Alternatively, was also estimated by means of the galaxy stellar mass function (GSMF) data, which resulted in a power law with a negative power index, given by . We found the former approach less reliable because of its strong dependence on the selection function and luminosity density with the limit of the survey. This produced more strongly biased results, and we adopted the latter result in our calculations.
We then derived the theoretical quantities using the technique discussed in RS03, A07, and Ir12, which enabled us to compute the observational GCMF in the FLRW metric. We found that the GCMF decreases as the galactic average mass increases, this pattern is well fitted by a Schechter function with very different parameters values from the values found in literature for the GSMF. This general behavior seems to support the prediction of cold dark matter models in which the less massive objects are formed earlier. Moreover, in the range of the GCMF varies strongly, which might be interpreted to be a result of a high number of galaxy mergers in more recent epochs or as a strong evolution in the star formation history of these galaxies.
Acknowledgements.
We are grateful to N. Drory for kindly providing the necessary data to develop this work. A.R.L. and A.I. respectively acknowledge the financial support from the Brazilian agencies FAPERJ and CAPES. We are also grateful to very helpful suggestions made by the referee.References
- (1) Albani, V.V.L., Iribarrem, A.S., Ribeiro, M.B. & Stoeger, W.R. 2007, ApJ, 657, 760, arXiv:astro-ph/0611032 (A07)
- (2) Baldry, I.K., Driver, S.P., Loveday, J., Taylor, E.N., et al. 2012, MNRAS, 421, 621
- (3) Baldry, I.K., Glazebrook, K., Driver, S.P. 2008, MNRAS, 388, 945
- (4) Bell, E.F. & de Jong, R.S. 2001, ApJ, 550, 212
- (5) Bolzonella, M., Kovac, K., Pozzetti, L., et al. 2010, A&A, 524, A76+
- (6) Bruzual, G. & Charlot, S. 2003, MNRAS, 344, 1000
- (7) Bundy, K., et al. 2006, ApJ, 651, 120
- (8) Drory, N. & Alvarez, M. 2008, ApJ, 680, 41
- (9) Drory, N., et al. 2004, ApJ, 608, 742
- (10) Drory, N., et al. 2005, ApJ, 619, L131
- (11) Ellis, G. F. R. 1971, in General Relativity and Cosmology, ed. R.K. Sachs, Proc. Int. School Phys. Enrico Fermi (New York: Academic Press), reprinted in Gen. Rel. Grav., 41, 581, 2009
- (12) Ellis, G. F. R. 2007, Gen. Rel. Grav., 39, 1047
- (13) Etherington, I. M. H. 1933, Phil. Mag. ser. 7, 15, 761; reprinted in Gen. Rel. Grav. 39, 1055, 2007
- (14) Fontanot, F., et al. 2009, MNRAS, 397, 1776
- (15) Gabasch, A., et al. 2004, A&A, 421, 41 (G04)
- (16) Gallazzi, A., et al. 2005, MNRAS, 362, 41
- (17) Iribarrem, A.S., Lopes, A.R., Ribeiro, M.B. & Stoeger, W.R. 2012, A&A, 539, A112, arXiv:1201.5571 (Ir12)
- (18) Jablonka, J. & Arimoto, N. 1992, A&A, 255, 63
- (19) Kauffmann, G., et al. 2003, MNRAS, 341, 33
- (20) Larson, R.B. & Tinsley, B.M. 1978, ApJ, 219, 46
- (21) Lin, H., et al. 1999, ApJ, 518, 533
- (22) Magain, P. & Chantry, V. 2013, arXiv:1303.6896
- (23) McLure, R.J., et al. 2009, MNRAS, 395, 2196
- (24) Mortlock, A., et al. 2011, MNRAS, 413, 2845
- (25) Panter, B., Heavens, A.F., Jimenez, R. 2004, MNRAS, 355, 764
- (26) Plebánski, J. & Krasiński, A. 2006, An Introduction to General Relativity and Cosmology (Cambridge University Press)
- (27) Pozzetti, L., et al. 2007, A&A, 474, 443
- (28) Pozzetti, L., et al. 2010, A&A, 523, A13
- (29) Ribeiro, M.B. & Stoeger, W. R. 2003, ApJ, 592, 1, arXiv:astro-ph/0304094 (RS03)
- (30) Roos, M. 1994, Introduction to Cosmology (Chichester: Wiley)
- (31) Salpeter, E. E. 1955, ApJ, 121, 161
- (32) Schechter, P. 1976, ApJ, 203, 297