An Improved Determination of the Lithium Depletion Boundary Age of Blanco 1 and a First Look on the Effects of Magnetic Activity
Abstract
The Lithium Depletion Boundary (LDB) is a robust method for accurately determining the ages of young clusters, but most pre-main-sequence models used to derive LDB ages do not include the effects of magnetic activity on stellar properties. In light of this, we present results from our spectroscopic study of the very low-mass members of the southern open cluster Blanco 1 using the Gemini-North telescope, program IDs: GN-2009B-Q-53 and GN-2010B-Q-96. We obtained GMOS spectra at intermediate resolution for cluster candidate members with 13–20 mag. From our sample of 43 spectra, we find 14 probable cluster members by considering proximity to the cluster sequence in an color-magnitude diagram, agreement with the cluster’s systemic radial velocity, and magnetic activity as a youth indicator. We systematically analyze the and Li features and update the LDB age of Blanco 1 to be Myr. Our new LDB age for Blanco 1 shows remarkable coevality with the benchmark Pleiades open cluster. Using available empirical activity corrections, we investigate the effects of magnetic activity on the LDB age of Blanco 1. Accounting for activity, we infer a corrected LDB age of Myr. This work demonstrates the importance of accounting for magnetic activity on LDB inferred stellar ages, suggesting the need to re-investigate previous LDB age determinations.
1 Introduction
As low-mass stars () contract along the pre-main-sequence (PMS), their internal temperature rises. When the temperature of the stellar interior reaches K, lithium is destroyed by 7Li(He and 6Li(He proton capture reactions (e.g., Bodenheimer,, 1965). The elapsed time to reach Li-burning temperatures is a sensitive function of mass and thus, depends very sensitively on the luminosity (Bildsten et al.,, 1997; Ushomirsky et al.,, 1998). PMS low-mass stars are fully convective, so the mixing timescale is short, and since the temperature dependence of the nuclear reactions is steep, these stars rapidly deplete their Li content. For coeval stellar groups, like open clusters or moving groups, the determination of the luminosity at which stars transition from exhibiting Li in their atmospheres to being fully depleted provides a very precise age estimate. Moreover, the LDB technique is relatively model-insensitive, rendering similar ages to within 10% (Burke et al.,, 2004), making it a highly robust method which can lead to the identification of missing input physics when compared with other age-dating methods. The LDB method originated with Basri et al., (1996) who first applied it to the Pleiades cluster, leading to the discovery of the first brown dwarf using the lithium test.
Ages of open clusters are traditionally determined by matching their Hertzsprung Russell diagrams (HRDs) to distance-dependent, theoretical stellar isochrones. In particular, stars in and near the region close to the main-sequence turn-off (MSTO) are the most sensitive determinants of the age because they are evolving quickly. MSTO fitting can be improved in precision through statistical techniques that take account of the usually small number of stars at the turn-off, but the method remains limited by several factors. For very young clusters ( Myr), the MSTO corresponds to the minimum number of objects for their initial mass function, and un-resolved, undetected binary/multiple systems can significantly affect MSTO ages. At the same time, derived ages are highly dependent on the input models used and the physical constraints bounding them. One major influence, for example, has been the inclusion of core mixing in intermediate-mass stars that led to ages being systematically increased by 50% for clusters with ages less than 1–2 Gyr (Maeder,, 1974; Naylor,, 2009). The LDB method offers a means to critically test the MSTO technique and it has several advantages. First, the physical processes involved in MSTO and LDB stars are completely different and so are independent. Second, the fundamental physics underpinning the LDB method is much more simple and straight-forward to compute and calibrate than for hot, high-mass stars because stars lying close to the LDB point in young clusters are fully convective. While the exteriors of very-low-mass stars () may host complex magnetic activity phenomena that are challenging to understand, their interiors are fairly straightforward. Third, the nature of open cluster mass functions implies that there are many more stars that can be exploited to establish the LDB than there are at the MSTO (Soderblom,, 2010; Soderblom et al.,, 2013). However, one may obtain a relatively sparse data set due to efforts of removing field star contaminants.
The LDB method has limitations in its applicability. It can only be applied to very young clusters because of the rapidity of Li depletion. Furthermore, very-low-mass stars at the LDB are extremely faint, so only very nearby clusters are amenable to observation, usually by 8–10m class telescopes. Such stars are typically mid-M dwarfs in the cluster, and for physical and practical reasons, the LDB method is limited in its utility for ages in the range Myr. Currently, seven other open clusters and two moving group associations have LDB age determinations, but only the Pleiades is similar in age (1258 Myr, Stauffer et al.,, 1998) (12611 Myr, Burke et al.,, 2004) (gyrochronology age of Myr, Cargile et al.,, 2014) to Blanco 1. As yet, no open cluster with an isochrone age 130 Myr has been investigated using the LDB method.
Blanco 1 is an open cluster whose near-solar composition, [Fe/H] (Ford et al.,, 2005), and age similarity to the Pleiades make it ideal for direct comparison and systematic characterization of age diagnostics. Previous age estimates for Blanco 1 suggest that it is a relatively young open cluster (100–150 Myr, Panagi and O’dell,, 1997; Moraux et al.,, 2007). Blanco 1 is also considered nearby at a modest distance of 207 pc (van Leeuwen,, 2009), and lies at high Galactic latitude (). Initially, a subset of low-mass Blanco 1 candidates were analyzed, and the LDB age was determined to be 13224 Myr (Cargile et al.,, 2010). In this manuscript, we present additional Gemini-N spectra of Blanco 1 LDB candidates, and describe a consistent analysis for the full sample of Blanco 1 spectroscopic observations, which allows us to further resolve the LDB location and derive a more precise LDB age for the cluster.
Despite the similarity of derived LDB ages among different PMS models, most models do not account for physical processes in an inclusive and realistic stellar environment, such as rotation and magnetism prevalent in low-mass star PMS evolution. Such omissions have the potential to affect the rate of Li depletion and thus, the age inferred from the LDB. It is well-established that magnetic activity can influence stellar parameters, particularly the radius () and effective temperature () of a star (Morales et al.,, 2008). One additional goal of this project is to quantify the extent that activity influences these stellar parameters, allowing us to correct for the age determinations based on the LDB technique. Using empirical relationships presented in Stassun et al., (2012), we will account for the magnetic activity by effectively determining the properties of inactive Blanco 1 stars. In doing so, we enable a consistent LDB age determination from standard PMS models.
In Section 2, we describe the data arising from our new medium-resolution spectroscopic campaign of additional Blanco 1 low-mass candidate members. In Section 3, we present our analysis, emphasizing the and Li i features, which are important to the astrophysical interpretations for inferring the LDB age of Blanco 1. In Section 4, we present the details of a clear methodology for establishing LDB boundaries as well as the derivation of the LDB age for our sample; we then present the empirical corrections for magnetic activity and derive a new LDB age based on the changes found in and for the stars which define the LDB boundaries. We conclude the manuscript with a summary of our work in Section 5.
2 Targets, Observations, and Data Reduction
A photometric catalog of the very-low-mass members of Blanco 1 was compiled by Moraux et al., (2007), where they selected cluster candidates on the basis of their location in CMDs compared to theoretical isochrones (100 and 150 Myr). Moraux et al., furthermore took low-resolution optical spectra for 17 of the brightest brown dwarf candidates and found in emission for 5 of them, which is an initial indicator of youth. Their list of 15 probable members straddling the substellar boundary provides us with an ideal sample for investigating the LDB of Blanco 1. These probable low-mass cluster members have 18–20, corresponding to the expected luminosity of Blanco 1 LDB, which in a cluster of age 100 Myr at a distance of 200 pc should be 19 (Burke et al.,, 2004; Cargile et al.,, 2010).
For a subset of these objects, Cargile et al., (2010) have previously presented medium-resolution spectra of the Li i (6707.8 Å) region. In this work, we have obtained additional spectra using the same instrument and setup as were employed for the Cargile et al. study. Both the previous and new spectra were obtained with the Gemini Multi-Object Spectrograph (GMOS) in queue schedule mode on the Gemini-North telescope (Hook et al.,, 2004), under program IDs GN-2009B-Q-53 and GN-2010B-Q-96. We used slitlets to yield a two-pixel resolving power of 4400 over a spectral wavelength range of 5700–8000Å and dispersion of 0.67Å per pixel.
Moreover, a recent optical survey performed using the SMARTS 1.0m telescope at CTIO provided additional candidates with 13.0–17.5; these targets were identified as photometric candidate members from their location near to the cluster sequence in an optical color magnitude diagram (CMD, James et al. in prep). Altogether, our sample contains 43 spectra (13 targets selected from Moraux et al., 30 from the SMARTS survey), from which, we find 14 high confidence members of the Blanco 1 cluster. In addition, we retain spectra of the radial velocity (RV) standard star GJ 905 (M6) from our initial GN-2009B-Q-53 program, which was observed and analysed in an identical manner to the Blanco 1 candidates.
All of our GMOS spectra are reduced using standard reduction routines in the IRAF111iraf
is distributed by the National Optical Astronomy Observatories, which are operated by the
Association of Universities for Research in Astronomy, Inc., under cooperative agreement with
the National Science Foundation. Gemini-GMOS package, including bias removal, flat-fielding,
aperture extraction, and wavelength calibration. Our spectral signal-to-noise ratios (SNR) per
pixel ranged from approximately 10 to 500 for the faintest and brightest targets, respectively.
RVs for each Blanco 1 target were measured using the fxcor procedure in IRAF by
cross-correlating target GMOS spectra with the RV standard star, GJ 905. We performed
cross-correlation in the wavelength region 6600–7000Å, masking out regions rich
in telluric features. Uncertainties on these RVs can be relatively large (up to 15
km s-1), which is primarily due to the low SNR of the target spectra and the medium
resolution of our observations.
3 Analysis
We developed a spectral analysis code in Python to completely automate the analysis method in order to consistently derive equivalent widths and spectral indices. The spectral type of the object is determined via TiO and CaH spectral indices, whose methodology we describe in § 3.1. Equivalent widths (EWs) of the (6562.8 Å) and Li i (6707.8 Å) spectral features are measured systematically, using established wavelength regions flanking both features to carry out the linear normalization procedure to the pseudo-continuum. Systematic EW measurement and error estimation for the line is discussed in § 3.2. Cluster membership criteria are laid out in § 3.3, where we identify high confidence cluster members. In § 3.4, we describe the measurement of the Li i feature, which we then place in the context of the curve of growth to derive lithium abundance, A(Li), in section 3.4.3, allowing us to provide insight as to the stage of Li depletion for our targets. In section 4.2.2, we describe how we obtain values, which are used to account for magnetic activity and determine their concomitant changes in and . Observational and empirical data for the cluster members are summarized in Table 1, which include positions, photometric properties, spectral types, RVs, EW(), and EW(Li i) for each object. We include 1 errors for both the and Li i EW measurements for completeness, with 3 upper limits reported for Li non-detections.
| Star NameaaTargets are from: B1opt- SMARTS optical survey (James et al. in prep); CFHT-BL- Moraux et al., (2007). In this paper, targets will be referenced by the identification number written in bold. | RAbbJ2000.0 Coordinates | DecbbJ2000.0 Coordinates | ccThe Ks values come from the 2MASS catalog for stars with 17.5, or from Moraux et al., for 17.5. For 17.5, which is relevant to the region of the LDB, the photometric uncertainty is estimated as , , . | ccThe Ks values come from the 2MASS catalog for stars with 17.5, or from Moraux et al., for 17.5. For 17.5, which is relevant to the region of the LDB, the photometric uncertainty is estimated as , , . | SpTddSpectral types are good to within half a subclass. | RV | EW()eeNegative values indicate the line is in emission. | ffThe systematic uncertainty for is about 0.5 dex. | EW(Li i)ggMembers with Li report EW(Li) from our MCMC analysis, while 3 upper limits come from equation 1. | A(Li) |
|---|---|---|---|---|---|---|---|---|---|---|
| [HH:MM:SS] | [DD:MM:SS] | [mag] | [mag] | [km s-1] | [Å] | [Å] | ||||
| B1opt-6335 | 00:00:28.868 | -30:08:30.01 | K5.5 | |||||||
| B1opt-18229 | 00:01:39.768 | -30:04:38.24 | K5.3 | |||||||
| B1opt-2156 | 00:07:40.790 | -30:05:56.58 | M0.4 | |||||||
| B1opt-13328 | 00:04:22.733 | -30:23:06.00 | M3.8 | |||||||
| CFHT-BL-16 | 00:01:28.438 | -30:06:06.95 | 18.30 | 2.85 | M5.1 | |||||
| CFHT-BL-22 | 00:00:02.661 | -30:20:15.90 | 18.47 | 2.90 | M5.6 | |||||
| CFHT-BL-24 | 00:07:50.539 | -30:05:09.46 | 18.51 | 2.95 | M6.0 | |||||
| CFHT-BL-25 | 00:00:02.844 | -30:17:43.98 | 18.62 | 3.06 | M5.6 | |||||
| CFHT-BL-29 | 00:00:17.351 | -30:46:20.32 | 18.77 | 3.03 | M6.2 | |||||
| CFHT-BL-38 | 00:05:13.037 | -30:27:35.78 | 18.98 | 3.10 | M6.4 | |||||
| CFHT-BL-43 | 00:04:32.849 | -30:18:41.40 | 19.02 | 3.13 | M6.3 | |||||
| CFHT-BL-36 | 00:00:28.585 | -30:06:41.94 | 19.06 | 3.37 | M6.0 | |||||
| CFHT-BL-45 | 00:01:35.611 | -30:03:09.90 | 19.23 | 3.27 | M6.2 | |||||
| CFHT-BL-49 | 00:04:28.858 | -30:20:37.00 | 19.46 | 3.56 | M6.3 |
3.1 Spectral Indices
Spectral types are estimated from the value of the TiO (7140Å) and CaH (6975Å) narrow-band spectral indices. They are defined as
where C(7020–7050Å) represents the pseudo-continuum, and TiO(7125–7155Å) and CaH(6960–6990Å) represent the molecular absorption bands, integrated in the indicated wavelength intervals (Briceño et al.,, 1998; Oliveira et al.,, 2003). The CaH index is sensitive to gravity and helps us verify that the objects that we observed are, in fact, dwarfs. However, these narrow-band indices are not by themselves good indicators of cluster membership since the sample is sure to be contaminated with other foreground field M-dwarfs with similar index values (Jeffries et al.,, 2004). The spectral type of each target is estimated from the relationship between TiO (7140Å) index and spectral type calibrated from standards in Montes et al., (1997) and Barrado y Navascués et al., (1999) (see Table 6 in Jeffries et al.,, 2013). The resulting spectral types are reported in Table 1. We adopt a typical uncertainty of half a spectral subclass (Oliveira et al.,, 2003; Jeffries and Oliveira,, 2005).
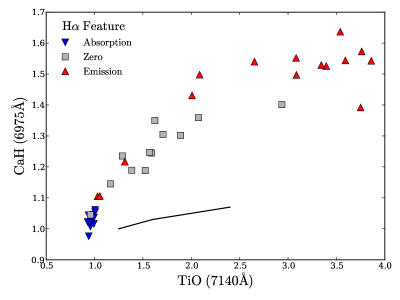
The CaH versus TiO spectral indices for the Blanco 1 sample are plotted in Figure 1, with reference to an H feature annotated (see § 3.2). Stars with in absorption are likely cluster non-members because at the age of Blanco 1, we expect such low-mass bona fide cluster members to be chromospherically active. In addition, zero- stars can be very active stars with strong chromospheres as the core may be filled-in by active region emission (Panagi and O’dell,, 1997); hence, such objects may be young cluster members as well. We return to as a membership criterion in section 3.3.
3.2 The H feature
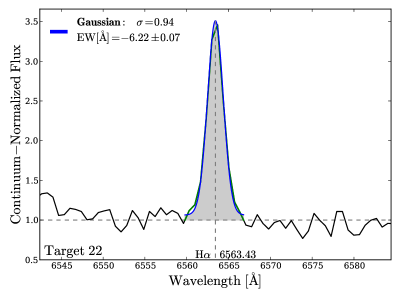
As well as establishing cluster membership, EW can be employed in empirical corrections for magnetic activity (discussed in section 4). Our method of obtaining EW consistently is achieved by performing continuum normalization with a 10Å-span of wavelength neighboring the feature. We use the intervals 6545–6555Å and 6570–6580Å and find no significant issues with other spectral features within these intervals. The mean is calculated from each 10Å-segment, and the line connecting both mean values establishes the continuum level. The EW is then determined by measuring excess from the normalized continuum using a Gaussian line-profile, which is obtained from a minimized least-squares fit. A simple interpolation is performed at the boundaries of the feature so that the baseline will exactly measure flux above unity (for emission) or below unity (for absorption). Figure 2 demonstates such an EW measurement process for star 22. EW uncertainties are estimated from
| (1) |
where FWHM, p, and SNR are the full-width half-maximum of the Gaussian fit, the pixel dispersion scale in Å, and the signal-to-noise ratio, respectively (Cayrel,, 1988).
3.3 Membership Selection
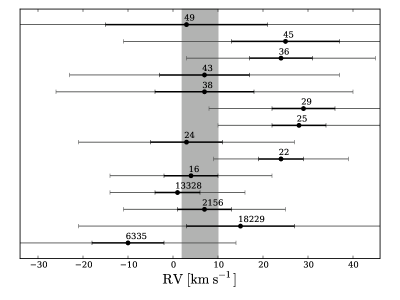
The stars from our GMOS sample can be classified as Blanco 1 cluster members upon consideration of three different membership criteria: (1) that the photometry of a candidate member is consistent with the cluster sequence in an CMD; (2) its 3 RV must be within the range of +2 to +10 km s-1; (3) the line EW must be in emission or zero and comparable to similar-mass stars in the Pleiades cluster. We note that Blanco 1 has a measured systemic velocity around +6 km s-1 (Mermilliod et al.,, 2008; González and Levato,, 2009), but given the difficulty of determining RVs from low SNR spectra, we consider all stars within +2 to +10 km s-1 as candidate cluster members. Each of these membership criterion has its own level of field star contamination, so each individual property is considered necessary but not sufficient for cluster membership. We combine the three criteria so that stars exhibiting these properties are considered high confidence single-star Blanco 1 members.
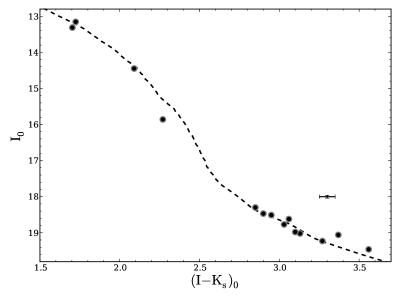
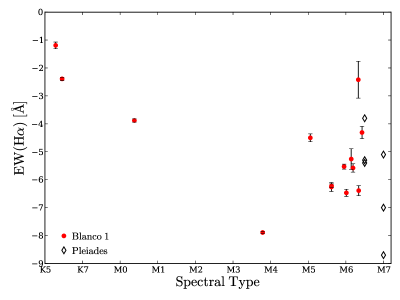
In Figure 3, we plot an intrinsic cluster sequence for cluster members. We correct for reddening and extinction by applying and to obtain the intrinsic photometry. The RV distribution for Blanco 1 members is shown in Figure 4. Most of these low-mass stars fall safely within the range of our RV criterion (shown by the shaded band), but a few of them appear to be marginal RV members. Figure 5 shows the distribution of EW() for our sample of Blanco 1 members and some low-mass members in the Pleiades (Stauffer et al.,, 1998). These clusters share a similar age, and a given EW() is expected to be comparable to similar-mass stars amongst these populations. Our sample of low-mass members of Blanco 1 exhibits very active chromospheres at mid-M spectral types. This appears to be comparable to the low-mass activity found in the Pleiades. Recorded in Table 1 are our measurements of EW() for high confidence Blanco 1 members.
3.4 Lithium
3.4.1 EW Measurement via Spectral Subtraction
A spectral subtraction technique is carried out in our study by using a catalog of M-dwarf templates from the Sloan Digital Sky Survey (SDSS, Bochanski et al.,, 2007). These templates were produced by averaging over 4000 SDSS stellar spectra for spectral types M0–L0. In particular, we use the catalog of inactive spectra for spectral types M0–M7, where the measured EW of the feature was 1Å in emission. Moreover, since the majority of the combined spectra used for these templates are field M-dwarfs, they are expected to be old enough (Gyrs) to have destroyed their initial lithium. Due to the lack of K-type templates, we must compare the K-type stars with the M0 SDSS template. Otherwise, we paired a given GMOS spectrum with a template by rounding to the nearest spectral type determined from the TiO spectral index described in section 3.1.
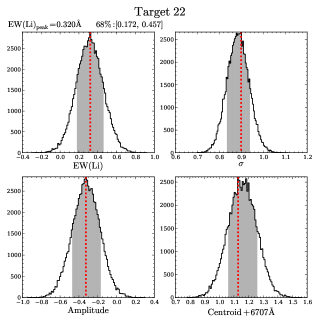
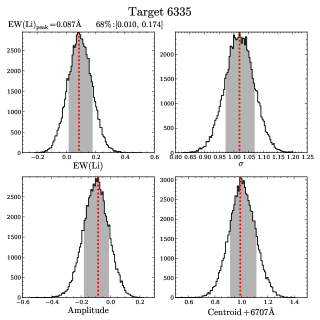
In the determination of the Li i EW, the spectrum of the target is shifted to the rest frame, normalized, smoothed, and compared with a SDSS template spectrum. Both the target and template are normalized by using small wavelength spans bounding Li i (6707.8Å), specifically 6703–6706Å and 6710–6712Å. Data were smoothed with a Gaussian kernel, and the template is convolved to match the resolution of our GMOS spectrum. EWs are measured in the residual spectrum over an interval of 4Å centered on Li i. Figure 6 shows an example of measuring the Li EW for star 22 (M5.6) and 6335 (K5.5), confirming detectable lithium in these objects for the first time. Present in some of our spectra with low SNR are telluric sky absorption lines near S ii that could not be removed because of poor sky-subtraction. The error quoted for EW(Li) in Figure 6 is estimated using equation 1.
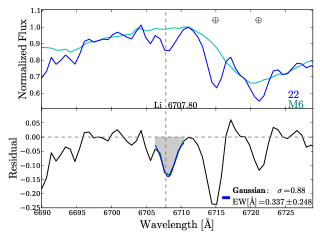
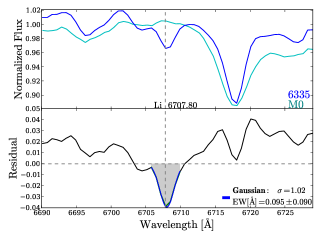
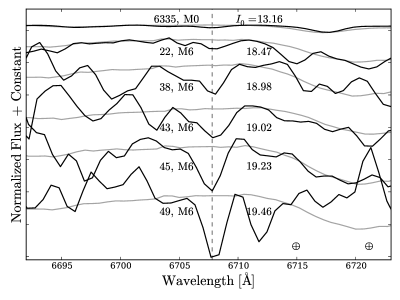
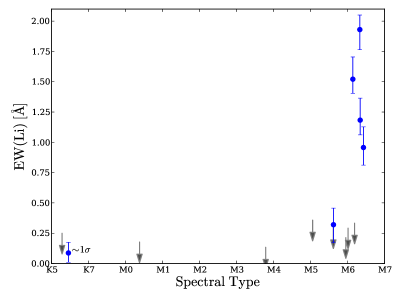
In figure 7, we show the six low-mass Blanco 1 members that contain detectable Li. Telluric S ii features are indicated. It is evident that as one goes fainter, the signal in Li becomes more significant. On the other hand, the SNR diminishes, increasing the difficulty to match the continuum. Targets 38, 43, 45, and 49 were reported to have Li detected in Cargile et al., (2010), although EW measurements at the time were not possible. Now, we have identified two additional members (targets 22 and 6335). In section 4, we explain how target 22 in particular influences the location of the LDB.
3.4.2 EW Measurement via MCMC
Due to the low signal-to-noise of the spectrum around the Li i line (typically 10 for the faintest Blanco 1 stars), we sought to provide a robust characterization of our Li EW measurements. Here, we incorporate an affine-invariant MCMC to sample the posterior probability distribution functions for our Li i equivalent widths using the emcee222http://dan.iel.fm/emcee package developed by Foreman-Mackey et al., (2013). After we subtract the appropriate template for each target spectrum, we model the resulting residual with a Gaussian as a likelihood function, and calculate 80,000 samples (400 MCMC “walkers” 200 iteration steps) of the posterior probability distribution. We place an uninformative prior on the amplitude of our Gaussian model, constraining it to only consider Li in absorption, as well as normal priors on the Gaussian and centroid based on a priori knowledge of the GMOS instrument resolution and predicted 6707.8Å Li line center, respectively. For each star, we set a conservative estimate of the variance in our flux measurement based on a SNR10.
We show in Figure 8 examples of the marginalized posterior distributions for a Gaussian model of the Li absorption line, as well as an inferred equivalent width distribution based on the predicted cumulative function. The Li equivalent widths we report in Table 1 are determined from the mode of the marginalized distribution with uncertainties based on the inter-68th percentile range (1 errors).
In Figure 9, we display the distribution of EW(Li) for our modeling of Blanco 1 cluster members. A clear pattern is apparent is these data; namely, we detect little or no Li in earlier spectral types (M6), but measure significant Li absorption in the latest spectral type stars in Blanco 1. In Section 4, we further investigate the quantitative nature of this distribution in the context of predictions from PMS Li models. However, the overall spectral type dependent transition in the EW(Li) of Blanco 1 stars is qualitatively consistent with the identification of the lithium depletion boundary in the cluster.
3.4.3 Lithium Abundance
In order to calculate Li abundances, it is necessary to convert intrinsic color to .
For the stars in our spectroscopic survey, we used BT-Settl models (Allard et al.,, 2011) to obtain .
Jeffries and James, (1999) performed a lithium study on G- and K-dwarf members of Blanco 1, but
we use the empirical relationship given in Casagrande et al., (2010) to derive for these stars.
Abundances were calculated from EW(Li) using an appropriate curve of growth for the Li i (6707.8Å)
feature; for hotter stars (4000K),
we used the calculations given in Soderblom et al., (1993), and for cooler objects, we used
the models presented in Pavlenko et al., (1995) and Pavlenko and Magazzu, (1996).
We note that our procedure of measuring EW(Li) after subtracting a template spectrum has
the effect of mitigating the contribution of the nearby contaminating Fe line at 6707Å,
as well as the large molecular TiO absorption that is present in the Li region.
Non-LTE corrections for Li abundances presented in Carlsson et al., (1994)
were applied to the hotter Blanco 1 stars. For the cooler stars, we did not correct
the abundances for non-LTE effects as these are negligible at cool temperatures
(Pavlenko et al.,, 1995; Zapatero Osorio et al.,, 2002). We adopt an initial Li abundance of
for the cluster (Zapatero Osorio et al.,, 2002).
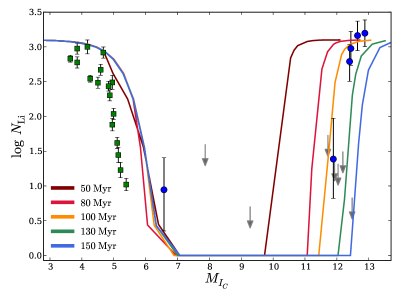
Figure 10 shows the distribution of Li abundance for Blanco 1 versus absolute magnitude,
. Here, the three regimes of Li depletion are present: (1) stars more massive than 0.6
gain radiative interiors and only lose a small amount of Li depletion (green squares, Jeffries and James,, 1999);
(2) stars in the ‘Li chasm’ (Basri,, 1997) that have fully depleted their initial Li supply
();
(3) low-mass stars that still exhibit Li content ().
It is evident that for hotter stars (), with the exception of a few points, the
models fail to reproduce the overall observed abundance distribution in the cluster.
The Li detections near the substellar boundary () suggest that target 22 is
currently depleting Li, while the fainter Li detections lie near full natal Li abundance.
4 Results
4.1 Locating the LDB
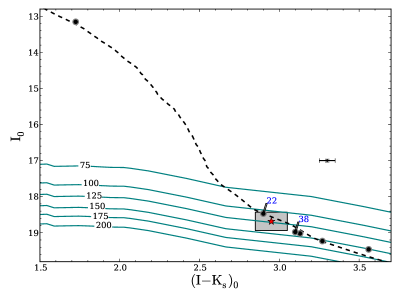
In the identification of the LDB for this study, we establish a set of rules to demarcate the boundaries of the LDB. First, having identified the cluster members, we concentrate on the targets that contain lithium. Based on the insight we have gained from the lithium abundance of Blanco 1 members, the LDB boundaries are set in the following way: the target currently depleting lithium (star 22) establishes the bright, blue (upper left) corner; the nearest target in the CMD with full lithium content (star 38) establishes the faint, red (lower right) corner. The edges of the LDB box incorporate the photometric uncertainties in the stars defining these corners (stars 22 and 38): =0.03, =0.04, =0.05. We define the center of this box to be the location of the LDB in Blanco 1, the brightest luminosity at which Li content still remains unburned in the atmospheres of low-mass stars.
Figure 11 shows the CMD for intrinsic -band magnitude versus for the stars in our sample that have Li detections among the Blanco 1 low-mass members. The Li detection at is from a K-dwarf in the cluster. This star formed a radiative core early enough in its PMS evolution to stop convection down to the stellar depth necessary to burn Li, and thus still retains some of its Li content. We also illustrate in Figure 11 our definition of the LDB region as the shaded box.
4.2 LDB Ages for Blanco 1
4.2.1 Standard LDB Age
Previously in Cargile et al., (2010), with a limited data set, the authors provided a preliminary identification of the LDB in Blanco 1 and found it to be located at and . They calculated the absolute magnitude, , of the LDB using the distance modulus from HIPPARCOS (6.580.12, van Leeuwen,, 2009) and corrected for reddening and extinction by adopting and . Using predicted Li-depletion rates from PMS models, specifically Chabrier and Baraffe, (1997) and Baraffe et al., (1998, hereafter BCAH), Cargile et al., used the luminosity at which 99% of the star’s natal Li is destroyed to measure the LDB age for Blanco 1 to be 13224 Myr. We designate their method as the ‘standard’ LDB age determination technique.
Here, we determine the standard LDB age using a similar approach to Cargile et al., Using our stars 22 and 38 to establish the LDB boundaries, the updated Blanco 1 LDB is located at and . We determine using the same distance modulus from HIPPARCOS, as well as extinction and reddening corrections used in Cargile et al., We first calculate the LDB age of Blanco 1 using the BCAH models and synthetic photometry from the DUSTY model atmospheres (Baraffe et al.,, 2002). Alternatively, we also calculate the LDB age using the empirical bolometric corrections from Pecaut and Mamajek, (2013, hereafter P&M) to derive luminosity directly from our absolute magnitudes. In Table 2, we list our measured LDB parameters for Blanco 1 using the BCAH PMS models with both synthetic photometry and using empirical corrections from P&M.
For clarity, Figure 12 shows the region of the CMD near the LDB of Blanco 1. As in Figure 11, the LDB is established by the Li detections in targets 22 and 38. Using the ‘standard’ LDB technique, the BCAH PMS models with synthetic photometry, and our new Li detections, the LDB in Blanco 1 is found at a , resulting in an updated LDB age of Myr. We have included a 126 Myr BCAH LDB luminosity locus in Figure 12 to illustrate this age measurement, which is strikingly similar to the age of the Pleiades (12611 Myr, Burke et al.,, 2004).
One might instead consider that the position of the LDB could be defined entirely by Target 22, given that this object evidently lies within the Li depletion zone (see Figure 10). For stars at full natal Li abundance, A(Li) = 3.1, so the LDB (defined at 99% depletion) is found when A(Li) = 1.1. Conceivably, the absolute magnitude range for the LDB would be bounded by the abundance errors for star 22. We interpolate over the abundance isochrones to calculate for A(Li) = 0.821, 1.1, and 1.974 dex, which correspond with the error bounds of star 22 and the 99% Li depletion level. The 110 Myr model isochrone matches well with the data, and we find at A(Li) = 1.1 that mag/dex. Thus, the LDB using this interpretation is mag, and the corresponding LDB age is Myr. While this abundance-derived age is in statistical agreement with our standard LDB age, the reported error (6.1%) is smaller than the 10% systematic error found for the uncertainties associated with the stellar evolution models and bolometric corrections (Burke et al.,, 2004). Therefore, we prefer the more conservative approach described above since our method results in the observed precision of the LDB age that is no better than the predicted accuracy of the LDB technique at 120 Myr.
4.2.2 Activity-Corrected LDB Age
Investigations have found that the fundamental properties of low-mass stars can be altered in the presence of strong magnetic activity (López-Morales,, 2007; Ribas,, 2006). Morales et al., (2008) have provided observational evidence that active stars are cooler than inactive stars of similar luminosity, therefore, implying that active stars have a larger radius. Their results generalize for all active low-mass stars – single or binary. In the context of the LDB, we thus expect that active stars would be more massive than initially thought, and their associated ages would be younger.
Stassun et al., (2012) provide empirical relations to determine the amount by which the effective temperatures () and radii () of low-mass stars and brown dwarfs are altered due to chromospheric activity. Their results presented a strong correlation between the strength of emission in active M-dwarfs, and the degree to which their temperatures are suppressed and radii inflated compared to inactive stars. In order to determine the change in and as a result of stellar activity, the following empirical relations were implemented:
| (2) |
| (3) |
where and are linear coefficients. The averaged values, as defined in Stassun et al., (2012), are in percent units: , , , and .
We translate our measured EW to using a grid of BT-Settl model atmospheres from Allard et al., (2011) for in the range 2200–5000K, assuming Solar composition and (appropriate for very-low-mass stars in Blanco 1). First, we compute the bolometric flux () for these model atmospheres. Then, for a given GMOS target, we use its color to estimate from a BCAH 135 Myr isochrone. This is overestimated since the activity would suppress it, but this is a small effect (0.1 dex in for a 200K shift). We use this to interpolate over the model atmospheres to estimate the atmospheric continuum flux at the feature (). The flux () is computed by convolving with the EW of our target. Finally, by computing , we also obtain the equivalent . Propagating the photometric uncertainty in color, we find an error of 0.03 dex in , but this is much smaller than the systematic contribution of 0.4 dex in the transformation of color to temperature. Hence, the total systematic error for is about 0.5 dex.
From the empirical relationships, we find the percent change in (suppression) and (inflation) as a result of magnetic activity along with the percent change in luminosity. Due to the nature of how equations 2 and 3 were derived and calibrated, the activity corrections should only be applied to stars with in emission. We then use this information to determine the 135 Myr BCAH magnitudes and colors of our Blanco 1 sample as if these stars were inactive; we remove the effects of activity.
Using the same logic as before, we set the ‘corrected’ LDB boundaries using the corrected, inactive photometry for targets 22 and 38. We determine the LDB parameters at this new LDB location and record these values in Table 2. We infer the activity-corrected LDB is located at and , which corresponds to and the BCAH LDB age of Myr.
Figure 12 shows a closer view on the regions of the LDB for the intrinsic CMD. This plot shows the Li detections for both the original (black points) and activity-corrected (yellow points) photometric positions. For simplicity, vectors showing the direction of the activity corrections are drawn only for targets 22 and 38, which establish the LDB boundaries in the CMD, and this is shown by the shaded boxes. The LDB positions (red stars) are marked within these boxes, and BCAH isochrones are drawn to show the age we infer from their predicted luminosities. Accounting for the effects of chromospheric activity mainly shifts the data upward along the cluster sequence. Additionally, the boundaries of the LDB are compacted when the effects of magnetic activity are removed and renders a corrected, more precise age. We carried out this same process of characterizing the LDB for versus . LDB parameters derived from PMS models using are recorded in Table 2.
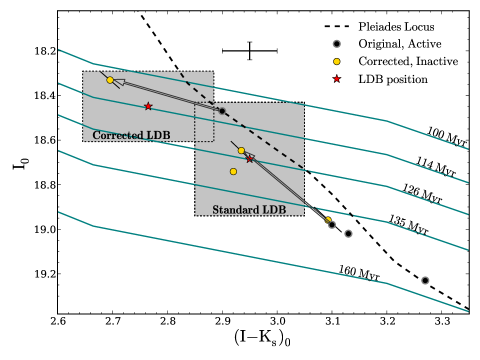
Despite consistent treatments, use of the BCAH models along with DUSTY synthetic photometry renders statistically different LDB ages and parameters depending on whether we use or magnitudes versus the color as presented in Table 2. For the standard BCAH results, the and LDB parameter values are statistically compatible to within 1 of their errors. Conversely, for the corrected BCAH results, the and results differ greater than 1. Further work on understanding the reason for different age and parameter determinations at the LDB depending on the choice of photometry is required.
| versus | versus | versus | versus | |
|---|---|---|---|---|
| (Standard) | (Corrected) | (Standard) | (Corrected) | |
| LDB | ||||
| Location | ||||
| aaAbsolute magnitudes are calculated using the HIPPARCOS distance modulus of 6.58 mag. The first and second sets of uncertainties are when using DUSTY synthetic photometry and the empirical bolometric corrections of P&M, respectively. These errors include the uncertainty in the photometry, error in the distance modulus, and error in the bolometric correction for P&M. LDB parameters are not available for the / LDB locations using the P&M bolometric corrections. , | , | |||
| Age [Myr] | ||||
| BCAHbbRefers to BCAH models and synthetic photometry from DUSTY model atmospheres (Baraffe et al.,, 2002). | ||||
| P&MccRefers to use of empirical bolometric corrections from Pecaut and Mamajek, (2013) to directly determine luminosity. | ||||
| [] | ||||
| BCAH | ||||
| P&M |
5 Summary and Conclusion
In this paper, we have expanded upon the initial identification of the Blanco 1 LDB (Cargile et al.,, 2010).
We obtain the full sample of Blanco 1 candidates for our GMOS survey and analyzed both previous and new
data consistently to update the inferred LDB age.
This was done by developing spectral analysis software to systematically analyze the and Li i features.
Moreover, we analyze the Li i feature using emcee to perform MCMC sampling on the gaussian parameters
that measure EW(Li). We find that for Li detections with 17, the error is reduced by up to a factor of 2
using MCMC as opposed to relying on the SNR estimate from equation 1.
Since the region is simpler and has a higher SNR, a gaussian fit via least-squares to the line is sufficient.
Out of the 43 spectra from our GMOS survey, we find 14 high confidence low-mass members belonging to Blanco 1,
and 6 of these stars exhibit detectable Li features.
Based on our systematic analysis of the Li i feature, we verify the findings of Cargile et al., (2010) that targets
38, 43, 45, and 49 exhibit Li absorption with confidence 3.
We have also obtained two new Li detections for low-mass Blanco 1 members; namely, the K-dwarf target 6335 and
M-dwarf target 22. Importantly, target 22 influences how we determine the LDB age as it appears to currently be
in the process of depleting its initial Li content.
Using targets 22 and 38 to establish the LDB boundaries, we derive
parameters at the LDB using the ‘standard’ technique.
We first determine the LDB age of Blanco 1 using the BCAH models and synthetic
photometry from the DUSTY model atmospheres, and also obtain the LDB age using the
empirical bolometric corrections from P&M. Using the BCAH models and the synthetic photometry,
we measure an updated standard LDB age for Blanco 1 of Myr.
Compared with the Pleiades (12611 Myr, Burke et al.,, 2004), these open clusters share remarkable coevality.
For the low-mass Blanco 1 members in our sample, empirical corrections from Stassun et al., (2012)
were used to determine the amount of suppression in and inflation in due to chromospheric
activity as indicated by emission. We remove these effects and determine the photometric properties
of our targets as if they were not active. Using the inactive properties of targets 22 and 38, we identify
a ‘corrected’ LDB and infer a new age of Myr from BCAH models.
This corrected age for Blanco 1 brings the LDB age and MSTO isochrone age
( isochrone fitting with moderate convective-core overshoot; Naylor and Jeffries,, 2006; Naylor,, 2009)
into close agreement (110 Myr, James et al. in prep).
On the other hand, the gyrochronology method from Cargile et al., (2014) determined the age of Blanco 1
to be 146 Myr. Understanding the reasons for this disagreement is beyond the scope of this paper.
We find that applying empirical relationships to account for magnetic activity slightly increases the LDB luminosity,
and subsequently results in a 10% decrease in the predicted age. This systematic is comparable to the typical
measurement error quoted by other LDB age determinations (e.g., Burke et al.,, 2004) but has not
been included in any previous LDB study. Our work prompts the need to re-investigate previous LDB determinations
in an effort to produce more accurate ages, and recalibrate the stellar age scale relying on LDB ages.
| Star IDaaTargets are from SMARTS optical survey (James et al. in prep). Only targets 28, 3, and 50 are from Moraux et al., (2007). | RAbbJ2000.0 Coordinates | DecbbJ2000.0 Coordinates | ccThe Ks values come from the 2MASS catalog for stars with 17.5, or from Moraux et al., for 17.5. | ccThe Ks values come from the 2MASS catalog for stars with 17.5, or from Moraux et al., for 17.5. | SpTddSpectral types are good to within half a subclass. | RV | EW()eeNegative values indicate the line is in emission. | EW(Li i)ffIntegrative measures of the Li residual. Positive values represent overall absorption. Errors are from equation 1, assuming a FWHM of 1.5Å. |
|---|---|---|---|---|---|---|---|---|
| [HH:MM:SS] | [DD:MM:SS] | [mag] | [mag] | [km s-1] | [Å] | [Å] | ||
| 18237 | 00:01:30.043 | -30:02:17.56 | K4.0 | |||||
| 222 | 00:08:07.963 | -30:16:55.78 | K4.1 | |||||
| 3005a | 00:00:16.708 | -30:44:36.56 | K4.1 | |||||
| 3001a | 00:00:16.656 | -30:47:08.81 | K4.2 | |||||
| 3004a | 00:00:17.533 | -30:45:11.62 | K4.2 | |||||
| 3006 | 00:00:17.947 | -30:45:20.74 | K4.2 | |||||
| 3007 | 00:00:17.856 | -30:48:56.34 | K4.3 | |||||
| 2250 | 00:08:11.556 | -30:15:30.27 | K4.4 | |||||
| 300a | 00:08:10.980 | -30:17:54.67 | K4.5 | |||||
| 3001b | 00:00:29.608 | -30:07:35.47 | K5.0 | |||||
| 2019 | 00:00:03.377 | -30:18:19.04 | K5.0 | |||||
| 2001 | 00:00:02.299 | -30:20:25.55 | K5.1 | |||||
| 3004b | 00:00:29.008 | -30:08:07.26 | K5.1 | |||||
| 2002 | 00:00:02.713 | -30:21:41.51 | ggNot in our optical catalog; magnitude from USNO-B1.0, magnitude from 2MASS. | ggNot in our optical catalog; magnitude from USNO-B1.0, magnitude from 2MASS. | K7.3 | |||
| 3005b | 00:00:28.639 | -30:07:27.73 | M0.2 | |||||
| 3002a | 00:00:16.786 | -30:48:20.92 | M0.9 | |||||
| 18184 | 00:01:33.739 | -30:06:20.05 | M2.0 | |||||
| 300b | 00:00:28.379 | -30:09:34.52 | M2.2 | |||||
| 2003 | 00:00:03.452 | -30:19:04.01 | M2.3 | |||||
| 3002b | 00:00:28.299 | -30:08:47.11 | M2.5 | |||||
| 250 | 00:07:56.902 | -30:04:16.57 | M2.9 | |||||
| 993hhProper motion non-members as determined by Platais et al., (2011). | 00:05:22.171 | -30:27:59.51 | M3.5 | |||||
| 9424hhProper motion non-members as determined by Platais et al., (2011). | 00:05:13.306 | -30:26:28.72 | M4.0 | |||||
| 1868hhProper motion non-members as determined by Platais et al., (2011). | 00:01:36.322 | -30:05:55.39 | M4.0 | |||||
| 28 | 23:59:55.379 | -30:02:32.28 | M5.4 | |||||
| 3 | 23:59:40.898 | -30:01:56.67 | — | — | — | — | ||
| 50 | 23:59:50.002 | -30:01:58.52 | — | — | — | — | ||
| 3003 | 00:00:17.026 | -30:47:43.55 | — | — | — | — | ||
| 9152 | 00:05:26.484 | -30:26:03.77 | — | — | — | — |
References
- Allard et al., (2011) Allard, F., Homeier, D., and Freytag, B. (2011). Model Atmospheres From Very Low Mass Stars to Brown Dwarfs. In Johns-Krull, C., Browning, M. K., and West, A. A., editors, 16th Cambridge Workshop on Cool Stars, Stellar Systems, and the Sun, volume 448 of Astronomical Society of the Pacific Conference Series, page 91.
- Allen and Strom, (1995) Allen, L. E. and Strom, K. M. (1995). Moderate-resolution spectral standards from lambda 5600 to lambda 9000. AJ, 109:1379–1390.
- Baraffe et al., (1998) Baraffe, I., Chabrier, G., Allard, F., and Hauschildt, P. H. (1998). Evolutionary models for solar metallicity low-mass stars: mass-magnitude relationships and color-magnitude diagrams. A&A, 337:403–412.
- Baraffe et al., (2002) Baraffe, I., Chabrier, G., Allard, F., and Hauschildt, P. H. (2002). Evolutionary models for low-mass stars and brown dwarfs: Uncertainties and limits at very young ages. A&A, 382:563–572.
- Barrado y Navascués et al., (1999) Barrado y Navascués, D., Stauffer, J. R., and Patten, B. M. (1999). The Lithium-Depletion Boundary and the Age of the Young Open Cluster IC 2391. ApJ, 522:L53–L56.
- Basri, (1997) Basri, G. (1997). Lithium near the substellar boundary: a new age diagnostic. Mem. Soc. Astron. Italiana, 68:917.
- Basri et al., (1996) Basri, G., Marcy, G. W., and Graham, J. R. (1996). Lithium in Brown Dwarf Candidates: The Mass and Age of the Faintest Pleiades Stars. ApJ, 458:600.
- Bildsten et al., (1997) Bildsten, L., Brown, E. F., Matzner, C. D., and Ushomirsky, G. (1997). Lithium Depletion in Fully Convective Pre-Main-Sequence Stars. ApJ, 482:442–+.
- Bochanski et al., (2007) Bochanski, J. J., West, A. A., Hawley, S. L., and Covey, K. R. (2007). Low-Mass Dwarf Template Spectra from the Sloan Digital Sky Survey. AJ, 133:531–544.
- Bodenheimer, (1965) Bodenheimer, P. (1965). Studies in Stellar Evolution. II. Lithium Depletion during the Pre-Main Contraction. ApJ, 142:451–+.
- Briceño et al., (1998) Briceño, C., Hartmann, L., Stauffer, J., and Martín, E. (1998). A Search for Very Low Mass Pre-Main-Sequence Stars in Taurus. AJ, 115:2074–2091.
- Burke et al., (2004) Burke, C. J., Pinsonneault, M. H., and Sills, A. (2004). Theoretical Examination of the Lithium Depletion Boundary. ApJ, 604:272–283.
- Cargile et al., (2010) Cargile, P. A., James, D. J., and Jeffries, R. D. (2010). Identification of the Lithium Depletion Boundary and Age of the Southern Open Cluster Blanco 1. ApJ, 725:L111–L116.
- Cargile et al., (2014) Cargile, P. A., James, D. J., Pepper, J., Kuhn, R. B., Siverd, R., and Stassun, K. G. (2014). Evaluating Gyrochronology on the Zero-age-main-sequence: Rotation Periods in the Southern Open Cluster Blanco 1 from the KELT-South Survey. ApJ, 782:29.
- Carlsson et al., (1994) Carlsson, M., Rutten, R. J., Bruls, J. H. M. J., and Shchukina, N. G. (1994). The non-LTE formation of Li I lines in cool stars. A&A, 288:860–882.
- Casagrande et al., (2010) Casagrande, L., Ramírez, I., Meléndez, J., Bessell, M., and Asplund, M. (2010). An absolutely calibrated Teff scale from the infrared flux method. Dwarfs and subgiants. A&A, 512:A54.
- Cayrel, (1988) Cayrel, R. (1988). Data Analysis. In Cayrel de Strobel, G. and Spite, M., editors, The Impact of Very High S/N Spectroscopy on Stellar Physics, volume 132 of IAU Symposium, page 345.
- Chabrier and Baraffe, (1997) Chabrier, G. and Baraffe, I. (1997). Structure and evolution of low-mass stars. A&A, 327:1039–1053.
- Ford et al., (2005) Ford, A., Jeffries, R. D., and Smalley, B. (2005). Elemental abundances in the Blanco 1 open cluster. MNRAS, 364:272–282.
- Foreman-Mackey et al., (2013) Foreman-Mackey, D., Hogg, D. W., Lang, D., and Goodman, J. (2013). emcee: The MCMC Hammer. PASP, 125:306–312.
- González and Levato, (2009) González, J. F. and Levato, H. (2009). Spectroscopic study of the open cluster Blanco 1. A&A, 507:541–547.
- Hook et al., (2004) Hook, I. M., Jørgensen, I., Allington-Smith, J. R., Davies, R. L., Metcalfe, N., Murowinski, R. G., and Crampton, D. (2004). The Gemini-North Multi-Object Spectrograph: Performance in Imaging, Long-Slit, and Multi-Object Spectroscopic Modes. PASP, 116:425–440.
- Jeffries and James, (1999) Jeffries, R. D. and James, D. J. (1999). Lithium in Blanco 1: Implications for Stellar Mixing. ApJ, 511:218–224.
- Jeffries et al., (2004) Jeffries, R. D., Naylor, T., Devey, C. R., and Totten, E. J. (2004). Low mass stars, brown dwarf candidates and the mass function of the young open cluster NGC 2547. MNRAS, 351:1401–1422.
- Jeffries et al., (2013) Jeffries, R. D., Naylor, T., Mayne, N. J., Bell, C. P. M., and Littlefair, S. P. (2013). A lithium depletion boundary age of 22 Myr for NGC 1960. MNRAS, 434:2438–2450.
- Jeffries and Oliveira, (2005) Jeffries, R. D. and Oliveira, J. M. (2005). The lithium depletion boundary in NGC 2547 as a test of pre-main-sequence evolutionary models. MNRAS, 358:13–29.
- López-Morales, (2007) López-Morales, M. (2007). On the Correlation between the Magnetic Activity Levels, Metallicities, and Radii of Low-Mass Stars. ApJ, 660:732–739.
- Maeder, (1974) Maeder, A. (1974). Stellar evolution near the main sequence: on some systematic differences between cluster sequences and model calculations. A&A, 32:177–190.
- Mermilliod et al., (2008) Mermilliod, J.-C., Platais, I., James, D. J., Grenon, M., and Cargile, P. A. (2008). Membership, binarity, and rotation of F-G-K stars in the open cluster Blanco 1. A&A, 485:95–105.
- Montes et al., (1997) Montes, D., Martin, E. L., Fernandez-Figueroa, M. J., Cornide, M., and de Castro, E. (1997). Library of high and mid-resolution spectra in the CA II H & K, H, H NA i D1, D2, and He i D3 line regions of F, G, K and M field stars. A&AS, 123:473–485.
- Morales et al., (2008) Morales, J. C., Ribas, I., and Jordi, C. (2008). The effect of activity on stellar temperatures and radii. A&A, 478:507–512.
- Moraux et al., (2007) Moraux, E., Bouvier, J., Stauffer, J. R., Barrado y Navascués, D., and Cuillandre, J.-C. (2007). The lower mass function of the young open cluster Blanco 1: from 30 MJup to 3 M⊙. A&A, 471:499–513.
- Naylor, (2009) Naylor, T. (2009). Are pre-main-sequence stars older than we thought? MNRAS, 399:432–442.
- Naylor and Jeffries, (2006) Naylor, T. and Jeffries, R. D. (2006). A maximum-likelihood method for fitting colour-magnitude diagrams. MNRAS, 373:1251–1263.
- Oliveira et al., (2003) Oliveira, J. M., Jeffries, R. D., Devey, C. R., Barrado y Navascués, D., Naylor, T., Stauffer, J. R., and Totten, E. J. (2003). The lithium depletion boundary and the age of NGC 2547. MNRAS, 342:651–663.
- Panagi and O’dell, (1997) Panagi, P. M. and O’dell, M. A. (1997). Spectroscopy of the open cluster Blanco 1 II. H alpha emission as an indicator of relative age. A&AS, 121:213–222.
- Pavlenko and Magazzu, (1996) Pavlenko, Y. V. and Magazzu, A. (1996). Theoretical LTE and non-LTE curves of growth for LiI lines in G-M dwarfs and subgiants. A&A, 311:961–967.
- Pavlenko et al., (1995) Pavlenko, Y. V., Rebolo, R., Martin, E. L., and Garcia Lopez, R. J. (1995). Formation of lithium lines in very cool dwarfs. A&A, 303:807.
- Pecaut and Mamajek, (2013) Pecaut, M. J. and Mamajek, E. E. (2013). Intrinsic Colors, Temperatures, and Bolometric Corrections of Pre-main-sequence Stars. ApJS, 208:9.
- Platais et al., (2011) Platais, I., Girard, T. M., Vieira, K., López, C. E., Loomis, C., McLean, B. J., Pourbaix, D., Moraux, E., Mermilliod, J.-C., James, D. J., Cargile, P. A., Barnes, S. A., and Castillo, D. J. (2011). A deep proper-motion survey of the nearby open cluster Blanco. MNRAS, 413:1024–1035.
- Ribas, (2006) Ribas, I. (2006). Masses and Radii of Low-Mass Stars: Theory Versus Observations. Ap&SS, 304:89–92.
- Soderblom, (2010) Soderblom, D. R. (2010). The Ages of Stars. ARA&A, 48:581–629.
- Soderblom et al., (2013) Soderblom, D. R., Hillenbrand, L. A., Jeffries, R. D., Mamajek, E. E., and Naylor, T. (2013). Ages of young stars. ArXiv e-prints.
- Soderblom et al., (1993) Soderblom, D. R., Jones, B. F., Balachandran, S., Stauffer, J. R., Duncan, D. K., Fedele, S. B., and Hudon, J. D. (1993). The evolution of the lithium abundances of solar-type stars. III - The Pleiades. AJ, 106:1059–1079.
- Stassun et al., (2012) Stassun, K. G., Kratter, K. M., Scholz, A., and Dupuy, T. J. (2012). An Empirical Correction for Activity Effects on the Temperatures, Radii, and Estimated Masses of Low-mass Stars and Brown Dwarfs. ApJ, 756:47.
- Stauffer et al., (2007) Stauffer, J. R., Hartmann, L. W., Fazio, G. G., Allen, L. E., Patten, B. M., Lowrance, P. J., Hurt, R. L., Rebull, L. M., Cutri, R. M., Ramirez, S. V., Young, E. T., Rieke, G. H., Gorlova, N. I., Muzerolle, J. C., Slesnick, C. L., and Skrutskie, M. F. (2007). Near- and Mid-Infrared Photometry of the Pleiades and a New List of Substellar Candidate Members. ApJS, 172:663–685.
- Stauffer et al., (1998) Stauffer, J. R., Schultz, G., and Kirkpatrick, J. D. (1998). Keck Spectra of Pleiades Brown Dwarf Candidates and a Precise Determination of the Lithium Depletion Edge in the Pleiades. ApJ, 499:L199+.
- Ushomirsky et al., (1998) Ushomirsky, G., Matzner, C. D., Brown, E. F., Bildsten, L., Hilliard, V. G., and Schroeder, P. C. (1998). Light-Element Depletion in Contracting Brown Dwarfs and Pre-Main-Sequence Stars. ApJ, 497:253–266.
- van Leeuwen, (2009) van Leeuwen, F. (2009). Parallaxes and proper motions for 20 open clusters as based on the new Hipparcos catalogue. A&A, 497:209–242.
- Zapatero Osorio et al., (2002) Zapatero Osorio, M. R., Béjar, V. J. S., Pavlenko, Y., Rebolo, R., Allende Prieto, C., Martín, E. L., and García López, R. J. (2002). Lithium and H in stars and brown dwarfs of sigma Orionis. A&A, 384:937–953.