toyLIFE: a computational framework to study the multi-level organization of the genotype-phenotype map
Clemente F. Arias1,2, Pablo Catalán1,2, Susanna Manrubia1,3, José A. Cuesta1,2,4∗
1 Grupo Interdisciplinar de Sistemas Complejos (GISC), Madrid, Spain
2 Dept. Matemáticas, Universidad Carlos III de Madrid,
Leganés, Madrid, Spain
3 Centro Nacional de Biotecnología (CSIC), Campus de
Cantoblanco, Madrid, Spain
4 Instituto de Biocomputación y Física de Sistemas Complejos
(BIFI), Universidad de Zaragoza, Zaragoza, Spain
E-mail: Corresponding cuesta@math.uc3m.es
Abstract
The genotype-phenotype map is an essential object in our understanding of organismal complexity and adaptive properties, determining at once genomic plasticity and those constraints that may limit the ability of genomes to attain evolutionary innovations. An exhaustive experimental characterization of the relationship between genotypes and phenotypes is at present out of reach. Therefore, several models mimicking that map have been proposed and investigated, leading to the identification of a number of general features: genotypes differ in their robustness to mutations, phenotypes are represented by a broadly varying number of genotypes, and simple point mutations seem to suffice to navigate the space of genotypes while maintaining a phenotype. However, most current models address only one level of the map (sequences and folded structures in RNA or proteins; networks of genes and their dynamical attractors; sets of chemical reactions and their ability to undergo molecular catalysis), such that many relevant questions cannot be addressed. Here we introduce toyLIFE, a multi-level model for the genotype-phenotype map based on simple genomes and interaction rules from which a complex behavior at upper levels emerges, remarkably plastic gene regulatory networks and metabolism. toyLIFE is a tool that permits the investigation of how different levels are coupled, in particular how and where do mutations affect phenotype or how the presence of certain metabolites determines the dynamics of toyLIFE gene regulatory networks. The possibilities of this model are not exhausted by the results presented in this contribution. It can be easily generalized to incorporate evolution through mutations that change genome length or through recombination, to consider gene duplication or deletion, and therefore to explore further properties of extended genotype-phenotype maps.
Author Summary
How the measurable traits of organisms, their phenotypes, emerge from the instructions encoded in genomes, counts amongst the most challenging and essential questions to understand organismal evolution and adaptation. At present, the genotype-phenotype relationship cannot be experimentally evaluated in an exhaustive fashion, since research is mostly limited to analyse the effect that specific mutations have in the fitness of organisms. Therefore, most of our knowledge has been derived from simple models that investigate one-level maps, as RNA sequences and their folded states, or ensembles of chemical reactions and the molecules they can metabolize. Given our current limitations, it is essential to work with models that are as realistic as possible, but keep computational tractability. Here we introduce toyLIFE, a multi-level model that maps genotypes (formed by a variable number of genes and a polymerase protein) into phenotypes. Once interactions between proteins in the model and environmental metabolites are defined, phenotypes correspond to those ensembles of genes able to undertake metabolite catalysis. Other natural properties such as regulatory networks or proteins with multiple functions naturally emerge in toyLIFE, which appears as a powerful tool to explore aspects of the genotype-phenotype map that as yet cannot be experimentally addressed.
Introduction
Describing and understanding the intricacies of the genotype-phenotype map counts amongst the most difficult and most essential issues to comprehend organismal complexity and adaptation through natural selection [1]. High-throughput data obtained from whole genome sequencing and other -omics techniques currently allow a characterization with unprecedented detail of how genotypic variation affects phenotypes. The analysis of gene networks has demonstrated that phenotypes cannot be understood on the basis of isolated genes [2], and that the effects of mutations strongly depend on a genetic background that expresses at different levels before generating a final phenotype [3]. While simple point mutations may affect more than one gene [4], phenotypes, overall, tend to be extremely robust: populations may sustain a high level of criptic variation that acts at once as a buffering mechanism [5] and as a reservoir of variability to promote rapid adaptation [6]. An essential part of our improved understanding of the concepts, design principles and general mechanisms underlying the appearance of biological function from organismal genomes arises from the use of in silico tools and models [7].
The neutral theory of evolution [8, 9] posits that most mutations have no, or very little, effect on phenotypes, and are thus ignored by natural selection. This is an amply supported fact, though the level at which mutations cease to have an effect is a matter of research. DNA is translated into proteins and ribozymes which fold into three-dimensional structures. These molecules bind to each other and to the genome itself, enhancing or inhibiting the expression of genes —hence forming highly complex regulatory networks—, and eventually interact with metabolites to produce the metabolic pathways that sustain cellular life [10]. Redundancy appears at all these levels. Besides the well-known redundancy of the genetic code, many different aminoacid [11] —in the case of proteins— or RNA [12] —in the case of ribozymes— sequences fold into equivalent three-dimensional structures and exhibit similar interaction sites, thus maintaining their functions. Regulatory and metabolic networks are quite robust to additions, eliminations or substitutions of some of their components as well. For instance, regulatory regions with similar transcriptional output often have little overt sequence similarity, both within and between genomes [13]. Also, regulatory DNA sequences in different Drosophila species exhibiting the same expression patterns are not conserved [14]. As of robustness of metabolic networks, one-gene knockout experiments with Saccharomyces cerevisiae show that around 50% of mutants show a selective disadvantage below 1% relative to the wildtype [15]. Similar results have been obtained with Escherichia coli [16].
The huge number of genomic solutions ushering in the same phenotype leads to the concept of genotype networks, that is ensembles of genotypes that yield the same phenotype and can be mutually accessed through mutations [17]. Genotype networks often traverse the whole space of genotypes, and are highly interwoven: virtually any phenotype is just a few mutations away from any other. These networks reflect the robustness of phenotypes against mutations, and their structure is essential to promote adaptability and evolutionary innovation [18, 19]. Most of our knowledge on the topology of genotype networks relies on information obtained from well-motivated computational models that map genotype onto a simplified phenotype. Classical examples mapping sequence to molecular structure (which acts as a proxy for phenotype) are those of RNA [20] or proteins folded through algorithms of variable complexity [21, 22]. Other models have addressed the map between higher expression levels, as those mimicking gene regulatory networks [23, 24, 25] or metabolism [26].
Despite the significant conceptual advances provided by those models, there are two crucial elements of the genotype-phenotype map that they disregard: the existence of a hierarchy of expression levels between genotype and phenotype and the bi-directional coupling among the levels. Studies focusing on RNA or proteins assume that the molecular function is mostly determined by their spatial structure. This makes sense for some very specific enzymes [27] but, in general, these molecules are pieces of complex regulatory or metabolic networks. Further, molecular interactions are not considered (see [28] for an exception modelling the quaternary structure of proteins), and there is no representation of the molecular context [29]. Therefore, cases where a protein may act as an enhancer of the expression of a gene by sticking to its promoter, but may become sequestered and thus inactivated in the presence of another protein are impossible to embody in one-molecule models, among many others.
In turn, models considering higher levels typically disregard the dynamics of underlying sequences. Gene regulatory networks are represented in an effective way through direct interactions among their components, as in Boolean regulatory networks. In this case, gene states are binary variables which interact (enhancing or inhibiting the expression of interacting genes) to determine new states at a subsequent time step [30, 31]. Boolean networks do not consider how mutations at the genome level propagate to upper levels, and only implement straight changes in the Boolean functions. The situation is similar with metabolic models that use the ensemble of metabolic reactions as genotypes, since the kind of mutations considered can thus only be the elimination or addition of reactives or full reactions [26].
The current situation is that we lack a model that captures the essentials of the biology at all levels from genome to metabolisms, but which at the same time is sufficiently simple so as to provide useful answers and insights about the genotype-phenotype mapping. In this paper we make one such proposal, that we refer to as toyLIFE. toyLIFE is a model that contains simplified versions of genes, promoters, proteins, and metabolites, which interact with each other under the laws of a simplified chemistry. Besides introducing the model and showing examples of its rich phenomenology, we identify a number of emerging properties that toyLIFE shares with natural systems. Such are the existence of a large number of robust phenotypes, of common metabolic functions (which arise in the absence of any evolutionary fine-tuning), a space-covering map at the sequence-structure level (as observed in RNA and protein folding models) but a small fraction of metabolically functional genomes. Coupling among different levels restricts the diversity of possible Boolean functions, as well as the metabolites that can be broken. In the framework of toyLIFE, mutations can show their effects at different levels before affecting the phenotype, and functional molecules can be co-opted to fulfill different and not previously foreseen functions.
Results
Definition of toyLIFE
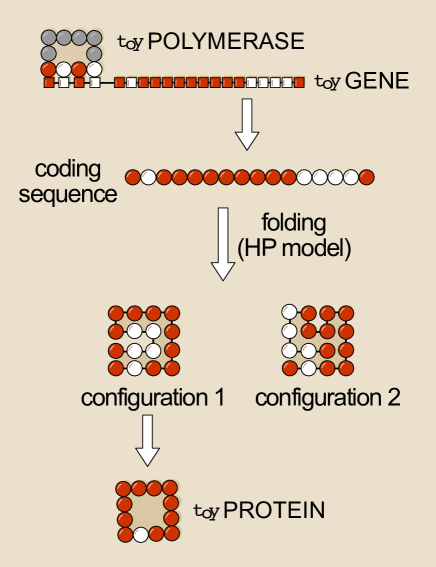
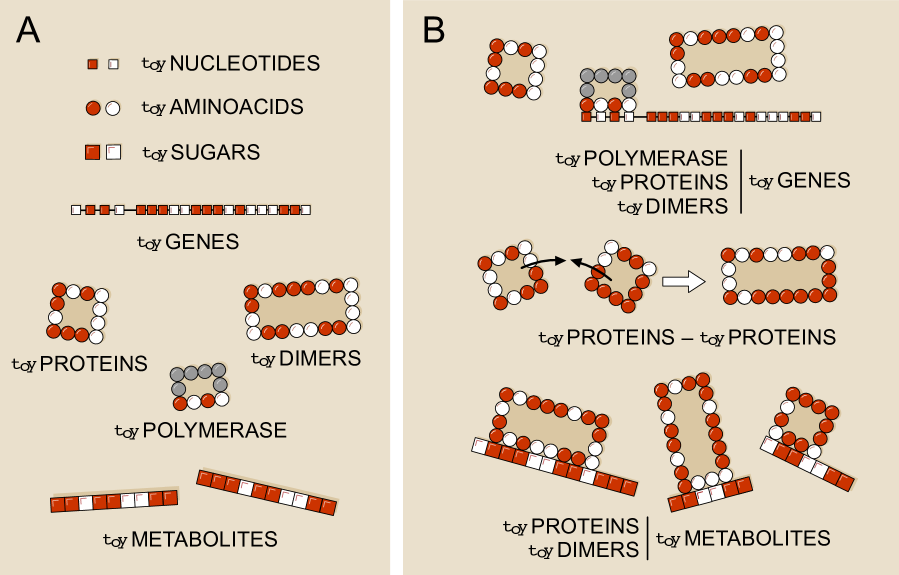
The basic building blocks of toyLIFE are toyNucleotides (toyN), toyAminoacids (toyA), and toySugars (toyS). Each block comes in two flavors: hydrophobic (H) or polar (P). Random polymers of basic blocks constitute toyGenes (formed by 20 toyN units), toyProteins (chains of 16 toyA units), and toyMetabolites (sequences of toyS units of arbitrary length). These elements of toyLIFE are defined on the two-dimensional space (Figure 1).
toyGenes
toyGenes are composed of a 4-toyN promoter region followed by a 16-toyN coding region. There are different promoters and coding regions, leading to toyGenes. An ensemble of toyGenes forms a genotype. If the toyGene is expressed, it will produce a chain of 16 toyA that represents a protein. Translation follows a straightforward rule: H (P) toyN translate into H (P) toyA.
toyProteins
toyProteins correspond to the minimum energy, maximally compact folded structure of the 16 toyA chain arising from a translated gene. Their folded configuration is calculated through the hydrophobic-polar (HP) protein lattice model [21] (see Methods and Figure 6). Two toyProteins can bind to each other to form a toyDimer, which is the only protein aggregate considered in toyLIFE. The toyPolymerase is a special kind of molecule characterized by a specific sequence of 4 toyA and an otherwise indetermined structure. It is always present in the system. In the toyLIFE universe, only the folding energy and perimeter of a toyProtein matter to characterize its interactions, so folded chains sharing these two features are indistinguishable. This is a difference with respect to the original HP model, where different inner cores defined different proteins and the composition of the perimeter was not considered as a phenotypic feature. However, subsequent versions of HP had already included additional traits [32].
Interactions and dynamics
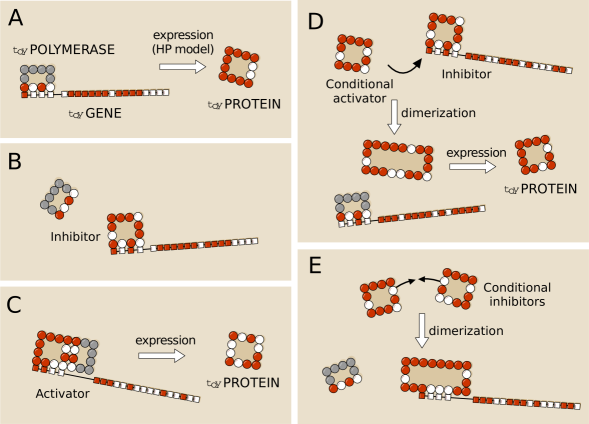
Expression of toyGenes occurs through the interaction with the toyPolymerase, which can bind to promoters but also to other toyProteins (including toyDimers, see Methods and Figure 1A). When the toyPolymerase binds to a promoter, translation is directly activated and the corresponding toyGene is expressed. However, a more stable (lower energy) binding of a toyProtein or toyDimer to a promoter precludes the binding of the toyPolymerase. This inhibits the expresion of the toyGene, except if the toyPolymerase binds to a specific site of the toyProtein/toyDimer, in which case the toyGene can be expressed (Figure 7).
Following the rules of the HP model, H-P and H-H interactions are also used for inter-molecular interactions, and thus to quantify the energy of the bound states toyProtein-toyGene, toyProtein-toyProtein, and toyProtein-toyMetabolite (see Methods and Figure 1). Both the version of the HP model we use and the inter-molecular interactions considered depend on parameters that stand for the decrease in free energy when H-P and H-H bonds are formed: and , respectively (with ), as in [33].
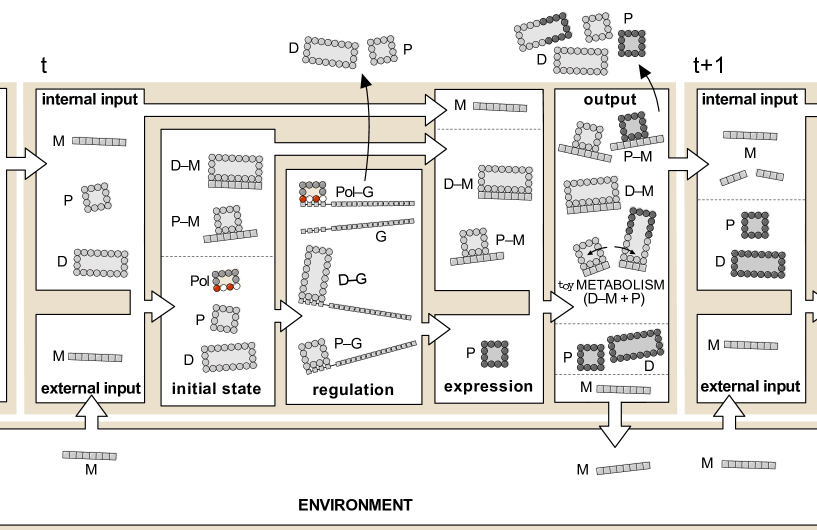
The interaction and dynamical rules in toyLIFE have been chosen so as to make the model as simple as possible, while retaining the essentials of molecular genetics. Following the original HP model (which disregards lattice proteins with multiple minimal energy folds), interactions between toyLIFE elements are univocally defined according to specific disambiguation rules (see Methods). The dynamics of the model proceeds in discrete time steps and variable molecular concentrations are not taken into account. A step-by-step description of toyLIFE dynamics is summarized in Fig. 2. There is an initial set of molecules which results from the previous time step: toyProteins (including toyDimers and the toyPolymerase) and toyMetabolites, either endogenous or provided by the environment. These molecules first interact between them to form possible complexes (see Methods) and are then presented to a collection of toyGenes that is kept constant along subsequent iterations. Regulation takes place, mediated by a competition for binding the promoters of toyGenes, possibly causing their activation and leading to the formation of new proteins. toyProteins/toyDimers not bound to any toyMetabolite disappear in this phase. Thus, only the newly expressed toyProteins and the complexes involving toyMetabolites in the input set remain. All these molecules interact yet again (see Methods), and here is where catalysis can occur (see below). Free toyProteins/toyDimers will form part of the input set for the next time step. However, toyProteins/toyDimers bound to toyMetabolites disappear in this phase, and only the toyMetabolites are kept as input to the next time step. Unbound toyMetabolites are returned to the environment.
toyProteins behave as toyGene switches
The minimal interaction rules that define toyLIFE dynamics endow toyProteins with a set of possible activities not included a priori in the rules of the model (see Figure 7). For example, since the 4-toyN interacting site of the toyPolymerase cannot bind to all promoter regions, translation mediated by a toyProtein or toyDimer binding might allow the expression of genes that would otherwise never be translated. These toyProteins thus act as activators. This process finds a counterpart in toyProteins that bind to promoter regions more stably than the toyPolymerase does, and therefore prevent gene expression. They are acting as inhibitors. There are two additional functions that could not be foreseen and involve a larger number of molecules. A toyProtein that forms a toyDimer with an inhibitor —preventing its binding to the promoter— effectively behaves as an activator for the expression of the toyGene. However, it interacts neither with the promoter region nor with the toyPolymerase, and its activating function only shows up when the inhibitor is present. This kind of toyProteins thus act as conditional activators. On the other hand, two toyProteins can bind together to form a toyDimer that inhibits the expression of a particular toyGene. As the presence of both toyProteins is needed to perform this function, they behave as conditional inhibitors. This flexible, context-dependent behavior of toyProteins, permits the construction of toy Gene Regulatory Networks (toyGRN).
Gene regulatory networks in toyLIFE are deterministic Boolean networks
Molecular interactions and dynamical rules in toyLIFE can be translated into toyGRN that behave as deterministic Boolean networks [30, 31]. The corresponding Boolean variables are the states (expressed or not expressed) of toyGenes. These variables are transformed through Boolean functions that represent the dynamical rules described, having as input current toyGene states and as output their states at the next time step. Boolean functions depend on the toyProteins present in the system and on the functions they perform. Through iteration of the Boolean map one can characterize the set of attractors of the dynamics and the corresponding basins of attraction.
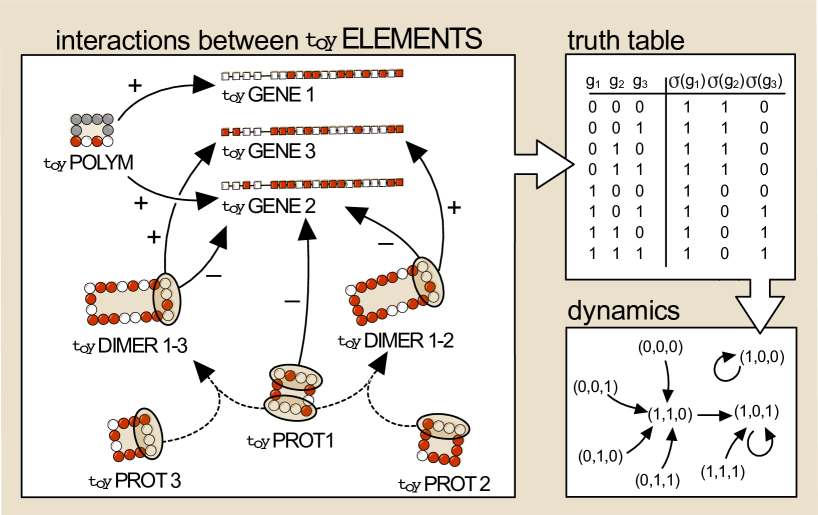
If the initial set is formed by genes, we should consider different possible vectors of dimension that correspond to the initial states (i.e. all combinations of genes being expressed (1) or not expressed (0)). First, the presence of possible toyDimers coming from expressed genes is evaluated, and then their interactions with promoter regions (in competition or cooperation with the toyPolymerase and other toyProteins) are evaluated. This yields an updated set of expressed toyGenes (a different state) to which the previous rules are again applied. In this way, one can construct a truth table that can be subsequently represented in the form of a directed graph (indicating which state maps into which other) and is fully analogous to a deterministic Boolean network. An example of a Boolean network derived from a system of three genes is represented in Figure 3.
Boolean networks of toyLIFE depend on metabolism
The presence of toyMetabolites may modify toyGRN by changing the output states of the corresponding Boolean network (Figure fig:truthmet). According to the dynamical rules of toyLIFE, toyMetabolites may interact with toyProteins or toyDimers. Any molecule bound to a toyMetabolite is no longer available to bind to promoters, and therefore the expression of the toyGRN is modified.
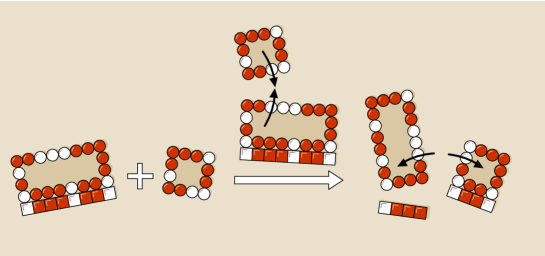
toyMetabolites that do not bind to any toyProtein or toyDimer will not be in the input set for the next time step. On the other hand, bound toyMetabolites will, unless catalysis occurs. Catalysis happens when, once a bound state toyMetabolite-toyDimer is formed, an additional toyProtein binds to one of the units of the toyDimer with an energy lower than that of the initial toyDimer. In this case, the latter disassembles in favor of the new toyDimer, and in the process the toyMetabolite is broken (see Figure fig:metabolism for an illustration of the catalysis process). The two pieces of the toyMetabolite will contribute to the input set at the next time step. An example of how a toyGRN might change can be derived from Figure 3: if a toyMetabolite able to bind to toyDimer 1-3 is added to the input set, state is mapped to (Figure fig:truthmet).
Metabolons
The behavior just described prompts the identification of metabolically functional genotypes that we term metabolons.111The term metabolon was first proposed by Paul A. Srere [34] in 1985 to refer to a “supramolecular complex of sequential metabolic enzymes and cellular structural elements”, and is here used as a conceptual analogue. A metabolon in toyLIFE is an ensemble of toyGenes able to catalyze at least one toyMetabolite. In the example above, the three toyGenes are a basic metabolon that catalyzes in particular the toyMetabolite used as example.
When the toyMetabolite is absent, the dynamics is described in Figure 3 and eventually converges to the steady state —except if the initial state is . This state is however disturbed under a constant supply of toyMetabolites able to bind to toyDimer 1-3. In that case, toyGenes 1 and 2 are expressed in the next time step. toyProtein 1 is able to form a toyDimer with itself, binding to unit 1 of the toyDimer-toyMetabolite complex. This latter interaction (which forms toyDimer 1-1) is favored over toyDimer 1-3 and catalysis of the toyMetabolite occurs(see Figures fig:truthmet and fig:metabolism). If at the next time step the two pieces of toyMetabolite are unable to interact with any of the toyProteins in the system, they are eliminated. The toyGRN of this example remains in the new steady state —which is also able to catalyze— as long as toyMetabolites are supplied. The three toyGenes system returns to the former steady state as soon as the external supply stops. A graphical summary of a metabolon in toyLIFE is provided in Figure fig:operon.
The genotype-phenotype map in toyLIFE
toyLIFE integrates several levels of complexity: genotypes (sequences of toyGenes) expressing toyProteins (first level) that interact among themselves and with promoters generating toyGRNs (second level), and interactions with the environment (third level) trough catalysis of toyMetabolites. Genotypes are easily identified as the sequences of Hs and Ps making up toyGenes. In toyLIFE, the visible expression of the genotype is best represented through its interaction with the environment, that is with toyMetabolites. Accordingly, the phenotype of a genotype (a collection of toyGenes) is defined as the ensemble of toyMetabolites it can catalyze. There are different toyMetabolites of size 8, and a genotype can either catalyze (in which case it is a metabolon) or not each of them. The phenotype is formally defined as a vector of dimension whose components take value 1 at those positions corresponding to toyMetabolites that can be catalyzed, and value 0 otherwise. This definition is analogous to others in the literature where metabolic activity is explicitely modelled [26].
Point mutations might affect different levels
As it has been defined, there are no mutations of toyGenes explicitly considered in the dynamics of toyLIFE. The initial sequences of toyGenes remain constant as we study properties of the emerging toyGRN and related phenotypes. This nonetheless, those conditions do not prevent an analysis of the effect of mutations in the phenotype. Actually, an interesting product of the multi-level structure of toyLIFE is the possibility of determining at which level is the effect of point mutations observed. Point mutations are changes from a P toyN to an H toyN, or vice versa, in the sequence of a toyGene.
A summary of changes caused by point mutations in the metabolon in Fig. 3 can be found in Table 1. Those effects are not exclusive, that is, a mutation causing a change in the perimeter of a toyProtein can leave other functions unchanged, or modify Boolean functions in different ways which might eventually cause —or not— a phenotypic change. Out of the possible mutations ( affecting the promoters and affecting the coding regions), are neutral, are deleterious, and only are beneficial. The latter are defined as those mutations enabling the genotype to catalyze more toyMetabolites than before. Out of deletereous mutations, are lethal (that is, of the total). This is a very high percentage of lethal mutations, compared with an average metabolon —the average percentage of lethal mutations, in metabolons chosen at random, is . However, note that this metabolon is not special in any way: in particular, since it is not a product of evolution and selection, it needs not have high robustness a priori. The exploration of genotype space through neutral paths can likely lead to metabolons with specific properties, as a higher number of neutral neighbors or a decreased effect of mutations on phenotype.
| Effect of mutations | Tot | Neu | Adv | Del | Let |
|---|---|---|---|---|---|
| Different toyProtein folding (same perimeter & Boolean function) | 3 | 3 | 0 | 0 | 0 |
| Different toyProtein folding & perimeter (same Boolean function) | 4 | 3 | 0 | 1 | 1 |
| Different toyProtein folding & perimeter & Boolean function | 41 | 1 | 1 | 39 | 38 |
| Changes in Boolean functions due to the promoter | 12 | 2 | 0 | 10 | 10 |
| 60 | 9 | 1 | 50 | 49 |
Functional properties of three-toyGenes genotypes
The genotype-phenotype map in toyLIFE is highly redundant and displays ample variations in the number of genotypes representing the same phenotype. Redundancy comes not only from neutral mutations, but also from the existence of compensatory mutations and genomic solutions with mutations in many toyN that yield the same phenotype. The redundancy of the HP model has been discussed in the literature [33, 35] and is, through the interaction rules of toyLIFE, non-trivially extended to the formation of molecular aggregates and catalytic processes. These are qualitative features that toyLIFE shares with natural systems and that we quantify in the following.
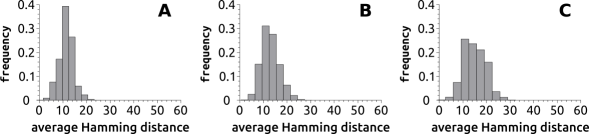
We begin by analyzing the navigability of the genotype space. To this end we use metabolons similar to the one represented in Fig. 3 and perform random walks on their neutral space. That is, we take three initial gene sequences, which form a genotype (or genome) of length . After making sure this genome is able to catalyze at least one toyMetabolite, we attempt a point mutation at a randomly chosen genome site. If the phenotype of the mutant is identical to that of the previous genome, the mutation is accepted; otherwise, the mutation is discarded and, in either case, the process is repeated. Mutations do not affect the toyPolymerase. The mutation process is attempted a variable number of times (that is, the random walks are of different lengths: , or ), and repeated for a large number of independent realizations ( random walks for each one of original genotypes). In this way, we obtain the histograms shown in Figure 4. The average number of accumulated substitutions, i.e. the Hamming distance between the original genome and the current one, grows with the number of mutations attempted, yielding genomes that increasingly differ from their ancestors. This behavior is fully analogous to that observed in RNA secondary structure neutral networks [12], in proteins [36], and in one-level models of gene regulatory networks [24] or metabolism [26].

Next, we have exhaustively explored the space of genotypes consisting of three toyGenes and evaluated their ability to break toyMetabolites of size 8. In total, there are around metabolons out of the total of three-toyGenes genomes —the number of combinations of all possible toyGenes, , in groups of three, with repetitions. That is, only about of all possible genomes are able to catalyze toyMetabolites of size 8. In agreement with the definition of phenotype given above, there are up to different phenotypes. However, only different phenotypes can be realized by three-toyGene genomes, yielding an average close to metabolons per phenotype. This average is however not very informative, since the variation in phenotype abundance is enormous (Fig. 5A). There is also ample variability in the characteristics of phenotypes. Most toyMetabolites are broken by around genomes, but some of them can be broken by far fewer genomes (see Fig. 5B), and some toyMetabolites cannot be broken by any genome at all. Specifically, there are toyMetabolites that cannot be broken. They have a particular composition or structure, since they contain consecutive H or P sugars (there are such toyMetabolites) or are palindromes (a total of additional toyMetabolites). In both cases, only symmetrical toyDimers can bind to these toyMetabolites —asymmetrical toyDimers give rise to ambiguous interactions and are discarded. But symmetrical toyDimers bound to a given toyMetabolite cannot be broken by any toyProtein, because both subunits forming the toyDimer have the same perimeter and, again, this gives rise to ambiguous interactions.
Finally, many Boolean functions are obtained from different genotypes. For genes, there are different Boolean functions, because for each of the possible inputs there are possible outputs. For three genes, this is already a very large number, Boolean functions. Figure 5C represents the abundances of Boolean functions. As can be seen, there is a highly unequal representation in terms of genotypes, and only about 10% of all possible Boolean functions are actually represented by at least one genotype.
Discussion
Despite their simplicity, models of the genotype-phenotype map provide important conceptual insights. Not only that, some of them have been able to capture qualitative and quantitative features of the natural systems they aimed at representing. However important details might be, these are occasionally offset by universal rules that determine the emerging phenomenology and statistical behavior both of biological systems and their in silico cartoons. For instance, the HP model of protein folding, which disregards the fine chemical structure of aminoacids and constrains HP polymers to fold on regular lattices, is able to predict the existence of unique folding states for sufficiently large polymers and the formation of hydrophobic cores, among others, in agreement with empirical knowledge [37]. Computational studies of RNA sequences folding into their minimal energy secondary structure have enlightened a large number of dynamical and structural properties with a clear empirical counterpart, such as punctuated equilibria at the molecular level [38] or increases in robustness with phenotype size [39], a feature that is quantitatively shared by all genotype-phenotype maps studied to date [33, 40, 28, 41]. Boolean networks, despite working with a sharp threshold for gene expression, have witnessed notable success, including faithful reproduction of living cell cycles [42]. toyLIFE constructs a multi-level genotype-phenotype map from simple interactions inspired by the HP model from which the logical architecture of Boolean networks emerges. The addition of metabolic abilities arises as a natural extension of the basic model.
The possibilities of toyLIFE are not exhausted by the cases presented in this work, which constitute a minimal —hopefully illustrative— sample of the kind of complexity toyLIFE might encode for. In devising the model here analyzed, we had to make some choices regarding energy parameters, number of molecules or genes allowed to interact, or disambiguation rules to define functional molecules. Preliminary analyses of equally reasonable alternatives indicate that toyLIFE universes defined through similar rules display a phenomenology comparable to the one here presented. Still, a deeper exploration of certain emergent behaviors seems worth pursuing. First, toyLIFE gives clues on the level —between genotype and phenotype— where the effect of mutations can be seen. Distance between phenotypes is simple to define in toyLIFE, and a more systematic analysis might allow as well a quantitative comparison with empirical studies measuring the distribution of fitness effects [43]. This function is an important object in developing models of phenotypic change that effectively incorporate the molecular details of evolution. Second, even the three-toyGenes genomes here studied reveal the emergence of functional abilities not implemented in the basic rules of the model, such as toyProteins behaving as conditional activators. This observation indicates that a protein can be recruited in appropriate molecular contexts to perform additional functions, that is, it can be co-opted to develop a second useful, but non-adaptive, role [29]. The consideration of larger genomes and larger molecular aggregates should certainly usher in new collective abilities, and very often lead to multi-functional toyProteins. In this scenario, the effect of single mutations might then arise at multiple levels, likely revealing a pleiotropic structure [4] in the toyLIFE genotype-phenotype map. The effect of point mutations at different levels and the fraction of neutral or lethal mutations, among others, would be relevant issues to explore. It will also be interesting to study how different metabolons are fit together in a larger genome, developing more complex metabolic networks than the ones shown in this paper. Third, it would be worth comparing the statistical properties of random Boolean networks and other gene regulatory networks with those obtained from toyLIFE. An open and challenging question is how an explicit consideration of genome dynamics modifies or constrains the statistical properties of genotype-phenotype models that discard them. Fourth, for three-toyGenes genomes, we have observed a very high dilution of metabolons in comparison to genomes that cannot break any of the toyMetabolites considered. This result is in qualitative agreement with models of gene regulatory networks [24] and metabolism [26] that ignore lower levels. An open question is how this dilution changes as we increase the number of participating toyGenes and diversify the set of toyMetabolites that should be catalysed. At present, this study is severely limited by the computational time it requires. Finally, it is easy to implement additional mutational mechanisms in toyLIFE, such as gene duplication or deletion. The implications of such a change on the phenotype cannot be foreseen without an explicit analysis. However, we have found two-toyGenes metabolons whose function is maintained when a third toyGene is added. In this respect, toyLIFE might provide complementary insight on the evolutionary effects of gene duplication, including their lethality and their ability to develop new functions [44, 45].
Conclusions
The design of models able to shed light on the complex structure of the genotype-phenotype map is actively pursued. Research in the field has led to the identification of a number of generalities, as the broadly varying robustness of genotypes, the unequal distribution of phenotype sizes or the existence of genotype networks that permit the navigability of the space of genotypes —and thus adaptation and evolutionary innovation— while preserving function. However, some other issues still represent a challenge, as the effect of mutations in fitness or the precise mechanisms constraining evolution as a result of the bottom-up and top-down coupling among intermediate levels in the genotype-phenotype map. toyLIFE and possible variants thereof might provide a useful framework to explore these and related questions.
Methods
Folding of toyProteins and molecular interactions in toyLIFE
The folding of toyProteins exactly follows the folding of HP random polymers first introduced in [21]. We consider sequences of length 16 and limit the possible folds to compact structures on a lattice. There are 38 such structures ignoring symmetries. The energy of a fold is the sum of all pairwise interaction energies between toyAminoacids that are not contiguous along the sequence. Pairwise interaction energies are , and , as in [33]. The structure of a toyProtein is its lowest energy fold. If there is more than one fold with the same minimum energy, we select the one with fewer H toyAminoacids in the perimeter. If still there is more than one fold fulfilling both conditions, we discard that protein by assuming that it is intrinsically disordered and thus non-functional [46]. Out of possible proteins, do not yield unique folds. We find different toyProteins with different perimeters.
toyProteins interact through any of their sides with other toyProteins (to form toyDimers), with promoters of toyGenes, and with toyMetabolites. Once formed, toyDimers can also bind to promoters or toyMetabolites through any of their sides (binding to other toyProteins or toyDimers is not permitted). In all cases, the interaction energy () is the sum of pairwise interactions for all HH, HP and PP pairs formed in the contact. Bonds can be created only if the interaction energy between the two molecules is lower than a threshold energy . Note that a minimum binding energy threshold is necessary to avoid the systematic interaction of any two molecules. Other alternatives might be the addition of terms that represent an energetic cost222In other models, as in RNA folding, the threshold is set to 0 because structural elements such as loops or dangling ends yield positive contributions to the total folding energy. or the consideration of stochastic interactions, such that those with higher energy would be less probable. If below threshold, the total energy of the resulting complex is the sum of plus the folding energy of all toyProteins involved. The lower the total energy, the more stable the complex. When several toyProteins or toyDimers can bind to the same molecule, only the most stable complex is formed. Consistently with the assumptions for protein folding, when this rule does not determine univocally the result, no binding is produced.
toyPolymerase is a special kind of toyProtein. It only has one interacting side (with sequence HPHP) and its folding energy is fixed to value . toyPolymerase binds to promoters or to the right side of a toyProtein/toyDimer already bound to a promoter. In either case the toyGene is expressed.
As the length of toyMetabolites is usually longer than 4 toyN (the length of interacting toyProteins sites), there might be several positions where the interaction with a toyProtein has the same energy. In those cases we select the sites that yield the most centered interaction. If ambiguity persists, no bond is formed. Also, no more than one toyProtein/toyDimer is allowed to bind to the same toyMetabolite, even if its length would permit it. toyProteins/toyDimers bound to toyMetabolites cannot bind to promoters.
Binding to promoters is decided in sequence. Starting with any of them (the order is irrelevant), it is checked whether any of the toyProteins/toyDimers available bind to the promoter, and then whether toyPolymerase can subsequently bind to the complex and express the accompanying coding region. If it does, the toyGene is marked as active and the toyProtein/toyDimer is released. Then a second promoter is chosen and the process repeated, until all promoters have been evaluated. toyGenes are only expressed after all of them have been marked as either active or inactive. Each expressed toyGene produces one single toyProtein molecule. There can be more units of the same toyProtein, but only if multiple copies of the same toyGene are present.
Acknowledgments
This work was supported through projects FIS2011-22449 (CFA, PC and JAC) and FIS2011–27569 (SM) of the Spanish MINECO.
References
- 1. Lewis NE, Nagarajan H, Palsson BO (2012) Constraining the metabolic genotype-phenotype relationship using a phylogeny of in silico methods. Nat Revs Microbiol 10: 291–305.
- 2. Karlebach G, Shamir R (2008) Modelling and analysis of gene regulatory networks. Nat Revs Mol Cell Biol 9: 770–780.
- 3. Chandler CH, Chari S, Dworkin I (2013) Does your gene need a background check? How genetic background impacts the analysis of mutations, genes, and evolution. Trends Genet 29: 358–366.
- 4. Wagner GP, Zhang J (2011) The pleiotropic structure of the genotype-phenotype map: the evolvability of complex organisms. Nat Revs Genet 10: 204–213.
- 5. Rutherford SL (2000) From genotype to phenotype: buffering mechanisms and the storage of genetic information. BioEssays 22: 1095–1105.
- 6. Paaby AB, Rockman MV (2014) Cryptic genetic variation: evolution’s hidden substrate. Nat Revs Genet 15: 247–258.
- 7. Ventura BD, Lemerle C, Michalodimitrakis K, Serrano L (2006) From in vivo to in silico biology and back. Nat 443: 527–533.
- 8. Kimura M (1968) Evolutionary rate at the molecular level. Nature 217: 624–626.
- 9. Kimura M (1984) The neutral theory of molecular evolution. Cambridge University Press.
- 10. Watson JD, Baker TA, Bell SP, Gann A, Levine M, et al. (2013) Molecular biology of the gene, 7th edition. Benjamin Cummings.
- 11. Lipman DJ, Wilbur WJ (1991) Modelling neutral and selective evolution of protein folding. Proc Roy Soc London B 245: 7–11.
- 12. Schuster P, Fontana W, Stadler PF, Hofacker IL (1994) From sequences to shapes and back: A case study in RNA secondary structures. Proc Roy Soc London B 255: 279–284.
- 13. Weirauch MT, Hughes TR (2010) Conserved expression without conserved regulatory sequence: the more things change, the more they stay the same. Trends Genet 26: 66–74.
- 14. Hare EE, Peterson B, Iyer VN, Meier R, Eisen MB (2008) Sepsid even-skipped enhancers are functionally conserved in Drosophila despite lack of sequence conservation. PLoS Genet 4: e1000106.
- 15. Thatcher J, Shaw JM, Dickinson W (1998) Marginal fitness contributions of nonessential genes in yeast. Proc Natl Acad Sci USA 95: 253–257.
- 16. Baba T, Ara T, Hasegawa M, Takai Y, Okumura Y, et al. (2006) Construction of Escherichia coli K-12 in-frame, single-gene knockout mutants: the Keio collection. Mol Sys Biol 20: 2006.0008.
- 17. Wagner A (2011) Genotype networks shed light on evolutionary constraints. Trends Ecol Evol 26: 577–584.
- 18. Draghi JA, Parsons TL, Wagner GP, Plotkin JB (2010) Mutational robustness can facilitate adaptation. Nature 463: 353–355.
- 19. Wagner A (2011) The origins of evolutionary innovations. Oxford University Press.
- 20. Schuster P (2006) Prediction of RNA secondary structures: From theory to models and real molecules. Rep Prog Phys 69: 1419–1477.
- 21. Dill KA (1985) Theory for the folding and stability of globular proteins. Biochemistry 24: 1501–1509.
- 22. Bastolla U, Vendruscolo M, Knapp EW (1999) A statistical mechanical method to optimize energy functions for protein folding. Proc Natl Acad Sci USA 97: 3977–3981.
- 23. Kauffman SA (1993) The origins of order: self-organization and selection in evolution. New York: Oxford University Press.
- 24. Ciliberti S, Martin OC, Wagner A (2007) Innovation and robustness in complex regulatory gene networks. Proc Natl Acad Sci USA 104: 13591–13596.
- 25. Payne JL, Moore JH, Wagner A (2013) Robustness, evolvability, and the logic of genetic regulation. Artificial Life 20: 111–126.
- 26. Rodrigues JFM, Wagner A (2009) Evolutionary plasticity and innovations in complex metabolic reaction networks. PLoS Comp Biol 5.
- 27. Schultes EA, Bartel DP (2000) One sequence, two ribozymes: implications for the emergence of new ribozyme folds. Science 289: 448–452.
- 28. Greenbury SF, Johnston IG, Louis AA, Ahnert SE (2014) A tractable genotype-phenotype map modelling the self-assembly of protein quaternary structure. J R Soc Interface 6: 20140249.
- 29. Piatigorsky J (2007) Gene sharing and evolution: the diversity of protein functions. Harvard University Press Cambridge MA.
- 30. Kauffman SA (1969) Metabolic stability and epigenesis in randomly constructed genetic nets. J Theor Biol 22: 437–467.
- 31. Cheng D, Qi H, Li Z (2011) Analysis and control of boolean networks. Springer.
- 32. Hoque T, Chetty M, Sattar A (2009) Extended HP model for protein structure prediction. J Comp Biol 16: 85–103.
- 33. Li H, Helling R, Tang C, Wingreen N (1996) Emergence of preferred structures in a simple model of protein folding. Science 273: 666–669.
- 34. Srere PA (1985) The metabolon. Trends Biochem Sci 10: 109–110.
- 35. Holzgräfe C, Irbäck A, Troein C (2011) Mutation-induced fold switching among lattice proteins. J Chem Phys 135: 195101.
- 36. Babajide A, Hofacker IL, Sippl MJ, Stadler PF (1997) Neutral networks in protein space: a computational study based on knowledge-based potentials of mean force. Folding & Design 2: 261–269.
- 37. Lau KF, Dill KA (1989) A lattice statistical mechanics model of the conformational and sequence spaces of proteins. Macromolecules 22: 3986–3997.
- 38. Huynen MA, Stadler PF, Fontana W (1996) Smoothness within ruggedness: The role of neutrality in adaptation. Proc Natl Acad Sci USA 93: 397–401.
- 39. Aguirre J, Buldú JM, Stich M, Manrubia SC (2011) Topological structure of the space of phenotypes: the case of RNA neutral networks. PLoS ONE 6: e26324.
- 40. Bloom JD, Raval A, Wilke CO (2007) Thermodynamics of neutral protein evolution. Genetics 175: 255–266.
- 41. Dall’Olio GM, Bertranpetit J, Wagner A, Laayouni H (2014) Human genome variation and the concept of genotype networks. PLoS ONE 9: e99424.
- 42. Davidich MI, Bornholdt S (2008) Boolean network model predicts cell cycle sequence of fission yeast. PLoS ONE 3: e1672.
- 43. Eyre-Walker A, Keightley PD (2007) The distribution of fitness effects of new mutations. Nat Rev Genet 8: 610–618.
- 44. Lynch M, Conery JS (2000) The evolutionary fate and consequences of duplicate genes. Science 290: 1151–1155.
- 45. Kondrashov FA (2012) Gene duplication as a mechanism of genomic adaptation to a changing environment. Proceedings of the Royal Society B: Biological Sciences : rspb20121108.
- 46. Radivojac P, Iakoucheva LM, Oldfield CJ, Obradovic Z, Uversky VN, et al. (2007) Intrinsic disorder and functional proteomics. Biophys J 92: 1439–1456.
Supporting Information