The Persistence of Wishful Thinking:
Response to “Updated Thinking on Positivity Ratios”
A slightly abridged version of this article was published in American Psychologist 69, 629–632 (2014), http://dx.doi.org/10.1037/a0037050 © 2014 American Psychological Association
This article may not exactly replicate the final version published in the APA journal. It is not the copy of record.
Running Head: Response on positivity ratios
Author note
Nicholas J. L. Brown, New School of Psychotherapy and Counselling, London, UK;
Alan D. Sokal, Department of Physics, New York University
and Department of Mathematics, University College London;
Harris L. Friedman,
School of Psychology and Interdisciplinary Inquiry, Saybrook University and
Department of Psychology, University of Florida.
Abstract
We analyze critically the renewed claims made by Fredrickson (2013) concerning positivity ratios and “flourishing,” and attempt to disentangle some conceptual confusions; we also address the alleged empirical evidence for nonlinear effects. We conclude that there is no evidence whatsoever for the existence of any “tipping points,” and only weak evidence for the existence of any nonlinearity of any kind. Our original concern, that the application of advanced mathematical techniques in psychology and related disciplines may not always be appropriate, remains undiminished.
Keywords: Positivity ratio, tipping point, nonlinear dynamics, nonlinearity, positive psychology.
Recently we (Brown, Sokal, & Friedman, 2013) debunked the widely-cited claim made by Fredrickson and Losada (2005) that their use of a mathematical model drawn from nonlinear dynamics (namely, the Lorenz equations from fluid dynamics) provided theoretical support for the existence of a pair of critical positivity-ratio values (2.9013 and 11.6346) such that individuals whose ratios fall between these values will “flourish,” whereas people whose ratios lie outside this ideal range will “languish.”111 After the publication of Brown et al. (2013), Andrés Navas kindly drew our attention to his article (Navas, 2011) in which a very similar (though briefer) critique of Losada (1999) was made. [This footnote was unfortunately omitted from the published version of this article, due to space limitations.] For lack of space in our previous article, we refrained from addressing, except in passing, the question of whether there might be empirical evidence for the existence of one or more critical positivity ratios (“tipping points”). In response to our critique, Fredrickson and Losada (2013) withdrew their nonlinear-dynamics model, but Fredrickson (2013) reaffirmed some claims concerning positivity ratios on the basis of empirical studies. We would therefore like to comment briefly on these claims and the alleged supporting evidence.
The principal stated goal of Fredrickson (2013) was “to update the empirical evidence for the value and nonlinearity of positivity ratios” (p. 814). Unfortunately, that article is extremely unclear about which claims the author has opted to renounce and which she has chosen to reaffirm. This unclarity is, alas, compounded by that in Fredrickson and Losada’s (2013) subsequently issued “correction” to Fredrickson and Losada (2005), which formally withdrew the “modeling element” and “model-based predictions” of this latter paper but failed to identify which, if any, of Fredrickson’s (2013) arguments might also be impacted by this withdrawal. In the present article, we refrain from second-guessing on this question and instead concentrate on the published scientific literature: that is, our critique focuses on Fredrickson (2013) as written.
To clarify what is at stake, consider the following sequence of successively weaker claims for the behavior of “degree of flourishing” as a function of the positivity ratio (see also Figure 1):222 For simplicity we consider here only the claims concerning the alleged lower critical positivity ratio (2.9013). Similar considerations apply also to the claims concerning the alleged upper critical positivity ratio (11.6346).
-
1.
There is a discontinuous phase transition (“tipping point”) exactly at 2.9013.
-
2.
There is a discontinuous phase transition somewhere around 3.
-
3.
There is a rapid change somewhere around 3.
-
4.
There is an inflection point (separating convexity from concavity) somewhere around 3.
-
5.
There is an inflection point (separating convexity from concavity) somewhere.
-
6.
There is some nonlinearity somewhere.
 |
 |
| (a) | (b) |
 |
 |
| (c) | (d) |
Fredrickson and Losada (2005) made claim #1; Fredrickson (2009, especially Chapter 7) reaffirmed claim #1 but noted that, because of “impurities” and measurement imprecision (p. 129), the data might look in practice more like claim #2 or #3. What does Fredrickson (2013) assert? Alas, this is shrouded in confusion. The only reason for even considering the possibility of a discontinuous phase transition was the nonlinear-dynamics model based on the Lorenz equations, which we (Brown et al., 2013) have shown to be entirely groundless and which Fredrickson and Losada (2013) have now withdrawn. Nevertheless, Fredrickson (2013, p. 819) insisted that such a transition remains a viable possibility: “Whether the outcomes associated with positivity ratios show discontinuity and obey one or more specific change points, however, merits further test.” Indeed, Fredrickson (2013, p. 818) continued to insist that even the original claim #1 remains a viable possibility: “The question … is whether positivity ratios obey one or more critical tipping points, and if so, whether those critical tipping points coincide with the ones identified by Losada’s mathematical work for all individuals, samples, and subgroups. Clearly, these questions merit further test.” [This latter contention is somewhat puzzling in the light of our demonstration (Brown et al., 2013, pp. 811–812), not refuted or even addressed by Fredrickson (2013), that the mathematical model of Fredrickson and Losada (2005) does not make any definite predictions for the “critical tipping points,” since those depend on completely arbitrary choices of the constants , , and .] But despite these insistences that a discontinuous phase transition remains a viable possibility, Fredrickson (2013) did not present any evidence that such a discontinuity occurs or is even plausible. Rather, in summarizing recent empirical work that in her view supports the existence of nonlinearity, she appeared to be arguing for claim #4, #5 or #6 (it is not clear which). We will address this empirical evidence below.
Fredrickson (2013) also did not make clear whether she was continuing to advocate the use of nonlinear-dynamics models as in Fredrickson and Losada (2005), or merely arguing for the investigation of nonlinear relations between variables along the lines just discussed. These are two quite different matters, but Fredrickson sometimes wrote as if they were interchangeable. For example:
Thus, while Brown and colleagues (2013) urged caution in the use of nonlinear dynamics, I will show that the available evidence makes clear that researchers investigating affective phenomena need to recognize and mathematically address growing evidence for nonlinearity in their data. (Fredrickson, 2013, pp. 816–817)
Though her empirical evidence concerned only the question of nonlinear relations, at some points in her article she forcefully advocated the use of (unspecified) nonlinear-dynamics models. For instance, while conceding that “the nonlinearity evident in human emotion systems may not be best modeled by the specific set of differential equations that Losada proposed,” she nevertheless remained “convinced of the need to identify and test mathematical and statistical models that are sensitive to nonlinear, recursive, and dynamic effects” (p. 817). She further argued that since “human emotions are clearly dynamic, multicomponent systems that show self-sustaining upward and downward spirals sensitive to changing circumstances,” it therefore follows (according to her) that “system dynamics, network analysis, agent-based modeling, and other systems science approaches are likely to become ever more relevant to affective science and positive psychology” (p. 820). Indeed, Fredrickson (2013) was not yet prepared to abandon the attempt to model the time evolution of human emotions using the Lorenz equations: “Whether the Lorenz equations — the nonlinear dynamic model we’d adopted — and the model estimation technique that Losada utilized can be fruitfully applied to understanding the impact of particular positivity ratios merits renewed and rigorous inquiry” (p. 814).333 In fact, there is no evidence in any of the three published articles (Losada, 1999; Losada & Heaphy, 2004; Fredrickson & Losada, 2005) that Losada or his colleagues utilized any “model estimation technique” (see Brown et al., 2013, pp. 806–808, 811). Let us stress that we have no objection in principle to such models, but simply insist that valid applications of differential equations must meet the criteria VA1–VA5 set forth in our article (Brown et al., 2013, pp. 804–805).
Let us now turn to the empirical evidence bearing on claims #1–6, which should in turn be compared against two alternative scenarios:
-
7.
There is a positive (but substantially linear) correlation between the positivity ratio and “degree of flourishing.”
-
8.
There is no correlation between the positivity ratio and “degree of flourishing.”
Fredrickson and Losada (2005) studied two samples of college students and purported to find empirical evidence in favor of claim #1. Unfortunately, their study design and method of analysis were such that no data whatsoever from these could provide any evidence for any nonlinearity (i.e., even the weakest claim #6) — because the information that might provide this evidence was discarded at an early stage, when participants were dichotomized, based on their scores on a 33-item questionnaire of positive psychological and social functioning, as “flourishing” or “nonflourishing.” Although the subsequent finding that the mean positivity ratio in the “flourishing” group was significantly higher than in the “nonflourishing” group provides some evidence of a positive correlation between the positivity ratio and “degree of flourishing” (i.e., evidence against scenario #8)444 Let us mention in passing that the reported result for Sample 2 [] yields (one-tailed); it is not correct to claim statistical significance by rounding this down to (p. 684)! Also, it is debatable whether it is valid to use a one-tailed test to determine whether the means of two groups are different, absent strong theoretical or logical reasons, independent of the theory under test, for believing that the first mean (for instance) must necessarily be greater than or equal to the second. , this result is perfectly compatible both with a linear correlation (scenario #7) and with a nonlinear correlation (claim #6); the dichotomized data are totally incapable of distinguishing these two alternatives. The fact that “these mean ratios flanked the 2.9 ratio,” which Fredrickson and Losada considered “critical to our hypothesis” (p. 684) — an argument reiterated by Fredrickson (2013, pp. 817–818) — is in fact utterly irrelevant: it provides no evidence even for claim #6, much less for claim #1. The same comments apply, mutatis mutandis, to Waugh and Fredrickson (2006) and Diehl, Hay, and Berg (2011), which were cited by Fredrickson (2013) in support of her claims of nonlinearity.
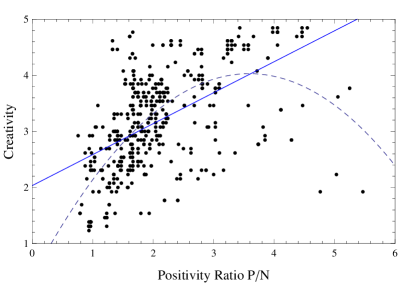
The correct way to test for nonlinearity is to form the scatter plot between the positivity ratio () and some quantitative (not artificially dichotomized or trichotomized) measure of “flourishing” (), and to perform various statistical tests on it; in particular, one can try to estimate the regression curve and to test whether there are statistically significant deviations from linearity (and if so, of what magnitude and what form). Such an approach was taken by Rego, Sousa, Marques, and Cunha (2012) and by Shrira et al. (2011); both of these studies found weak evidence, to be discussed below, for some form of nonlinearity (i.e., claim #6). None of the studies cited by Fredrickson (2013) — or any others we are aware of — contain any evidence for an inflection point (claim #5), much less for a “tipping point” (claim #1 or #2). Indeed, the data of Rego et al. (2012) and Shrira et al. (2011) constitute strong evidence against the hypothesis of a “tipping point”. See, for instance, the data of Rego et al. displayed in Figure 2 below: there is no indication whatsoever of any discontinuous behavior (claim #2), any rapid change (claim #3), or even any inflection point (claim #5).
But more is true: Fredrickson and Losada (2005)’s own raw data almost certainly constitute strong evidence against their hypothesis of a “tipping point” at 2.9013. (We say “almost certainly” because Professor Fredrickson has informed us that the raw data are no longer available; we must therefore proceed, faute de mieux, on the basis of the published summary statistics.) To understand the logic here, recall first that according to the Fredrickson–Losada hypothesis (claim #1), all “flourishing” individuals should have positivity ratios above 2.9013, while all “nonflourishers” should have positivity ratios below 2.9013. Let us even be charitable and allow for “impurities” and measurement imprecision (Fredrickson, 2009, p. 129) by replacing “all” by “almost all” in this hypothesis. Are Fredrickson and Losada’s data consistent with the hypothesis, thus modified? Unfortunately we don’t know for sure, because Fredrickson and Losada (2005) failed to report anything about the positivity-ratio distributions for the “flourishing” and “nonflourishing” groups, other than their means. But we can obtain a rough estimate by reverse-engineering their statistics, under the simplifying hypothesis that the “flourishing” and “nonflourishing” groups have the same standard deviation ; this allows us to apply, in reverse, the formula for the -test assuming equal variance but unequal sample sizes (Koopmans, 1981, p. 302).555 The -test for samples of sizes and , with sample means and , taken from populations having the same standard deviation , is where is an estimator of the common standard deviation . We used this equation in reverse to compute . [This footnote was omitted from the published version of this article, due to space limitations.] Then their data for Sample 1 (, , , , ) imply , while their data for Sample 2 (, , , , ) imply . On the other hand, every probability distribution supported on the interval and having mean has a variance ; hence . Applying this to the “nonflourishing” groups in Samples 1 and 2, we obtain and , respectively — values far in excess of 2.9013. It is therefore inevitable that the “nonflourishing” groups contained large numbers of individuals with positivity ratios in excess of 2.9013; assuming a normal distribution we estimate that approximately 36% of “nonflourishers” had positivity ratios above 2.9013.
 |
 |
|---|---|
| (a) | (b) |
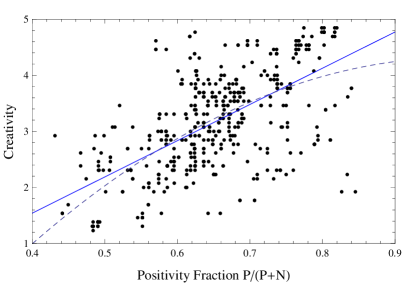
So let us forget about “tipping points” (claims #1 and #2) and go back to the weak evidence for concave nonlinearity (claim #6) found by Rego et al. (2012) and Shrira et al. (2011). It turns out that this nonlinearity can be almost entirely removed by a simple and well-motivated change of independent variable. Notice first that the regression curve of “degree of flourishing” cannot possibly be a perfectly linear function of the positivity ratio, for the simple reason that the “degree of flourishing” is bounded (for instance, Rego et al.’s measure of “creativity” runs from 1 to 5) while the positivity ratio can in principle become arbitrarily large. This suggests that a much better choice of independent variable, in place of the positivity ratio , would be the quantity , which runs from 0 to 1 (we might call it the positivity fraction); it contains exactly the same information as but in a form that avoids creating superfluous nonlinearities.666 As an added advantage, also avoids the undesirable arithmetic effects that can occur when participants report very few (or zero) negative emotions during the specified time interval. Fredrickson and Losada (2005, p. 681, footnote 1) themselves observed that the conversion between and is simply an algebraic transformation. In Figure 2 we compare the fits for the data of Rego et al. using versus as the independent variable. In the latter variable, the quadratic coefficient is still statistically significant () but its effect is quantitatively small; the linear and quadratic fits differ only very slightly in the region where most of the data points lie. Broadly similar considerations apply to the data of Shrira et al. (2011).
There is, however, a more fundamental problem with all these studies (or rather, with their interpretation). The idea of searching for the relation between the positivity ratio and “flourishing” — and in particular of testing whether it is nonlinear — presupposes that the question is well-posed. But is it? Of course one can seek to estimate the regression curve in any given population. But what reason is there to believe that different populations will produce the same regression curve? Indeed, what reason is there to believe that even qualitative features of that curve — such as its monotonicities and convexities — will be universal? Perhaps (to take just one possibility) higher positivity ratios produce higher “well-being” for populations living in generally harmonious and prosperous environments (for instance, American college students) but produce lower “well-being” for populations exposed to danger and predation (for instance, during a civil war). From this perspective it is hardly surprising that the studies cited by Fredrickson (2013) produced such wildly divergent results: Rego et al. (2012) and Shrira et al. (2011) found weak evidence that the “degree of flourishing” ceased to increase significantly, and might conceivably even decrease slightly, when positivity ratios exceed approximately 3, whereas Diehl et al. (2011) found monotonically increasing levels of mental health (which was, alas, trichotomized as “languishing,” “moderately mentally healthy,” or “flourishing”) right up to the highest mean positivity ratios observed in their study — which were 4.3 (young adults), 14.8 (middle-aged adults) and 26.7 (older adults).
Fredrickson (2009, p. 134; 2013, p. 819) described what she called the “Now you see it, now you don’t” effect of positivity, which appears to be “playing an elaborate shell game with scientists”: attempts to measure the effects of positive emotions sometimes “find no effects whatsoever” because, according to her, these effects become reliably detectable only when positivity ratios exceed the “tipping point” value. We wish to put forward an alternative hypothesis: namely, that when no effect is found, this is probably because no effect exists (or it is too weak to be detected by the given study). This alternative hypothesis is not only simpler than the “shell game” scenario, but has the added advantage of not relying on the hypothetical existence of a “tipping point,” for which, as we have shown, there is at present no evidence whatsoever (and indeed significant evidence against).
One of the concluding remarks in our article (Brown et al., 2013, p. 813) addressed the need for the use of differential-equation models in the natural or social sciences to be duly justified by theoretical arguments and/or empirical evidence. Perhaps we should have widened that remark to take in all mathematical modeling of observed phenomena. To have any predictive value, mathematical models must be rigorously specified and shown to accurately reflect reality. The mere invocation of buzzwords such as “nonlinear,” “recursive,” and “dynamic” (Fredrickson, 2013, p. 817) carries no weight in responsible scholarship, despite their romantic appeal.
We wish to thank Arménio Rego and Amit Shrira for providing us, respectively, the data from Rego et al. (2012) and from Study 1 of Shrira et al. (2011). We are also extremely grateful to Andrew Gelman and Carol Nickerson for helpful comments on an early draft of this manuscript. The authors, of course, bear full and sole responsibility for the content of this article.
Correspondence concerning this article should be addressed to Alan D. Sokal, Department of Physics, New York University, 4 Washington Place, New York, NY 10003. E-mail: sokal@nyu.edu
References
.5in1
Brown, N. J. L., Sokal, A. D., & Friedman, H. L. (2013). The complex dynamics of wishful thinking: The critical positivity ratio. American Psychologist, 68, 801–813. doi:10.1037/a0032850
Diehl, M., Hay, E. L., & Berg, K. M. (2011). The ratio between positive and negative affect and flourishing mental health across adulthood. Aging & Mental Health, 15, 882–893. doi:10.1080/13607863.2011.569488
Fredrickson, B. L. (2009). Positivity: Groundbreaking research reveals how to embrace the hidden strength of positive emotions, overcome negativity, and thrive. New York, NY: Crown. Published in paperback as Positivity: Top-notch research reveals the 3-to-1 ratio that will change your life.
Fredrickson, B. L. (2013). Updated thinking on positivity ratios. American Psychologist, 68, 814–822. doi:10.1037/a0033584
Fredrickson, B. L., & Losada, M. F. (2005). Positive affect and the complex dynamics of human flourishing. American Psychologist, 60, 678–686. doi:10.1037/0003-066X.60.7.678
Fredrickson, B. L., & Losada, M. F. (2013). Correction to Fredrickson and Losada (2005). American Psychologist, 68, 822. doi:10.1037/a0034435
Koopmans, L. H. (1981). An introduction to contemporary statistics. Boston, MA: Duxbury Press.
Losada, M. (1999). The complex dynamics of high performance teams. Mathematical and Computer Modelling, 30(9–10), 179–192. doi:10.1016/S0895-7177(99)00189-2
Losada, M., & Heaphy, E. (2004). The role of positivity and connectivity in the performance of business teams: A nonlinear dynamics model. American Behavioral Scientist, 47, 740–765. doi:10.1177/0002764203260208
Navas, A. (2011). Un cas d’inconscience (?). Images des Mathématiques, CNRS. Retrieved from http://images.math.cnrs.fr/Un-cas-d-inconscience,1004.html
Rego, A., Sousa, F., Marques, C., & Cunha, M. P. (2012). Optimism predicting employees’ creativity: The mediating role of positive affect and the positivity ratio. European Journal of Work and Organizational Psychology, 21, 244–270. doi:10.1080/1359432X.2010.550679
Shrira, A., Palgi, Y., Wolf, J. J., Haber, Y., Goldray, O., Shacham-Shmueli, E., & Ben-Ezra, M. (2011). The positivity ratio and functioning under stress. Stress and Health, 27, 265–271. doi:10.1002/smi.1349
Waugh, C. E., & Fredrickson, B. L. (2006). Nice to know you: Positive emotions, self–other overlap, and complex understanding in the formation of a new relationship. Journal of Positive Psychology, 1, 93–106. doi:10.1080/17439760500510569