Resolving the relative influence of strong field spacetime dynamics and MHD on circumbinary disk physics
Abstract
In this paper we evolve magnetized and unmagnetized circumbinary accretion disks around supermassive black hole binaries in the relativistic regime. We use a post-Newtonian expansion to construct an analytical spacetime and determine how the order of the post-Newtonian (PN) expansion affects the dynamics of the gas. We find very small differences in the late-time bulk dynamics of non-magnetized hydrodynamic evolutions between the two spacetimes down to separations of approximately where is the total mass of the binary. For smaller separations, the differences due to PN-order become comparable to differences caused by using initial data further from equilibrium. For magnetized gas, MHD stresses, which drives the accretion dynamics, tends to mask all higher order PN effects even at separations of , leading to essentially the same observed electromagnetic luminosity. This implies that our calculations of the EM signal may be robust down to small binary separations. Our investigation is the first to demonstrate how the level of PN accuracy affects a circumbinary disk’s evolution and informs us of the range in separation within which to trust the PN approximation for this kind of study. We also address the influence the initial conditions and binary separation have on simulation predictions.
I Introduction
Supermassive black holes (SMBH) in the nuclei of galaxies are understood to play a key role in the construction of galaxies, as evidenced by the strong correlations between their masses and their host galaxies’ stellar bulge masses and velocity dispersions Magorrian et al. (1998); Gebhardt et al. (2000); Ferrarese and Merritt (2000); Kormendy and Ho (2013); Silk and Rees (1998); Fabian (1999).
Because today’s galaxies are generally thought to have been assembled from mergers of smaller galaxies, SMBH binaries may be a common occurrence in the nuclei of the merged galaxies Volonteri et al. (2003); Volonteri (2007); Schnittman (2007). Subsequent to the galactic merger, dynamical friction from dark matter and baryonic matter (e.g. stars and/or gas) should bring the SMBHs close to the center of mass of the merged galaxy, where a variety of angular momentum loss mechanisms may bring them still closer together Begelman et al. (1980). Once the orbital separation shrinks to (where and is the mass of the binary), gravitational radiation drives the orbit of the binary which rapidly inspirals down to merger.
Despite relatively few observations of SMBH mergers to date (Deane et al., 2014; Bogdanovic, 2014), we know that the rate of these events should be at least a few per year. Programs, such as the Panoramic Survey Telescope and Rapid Response System (Pan-STARRS), which is already in operation, and the planned Large Synoptic Survey Telescope (LSST) will be able to search for these events using electromagnetic (EM) signals. Similarly, pulsar timing arrays can probe for these events in gravitational waves (GW). In the long term, EM signatures for SMBH mergers will also help us pinpoint GW sources from future space missions such the European New GW Observatory (NGO), also known as eLISA (Amaro-Seoane et al., 2013; Amaro-Seoane et al., 2012; Seoane et al., 2013), determine the redshift luminosity distance relationship to large redshifts and can be used to constrain GW parameter inference. For all these reasons, it is therefore important to provide accurate predictions of the EM emission of SMBH mergers in the relativistic regime.
Modeling the gas dynamics near merging SMBHs can be extremely challenging. Hydrodynamic (HD) and magnetohydrodynamic (MHD) simulations of accretion disks around SMBHs binary systems have been carried out in the Newtonian regime (Macfadyen and Milosavljevic, 2008; Shi et al., 2012; Noble et al., 2012; Roedig and Sesana, 2014; Farris et al., 2014; Shi and Krolik, 2014; Nixon et al., 2011; Bankert et al., 2014) when the binary is well-separated and in the late-inspiral and merger phase (Bode et al., 2010, 2012; Palenzuela et al., 2010; Farris et al., 2010, 2012, 2014; Giacomazzo et al., 2012; Gold et al., 2013). However, until the work of Noble et al Noble et al. (2012), the inspiral regime remained unexplored.
Noble et al Noble et al. (2012) introduced the idea of using an analytical spacetime of an inspiralling black-hole binary using post-Newtonian approximations to solve the field equations of general relativity Blanchet et al. (1998). This allowed for simulations of disks for more than a hundred orbits using the Harm3d MHD code developed by Noble Gammie et al. (2003); Noble et al. (2009), far longer than would be practical with typical full GRMHD codes, which solve the MHD and gravitational field equations numerically. The Harm3d code is now a mature code that solves the MHD equations on arbitrary dynamical spacetimes in arbitrary coordinate systems. Here we use a spherical grid that is adapted to the geometry of the disk which is ideal to study circumbinary accretion dynamics.
In the inspiral regime, far from the sources [], where the BH motion is slow [], the post-Newtonian (PN) approximation gives a very good description of spacetime dynamics Blanchet et al. (1998); Will (2011). The PN approximation is an asymptotic series in powers of these small quantities, characterized by the order to which it is taken [e.g., 3PN means up to terms ]. The PN metric takes energy loss from the binary into account, accurately modeling both the energy loss and inspiral of the binary.
In a previous paper (Noble et al., 2012), we used a spacetime model that is accurate up to 2.5PN order (i.e., including terms up to ) but describing the binary orbital evolution to 3.5PN. We showed that circumbinary disks can, in part, track the inspiral of a SMBH binary even at late stages of its evolution. The resulting metric was not valid very close to the BHs, and consequently, we excised any material that fell within 1.5 binary separations. More recently, we developed a new technique in which the entire relevant region of spacetime is covered by a number of individual zones, each of them based on an analytic approximation appropriate to its particular conditions Mundim et al. (2014). This will allow us to simulate how the gas falls onto the binary, distribute itself into two mini-disks around each BH, and evolves within these disks. This will be the subject of a separate upcoming paper.
In this paper, our goal is to explore the region of validity of the PN metric, where higher-order PN corrections become important, and where the PN spacetime needs to be supplanted by a numerical one. Our approach is based on using approximations where they are appropriate in order to employ the most computationally-intensive methods only on the domains in which they are essential.
Even though our spacetime metric is able to cover the full simulation domain, in this project, for simplicity, we avoid evolving the gas in the neighborhood of the BHs, and thus excise a spherical domain which includes the binary from our calculation. We follow the same excision procedure as was used before in Noble et al. (2012) and excise the innermost 1.5 binary separations of the domain. Indeed, in order to include the BHs in the computational domain while keeping the overall problem size at a practical level, one would need to introduce a new, spherical-like, nonuniform coordinate system Zilhao and Noble (2014).
To quantify how the PN order of accuracy affects the evolutions of non-magnetized and magnetized gas, we perform here a sequence of inviscid hydrodynamic evolutions of nearly identical disks using Newtonian, 1PN, and 2.5PN order metrics at separations from to as small as . Here we will examine both the transient behavior of the disk (which is very sensitive to the PN order), the quasi-equilibrium state of non-magnetized gas (which is less sensitive), and the quasi-equilibrium state of magnetized gas (which is even less sensitive). Ultimately, we find that the PN approximation can be used to evolve MHD disks down to binary BH (BBH) separations as small as , leading to robust calculations of the observed EM luminosity.
In the rest of this paper, we use the conventions of Misner, Thorne and Wheeler Misner et al. (1973) for the spacetime metric throughout. We use the Greek letters to denote spacetime indices, and Latin letters to denote spatial indices. The metric is denoted and it has signature . We use the geometric unit system, where , with the useful conversion factor .
II Simulation details
II.1 Quasi-Equilibrium Initial Data and Spacetime Treatment
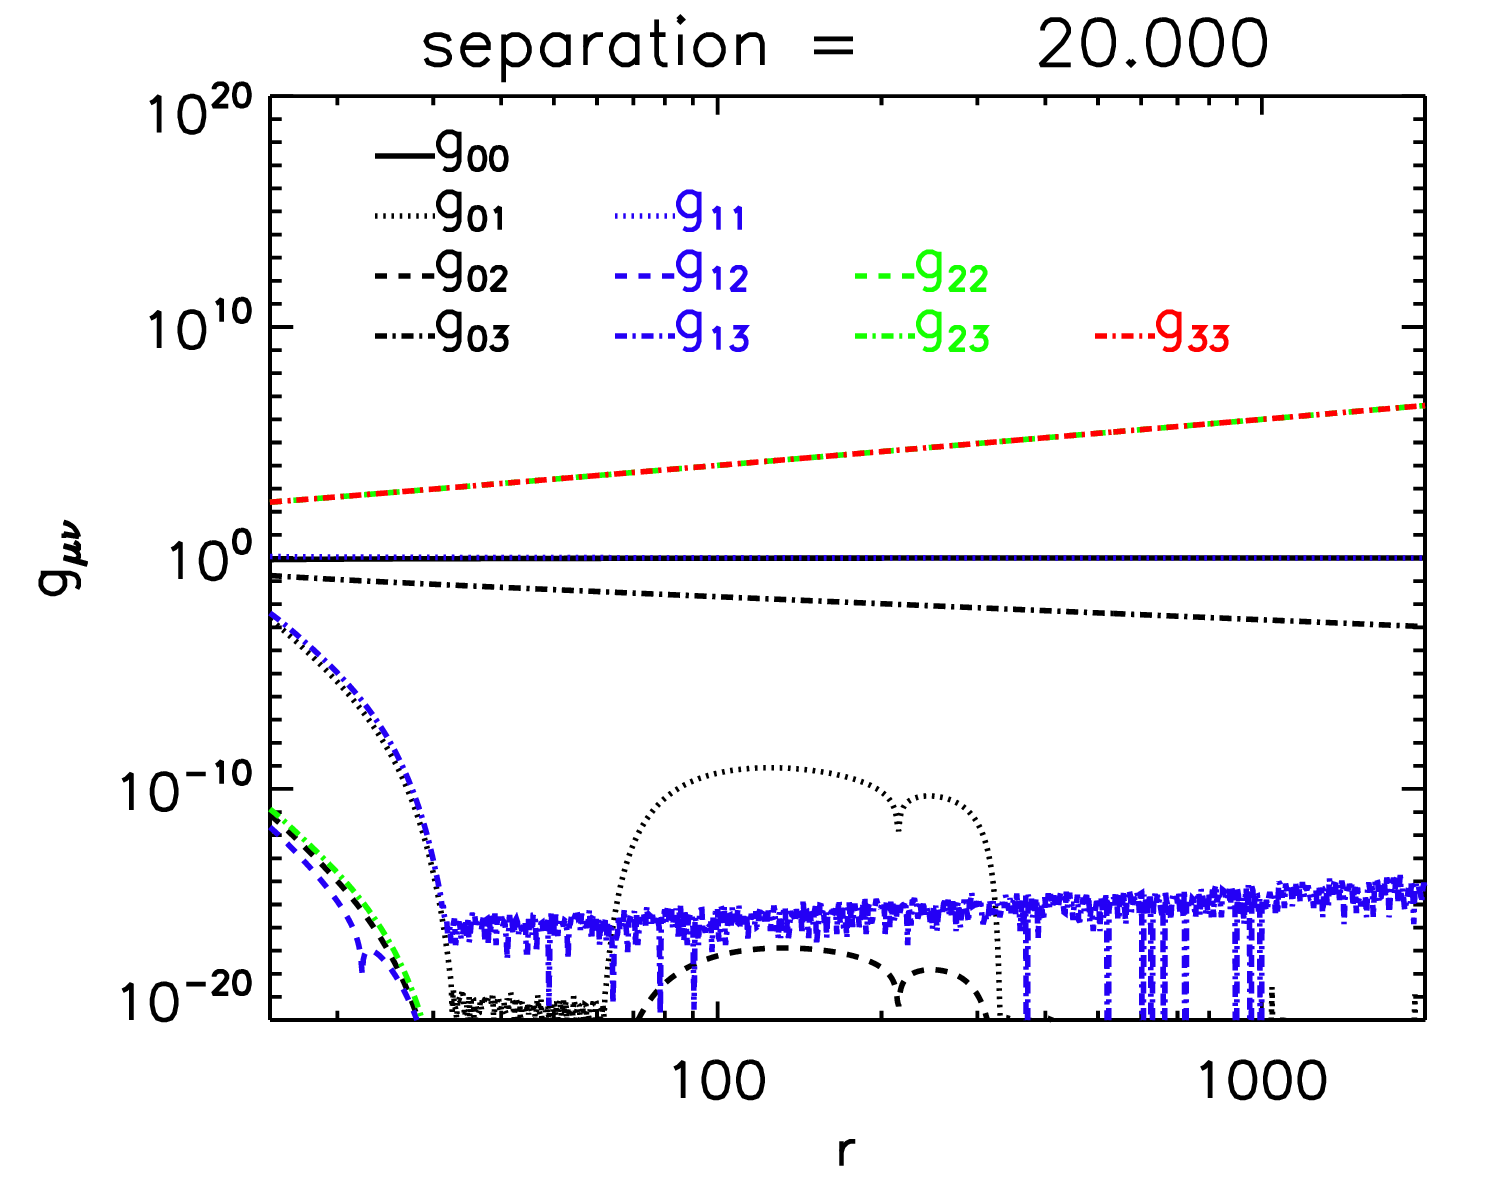
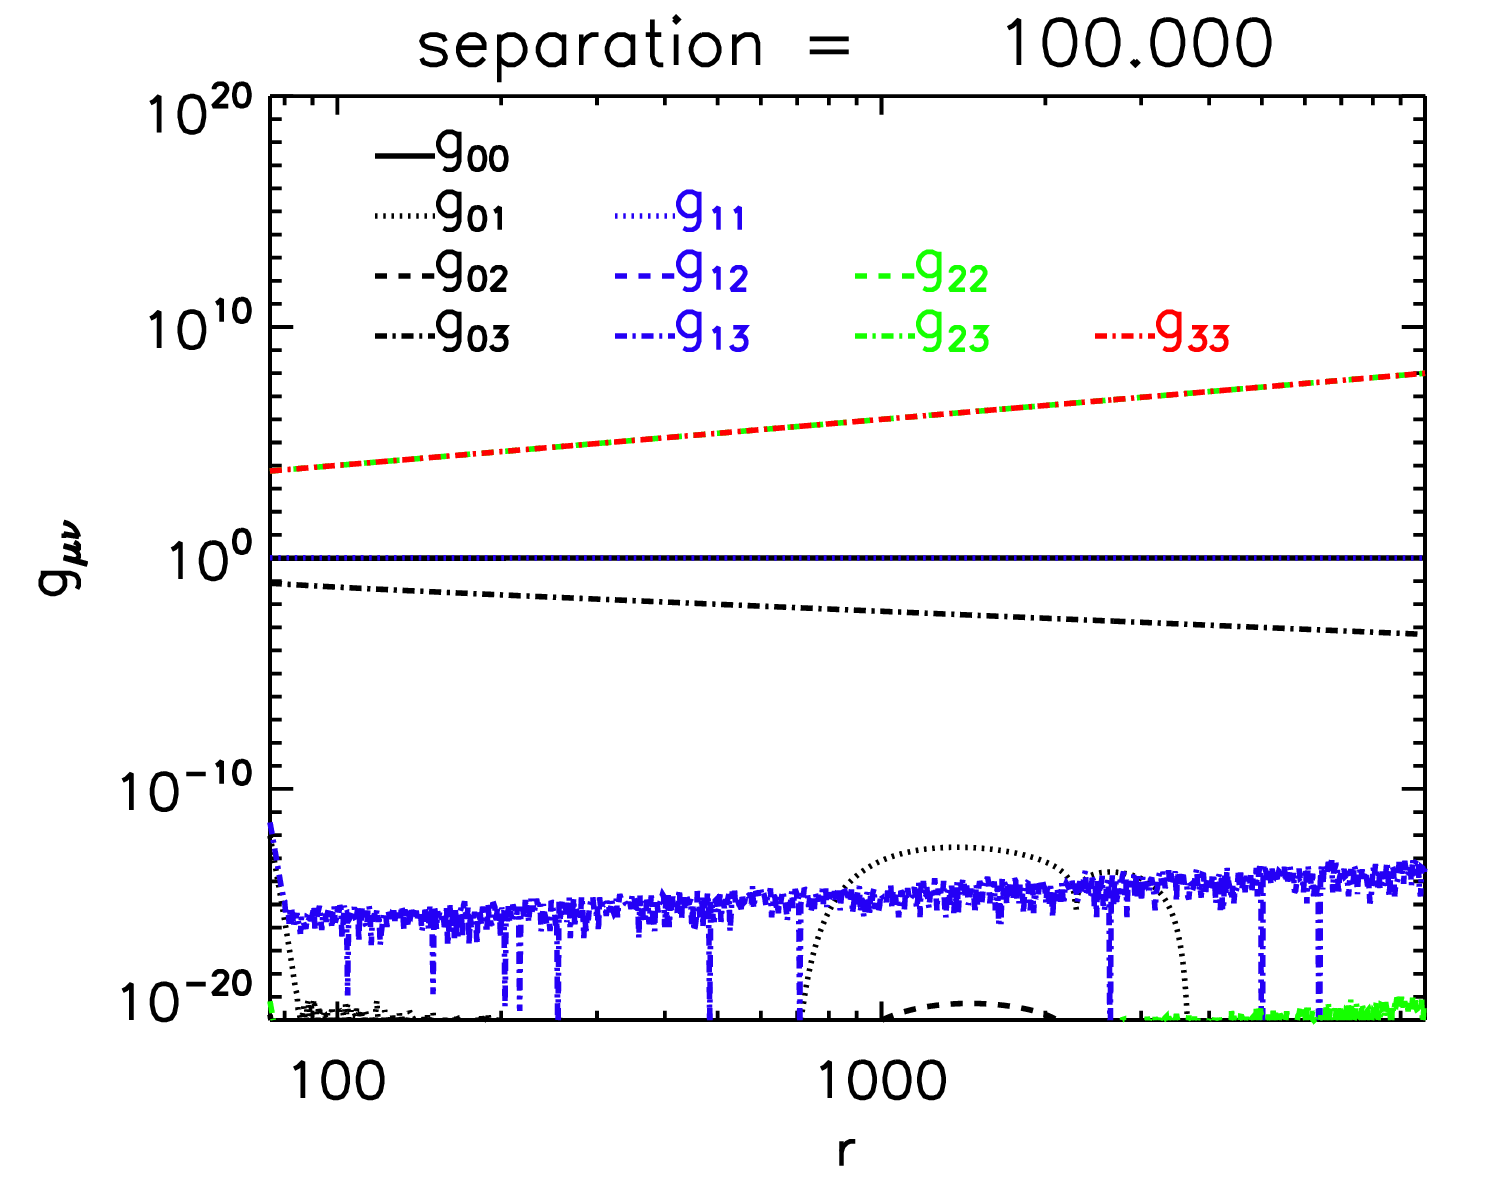
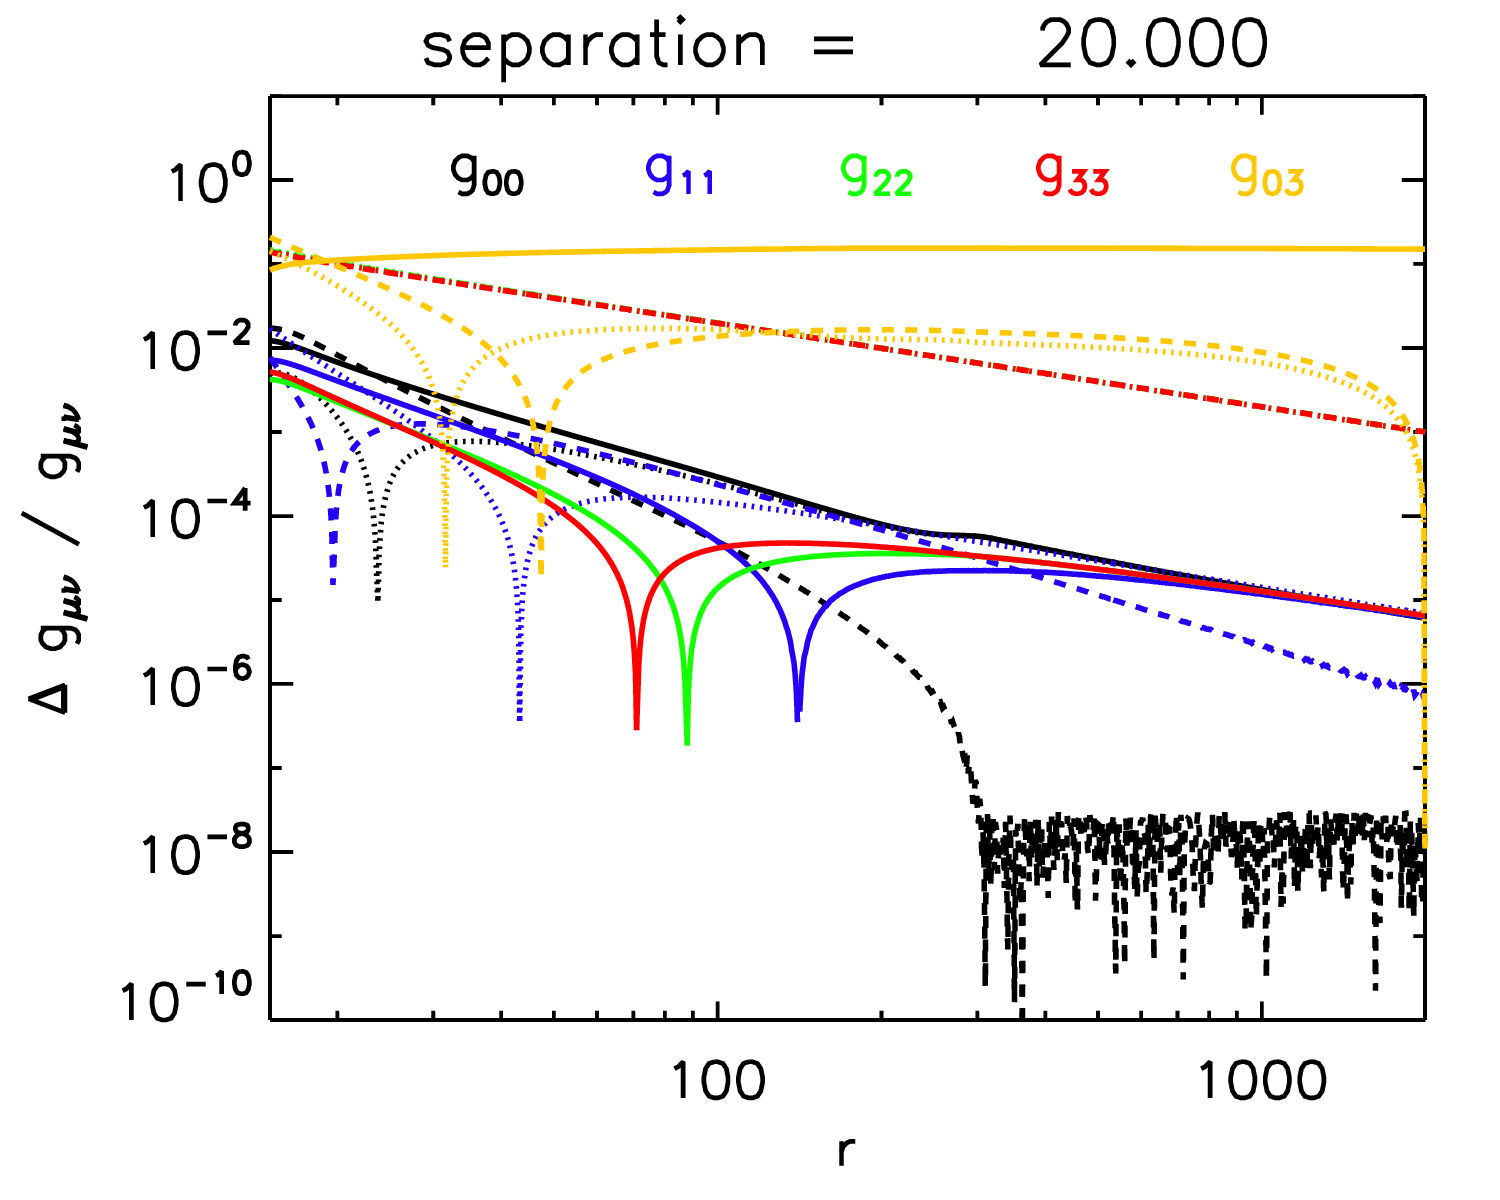
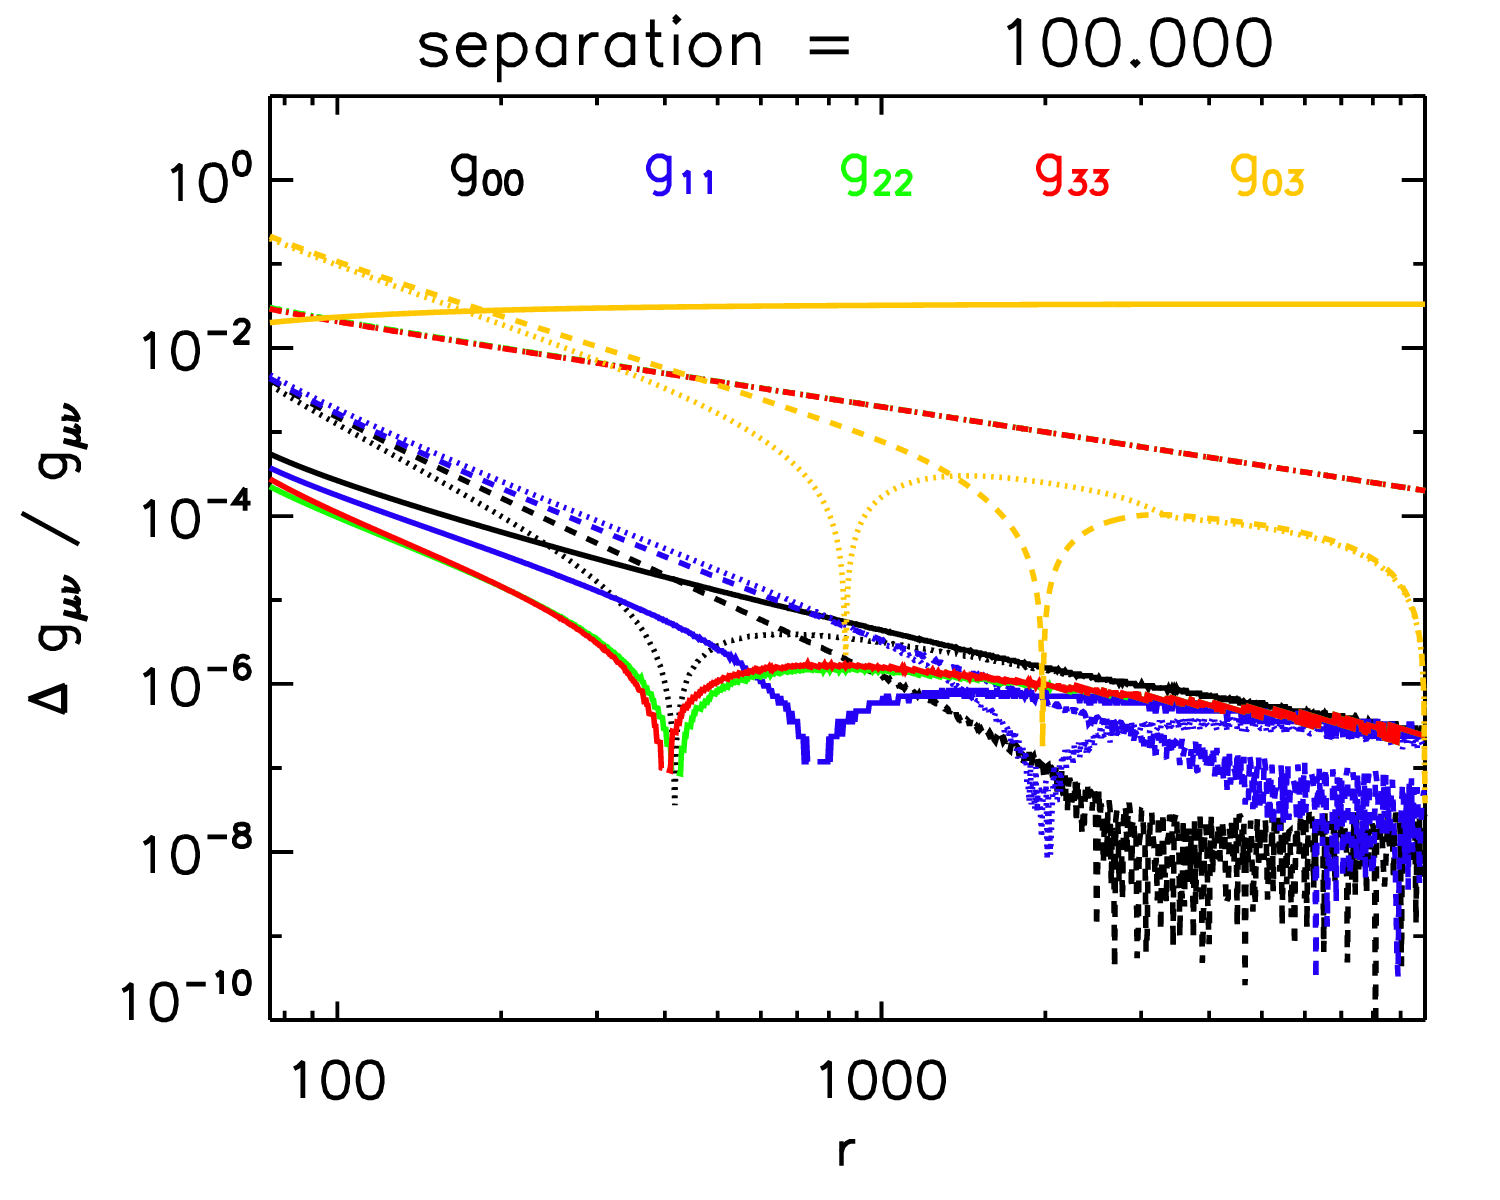
Our time-dependent metric does not admit any stationary disk solutions. However, far from the binary, where the gas timescale is much longer than the binary orbital period, we expect the disk to behave as if it were evolving on an effectively -averaged spacetime. If we hold the binary separation constant, this -averaged metric is stationary and therefore admits stationary disk configurations as well. We therefore generate our quasi-equilibrium initial data by finding stationary disks about a -averaged spacetime. We note that this -averaged spacetime is only used to generate initial disk configurations, not for subsequent evolutions. For details on this procedure, we refer the reader to Appendix A of Noble et al. (2012). Our procedure for generating the initial disk configuration assumes that all off-diagonal components (except for ) vanish. In practice, these are very small, but become larger as the binary separations is reduced. We illustrate this in Fig. 1, where we show for and binary separations plots of metric components for both 1PN and 2.5PN metrics, as well as the relative differences between them and the Kerr metric in Boyer-Lindquist coordinates with same total mass. The differences in the component of the 1PN and 2.5PN metrics can be approximated as differences in their dipole moments or “spins.” For instance, in Boyer-Lindquist coordinates, for . We find that the azimuthally-averaged 1PN and 2.5PN components have the same functional form, but have different values for the spin parameter (at the level of a few percent). We fit an angle-averaged PN metric to this formula at our grid’s outermost radius to arrive at a spin parameter for the given PN metric; this parameter is then used to evaluate the Boyer-Lindquist form of the metric that we ultimately use for comparison purposes.
For each separation, we make sure that disk solutions have the same scale height, thus keeping the disks as similar as possible.


II.2 Evolution equations
We solve the MHD equations with the Harm3d code Noble et al. (2009). As in Noble et al. (2012), we assume that the gas does not self-gravitate and alter the spacetime dynamics. We therefore need only solve the GRMHD equations on a specified background spacetime, .
The equations of motion originate from the local conservation of baryon number density, the local conservation of stress-energy, and the induction equations from Maxwell’s equations (please see Noble et al. (2009) for more details). They take the form of a set of conservation laws:
| (1) |
where is a vector of “conserved” variables, are the fluxes, and is a vector of source terms. Explicitly, these are
| (2) | ||||
| (3) | ||||
| (4) |
where is the determinant of the metric, are the Christoffel symbols, is our magnetic field (proportional to the field measured by observers traveling orthogonal to the spacelike hypersurface), is the Maxwell tensor, is the fluid’s -velocity, is the magnetic -vector or the magnetic field projected into the fluid’s co-moving frame, and is the fluid’s Lorentz function. The MHD stress-energy tensor, , is defined as
| (5) |
where is the magnetic energy density, is the gas pressure, is the rest-mass density, is the specific enthalpy, and is the specific internal energy. The accretion flow is cooled to keep it close to a constant aspect ratio by removing excess heat to a radiation field, specified here as a radiative flux, , with being the fluid-frame cooling rate.
We make use of piecewise parabolic reconstruction of the primitive variables at each cell interface for calculating the local Lax-Friedrichs flux Gammie et al. (2003), and a 3-d version of the FluxCT algorithm is used to impose the solenoidal constraint, Tóth (2000). The EMFs (electromotive forces) are calculated midway along each cell edge using piecewise parabolic interpolation of the fluxes from the induction equation Zilhao and Noble (2014). A second-order accurate Runge-Kutta method is used to integrate the equations of motion using the method of lines once the numerical fluxes are found. The primitive variables are found from the conserved variables using the “2D” scheme of Noble et al. (2006). Please see Noble et al. (2009) for more details.
III Hydrodynamic evolutions
Before embarking on full 3D MHD explorations, we performed 2D equatorial evolutions of inviscid hydrodynamic (non-magnetized) disks on the background BBH spacetime for different PN orders. We initialized the disk using the procedure mentioned in Sec. II (and outlined in detail in Appendix A of Noble et al. (2012)), where we set the aspect ratio to . In order to simplify the subsequent analysis, we have artificially kept the binary separation fixed at . We denote the simulations by hydro1PN_aXX and hydro2.5PN_aXX for the 1PN and 2.5PN cases respectively, where XX is the binary separation in units of .
For all the 2D simulations presented here, the computational domain consisted of cells with an outer boundary at and an inner boundary at . On top of this computational domain, we constructed two different types of disk configurations. For the larger binary separations of , , and , we set up the disk such that its inner edge was located at with the radius of the pressure maximum at , while for we set these to and respectively. Note that for we performed evolutions with both configurations.
Here we analyze the effects of PN order on the disk evolution by examining its influence on the disk’s surface density, torque density, and the mass enclosed within specified radii.
III.1 Torque density


We found that one of the most sensitive measures of differences in the background spacetime is the torque density. The disk is torqued by the binary through the non-axisymmetric nature of the gravitational potential. In the Newtonian limit, the time-averaged torque density takes the form Macfadyen and Milosavljevic (2008)
| (6) |
where is the Newtonian gravitational potential of the binary, and where denotes the average over spheres. From this formula, it is immediately apparent that the more the gravitational potential deviates from axisymmetry, the greater the corresponding communicated torque density will be for a given asymmetric (and correlated) distribution of . We therefore expect that, for the same disk configuration, the torque density will be larger for our 2.5PN runs as the higher order PN terms give rise to larger asymmetries when the terms become important.
For completeness, we also write the corresponding general relativistic torque density formula (which is the one we actually compute) Farris et al. (2011)
| (7) |
where .
In Figs. 2 and 3, we plot the time-averaged binary torque density for our 1PN and 2.5PN simulations for and . Here the average angular momentum flux is calculated by integrating from orbit 120 to orbit 240, which is safely in the “quasi-steady state” regime.
In all cases, the binary torque density is strongest for and shows a strong correlation with the Reynolds stresses. Note how in Fig. 2 all curves exhibit the same basic decaying oscillatory behavior with very similar amplitudes, as is expected in the quasi-Newtonian regime (in the Newtonian limit, all plots would overlap). The oscillatory pattern observed is a standard feature of such hydrodynamic evolutions, and is due to the presence of spiral density waves in the inner disk cavity Macfadyen and Milosavljevic (2008). We see that for , the 1PN curves lie on top of each other at larger radii, which is expected in the Newtonian regime. The curve has a slightly larger wavelength. The corresponding 2.5PN curves show a similar behavior but there is also a noticeable difference in wavelength between the and curves. Comparing the 1PN and 2.5PN curves for , we see that at smaller the 2.5PN curves show a larger amplitude than the 1PN curves. This latter effect is relatively small but becomes much stronger at smaller . In Fig. 3, we show the torque density for with a slightly different disk configuration. With this new disk configuration, the differences in amplitude between 1PN and 2.5PN at are magnified. Most importantly, the trends in amplitude with decreasing are completely different between 1PN and 2.5PN. While 1PN shows a decrease in amplitude from to , 2.5PN shows a strong increase. Note the relative scales in the figure. At the 1PN and 2.5PN curves are no longer even qualitatively similar. It thus appears that one needs to include 2.5PN corrections to the metric even at separations as large as .
III.2 Surface density
We define the surface density as
| (8) |
and will denote the azimuthal average of the above equation. For later convenience, we define to be the maximum value for the surface density at . This quantity will be useful for normalization purposes.
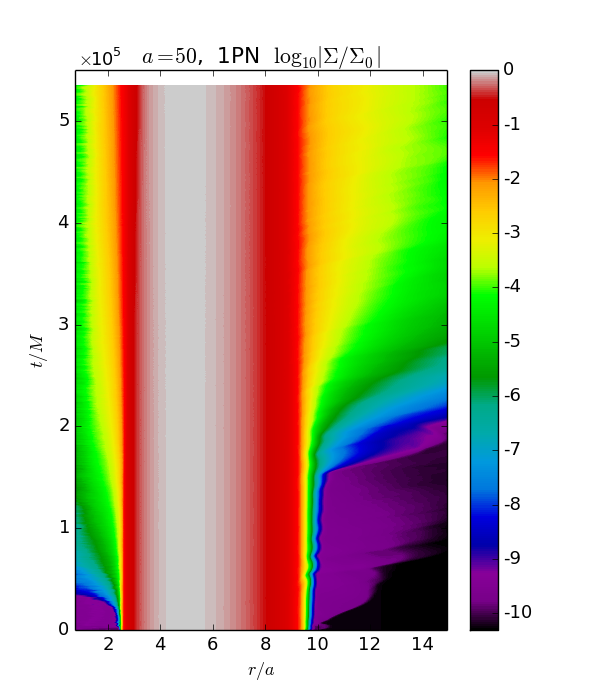
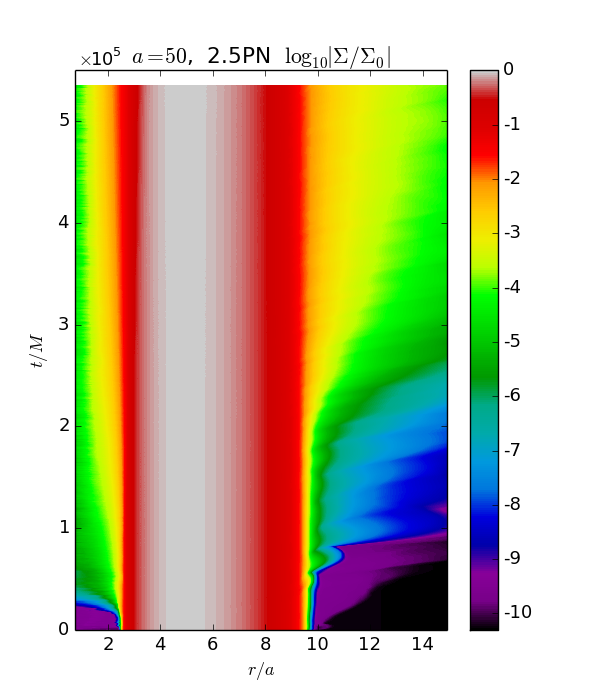
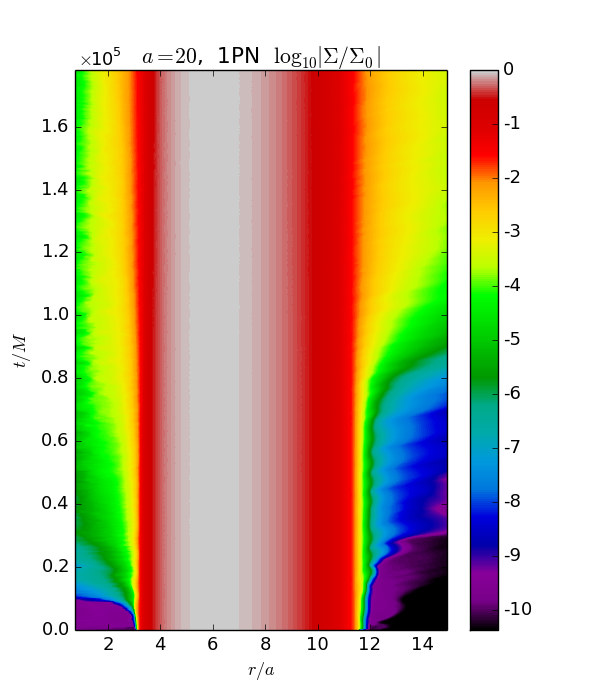
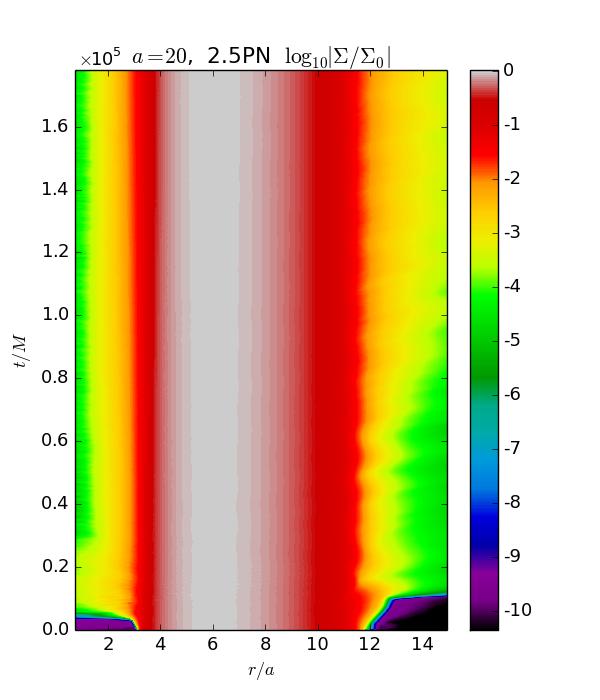
In Fig. 4 we show the behavior of the surface density (in logarithmic units) for various binary separations and PN orders. These plots give us a picture of how the gap fills in and how the gas diffuses out of the disk. At , the rate and amount of gas filling in the gap and the rate and amount of gas diffusing out of the disk are essentially identical between 1PN and 2.5PN. Even at , the final distribution of surface density is again independent of PN order. Here, however, there is a considerable lag in the time it takes for gas to start diffusing out of the disk at 1PN. Interestingly, while the torque density for 1PN and 2.5PN are quite different at , the net effect seems to be only to accelerate the equilibration of the 2.5PN disk—the resultant quasi-equilibrium state of the 1PN and 2.5PN disks are largely unaffected by the differences in these torques.
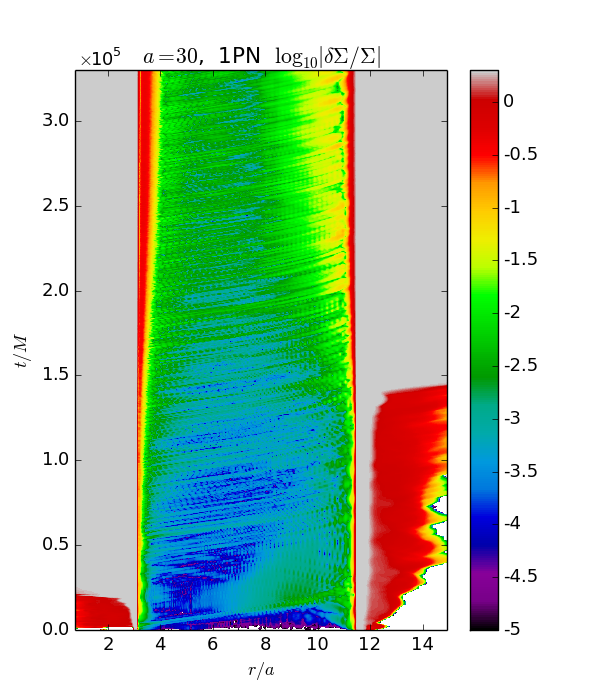
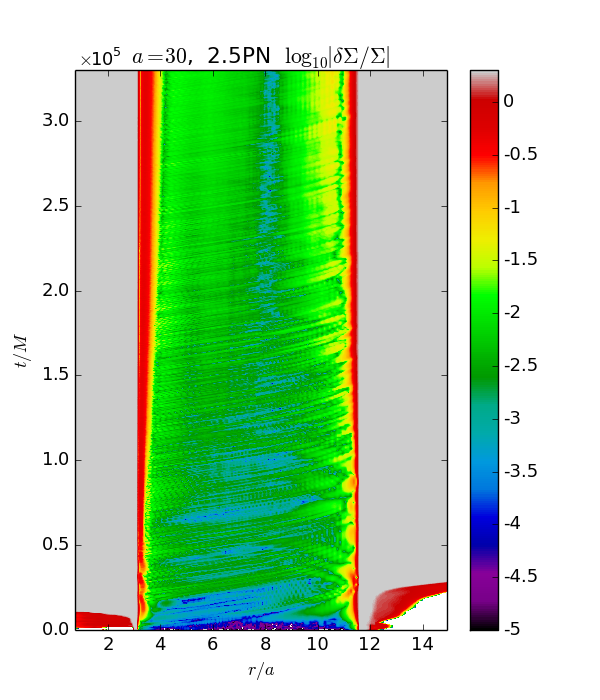
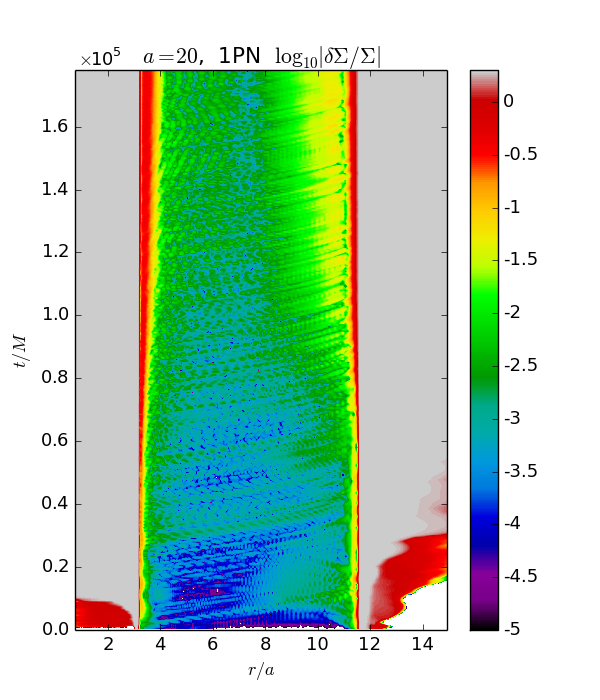
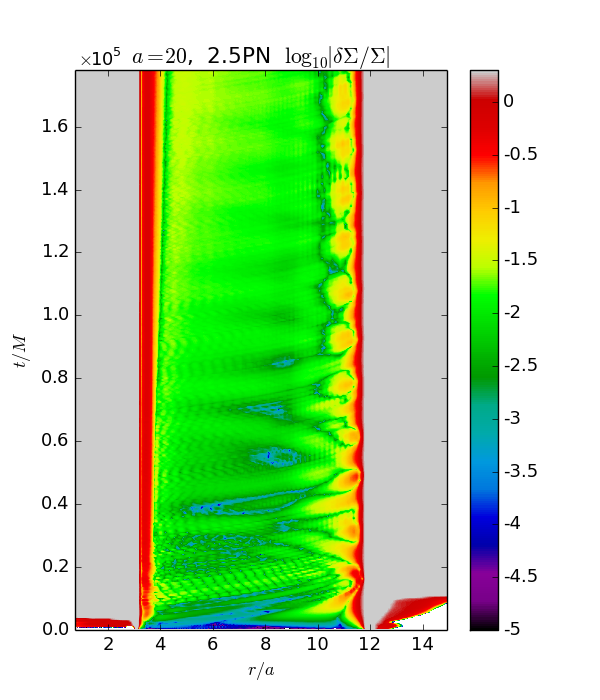
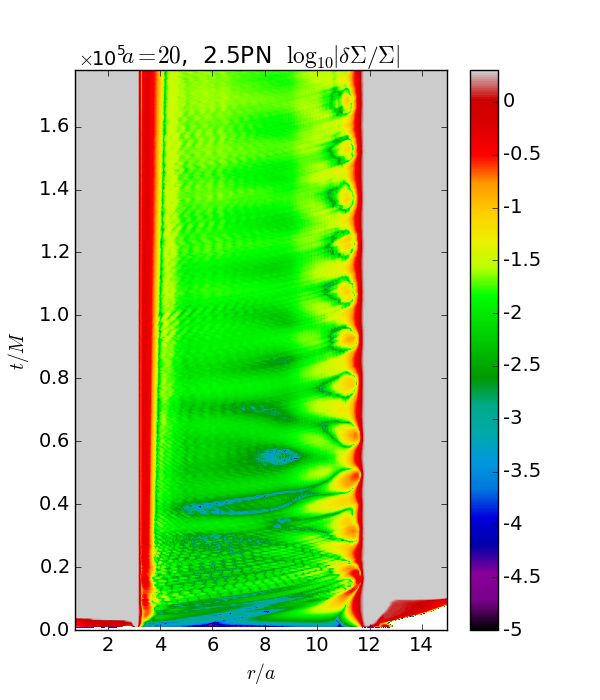
To further evaluate the effects of PN order on the bulk of the disk, we examine the relative difference between and its initial value :
| (9) |
In Fig. 5 we plot this quantity for binary separations of and , which (for this particular measure) are illustrative examples of all simulations performed. The relative change in is complementary to a plot of the itself since it better illustrates the behavior of the bulk, rather than the behavior of the inner and outer edges. The relative change is off scale before and beyond the disk because the atmosphere was initialized with very little density. This figure shows how far from equilibrium our initial data is. Concentrating on the bulk of the disk itself, we see very little difference between the 1PN and 2.5PN disks at . Both the 1PN and 2.5PN disks settle down to configurations that are very close to their initial configurations, with the largest deviations near the inner and outer edges. At some differences are apparent. The 2.5PN disk is further from its initial configuration at all radii (but the effect is small) than the 1PN disk, and the 2.5PN disk exhibits decaying oscillatory modes near the outer edge not present in the 1PN disk. While we note that these oscillations may be due, in part, to the construction of the initial data (which assumes zero off-diagonal terms in the -averaged metric), it seems to us that the 2.5PN effects during evolution are important for this measure of the behavior of the disk at .
We note also that in order to rule out the possibility that the observed differences between the 1PN and 2.5PN simulations be due to the accumulation of numerical errors over time, we have performed higher resolution versions of simulations hydro1PN_a20 and hydro2.5PN_a20. See Appendix A for this discussion.
III.3 Mass enclosed


We close this Section with a discussion of how the disk’s mass flow equilibrium changes over time. Please see Fig. 6 for plots of the time series of the enclosed mass within spherical volumes of different radii. We begin by noting that for no significant difference can be seen between 1PN and 2.5PN evolutions. Evolutions for smaller binary separations show a different picture, though. Indeed, for all 1PN evolutions, the amount of mass inside small radii increases monotonically with time, until it saturates at late times. For the corresponding 2.5PN evolutions with binary separation , however, the mass enclosed exhibits a much more rapid growth, followed by a small decay.
One critical thing to note is that while the initial transient behavior of the disks at smaller separations are quite different between 1PN and 2.5PN (with 2.5PN equilibrating noticeably sooner), the quasi-equilibrium state for 1PN and 2.5PN disks are very similar down to separations as small as . Apparently, 2.5PN seems to destabilize the gas around the gap, allowing it to fall into the binary until pressure inside the gap supports the inner edge of the disk. The equilibrium state of the disk depends on the gas inside the gap, therefore a configuration that leads to gas entering the gap sooner can equilibrate faster.
Thus, it seems that even though the effects from PN spacetime order are significant for the smaller binary separations, hydrodynamic effects begin to dominate during the late time stages of these evolutions. Simulations with lower PN order merely need more time to relax to the same configuration as their corresponding higher PN order cases. The apparent conclusion is that PN approximations do affect the transient of the disk dynamics even at large separation () but the bulk properties of the disk at later times are robust even at .
IV MHD evolutions
We now turn our attention to MHD simulations of circumbinary accretion disks. Since 3D MHD simulations are much more computationally costly than (2D) hydrodynamic ones, we cannot afford to explore the parameter space as extensively as in the hydrodynamic case. For our MHD runs, we have therefore chosen to fix the binary separation at and only vary the PN order.
We prepared three different evolutions: the “benchmark” 2.5PN run (hereafter referred to as MHD2.5PN), a 1PN run where the disk was initialized with the same specific angular momentum at as in the MHD2.5PN case (hereafter referred to as MHD1PN_l), and a 1PN run where the disk was chosen to have the same aspect ratio as that of the MHD2.5PN case (hereafter referred to as MHD1PN_H). Because of the differences in the spacetime metric, it is impossible to find a disk with the same aspect ratio and specific angular momentum in the 1PN spacetime as was originally used in the 2.5PN spacetime.
For our MHD simulations we used a 3D numerical grid with cells, an outer boundary at , and an inner boundary at . The disk was chosen to have its inner edge located at with the radius of the pressure maximum at . Please see Ref. Noble et al. (2012) for further details about the disk setup and parameters used, and Appendix A for a discussion about our use of the excision procedure and how well our runs resolve the magnetorotational instability (MRI).
A detailed analysis of quantities and results pertaining to the MHD2.5PN evolution was already performed in Noble et al. (2012), to where we refer the interested reader. We will therefore not repeat this extensive analysis, and will focus our discussion here on the differences between the 1PN and 2.5PN evolutions. We find that each simulation enters a so-called “secularly evolving” state at around in which many characteristics of the disk are seen to only gradually evolve in time; a circumbinary disk is not expected to be steady as the gravitational torque from the binary persists to perform work on the gas.
IV.1 Torque
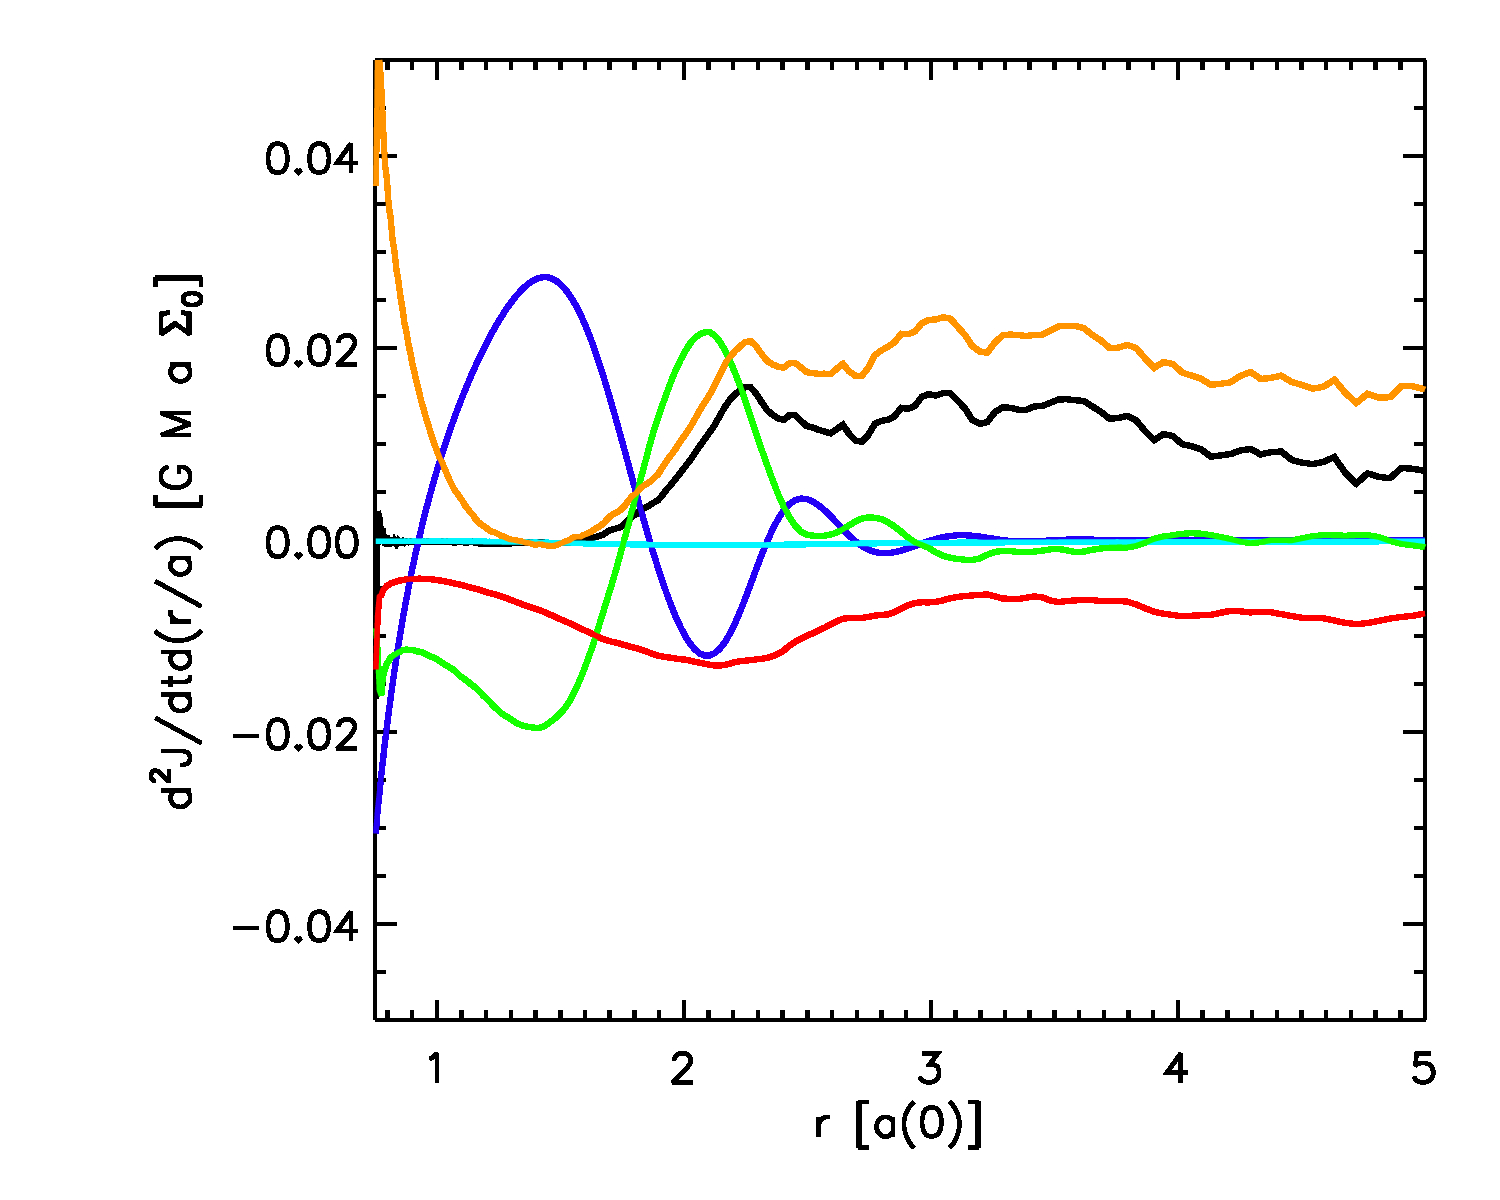
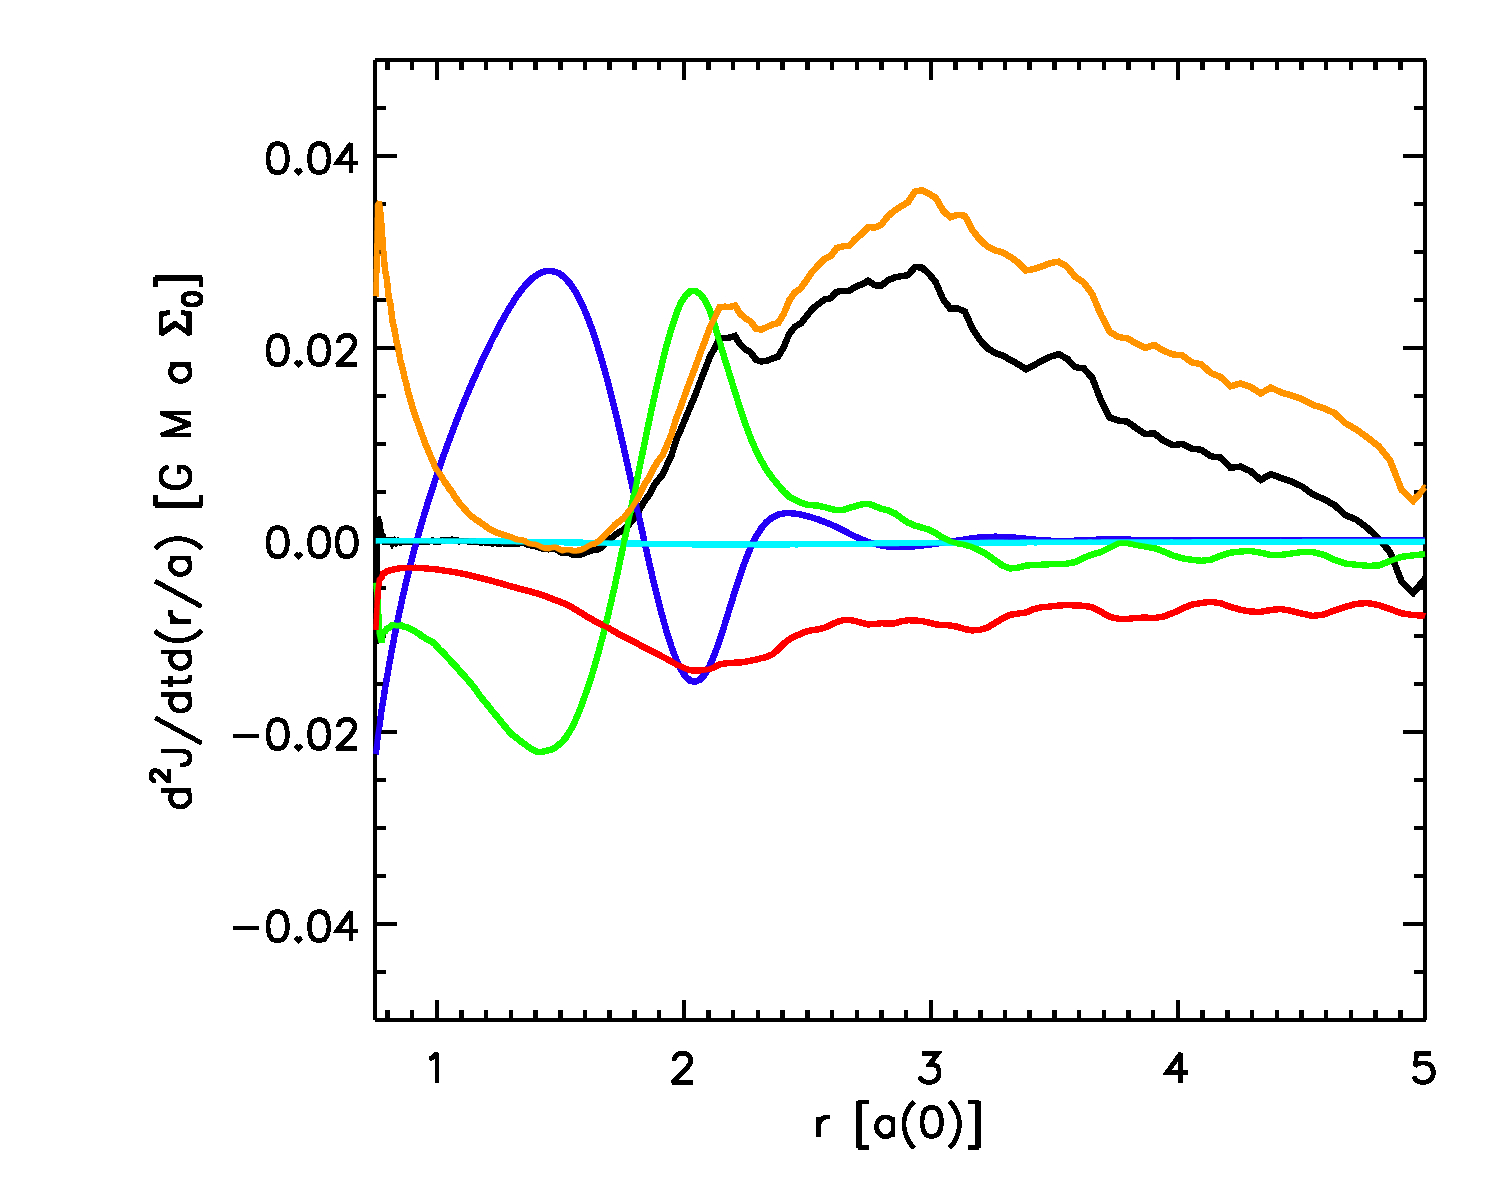
We can see the angular momentum flow of the system in Fig. 7, where we plot the radial derivatives of time-averaged angular momentum fluxes integrated on shells. This is the plot analogous to Fig. 3 for these MHD evolutions. As expected, several differences stand out when comparing with the purely hydrodynamic evolutions, as in the hydrodynamic case there is no mechanism to efficiently transport angular momentum. In this case, we see that the binary torque density is mostly delivered in the region. Most of the angular momentum is delivered in the gap, where the density of the fluid is much lower than in the disk proper. As in the hydrodynamic case, a strong correlation with the Reynolds stresses is observed. And throughout the flow, Maxwell stress (not present in the hydrodynamic case) acts to remove angular momentum from the gas and carry it outward.
More important for our purposes here, though, is noting that runs MHD1PN_H and MHD2.5PN show hardly any noticeable difference between them. Thus, for this quantity (and unlike the corresponding hydrodynamic case), MHD dynamics seem to dominate over and mask “spacetime” related effects.
IV.2 Surface density
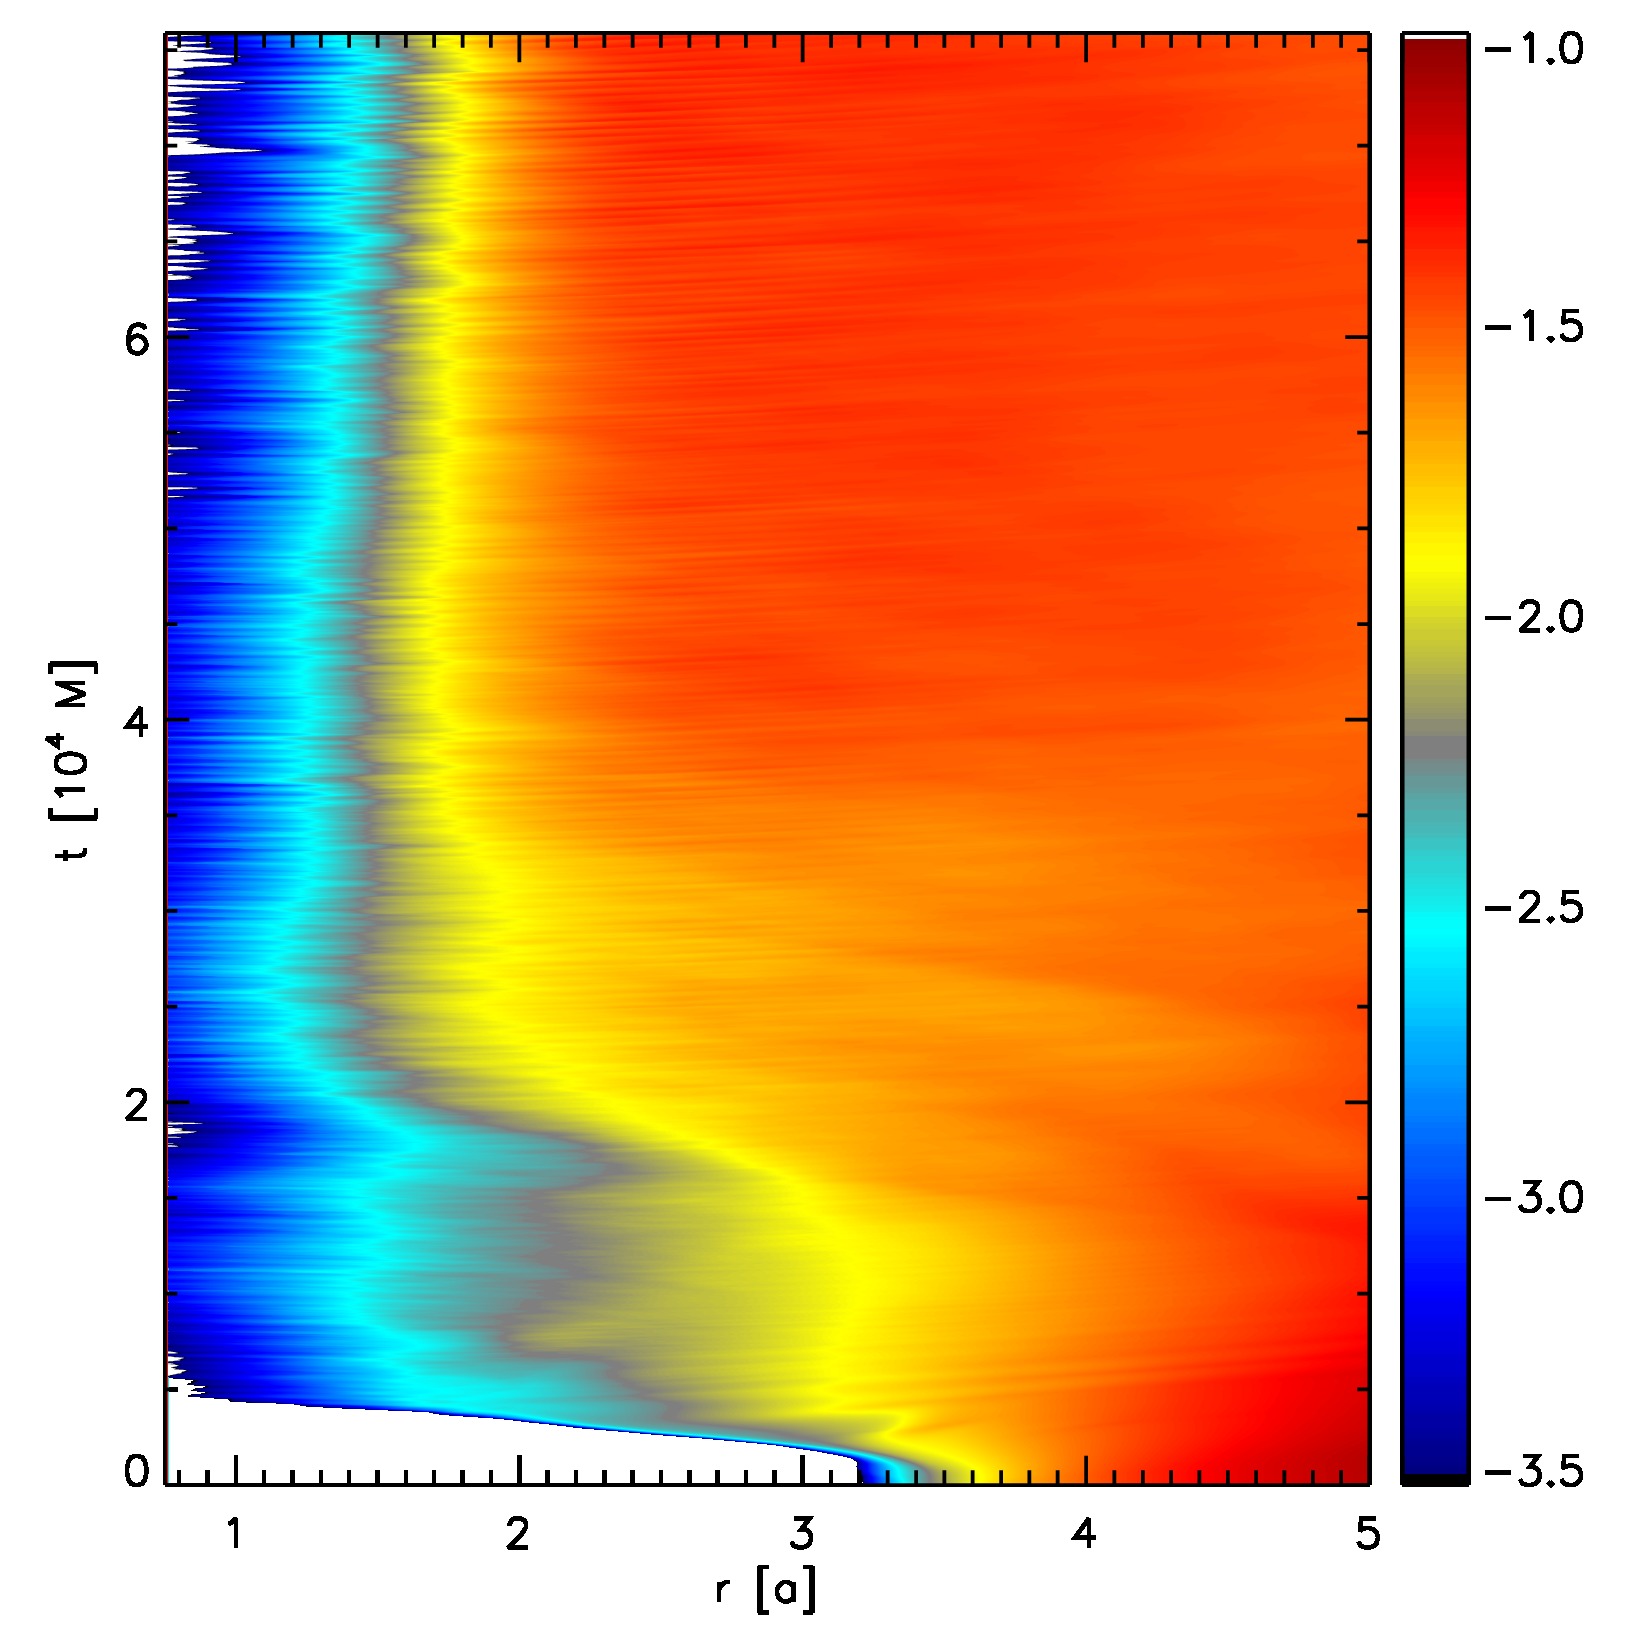
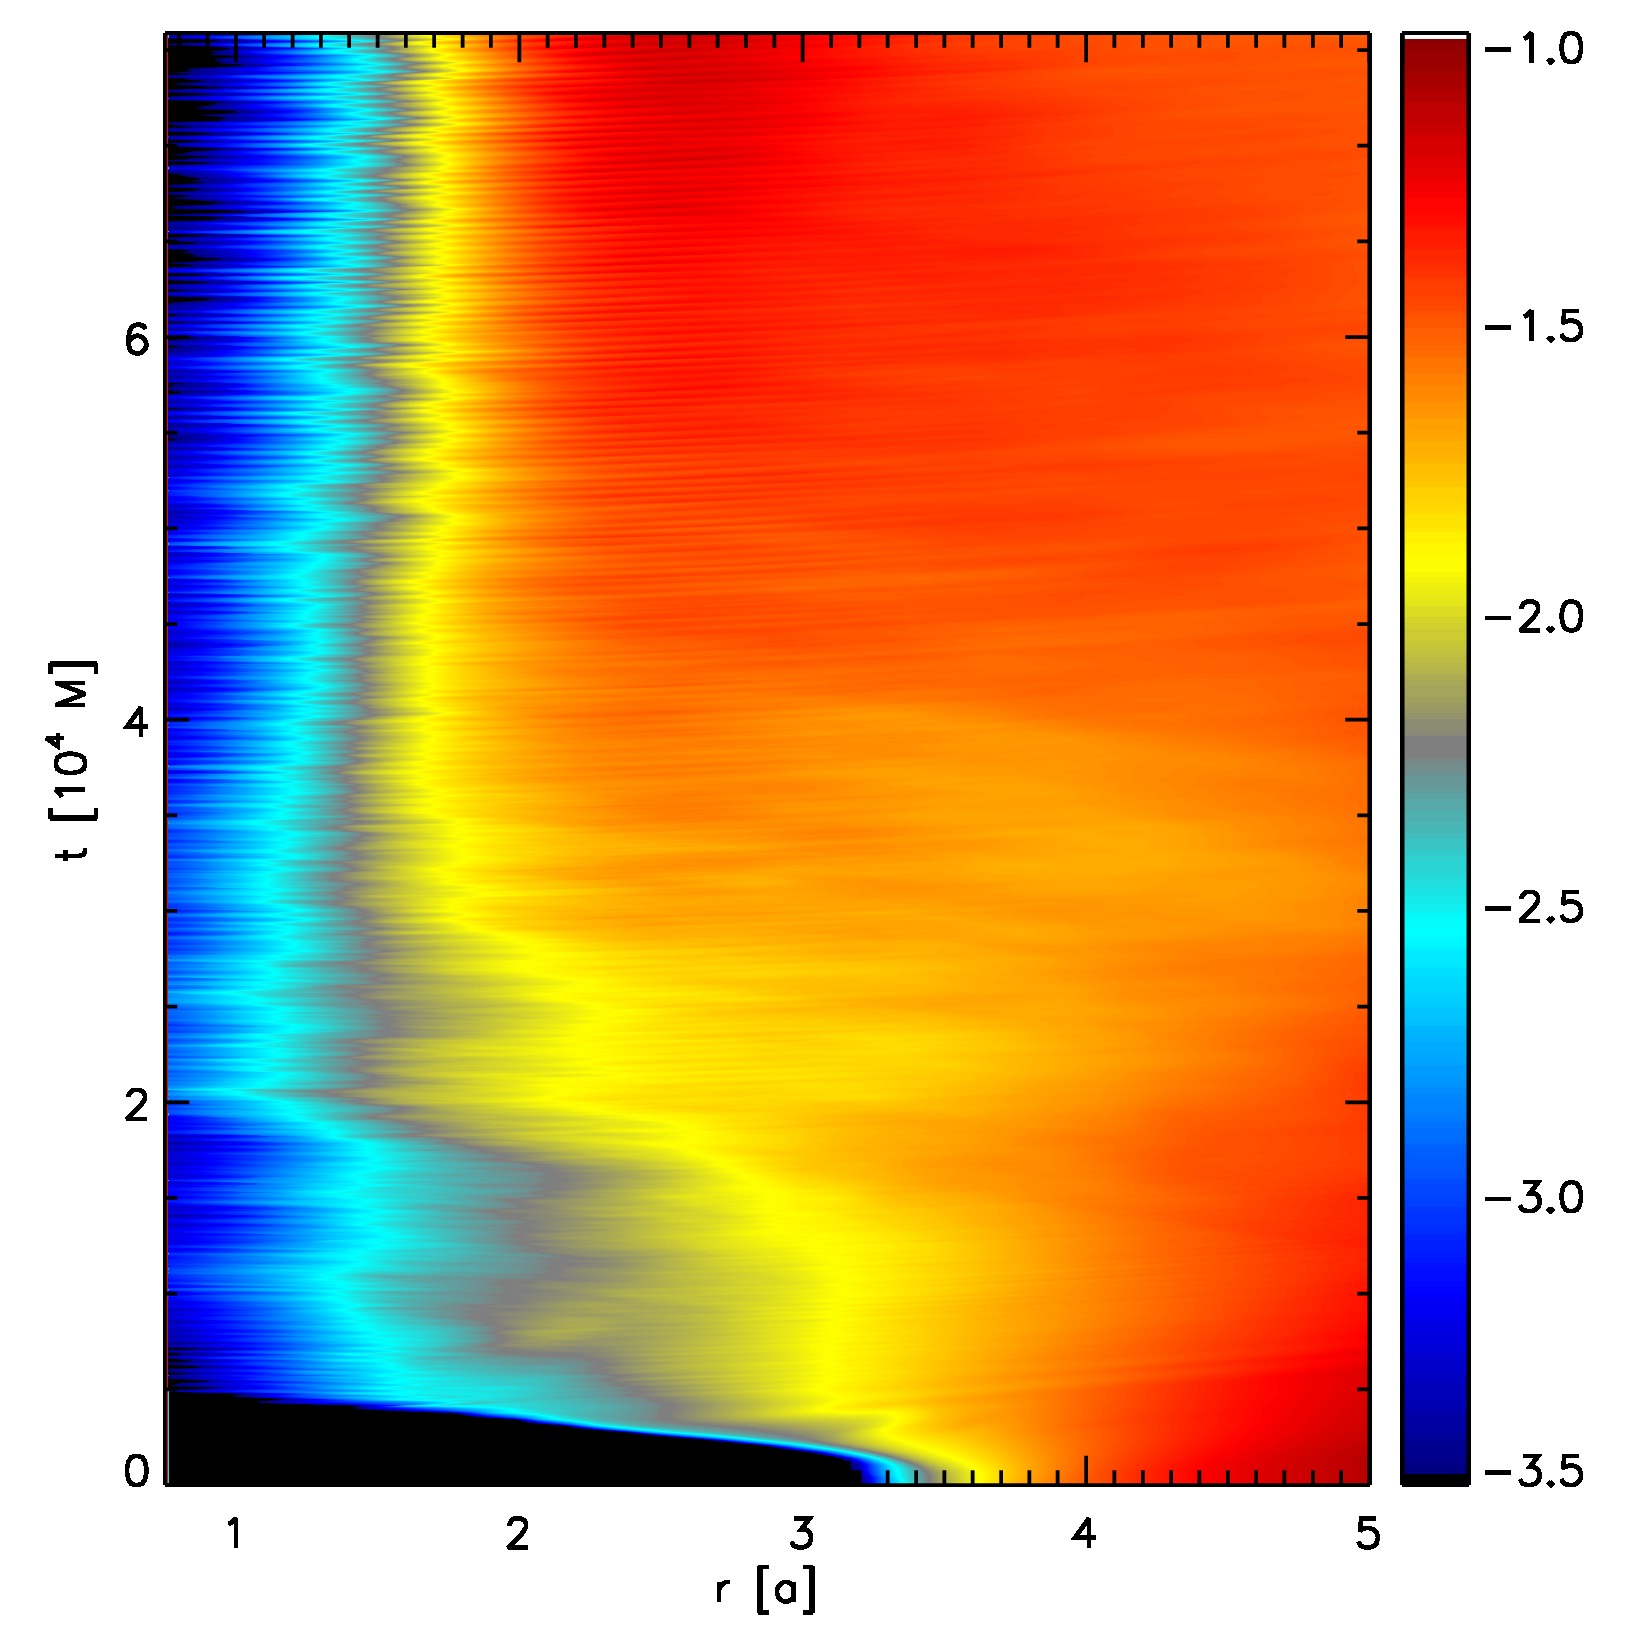

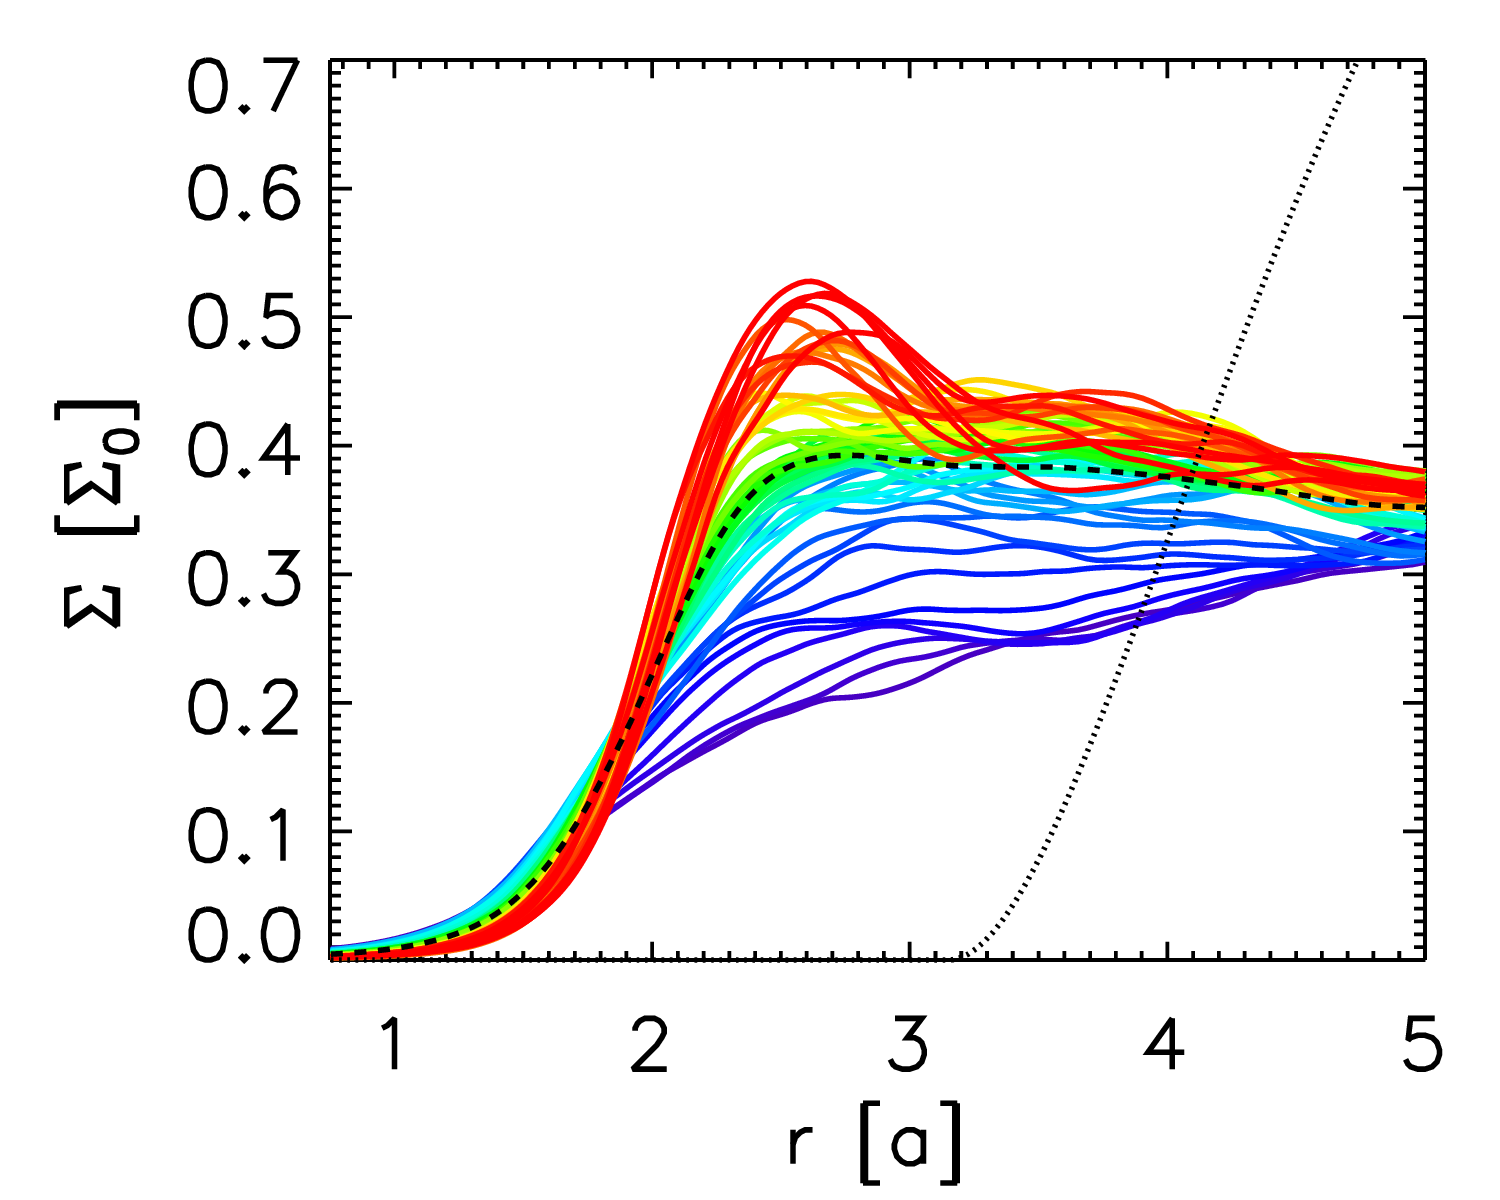
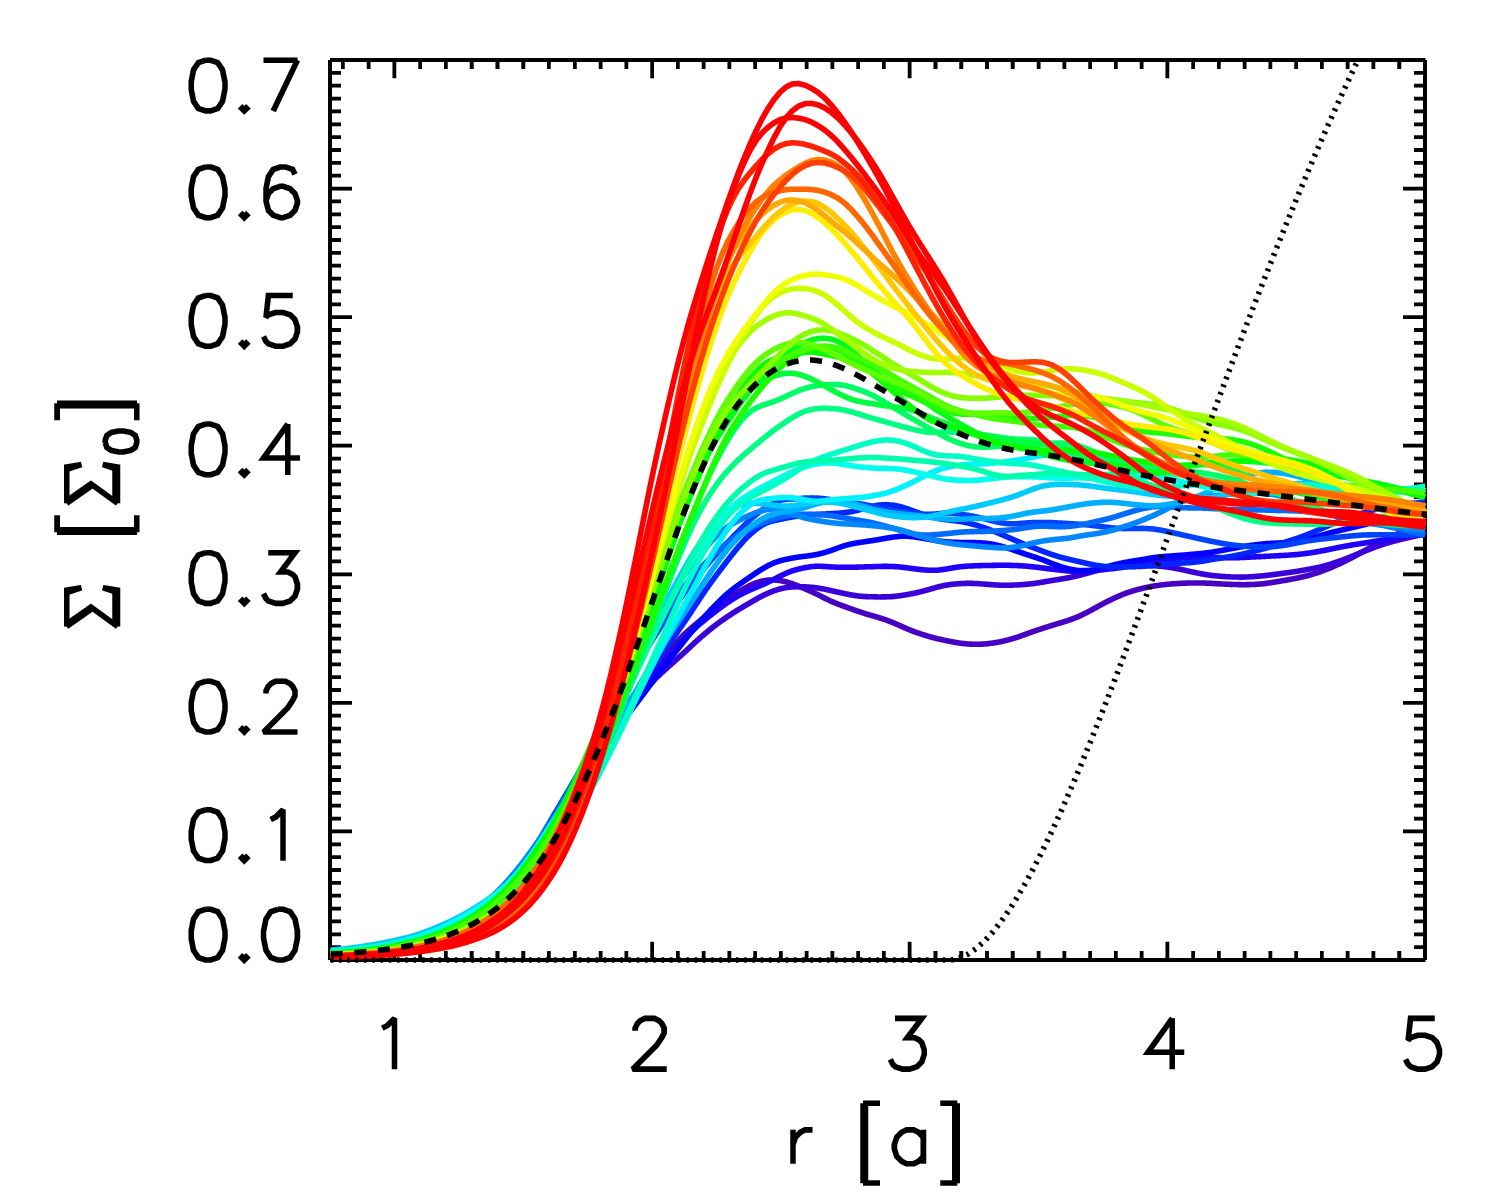
Figure 8 shows color contour plots of the surface density in logarithmic units, , for both MHD1PN_H and MHD2.5PN evolutions. At around we observe a steady increase in the surface density with time that eventually plateaus. Unlike the cases of Sec. III.2, here we see there are significant departures from initial conditions as we would expect because of the magnetic field providing a means of efficient angular momentum transfer. On the logarithmic scale, however, we see now only minor differences between the two scenarios. When analyzing Fig. 9 (which shows line plots of the surface density as a function of radial distance for fixed time steps), however, it seems that a distinctive pattern forms in the MHD2.5PN case, where a distinct local maximum appears at after a certain time, and persisting until the end of the evolution. Such a pattern is not as pronounced in the MHD1PN_H case. We note, however, that in the MHD1PN_l evolution (which has the same angular momentum as the MHD2.5PN one), this same pattern is indeed observed, implying that this difference is likely due to the differences in the disks’ initial angular momenta.
IV.3 Mass enclosed
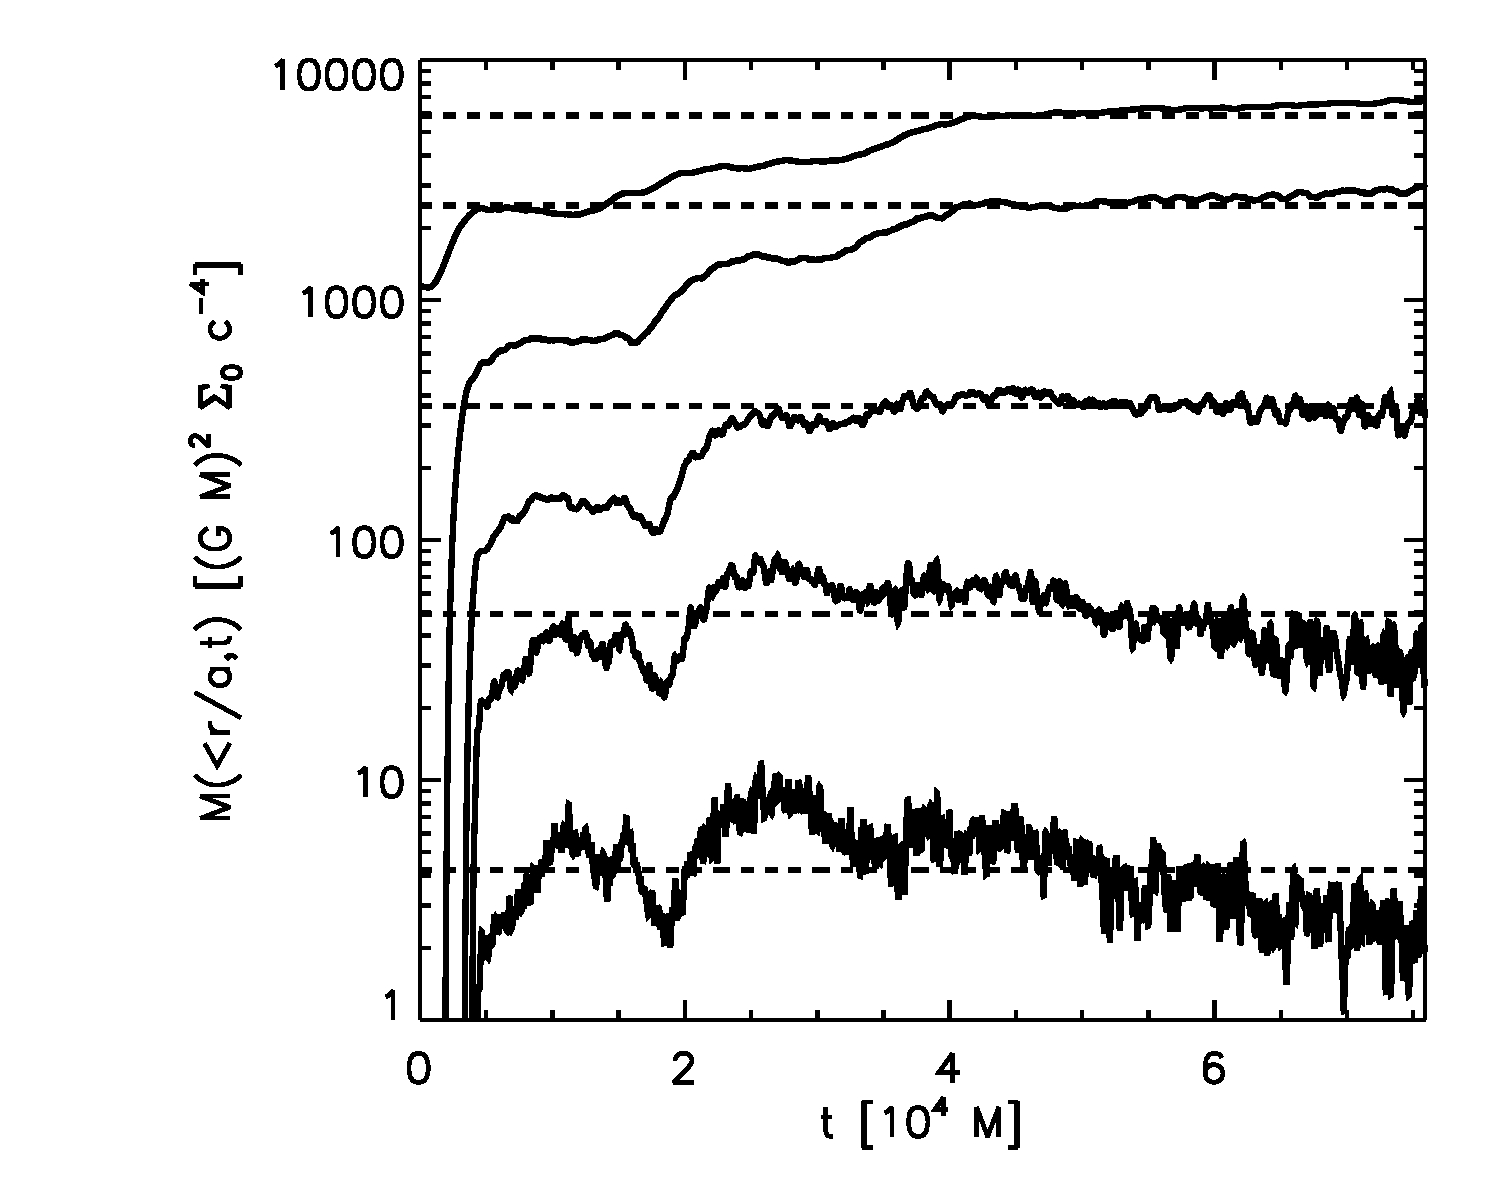
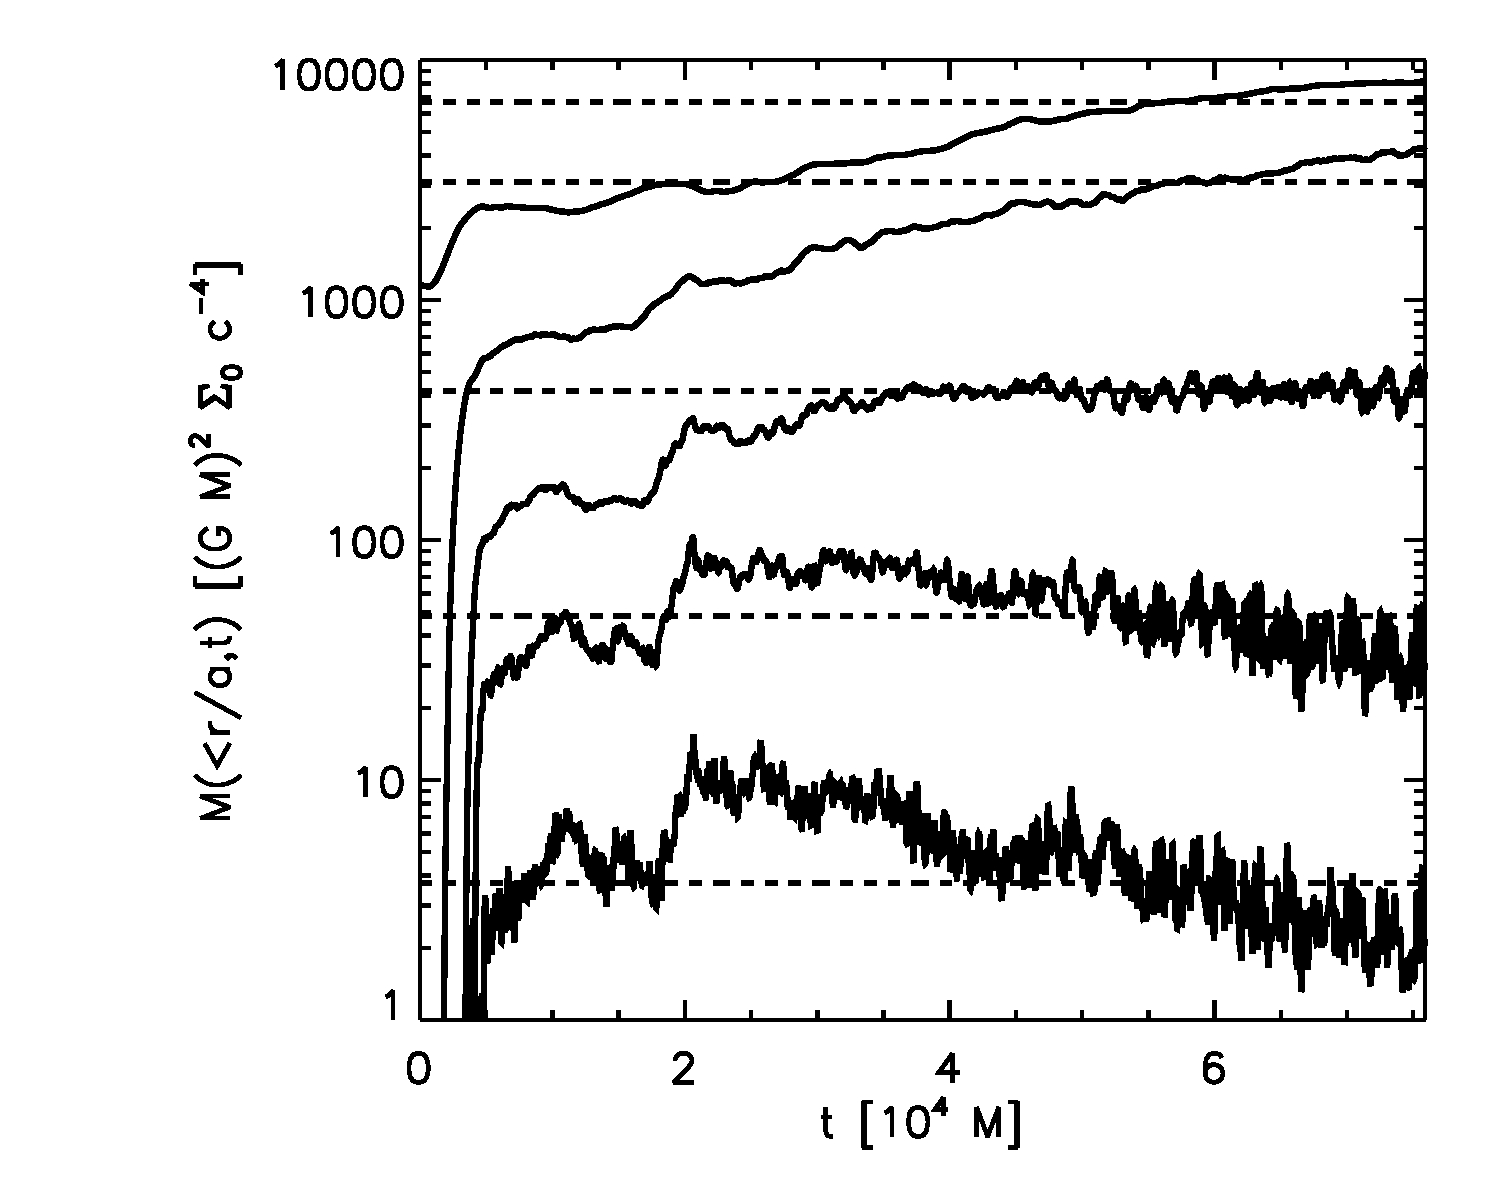
In Fig. 10 we have the equivalent of Fig. 6 for our MHD evolutions, where we see how matter accumulates in the inner disk over time. For both situations, we see a sharp increase in the mass enclosed at smaller radii early on in the evolution. As the initial transient fades away and the disk evolves to a quasi-equilibrium configuration, the mass stabilizes at a roughly constant value, particularly for large radii.
As was the case for the previous quantities, we see no noticeable difference between 1PN and 2.5PN cases. We therefore find that the differences in the spacetime and the disks’ initial conditions to not have a large effect on the rates of achieving a degree of mass inflow equilibrium.
IV.4 Luminosity
As in Noble et al. (2012), we employ a local radiative cooling function to control a disk’s aspect ratio and provide a means to predict bolometric electromagnetic signatures of circumbinary flows for a specified disk scale height profile. Specifically, the cooling function is designed so that the gas loses heat whenever its entropy rises above the initial constant entropy of the disk. This way, the integrated luminosity over time is a record of the total energy dissipated by the gas. Each disk was initialized to have approximately the same scale height. Specifically, MHD1PN_H and MHD2.5PN started with a aspect ratio of within an accuracy less than 1%, while MHD1PN_l started with a slightly slenderer profile, . In order to uncover any photometric predictors for a circumbinary system, we have analyzed the light curves produced by the simulations. We estimate the total luminosity of the disk from the local emissivity (cooling function) via
| (10) |
This method is approximate because it assumes that the radiation reaches the observer immediately without any relativistic redshift or delay (e.g., because of the disk’s opacity). It remains to be seen if these assumptions are significant, but there are many reasons to trust our results. For instance, the largest relativistic effects are expected to occur immediately near the black holes—a region we excise from our simulations; our results are therefore useful to investigate variability from the circumbinary disk and not from the matter within the gap. Further, including opacity is expected to weaken the quality factor of any periodic signal we observe as it will introduce an incoherent delay, so minor differences in the light curves will likely be obfuscated by this effect.
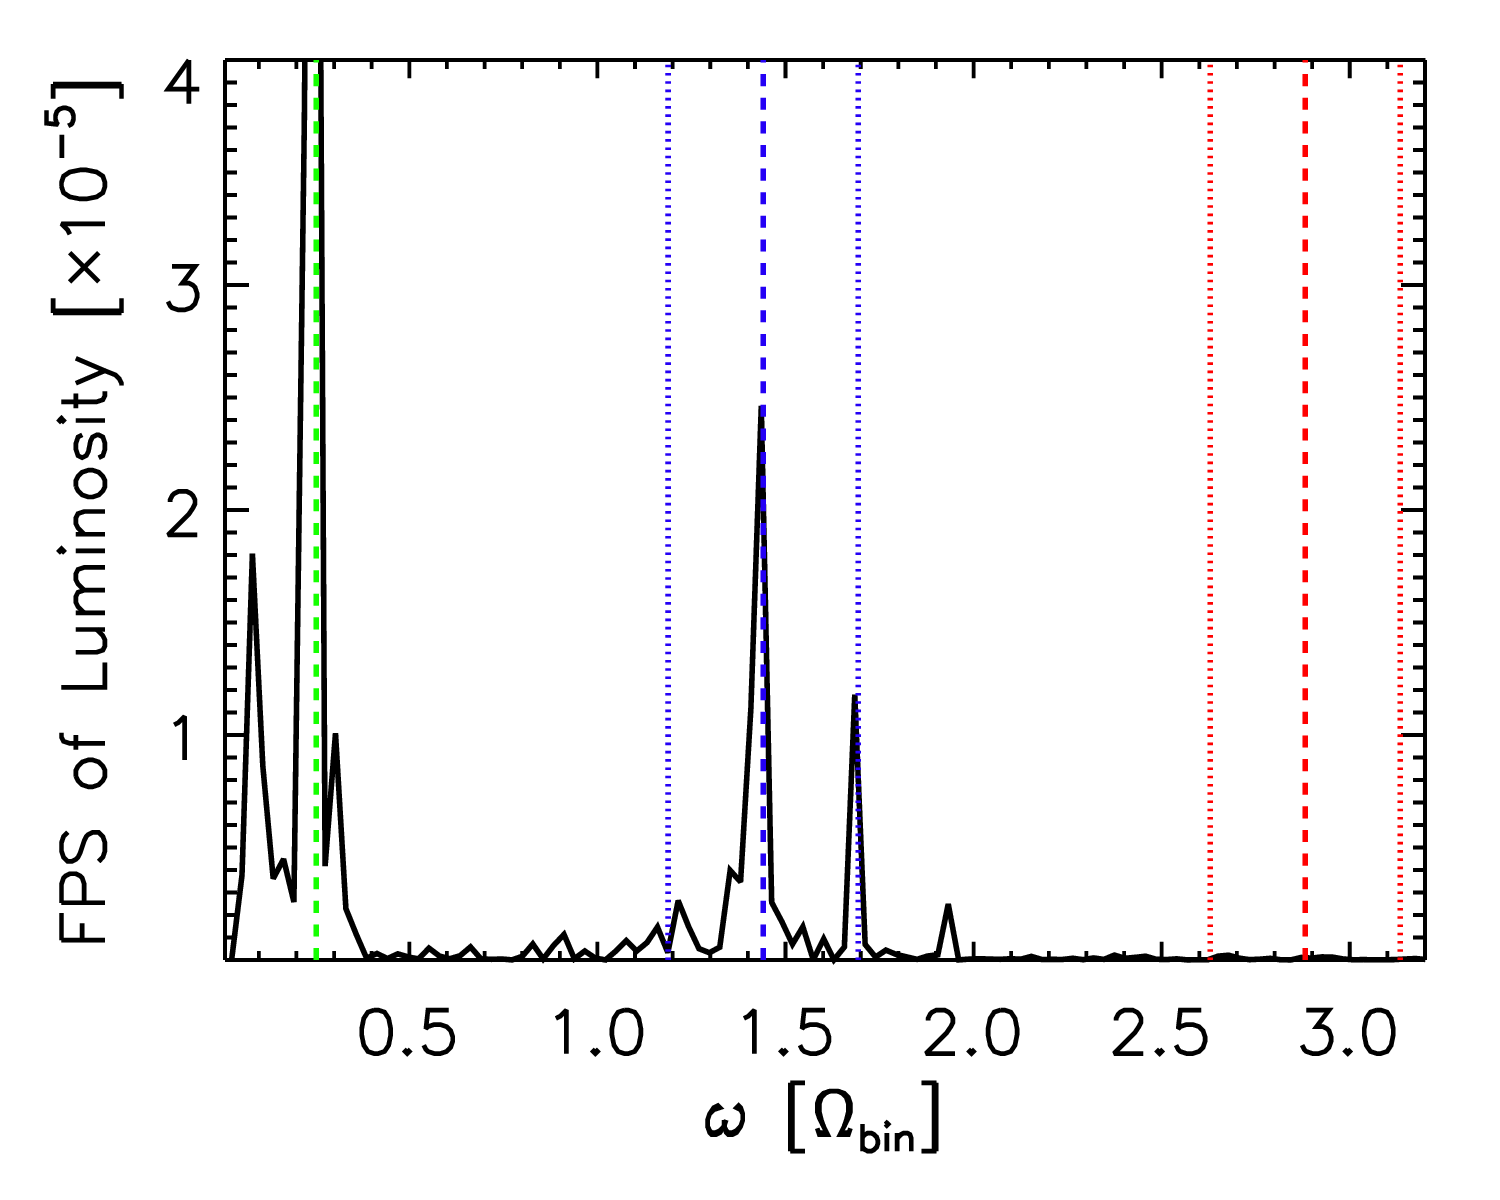
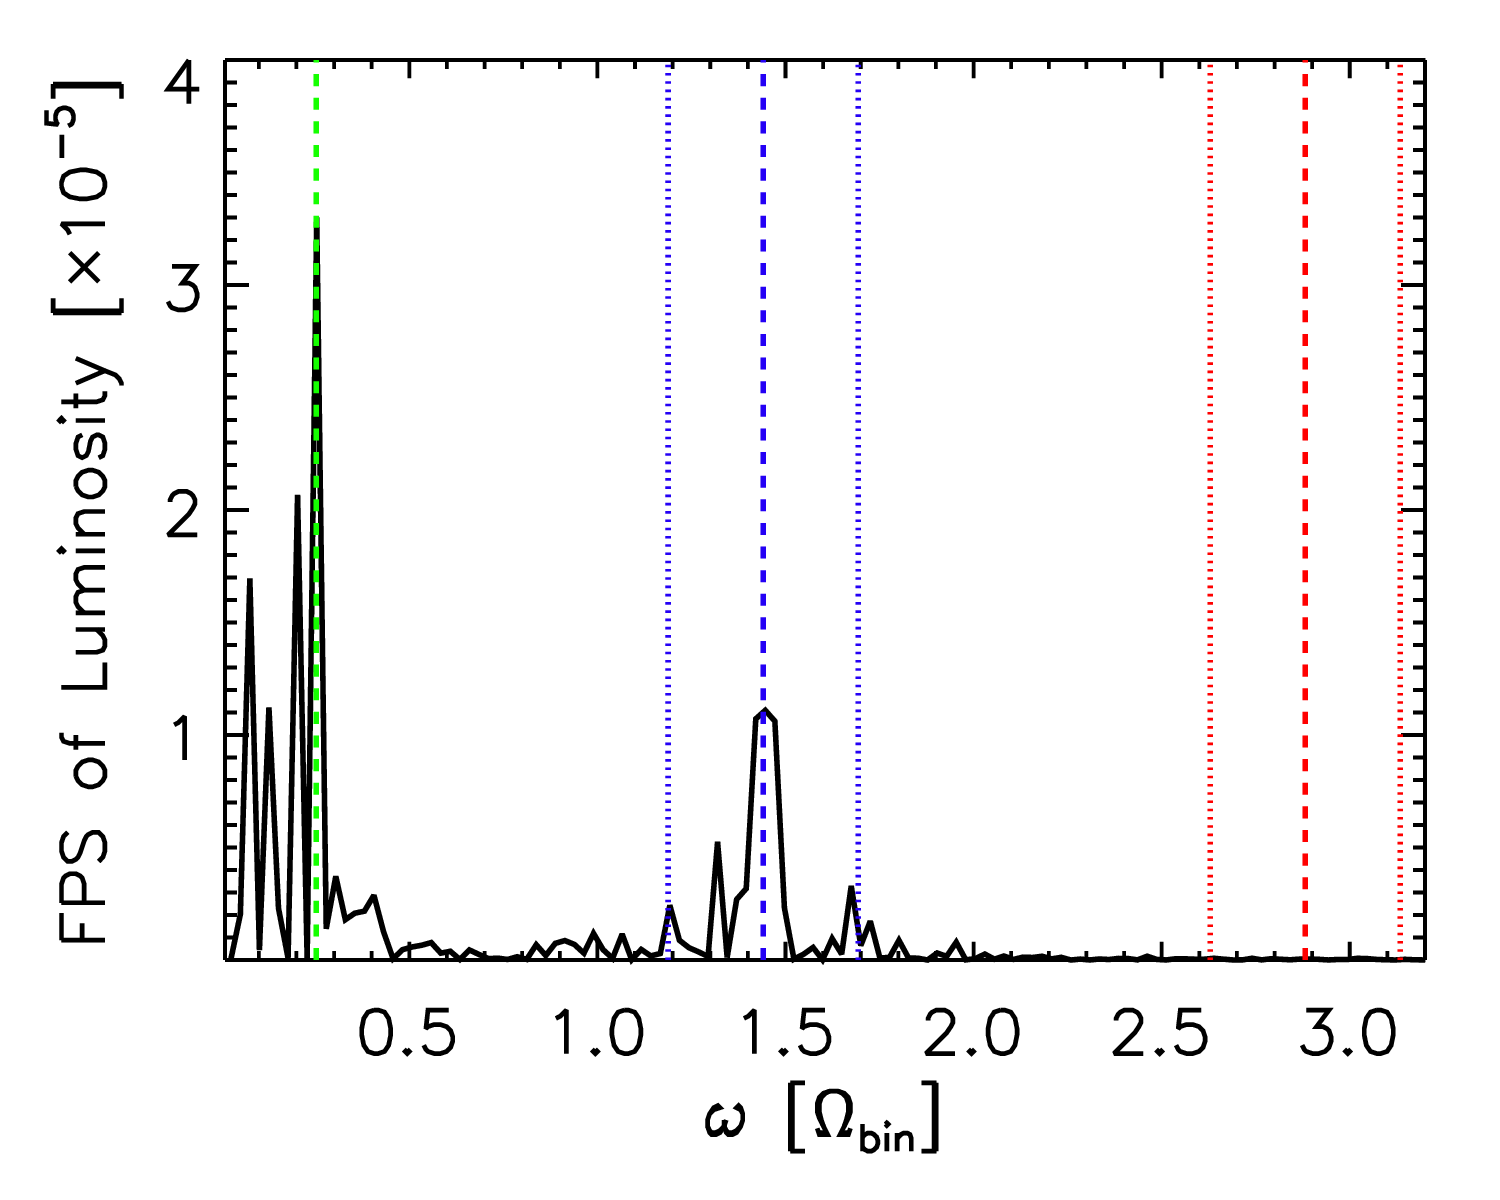
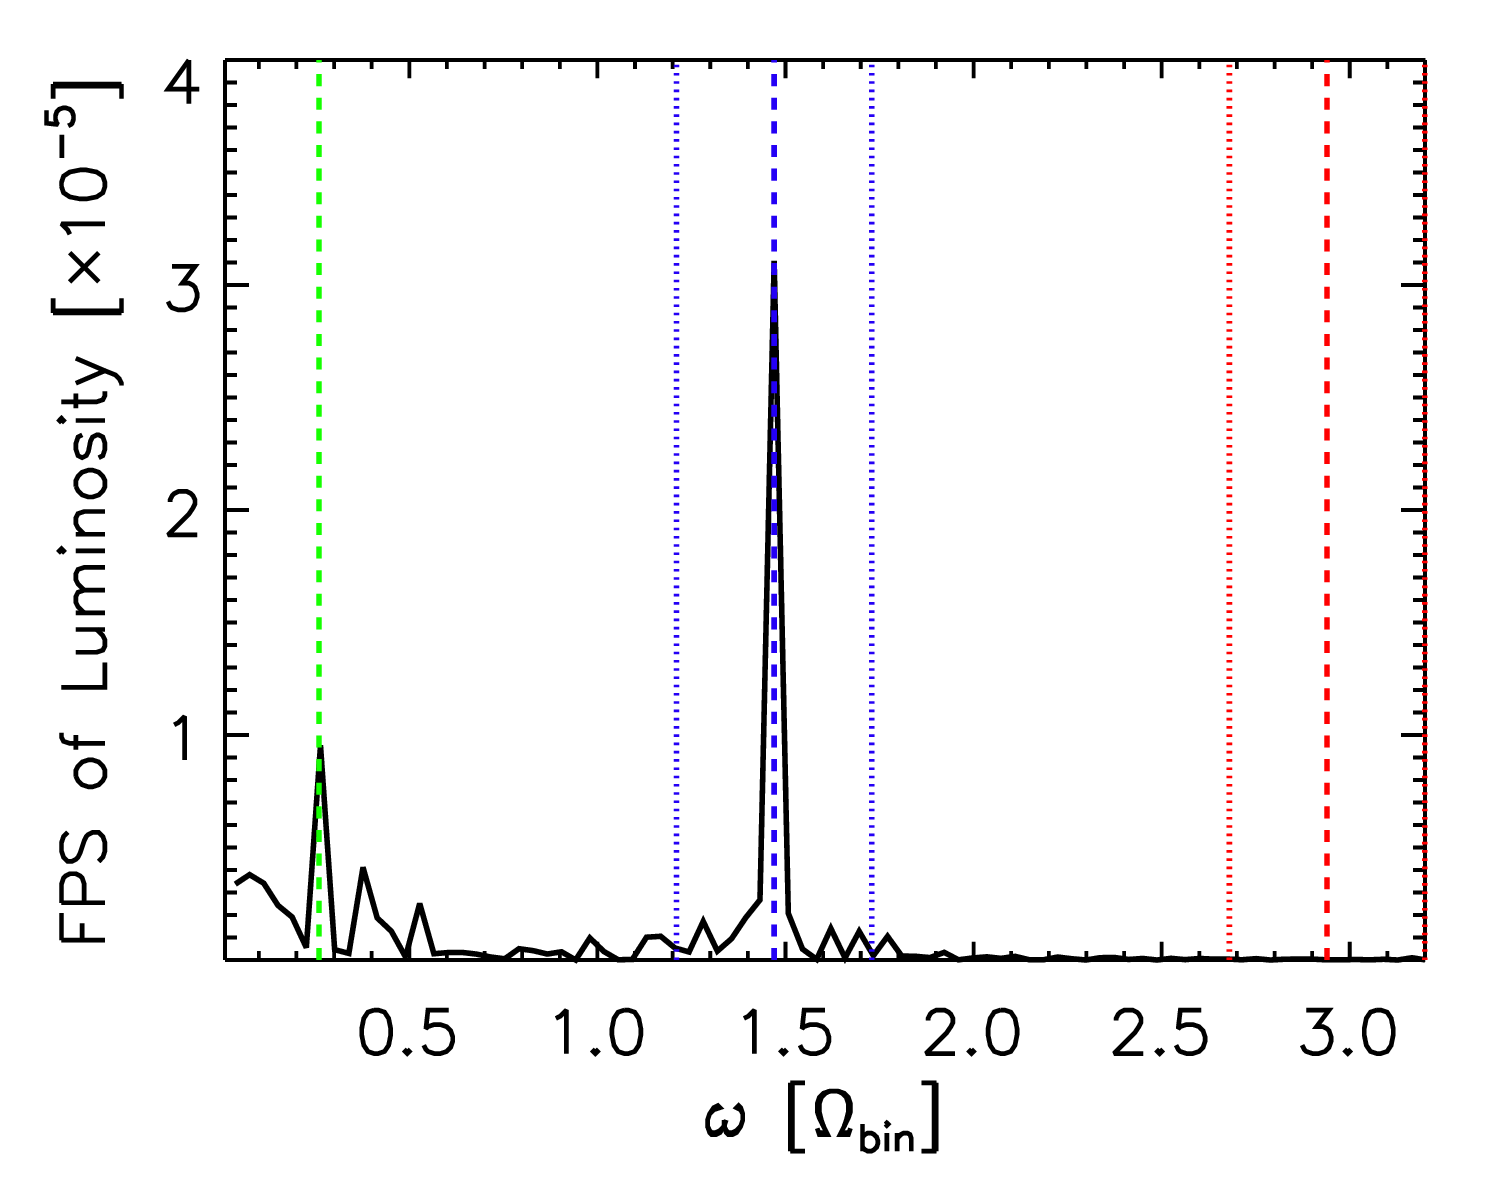
When comparing any two simulations involving chaotic turbulent flows, one never expects them to be able to make quantitative timestep-to-timestep comparisons if they start with small differences. We therefore present, temporal power spectrum (Fast Fourier Transform, FFT, of ) from each simulation’s light curve instead of the light curves themselves. In Fig. 11 we plot the Fourier power spectrum of over the latter part of the secularly-evolving period, from onward. We find that each simulation exhibits the same strong periodic signal found well above the background noise of fluctuations. As we identified before in Noble et al. (2012), it occurs at twice the beat frequency between the binary’s orbit and the orbit of the non-axisymmetric overdensity feature that develops at . The frequency, , appears at for the MHD2.5PN run, and for the two 1PN runs. Variability is seen at the frequency of the overdensity’s orbit, which we call . The time-averaged radial coordinate of the overdensity for MHD2.5PN and for the 1PN runs, leading to for MHD2.5PN and for the 1PN runs.
All three simulations see the signal at , though the MHD2.5PN run exhibits the clearest peak. On the other hand, the 1PN runs exhibit more power at and , suggesting that the variability in these runs stems more from the orbital motion of the overdensity and not the coherent interaction between the overdensity and the binary. Both 1PN runs demonstrate more power at the overdensity orbital frequency than at any other frequency, unlike what is seen from MHD2.5PN. This enhancement at seen in the 1PN runs is unlikely due to greater low-frequency noise because the 1PN power spectra were calculated from longer periods of data than what was used for MHD2.5PN’s spectrum. Even though more runs would be needed for a definitive answer, the disparity in variability power at and is the most consistent difference seen in the light curves from 1PN and 2.5PN simulations.
V Final remarks
In this work, we explored how PN order affects the evolution of non-magnetized and magnetized gas around binary black hole systems. For inviscid hydrodynamics, and separations , we found only very small differences in the gas dynamics between 1PN and 2.5PN spacetimes. For smaller separations (), there are noticeable differences in the transient behavior of the disk between PN orders, but even down to there are very little differences in the bulk dynamics of the disk. At separations of , there are noticeable differences in the bulk dynamics of unmagnetized gas between the 1PN and 2.5PN spacetimes.
We next looked at full MHD simulations of magnetized disks at . We performed two MHD simulations using the 1PN spacetime to compare with the results obtained from 2.5PN accurate spacetime, published in Noble et al. (2012). We only observed small differences between all three MHD simulations in the bulk of the disk, e.g. the differences between the 1PN and 2.5PN cases are of the same order of that between the two 1PN runs. This leads us to conclude that differences between 1PN and 2.5PN are of the same order of magnitude as differences that one would find from different initial conditions. This is because the MHD dynamics, which drives accretion, seems to effectively mask the effects from the high-order PN terms. In all three MHD runs, we discovered a unique and exciting periodic EM signature that could be used to both identify SMBH mergers in the time domain and measure their mass ratio. This signal is robust down to small binary separations, such as 20M, though it is the strongest signal over the entire frequency range for only the 2.5PN order simulation. Of course, it remains to be seen if the quantitative differences are larger than the systematic error arising from our choice of initial conditions and our choice to excise the binary. This will require further studies and simulations that are beyond the scope of this paper.
While the bulk of the disk is largely unaffected by PN order, the surface density at the inner edge of the disk shows a more significant lump for 2.5PN than 1PN. These differences are most likely due to enhanced torque densities in the 2.5PN metric within the gap. If one is interested in understanding the physics at the interface between the gap and the inner edge of the disk, our results suggest that the 2.5PN metric should be used at separations of 20M and smaller. This result, is particularly interesting in the context of a new type of simulation we are exploring, where each BH resides on the numerical domain. With this new study, we intend to explore how mini-disks form, how the accreting matter is distributed about the two SMBHs, and how the orbital dynamics of the BHs is affected by accretion. The distribution of gas and dissipation of internal stresses will provide us with the means of tracking when and where light is radiated in the system and answer key questions about the accretion dynamics of merging SMBHs.
Acknowledgements.
We would like to thank J. Krolik, B. Mundim, H. Nakano and L. Blanchet for discussions and helpful input. M.Z. is supported by NSF grants OCI-0832606, PHY-0969855, AST-1028087, and PHY-1229173. S.C.N. is supported by NSF grant No. OCI-0725070, OCI-0832606, AST-1028087, PHY-1125915. Computational resources were provided by XSEDE allocation TG-PHY060027N, and by NewHorizons and BlueSky Clusters at Rochester Institute of Technology, which were supported by NSF grant No. PHY-0722703, DMS-0820923, AST-1028087, and PHY-1229173.Appendix A Numerical Details
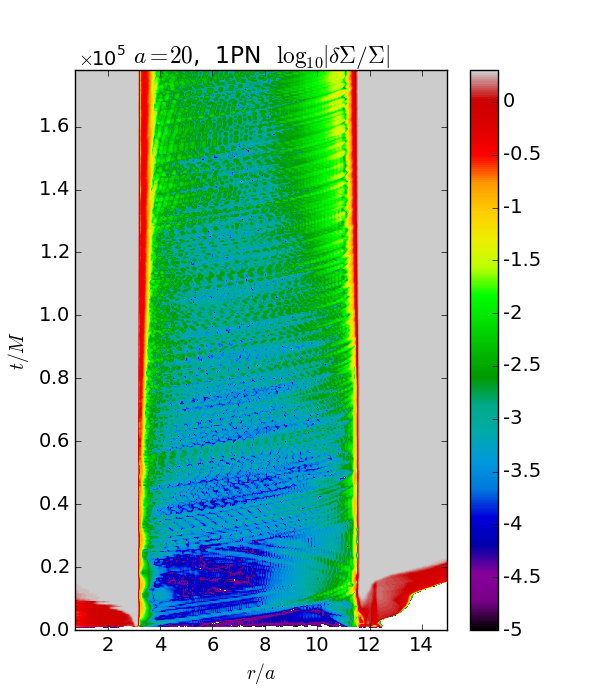
In order to make sure that our results were not an artifact of numerical errors accumulating with time, we have repeated runs hydro1PN_a20 and hydro2.5PN_a20 using cells (instead of our “standard” ). In Fig. 12 we plot the corresponding relative change in , since this quantity proved to be quite sensitive to small changes in configurations. These plots should be matched against the lower panel of Fig. 5, depicting its lower resolution counterpart. As can be observed, the figures are remarkably similar, which gives us confidence that numerical errors are not masking the results we have found.
Another approximation we make in our non-magnetized and magnetized runs is that we excise the spherical region including the binary’s orbit, out to a coordinate radius of 1.5 binary separations. One may argue that differences in the two PN spacetimes will put this excision surface at different proper distances, and so may result in an inconsistent setup that ultimately contaminates the numerical comparisons between runs with different PN accuracies. As one can see from the relative differences in shown in Figure 1, the differences in proper distances beyond the binary’s orbit are expected to be no more than a few percent. Further, Shi et al. (2012) have performed a sequence of Newtonian MHD runs with different excision radii and found that changes yield insignificant differences in results, such as those reported here. Further, their Newtonian results—specifically the various contributions to —are remarkably similar to our 2.5PN results, let alone our 1PN results. Hence, we do not expect that differences in the proper radius of the excision surface to be a large effect. Whether or not the excision method is valid at all requires us to repeat our simulations without any excision. Such calculations would be extremely expensive to perform in their entirety, but we hope to investigate this issue with shorter runs and/or smaller setups in the future.
The principal angular momentum transfer mechanism is the correlated MHD stress associated with the MRI. It is therefore critical for simulations hoping to realistically represent a magnetized turbulent disk to adequately resolve the fastest growing modes of this instability. Experience has shown that several conditions should be met in order for global simulations to sufficiently resolve the MRI Noble et al. (2010); Hawley et al. (2011) and the vertical scale height of the disk Sorathia et al. (2012). The MRI resolution benchmarks are given in terms of quality factors per dimension () which are proportional to the number of cells per MRI wavelength along the dimension. Their suggested benchmarks are and Hawley et al. (2011), which all our MHD simulations meet everywhere in the disk’s bulk until late times () in the orbiting overdensity region or “lump.” Further, all our simulations cover the disk’s vertical scale height with more than cells on average over the course of each run, which more than satisfies the suggested target of cells per scale height of Sorathia et al. (2012). We emphasize that our new results presented here satisfy these resolution requirements just as well as our original run, hence all our MHD results resolve the MRI quite well. Please see Noble et al. (2012) for specific details on how we measure a run’s MRI resolution criteria. Again, we wish to emphasize that the only uncertainty in our simulations meeting the MRI resolution criteria arises at late times when magnetic flux escapes and/or dissipates within the overdensity region; at all other times throughout the bulk of the disk, the criteria are satisfied with great excess. We will explore flux loss phenomenon in the lump using a different variety of initial conditions in a future paper.
References
- Magorrian et al. (1998) J. Magorrian, S. Tremaine, D. Richstone, R. Bender, G. Bower, A. Dressler, S. M. Faber, K. Gebhardt, R. Green, C. Grillmair, et al., AJ 115, 2285 (1998), eprint astro-ph/9708072.
- Gebhardt et al. (2000) K. Gebhardt, R. Bender, G. Bower, A. Dressler, S. M. Faber, A. V. Filippenko, R. Green, C. Grillmair, L. C. Ho, J. Kormendy, et al., ApJL 539, L13 (2000), eprint astro-ph/0006289.
- Ferrarese and Merritt (2000) L. Ferrarese and D. Merritt, ApJL 539, L9 (2000), eprint astro-ph/0006053.
- Kormendy and Ho (2013) J. Kormendy and L. C. Ho, Ann. Rev. Astron. Astrop. 51, 511 (2013), eprint 1304.7762.
- Silk and Rees (1998) J. Silk and M. J. Rees, AAp 331, L1 (1998), eprint astro-ph/9801013.
- Fabian (1999) A. C. Fabian, MNRAS 308, L39 (1999), eprint astro-ph/9908064.
- Volonteri et al. (2003) M. Volonteri, F. Haardt, and P. Madau, ApJ 582, 559 (2003), eprint arXiv:astro-ph/0207276.
- Volonteri (2007) M. Volonteri, ApJL 663, L5 (2007), eprint arXiv:astro-ph/0703180.
- Schnittman (2007) J. D. Schnittman, ApJL 667, L133 (2007), eprint 0706.1548.
- Begelman et al. (1980) M. C. Begelman, R. D. Blandford, and M. J. Rees, Nature 287, 307 (1980).
- Deane et al. (2014) R. Deane, Z. Paragi, M. Jarvis, M. Coriat, G. Bernardi, et al., Nature 511, 57 (2014), eprint 1406.6365.
- Bogdanovic (2014) T. Bogdanovic (2014), eprint 1406.5193.
- Amaro-Seoane et al. (2013) P. Amaro-Seoane, S. Aoudia, S. Babak, P. Binétruy, E. Berti, A. Bohé, C. Caprini, M. Colpi, N. J. Cornish, K. Danzmann, et al., GW Notes, Vol. 6, p. 4-110 6, 4 (2013), eprint 1201.3621.
- Amaro-Seoane et al. (2012) P. Amaro-Seoane, S. Aoudia, S. Babak, P. Binetruy, E. Berti, et al., Class. Quant. Grav. 29, 124016 (2012), eprint 1202.0839.
- Seoane et al. (2013) P. A. Seoane et al. (eLISA Collaboration) (2013), eprint 1305.5720.
- Macfadyen and Milosavljevic (2008) A. I. Macfadyen and M. Milosavljevic, Astrophys. J. 672, 83 (2008), eprint astro-ph/0607467.
- Shi et al. (2012) J.-M. Shi, J. H. Krolik, S. H. Lubow, and J. F. Hawley, Astrophys. J. 749, 118 (2012), eprint 1110.4866.
- Noble et al. (2012) S. C. Noble, B. C. Mundim, H. Nakano, J. H. Krolik, M. Campanelli, Y. Zlochower, and N. Yunes, Astrophys. J. 755, 51 (2012), eprint 1204.1073.
- Roedig and Sesana (2014) C. Roedig and A. Sesana, MNRAS 439, 3476 (2014), eprint 1307.6283.
- Farris et al. (2014) B. D. Farris, P. Duffell, A. I. MacFadyen, and Z. Haiman, ApJ 783, 134 (2014), eprint 1310.0492.
- Shi and Krolik (2014) J.-M. Shi and J. H. Krolik, in preparation (2014).
- Nixon et al. (2011) C. J. Nixon, P. J. Cossins, A. R. King, and J. E. Pringle, MNRAS 412, 1591 (2011), eprint 1011.1914.
- Bankert et al. (2014) J. Bankert, J. H. Krolik, and J. M. Shi, in preparation (2014).
- Bode et al. (2010) T. Bode, R. Haas, T. Bogdanović, P. Laguna, and D. Shoemaker, ApJ 715, 1117 (2010), eprint 0912.0087.
- Bode et al. (2012) T. Bode, T. Bogdanović, R. Haas, J. Healy, P. Laguna, and D. Shoemaker, ApJ 744, 45 (2012), eprint 1101.4684.
- Palenzuela et al. (2010) C. Palenzuela, L. Lehner, and S. Yoshida, Phys. Rev. D 81, 084007 (2010), eprint 0911.3889.
- Farris et al. (2010) B. D. Farris, Y. T. Liu, and S. L. Shapiro, Phys. Rev. D 81, 084008 (2010), eprint 0912.2096.
- Farris et al. (2012) B. D. Farris, R. Gold, V. Paschalidis, Z. B. Etienne, and S. L. Shapiro, Physical Review Letters 109, 221102 (2012), eprint 1207.3354.
- Giacomazzo et al. (2012) B. Giacomazzo, J. G. Baker, M. C. Miller, C. S. Reynolds, and J. R. van Meter, ArXiv e-prints (2012), eprint 1203.6108.
- Gold et al. (2013) R. Gold, V. Paschalidis, Z. B. Etienne, S. L. Shapiro, and H. P. Pfeiffer (2013), eprint 1312.0600.
- Blanchet et al. (1998) L. Blanchet, G. Faye, and B. Ponsot, Phys. Rev. D58, 124002 (1998), eprint gr-qc/9804079.
- Gammie et al. (2003) C. F. Gammie, J. C. McKinney, and G. Tóth, ApJ 589, 444 (2003), eprint astro-ph/0301509.
- Noble et al. (2009) S. C. Noble, J. H. Krolik, and J. F. Hawley, Astrophys. J. 692, 411 (2009), eprint 0808.3140.
- Will (2011) C. M. Will, Proc. Nat. Acad. Sci. 108, 5938 (2011), eprint 1102.5192.
- Mundim et al. (2014) B. C. Mundim, H. Nakano, N. Yunes, M. Campanelli, S. C. Noble, et al., Phys. Rev. D89, 084008 (2014), eprint 1312.6731.
- Zilhao and Noble (2014) M. Zilhao and S. C. Noble, Class. Quant. Grav. 31, 065013 (2014), eprint 1309.2960.
- Misner et al. (1973) C. W. Misner, K. S. Thorne, and J. A. Wheeler, Gravitation (W. H. Freeman, San Francisco, 1973).
- Tóth (2000) G. Tóth, Journal of Computational Physics 161, 605 (2000).
- Noble et al. (2006) S. C. Noble, C. F. Gammie, J. C. McKinney, and L. Del Zanna, ApJ 641, 626 (2006), eprint arXiv:astro-ph/0512420.
- Farris et al. (2011) B. D. Farris, Y. T. Liu, and S. L. Shapiro, Phys. Rev. D84, 024024 (2011), eprint 1105.2821.
- Noble et al. (2010) S. C. Noble, J. H. Krolik, and J. F. Hawley, Astrophys. J. 711, 959 (2010), eprint 1001.4809.
- Hawley et al. (2011) J. F. Hawley, X. Guan, and J. H. Krolik, ApJ 738, 84 (2011), eprint 1103.5987.
- Sorathia et al. (2012) K. A. Sorathia, C. S. Reynolds, J. M. Stone, and K. Beckwith, ApJ 749, 189 (2012), eprint 1106.4019.