Coexistence of superconductivity and density wave in : an optical spectroscopy study
Abstract
We performed an optical spectroscopy measurement on single crystals of , which is a newly discovered superconductor showing a coexistence of superconductivity and density wave orders. The study reveals spectral changes associated with both density wave and superconductivity phase transitions. The density wave phase transition at 125 K leads to the reconstruction of Fermi surfaces which removes about half of Drude spectral weight. The ratio of 2/ 11.9 is considerably larger than the mean-field value based on the weak-coupling BCS theory. At the lowest temperature in the superconducting state, further spectral change associated with the superconducting condensate is observed. The low frequency optical conductivity could be well modeled within Mattis-Bardeen approach with two isotropic gaps of meV and meV. The superconducting properties of compound are similar to those of .
pacs:
74.70.Xa, 74.25.Gz, 74.25.ndI Introduction
The discovery of iron-based superconductors[1] has generated tremendous interest in condensed-matter community and triggered new efforts in exploring superconductors in new families of compounds. The exploration has been mainly focused on materials with structural, electronic, and magnetic properties similar to those of the iron or cuprate superconductors, or those close to charge- or magnetic instabilities. The efforts lead to the discovery of superconductivity in BaTi2Sb2O with 1.2 K [2]. The compound belongs to a two-dimensional (2D) titanium oxypnictide family, consisting of alternate stacking of conducting octahedral layers Ti2Pn2O (Pn=As, Sb) and other insulating layers (e.g. Na2, Ba, (SrF)2, (SmO)2) [4, 5, 6, 7, 8, 9, 10, 11, 12, 3]. The undoped compounds in this family commonly exhibit phase transitions below certain temperatures (e.g. 320 K for Na2Ti2As2O [5, 6, 7, 8, 10], 114 K for Na2Ti2Sb2O [6], 200 K for BaTi2As2O [11], 45 K for BaTi2Sb2O [2]), as characterized by the sharp jumps in resistivity and drops in magnetic susceptibility. First principle band structure calculations indicate that the phase transitions are driven by density wave (DW) instabilities arising from the nested electron and hole Fermi surfaces (FSs) [13, 14, 15, 16, 17]. However, there is no agreement on whether the DW is a charge density wave (CDW) or a spin density wave (SDW). As superconductivity emerges only in compound with low phase transition temperature, i.e. BaTi2Sb2O, and Tc is further enhanced when the phase transition temperature was suppressed by doping, e. g. Na ( 5.5 K)[18], K (6.1 K) [19], Rb (5.4 K)[20] and Sn ( 2.5 K)[21] and with isovalent Bi substitution for Sb (4.6 K)[3], the family offers a new playground to study the interplay between superconductivity and DW instabilities.
Among the newly discovered oxypnictide superconductors, (Ba22241) is particularly interesting. From the structural point of view, the compound can be considered as an intergrowth of and [22]. Although neither nor is superconducting, the combined structure, Ba22241, shows superconductivity at =21.5 K without doping. Furthermore, the compound still shows a DW transition at =125 K. Compared with BaTi2As2O, the DW ordering temperature is significantly reduced. Previous studies show that the anomaly at is due to a SDW or CDW transition in the block and the superconductivity arises from layer rather than layer[22, 23]. First principle calculations indicate the FSs can be separated into Ti-related sheets and Fe-related sheets and there is a charge transfer from layers to layers[23]. Therefore, there is a self-doping effect, which suppresses the stripe type antiferromagnetism at the Fe sites and simultaneously induces superconductivity. The Ba22241 material represents a rare example to show two-dimensional DW ordering sandwiched by superconducting layers. It would be very interesting to investigate the charge dynamical properties of this material.
In this work, we report an optical study on single crystals. Above , we observe a metallic response with plasma frequency of 2.6 eV. A typical density wave energy gap forms when the compound enters into the DW ordering phase, leading to the removal of parts of the FSs. The sample remains metallic below . A ratio of 11.9 is obtained. The value is considerably larger than the mean-field value of the weak-coupling BCS theory. Below , we observe the formation of superconducting condensate. About of the free carrier spectral weight in the normal state collapses into the superconducting condensate, suggesting that the material is not in the clean limit. The optical conductivity at the lowest temperature could be well reproduced by Mattis-Bardeen formula with two isotropic gaps of meV and meV. The coexistence of density wave and superconductivity makes a promising candidate to study collective excitations in broken symmetry states.
II Experiments
The single crystal samples used in our optical measurements were grown by employing a flux method. Detailed procedure of crystal growth and characterization could be found elsewhere [24]. The optical reflectance measurements were performed on Bruker IFS 113v and 80v spectrometers in the frequency range from 30 to 35 000 cm . An in situ gold and aluminium overcoating technique was used to obtain the reflectivity R(). The real part of conductivity is obtained by the Kramers-Kronig transformation of R(). The Hagen-Rubens relation was used for low frequency extrapolation; at high frequency side a relation was used up to 300 000 cm , above which was applied.
III Results
III.1 Density wave state
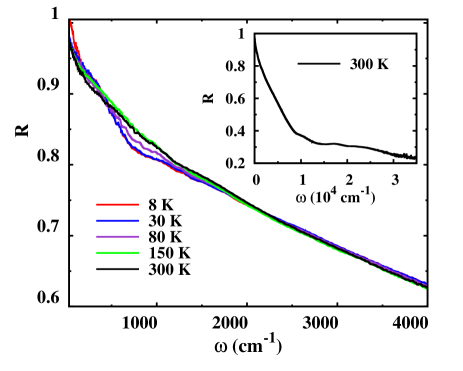
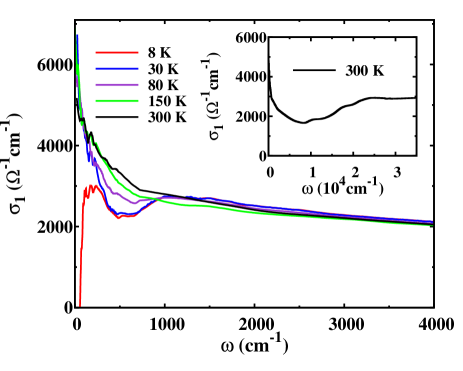
Figure 1 and 2 show the reflectivity and real part of the optical conductivity spectra at different temperature, respectively. At 300 K and 150 K, the temperature higher than the phase transition, shows typical metallic responses. The decreases almost linearly with frequency at low energy region, which is a common feature in materials with strong carrier scatterings. Below the density wave transition temperature , is obviously suppressed at the energy roughly lower than 1100 cm . Accordingly, shows a peak structure at this frequency. This feature is similar to what has been observed for the two other titanium oxypnictide compounds Na2Ti2Sb2O [25] and Na2Ti2As2O [28], though its structure is less prominent. The optical data clearly indicate the formation of a density wave energy gap. At lower energies, becomes even higher than the values at higher temperatures and there still exists well defined Drude component in . Therefore, the compound is still metallic and the Fermi surfaces are only partially gapped below . The suppressed spectral weight due to the opening of the density wave energy gap is transferred to higher energy scales.
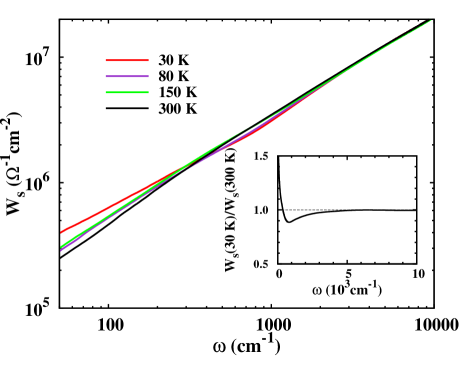
In Fig. 3, we plot the frequency-dependent integrated spectral weight at different temperatures in the normal state. The spectral weight is defined as , where is a cut-off frequency. We can see that the spectral weight is gradually recovered at high frequencies. The spectral weight transfer is seen more clearly in the plot of the ratio of the spectral weight at two different temperatures below and above the density wave transition, e.g. , as shown in the inset of Fig. 3. The value of the ratio is higher than unity at very low frequency, which is apparently due to the higher conductivity values of the narrow Drude component in the density wave state. The ratio becomes less than the unity at higher energy due to the opening of density wave energy gap in spectrum at 30 K. Eventually, the spectral weight is recovered and the ratio approaches unity at higher energies.
To characterize the spectral change across the phase transition, we decompose the optical conductivity spectra into different components using a Drude-Lorentz analysis. The dielectric function has the form [27]
| (1) |
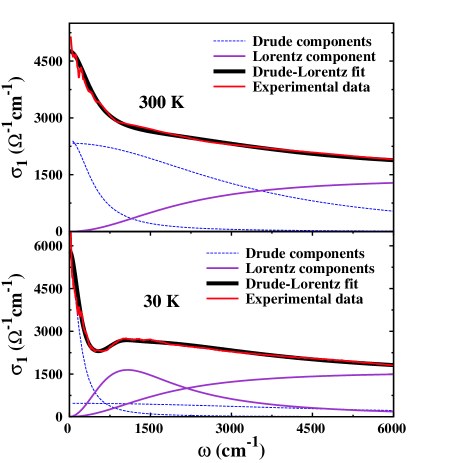
where is the dielectric constant at high energy, the middle and last terms are the Drude and Lorentz components. The complex conductivity is . As shown in Fig. 4, the conductivity spectrum below 6000 cm at room temperature could be well reproduced by two Drude components (a sharp one and a broaden one) and a Lorentz component. At 30 K an additional Lorentz component at low frequency is added to character the density wave energy gap. The two Drude components model has been widely used in the study of Fe-based superconductors or other multi-band systems [29, 30, 31]. The overall plasma frequency is considered to contribute from two different channels with . In the present case we obtain 21600 cm above and 15000 cm at 30 K. Another method to estimate the overall plasma frequency is to calculate the low- spectral weight, . The cut-off frequency is chosen so as to make the integration cover all contribution from free carriers and exclude contribution from interband transitions. Usually, the integral goes to a frequency where the conductivity shows a minimum. We expect there is a balance between the Drude component tail and the onset part of interband transition. In view of the complex band structure of this material there should exist multiple interband transitions even at mid-infrared frequency region. There is no good way to choose the cut-off frequency. Then, we refrain from calculating the plasma frequency from this method. Assuming that the effective mass of charge carriers does not change very much, we get the ratio of , suggesting that about half of the free carrier spectral weight remains after the phase transition. Compared with the [28] and [25] in which about FSs is removed, here in much less fraction of the FSs is removed after the phase transition. This result can be easily understood considering the fact that the FSs are contributed from both and layers and only those from layer are affected by the density wave phase transition. The density wave gap size can be identified by the peak position of the Lorentz component and we get cm =134 meV. The gap ratio is larger than the mean-field value based on the weak-coupling BCS theory. Similar values were also seen for two other titanium-based compounds in optical studies [25, 28].
III.2 Superconducting state
Below , further spectral change is observed due to the development of superconductivity. Compared with the spectrum at 30 K in the normal state, at 8 K shows a clear upturn at very low- region and reach approximately unity at about 55 cm , as can be seen from Fig. 1. Correspondingly, the drops to zero at the same energy scale, as shown in Fig. 5. Therefore, superconducting condensate and formation of superconducting energy gap are clearly observed in far-infrared measurement. According to the Ferrell-Glover-Tinkham (FGT) sum rule, the difference of the spectral weight between and (the so-called missing area) is related to the formation of a superconducting condensate [26],
| (2) |
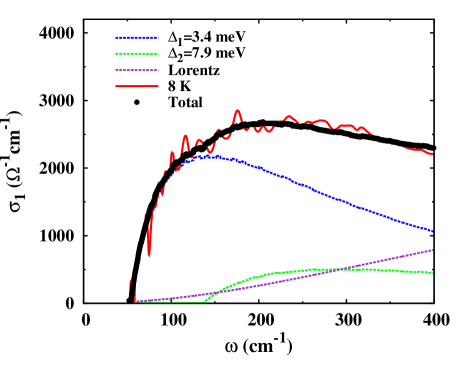
where is the square of the superconducting plasma frequency and is the cut off frequency which should be chosen such that the converges smoothly. The equation implies that the spectral weight lost in in the superconducting state has been transferred to the weight at the zero frequency delta function. With cm , we obtain =5350 cm . The superconducting condensate can also be extract from by determining in the limit. can be extracted from the complex optical conductivity, then we get =5430 cm . The results from two methods suggest the superconducting plasma frequency 5400 cm . The penetration depth is related to the superconducting plasma frequency by =c/, then we get the value of . We note that the value of , that is, less than half of the low-frequency free carrier spectral weight in the normal state has collapsed into superconducting condensate. It implies that the superconductor is actually in the dirty limit [31]. Therefore, the optical conductivity can be modeled using a Mattis-Bardeen approach[35, 36]. As shown in Fig. 5, the conductivity spectrum at the lowest temperature 8 K can be well reproduced by two isotropic energy gaps with meV, and meV, together with a Lorentzian tail. We note that the relation agrees well with the above analysis of dirty limit superconductivity. For the smaller energy gap, the ratio , which is close to the BCS weak coupling limit. But for the larger energy gap, the ratio is significantly larger than the BCS mean field value. It is worth noting that those results are similar to those observed for the electron doped Fe-pnictide compound [31, 32, 33], a prototype iron-based superconductor. The result is not surprising as the superconductivity in arises from the layers. If we take the charge transfer from layer to layer as self-doping, the doping level in FeAs layer is actually close to that for .
represents a very interesting compound exhibiting the coexistence of superconductivity and density wave instability. At present, there is no agreement on the nature of the density wave instability, that is, whether it is a spin density wave or charge density wave order. Although the first principle calculations on some of the titanium oxypnictides, e.g. Na2Ti2As2O and Na2Ti2Sb2O[16], suggest an SDW order driven by the nesting of disconnected FSs, to date no magnetic order has been detected on any compound in this titanium oxypnictide family. Instead, the available NMR measurement on some of the compounds, e.g. BaTi2Sb2O[34], actually reveals an absence of internal field at the Sb site, which therefore favors a CDW origin. If the density wave order in is indeed a CDW order, then the material would provide a promising candidate to study the collective excitations in the broken symmetry states, in particular, the amplitude mode in the superconducting state. Electronic Raman scattering is a primary tool to probe the collective amplitude mode in a superconductor, however it is limited to a compound showing the coexistence of superconductivity and CDW, for example, in NbSe2 [37, 38]. The present compound has much higher than NbSe2, it might be easier to probe such collective excitations.
IV Summary
To summarize, we have performed an optical spectroscopy study on single crystal. We observed spectral changes associated with both density wave and superconductivity phase transitions. Compared with two other density wave compounds in the titanium oxypnictide family, and , much weaker spectral change has been found across the density wave phase transition at 125 K in . This could be attributed to the presence of more Fermi surface sheets being contributed from both to layers, and only those from layers are affected by the density wave phase transition. With the development of superconductivity below 21.5 K, further spectral change associated with the superconducting condensate was observed. Our analysis indicates that about of free carrier spectral weight has collapsed into the superconducting condensate at , suggesting that the superconductivity in this compound is in the dirty limit. The low frequency optical conductivity could be well modeled within Mattis-Bardeen approach with two isotropic gaps of meV and meV. The coexistence of density wave and superconductivity makes a promising candidate to study collective excitations in broken symmetry states.
Acknowledgements.
This work is supported by the National Science Foundation of China (11120101003, 11327806), and the 973 project of the Ministry of Science and Technology of China (2011CB921701, 2012CB821403).References
- [1] Y. Kamihara, T. Watanabe, M. Hirano, and H. Hosono, J. Am. Chem. Soc 130, 3296 (2008).
- [2] T. Yajima, K. Nakano, F. Takeiri, T. Ono, Y. Hosokoshi, Y. Matsushita, J. Hester, Y. Kobayashi, and H. Kageyama, J. Phys. Soc. Jpn. 81, 103706 (2012).
- [3] H. F. Zhai, Wen-He Jiao, Yun-Lei Sun, Jin-Ke Bao, Hao Jiang, Xiao-Jun Yang, Zhang-Tu Tang, Qian Tao, Xiao-Feng Xu, Yu-Ke Li, Chao Cao, Jian-Hui Dai, Zhu-An Xu, and Guang-Han Cao, Phys. Rev. B 87, 100502(R) (2013).
- [4] A. Adam, and H. U. Schuster, Z. Anorg. Allg. Chem. 584, 150 (1990).
- [5] E. A. Axtell III, T.Ozawa, S. M. Kauzlarich, and R. R. P. Singh, J. Solid State Chem. 134, 423 (1997).
- [6] T. C. Ozawa, R. Pantoja, E.A. Axtell, S.M. Kauzlarich, J.E. Greedan, M. Bieringer, J.W. Richardson, J. Solid State Chem. 153, 275 (2000).
- [7] T. C. Ozawa , S. M. Kauzlarich , M. Bieringer, and J. E. Greedan, J. E. Chem. Mater. 13, 1804 (2001).
- [8] T. C. Ozawa, and S. M. Kauzlarich, J. Cryst. Growth 265, 571 (2004).
- [9] T. C. Ozawa, and S. M. Kauzlarich, Sci. Technol. Adv. Mater. 9, 033003 (2008).
- [10] R. H. Liu, D. Tan, Y. A. Song, Q. J. Li, Y. J. Yan, J. J. Ying, Y. L. Xie, X. F. Wang, and X. H. Chen, Phys. Rev. B 80, 144516 (2009).
- [11] X. F. Wang, Y.J. Yan , J.J. Ying , Q.J. Li, M. Zhang , N. Xu ,and X.H. Chen, J. Phys.: Condens. Matter 22, 075702 (2010).
- [12] R. H. Liu, Y. A. Song, Q. J. Li, J. J. Ying, Y. J. Yan, Y. He,and X. H. Chen, Chem. Mater. 22, 1503 (2010).
- [13] W. E. Pickett, Phys. Rev. B 58, 4335 (1998).
- [14] F. F. de Biani, P. Alemany, and E. Canadell, Inorg. Chem. 37, 5807 (1998).
- [15] D. J. Singh, New J. Phys. 14, 123003 (2012).
- [16] X. W. Yan and Z. Y. Lu, J. Phys.: Condens. Matter 25, 365501 (2013).
- [17] A. Subedi, Phys. Rev. B 87, 054506 (2013).
- [18] P. Doan, M. Gooch, Z. Tang, B. Lorenz, Angela. Möller, J. Tapp, P. C. W. Chu, and A. M. Guloy, J. Am. Chem. Soc. 134, 16520 (2012).
- [19] U. Pachmayr, and D. Johrendt, Solid State Sci. 28, 31 (2014).
- [20] F. von Rohr, R. Nesper, and A. Schilling, Phys. Rev. B 89, 094505 (2014).
- [21] K. Nakano, T. Yajima, F. Takeiri, M. A. Green, J. Hester, Y. Kobayashi, and H. Kageyama, J. Phys. Soc. Jpn. 82, 074707 (2013).
- [22] Y. L. Sun, H. Jiang, H. F. Zhai, J. K. Bao, W. H. Jiao, Q. Tao, C. Y. Shen, Y. W. Zeng, Z. A. Xu, and G. H. Cao, J. Am. Chem. Soc. 134, 12893 (2012).
- [23] Hao Jiang, Yun-Lei Sun, Jianhui Dai, Guang-Han Cao, and Chao Cao, arXiv 1207.6705.
- [24] Yun-Lei Sun, Abduweli Ablimit, Jin-Ke Bao, Hao Jiang, Jie Zhou, and Guang-Han Cao, Sci. Tech. Adv. Mater. 14, 055008 (2013).
- [25] Y. Huang, H. P. Wang, W. D. Wang, Y.G.Shi, and N. L. Wang, Phys. Rev. B 87, 100507(R) (2013).
- [26] R. A. Ferrell, and R. E. Glover, Phys. Rev. 109, 1398 (1958).
- [27] W. Z. Hu, J. Dong, G. Li, Z. Li, P. Zheng, G. F. Chen, J. L. Luo, and N. L. Wang, Phys. Rev. Lett. 101, 257005 (2008).
- [28] Y. Huang, H. P. Wang, R. Y. Chen, X. Zhang, P. Zheng, Y.G.Shi, and N. L. Wang, Phys. Rev. B 89, 155120 (2014).
- [29] M. Nakajima, S. Ishida, K. Kihou, Y. Tomioka, T. Ito, Y. Yoshida, C. H. Lee, H. Kito, A. Iyo, H. Eisaki, K. M. Kojima, and S. Uchida, Phys. Rev. B 81, 104528 (2010).
- [30] D. Wu, N. Barišić, P. Kallina, A. Faridian, B. Gorshunov, N. Drichko, L. J. Li, X. Lin, G. H. Cao, Z. A. Xu, N. L. Wang, and M. Dressel, Phys. Rev. B 81, 100512(R) (2010).
- [31] J. J. Tu, J. Li, W. Liu, A. Punnoose, Y. Gong, Y. H. Ren, L. J. Li, G. H. Cao, Z. A. Xu, and C. C. Homes, Phys. Rev. B 82, 174509 (2010).
- [32] K. W. Kim, M. Rossle, A. Dubroka, V. K. Malik, T. Wolf, and C. Bernhard, Phys. Rev. B 81, 214508 (2010).
- [33] E. van Heumen, Y. Huang, S. de Jong, A.B. Kuzmenko, M.S. Golden, and D. van der Marel, EuroPhys. Lett. 90, 37005 (2010).
- [34] S. Kitagawa, K. Ishida, K. Nakano, T. Yajima, and H. Kageyama, Phys. Rev. B 87, 060510 (2013).
- [35] D. C. Mattis and J. Bardeen, Phys. Rev. 111, 412 (1958).
- [36] W. Zimmermann, E. H. Brandt, M. Bauer, E. Seider, and L.Genzel, Phys. C 183, 99 (1991).
- [37] R. Sooryakumar and M. V. Klein, Phys. Rev. Lett. 45, 660 (1980); Phys. Rev. B 23, 3213 (1981).
- [38] M.-A. M easson, Y. Gallais, M. Cazayous, B. Clair, P. Rodi‘ere, L. Cario, and A. Sacuto, Phys. Rev. B 89, 060503 (2014).