11email: gbeccari@eso.org 22institutetext: ESA, Space Science Department, Keplerlaan 1, 2200 AG Noordwijk, The Netherlands 33institutetext: Space Telescope Science Institute, Baltimore, MD 21218, USA 44institutetext: INAF-NA, Osservatorio Astronomico di Capodimonte, Salita Moiariello 16, I-80131 Napoli, Italy 55institutetext: Supernova Ltd, OYV #131, Northsound Rd., Virgin Gorda VG1150, Virgin Islands, UK 66institutetext: European Southern Observatory, Karl–Schwarzschild-Strasse 2, 85748 Garching bei München, Germany 77institutetext: Instituto de Astrof sica, Pontificia Universidad Cat lica de Chile, Av. Vicu a Mackenna 4860, 782-0436, Macul, Santiago, Chile 88institutetext: Millennium Institute of Astrophysics, Av. Vicu a Mackenna 4860, 782-0436, Macul, Santiago, Chile 99institutetext: Instituto de Astrofsica de Canarias, Calle Va Lactea s/n, E-38205 La Laguna, Tenerife, Spain 1010institutetext: Dept. Astrofisica, Universidad de La Laguna (ULL), E-38206 La Laguna, Tenerife, Spain
Mass accretion rates from multi-band photometry in the Carina Nebula: the case of Trumpler 14111Based on observations made with ESO Telescopes at the La Silla Paranal Observatory under programme ID 069.C-0426(C) and 078.D-0371(A).
Abstract
Context. We present a study of the mass accretion rates of pre-Main Sequence (PMS) stars in the cluster Trumpler 14 (Tr 14) in the Carina Nebula. Using optical multi-band photometry we were able to identify 356 PMS stars showing H excess emission with equivalent width Å. We interpret this observational feature as indication that these objects are still actively accreting gas from their circumstellar medium. From a comparison of the HR diagram with PMS evolutionary models we derive ages and masses of the PMS stars. We find that most of the PMS objects are younger than 10 Myr with a median age of Myr. Surprisingly, we also find that of the mass accreting objects are older than 10 Myr. For each PMS star in Trumpler 14 we determine the mass accretion rate () and discuss its dependence on mass and age. We finally combine the optical photometry with near-IR observations to build the spectral energy distribution (SED) for each PMS star in Tr 14. The analysis of the SEDs suggests the presence of transitional discs in which a large amount of gas is still present and sustains accretion onto the PMS object at ages older than 10 Myr. Our results, discussed in light of recent recent discoveries with Herschel of transitional discs containing a massive gas component around the relatively old PSM stars TW Hydrae, 49 Ceti, and HD 95086, support a new scenario in which old and evolved debris discs still host a significant amount of gas.
Aims.
Methods.
Results.
Key Words.:
Accretion, accretion discs – Stars: pre main sequence1 Introduction
Mass accretion is a phenomenon driving the evolution of several astrophysical objects. It is well known that low mass stars in the pre-main sequence (PMS) stage grow up in mass through mass accretion from a circum-stellar disc (e.g. Lynden-Bell & Pringle, 1974; Appenzeller & Mundt, 1989; Bertout, 1989). Moreover, the process of accretion is the power source driving the luminosities for a wide range of binary systems containing accreting white dwarfs and neutron stars like cataclysmic variables and millisecond pulsars, black holes (BH), gamma-ray bursts and supermassive BHs in active galactic nuclei (see Fender et al., 2009). In an accreting star this process leaves characteristic signatures in its spectrum mostly due to recombinations. Thus, one expects an excess in the ultra-violet (UV) continuum, compared to stars of equal spectral type, (e.g. Gullbring et al., 1998; Rigliaco et al., 2011), as well as a strong emission in recombination lines (e.g. H, Pa and Br) from the gas ionized in the shock.
De Marchi et al. (2010, hereafter DM10) have presented a method to reliably identify PMS objects actively undergoing mass accretion in star forming regions using photometry. Briefly, the method combines V and I broad-band photometry with narrow-band H imaging to identify all stars with excess H emission and to measure their associated H emission equivalent width , the H luminosity and the mass accretion rate, regardless of their age. The ability of this method to measure accurate EW(H) has been discussed thoroughly and justified by DM10 and verified observationally for stars towards IC1396 by Barentsen et al. (2011). In their Figure 5 these authors show an excellent correlation between the photometric and spectroscopic measures of EW(H) for emission stronger than 10. The DM10 method was recently applied to study PMS objects in a number of star-burst clusters, namely NGC 3603 in the Galaxy (Beccari et al., 2010), NGC 346 and NGC 602 in the Small Magellanic Clouds (see De Marchi et al., 2011a, 2013a), 30 Doradus and three active star forming regions in the Large Magellanic Clouds (see De Marchi et al., 2011b; Spezzi et al., 2012).
In this paper we apply the same method to study the PMS stars in the young star-burst cluster Trumpler 14 (Tr 14) in the Carina Nebula. Tr 14 is a young cluster, about Myr old, (Hur et al., 2012, hereafter H12), whose properties have been thoroughly addressed in the literature. The presence of variable extinction across the cluster, as well as hints of a substantial PMS population were initially reported by Vazquez et al. (1996), and later confirmed by Tapia et al. (2003) Sana et al. (2010); H12. Tr 14 is relatively close to the Sun, at a distance of kpc (Carraro et al., 2004), and therefore is an ideal candidate to study in detail the early stages of stellar evolution and mass accretion.
2 Observations and data reduction
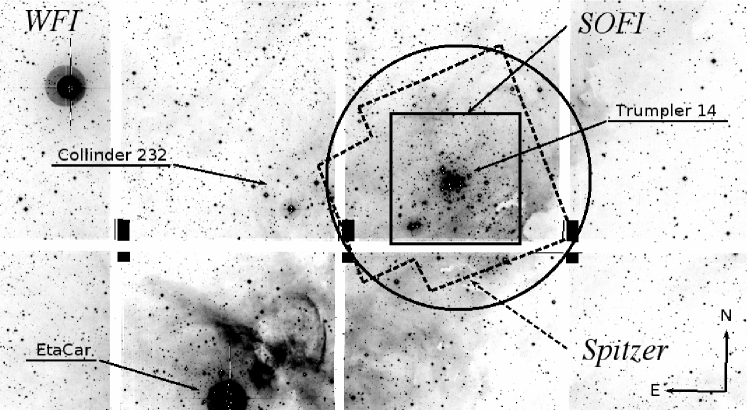
In this work we have used panchromatic archival observations from three different facilities, namely i) the Wide Field Imager (WFI) at the MPG/ESO m telescope at La Silla (Chile); ii) the near-infrared (near-IR) SOFI camera at the ESO New Technology Telescope (NTT); and iii) the Infrared Array Camera (IRAC) on the Spitzer Space Telescope. The details of the observations and of their analysis are provided in Sections 2.1, 2.2 and 2.3. We derived in this way three photometric catalogues, all calibrated and homogeneously registered to the same absolute astrometric system. In Figure 1 we show a schematic view of the combined data-set centered on Tr 14. The study of the PMS objects presented in this paper refers to an area of radius around the cluster’s centre , which includes the WFI, SOFI and Spitzer datasets.
Most of the results and of the discussion in this work concern the physical properties of PMS in stars in Tr 14 as derived from the WFI catalogue at visible wavelengths, but we will also make use of the SOFI and Spitzer near-IR catalogues in Section 7, where we discuss the complete spectral energy distribution (SED) of these objects. In a forthcoming paper (Beccari et al. 2014, in preparation), we will present a complete study of all PMS stars over the entire field covered by the observations, including also those in Trumpler 16 and Collinder 232.
2.1 WFI observations
We retrieved from the ESO archives a set of multi-band observations made with the WFI on 2003, June 27 (proposal 069.C-0426(C); principal investigator J. Alves). The WFI consists of a mosaic of eight CCD chips with a global field of view (FoV) of and with a pixel size of . The Carina Nebula was observed in the , , , , and bands and through the narrow band filter under good seeing conditions (). The details of the observations are listed in Table 1. The observations were made in such a way to place the luminous blue variable Car inside chip #56 of the camera array and to include the star clusters Tr 14, Trumpler 16 and Collinder 232 inside the field of view.
We corrected the raw WFI images for bias and flat field, and the overscan region was trimmed using standard IRAF222IRAF is distributed by the National Optical Astronomy Observatories, which is operated by the Association of Universities for Research in Astronomy, Inc., under contract to the National Science Foundation tools. The photometry was carried out using the standard point spread function (PSF) fitting independently on each image using the DAOPHOTII/ALLSTAR routines (Stetson, 1987). A master list was created using the stars detected in at least six of the , and -band images. This strategy allowed us to remove from the final catalogue spurious detections such as cosmic ray hits or star-like peaks on haloes and spikes around saturated stars. The master list was used as input for ALLFRAME (Stetson, 1994). The average of the single frame’s magnitudes for each object in the master list was adopted as stellar magnitude in the final catalogue, while we used the standard deviation as associated photometric uncertainty. We looked for variable stars in the final photometric catalogue but, within the photometric uncertainties, no systematic variability was observed between these relatively short exposures.
| Filter | CW | FWHM | N exp. | exp. time |
|---|---|---|---|---|
| [nm] | [nm] | [s] | ||
| U50_ESO877 (U) | 340.4 | 73.2 | 4 | 200 |
| B123_ESO878 (B) | 451.1 | 133.5 | 4 | 200 |
| V89_ESO843 (V) | 539.6 | 89.4 | 4 | 200 |
| RC162_ESO844 (R) | 651.7 | 162.2 | 4 | 200 |
| I203_ESO879 (I) | 826.9 | 203.0 | 4 | 120 |
| H7_ESO856 (H) | 658.8 | 7.4 | 4 | 1200 |
The instrumental positions, in pixels, were transformed into J2000 celestial coordinates by means of an astrometric solution (in the form of a second degree polynomial) obtained with CataXcorr333The software is available for download at http://davide2.bo.astro.it/ paolo/Main/CataPack.html from more than 30 000 stars in common between our final WFI catalog and the 2MASS catalogue of the same region. The r.m.s. scatter of the solution is less than in both right ascension (RA) and declination (DEC).
The calibration of the instrumental magnitudes was done following the procedure described in Da Rio et al. (2009, hereafter D09). As shown in that work, the transformations between the WFI instrumental photometric system and the standard Johnson–Cousins system are non-linear, especially when a large color (i.e. temperature) range is considered. We thus decided to not apply any color correction to our instrumental magnitudes and to keep them in the WFI photometric system, as defined by the throughput of the adopted WFI filters. Given the instrumental magnitude in a given band , corrected for the air mass of the science observations, the absolute photometric calibration in the WFI-VegaMag photometric system will be derived as , where is the photometric zero point. In practice, is the value one would obtain for a Vega-like star, when all the colors are equal to zero (see D09 for details).
We derived the value of for each band by using a set of photometric standards acquired during the night of the observations. Since the values that we calculated are identical, within the uncertainties, to those derived in 2003 March by the WFI support team on a photometric night and published by the observatory 444http://www.eso.org/sci/facilities/lasilla/instruments/wfi/inst/zeropoints/, we used the latter to calibrate our data. Since the value is not available in that list for the H band, we derived it directly with the procedure indicated above, obtaining .
2.2 SOFI observations
We used a set of near-IR observations made with the SOFI camera in ”large field” mode on the night of 2 May 2008 (proposal 078.D-0371(A); principal investigator C. Weidner). In this mode the camera has a pixel scale of , allowing us to sample a region of around the centre of the cluster (see Figure 1). Exposures through the and filters were obtained with slightly different detector setups, namely DIT4 s and NDIT10 for the band and DIT4 s and NDIT20 in . The same exposure was repeated 20 times in and 40 times in with a random dithering pattern for background correction purpose. During the observations the average seeing was .
Images were pre-reduced using standard IRAF routines. A sky image, obtained by median combination of the dithered frames of each filter, was subtracted from each frame. Flat fielding was then done using the SpecialDomeFlat template, which applies the appropriate illumination corrections, as described in the SOFI User Manual (Lidman & Cuby, 2000). Finally, for each filter all the dithered frames obtained in a sequence were aligned in coordinates and then averaged in a single image. Standard crowded field photometry, including PSF modeling, was then carried out on each of the averaged frames using DAOPHOTII/ALLSTAR.
We used hundreds of stars in common with the 2MASS catalogue in order to obtain an absolute astrometric solution for the stars in the SOFI catalogue. The same stars where also used as secondary photometric standards in order to calibrate the SOFI and magnitudes with the 2MASS photometry.
2.3 Spitzer observations
Finally, we retrieved from the Spitzer Enhanced Imaging Products archive555http://irsa.ipac.caltech.edu/data/SPITZER/Enhanced/Imaging/index.html two near-IR images (at m and m) centered on Tr 14, obtained with the IRAC camera (proposal 30734; principal investigator D. Figer). The two mosaic images are the combination of a number of sub-images and have a pixel scale of . Standard PSF photometry was performed by modeling the PSF on each image, producing a catalogue listing the relative positions and magnitudes of stars in common between the two bands.
The calibration of the Spitzer observation was done following the the IRAC instrument handbook666http://irsa.ipac.caltech.edu/data/SPITZER/docs/i (see also Hora et al., 2008). We performed aperture photometry with the IRAF/DAOPHOT task on more than 40 well sampled and isolated stars in each frame using an aperture of 4 pixel while the background was locally sampled in a annulus between 4 and 12 pixel, following the IRAC instrument handbook. We used these stars as secondary photometric standards to calibrate the final photometric catalogue. Moreover, several hundreds stars in common with the SOFI catalogue were used to extend the astrometric solution to the Spitzer catalogue.
3 Differential reddening
Since the stars in our sample are still embedded in the molecular cloud, a large amount of differential reddening is expected to affect the photometry. Recently H12 carried out a detailed study of the differential reddening in the same region, finding that inside the cluster the extinction law is characterized by . They also determined the foreground reddening to be for the stars in the Carinae nebula, based on the properties of 141 early-type stars with high membership probability from proper motion studies. They derived a distance modulus of , corresponding to a distance of kpc for Tr 14 and Tr 16 and concluded that the two clusters are at the same distance. Finally, they derived a reddening map (see their figure 6) using the early-type stars in the region, and used it to correct the magnitudes of the entire population, including those of PMS stars.
Taking advantage of the large number of filters available in our photometry, we decided to independently derive a reddening map using the method described in Mihalas & Binney (1981) and Romaniello et al. (2002, hereafter R02). We adopted the reddening free color defined as follow:
The reddening-free color computed for the observed stars (grey points) and for the atmospheric model of Bessell et al. (1998, ; solid line) is shown in Figure 2 as a function of . The theoretical model shown in the figure is already reddened by the foreground extinction as found by H12.
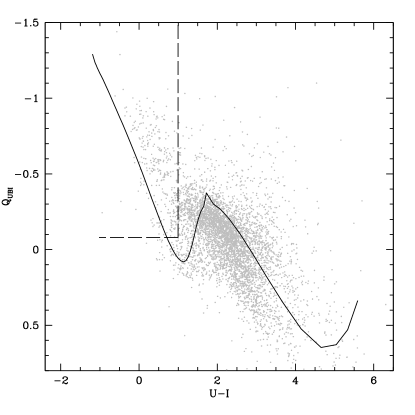
The effect of extinction is to move the stars horizontally from the zero-reddening locus, i.e. the location of the model in the colour–colour diagram. We can simply derive information on the interstellar reddening by comparing the colors of the observed stars with those of the models, in the assumption that the displacement of the stars from the W-shaped model is only induced by the differential extinction.
As shown in Figure 2, only the stars with and do show an unique solution. Moreover, it’s important to stress that the stars with and cannot be safely used to study the reddening map because this region of the diagram is mostly populated by PMS stars, whose colors are clearly affected by U-band excess. These limits define a “selection box” shown with the dashed lines in the figure. In order to build a reddening map for the entire region covered by our WFI observations we first derived the value of visual extinction for the stars in the selection box. While, as previously explained, can be derived by projecting horizontally the stars to the model in the vs plane of Figure 2, we need to assume an extinction law in order to derive . Following the recent results from H12 we estimated the total of the selected stars as , where the only parameter missing is that we estimate using the parameter.

In Figure 3 we show the histograms of the values of the total extinction (lower panel) and selective extinction (upper panel) as calculated using more than 1000 stars located within the selection box of Figure 2. The median of the distribution is with a minimum value of 0.075 and a maximum value of 1.425 in agreement with the findings of H12 and of Carraro et al. (2004). In order to produce an extinction map, the entire FoV was divided into a grid of cells, for a total of 64 cells. The extinction in each of them was obtained as the average value of the extinction of the individual blue stars in that cell and this value was assumed as representative for all stars falling inside that cell. The typical standard deviation of the mean of of the individual blue stars in the cells in the area of 5′around the center of trumpler 14 (the region studied in detail in this paper) is , which translates into an uncertainty of on since . We used this map to correct for extinction all the available magnitudes, from the optical through to the IR, following the extinction law of H12. As we will show later and as already pointed out by H12, the stars in the foreground will appear too blue when corrected with this map and will need to be treated separately.
4 The color–magnitude diagram
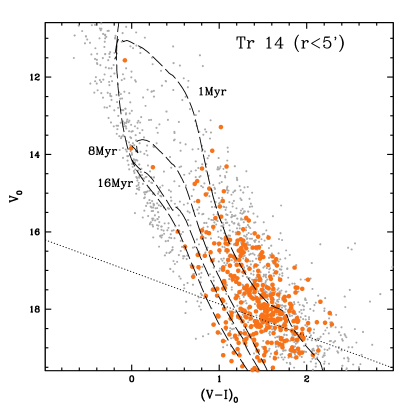
The optical CMD of the inner 5′of Tr 14 is shown in Figure 4. Stars highlighted with a thick dot (orange in the electronic version) are bona fide-PMS. The selection criteria and physical parameters for these class of object will be discussed in detail in this section and in Section 5, respectively.
All magnitudes are corrected for extinction on the basis of our extinction map. Typical photometric uncertainties (on magnitudes and colors) are shown by the crosses, for various magnitudes. In the figure we also show the position of the zero age main sequence (ZAMS), taken from the models of Marigo et al. (2008) for solar metallicity (solid line). We have adopted as distance modulus the value given by H12, namely . The position of the ZAMS obtained in this way helps us to identify a population of candidate MS stars that extend from the saturation limit at down to .
In order to measure the completeness of our photometry, we made extensive use of artificial stars experiments, following the recipe described in Bellazzini et al. (2002). More than 300 000 artificial stars were uniformly distributed on the WFI chips in groups of 4 000 stars at a time in order to avoid changing the crowding conditions. We produced a catalogue of simulated stars with a magnitude, and colors randomly extracted from a luminosity function and colour distributions modeled to reproduce the observed one.
The whole data reduction process was repeated as for the actual observations, and the fraction of recovered stars was estimated at each magnitude level. The limit of 50% of photometric completeness within of the centre of Tr 14 is shown by the dotted line in Figure 4. From a comparison with the theoretical model we estimate that we sample the PMS stats down to 0.7 M⊙ and 1 M⊙ with a 50% photometric completeness, with the lower masses sampled at the younger ages.
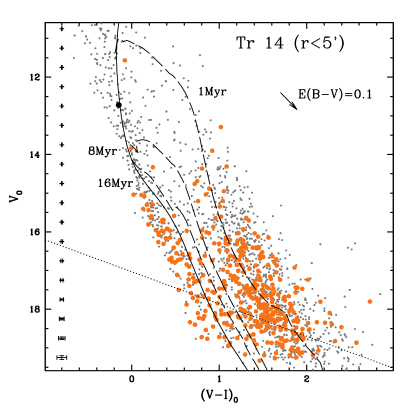
A discontinuity in the stellar color distribution in this CMD separates a population of objects along the ZAMS from one clearly grouped at redder colors and consistent with the young population of PMS stars already detected in Tr 14 (H12; Ascenso et al. 2007). This confirms that Tr 14 is an active star-forming region. In order to learn more about the properties of this recent star formation episode, we followed the method developed by DM10 to identify bona-fide PMS stars. A population of candidate PMS stars is well visible at , well separated from the population of MS stars. These PMS stars have been recently studied by H12, who selected them based on their position in the optical CMD. In this work, we apply the method developed by DM10, to look for the signature of the active mass accretion process that is expected to characterize the PMS phase and that is responsible for the strong H excess emission normally observed in objects of this type (e.g. Calvet et al., 2000).
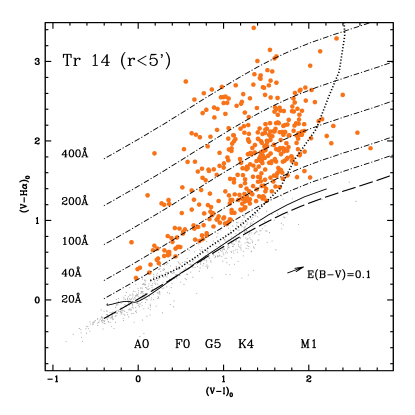
In Figure 5 we show the distribution of the stars in the vs. color–color diagram, corrected for extinction. We use the median de-reddened color of stars with small ( mag) combined photometric uncertainty in the , and bands (grey dots in Figure 5), as a function of , to define the reference template with respect to which the excess H emission is identified (dashed line).
We selected a first sample of stars with excess H emission by considering all those with a at least 4 times larger than the photometric uncertainty on the color. Then we calculated the equivalent width of the H emission line, , from the measured color excess using Equation 4 of D10. We finally considered as bona-fide PMS stars those objects with EW(H) (see D10 and references therein). This allows us to safely remove from our sample possible contaminants, such as older stars with chromospheric activity and Ae/Be stars (see White & Basri, 2003; Beccari et al., 2014).
We visually inspected the position of all the candidate H emitters on the , and images and excluded from the final list all those stars falling on a filamentary structure of the cloud in which the cluster is embedded. Even if these stars could in principle be genuine H excess sources (and hence considered PMS stars), the fact that the scale of the background spatial variation is equal or smaller than the full width at half maximum of the PSF makes the background determination too prone to errors. As a consequence, the magnitudes of these stars is too uncertain and we do not consider them as bona-fide PMS objects. After this conservative selection, we count a total of 389 PMS stars in our sample, with a median Å. Hereafter we will refer to these objects as bona-fide PMS stars.
The positions of these stars in the optical CMD is shown in Figure 4 together with a ZAMS from Marigo et al. (2008, solid line) and three PMS isochrone for ages of 1, 8 and 16 Myr from Degl’Innocenti et al. (2008, dashed lines) for solar metallicity.

4.1 The reddening correction of the old PMS stellar population
Using the same approach as described by De Marchi et al. (2011b), we perform a preliminary study of the radial distribution of the candidate PMS stars at different ages. In particular, using the 8 Myr isochrone as references, we divided the population of bona-fide PMS in an older ( Myr) and younger ( Myr) subgroups. In Figure 6 we show the radial density distribution of the two subgroups of PMS objects, with respect to the centre of Tr 14. The solid and dashed lines correspond, respectively, to the older and younger populations, while the distribution of upper MS stars used in Section 3 to derive the reddening map of the region is shown by the dot-dashed line. The figure clearly shows that objects with H excess older than Myr have a different radial distribution from that of the cluster’s stars used to calculate the reddening map.
The implication of the differences in the radial distribution of the PMS populations will be discussed in more details in Section 5. For the moment, Figure 6 implies that we can safely use the reddening map to correct the magnitudes of the younger bona-fide PMS objects for differential reddening, by assuming that the placement of these PMS objects with respect to the cluster’s absorbing material is similar to that of the reference stars in its vicinities. This assumption is clearly not valid for the older H excess emitters. We also note that the older PMS stars are not in regions of particularly high reddening, confirming that they should have lower extinction than younger PMS stars. At the same time, as explained in Section 3, the typical uncertainty on is It is then clear that the reddening uncertainty has a marginal effect on the distribution of the stars in the diagrams.
In order to obtain a more realistic estimate of the reddening of the older population of PMS, we can use the stars with H excess that appear bluer than the ZAMS (e.g. Figure 4). By definition the ZAMS represents the theoretical location of the stars at the beginning of the hydrogen burning phase in the core, i.e. the MS stage, or conversely, the end of the PMS phase. Observationally, the ZAMS represents the bluest side of the colour distribution of the PMS population in a CMD. We then decided to correct the magnitudes of the older population of PMS stars using a constant value of =1.7, which ensures that the ZAMS constraints the blue envelope to at least 80% of the old PMS objects at in Figure 4, i.e. to the stars in this subgroup with the smallest uncertainty on magnitude and colour. For the faintest stars, the increase of the photometric uncertainties can easily be at the origin of some residual colour scatter around the ZAMS. While the choice of 80% is a somewhat arbitrary, it is important to stress here that changing this value to 50% or 100% would not change any of the results of the paper.
Finally, we revised the selection of the H emitters (bona-fide PMS stars), In fact, even if the reddening vector runs almost parallel to the median photospheric colors of normal stars in the vs colour–colour diagram (see De Marchi et al., 2011b), we calculated the new values of after the application of the new reddening correction to the , and magnitudes of the old PMS objects. We find that 33 stars now show and, following our stringent selection criteria already reported earlier in this section, these stars can not be classified as H excess emitters and will no further be considered in this work. The population of bona-fide PMS stars in Tr 14 finally includes 356 objects.
5 Physical parameters of the PMS stars
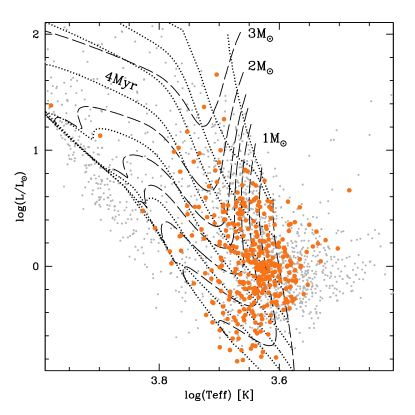
The luminosities () and effective temperatures () of all stars within of the cluster centre are shown in the H–R diagram (Figure 8). PMS stars are shown as thick dots (orange in the electronic version), whereas all other objects are in grey.
Effective temperatures were determined by fitting the de-reddened colors of the stars with the ones computed for the same WFI bands using stellar atmosphere models. We adopted the model atmospheres of Bessell et al. (1998), which provide an excellent fit to our data (solid line in Figure 5). The de-reddened magnitudes were then compared with the absolute magnitudes of the models in order to derive the stellar radius. The bolometric luminosity was finally derived, adopting the distance modulus from H12 and by comparing the stellar radius and with those of the Sun (see Romaniello et al., 2002, for further details).
We also show in Figure 8 the evolutionary tracks for masses of , , 1, , , , 2, and 3 M⊙ (dashed lines) and isochrones for ages of , , 1, 2, 4, 8, 16, and 32 Myr (dotted lines), from the PMS evolutionary models of the Pisa group (Degl’Innocenti et al., 2008; Tognelli et al., 2012). The models were calculated for Z = 0.014, Y = 0.2533 and a mixing-length parameter , applicable to Tr 14. In Figure 8 we explicitly label the tracks for 1, 2 and 3 M⊙ and the location of the 4 Myr isochrone, for reference.
In order to study in more deal the physical properties of the 356 PMS in Tr14, we used a finer grid of models than the one shown in Figure 8 to derive a reliable measure of the mass and age (see Romaniello et al., 1998, for details on the method used, with an approach similar to the one more recently presented by Da Rio et al. 2012). Mass and age distributions for the PMS objects are shown in the upper and lower panels of Figure 9, respectively.
The mass distribution peaks around 1 M⊙. As expected the number of stars with masses above M⊙ decreases, being the timescales of PMS evolution faster for more massive objects. On the other hand, the decrease of the number of stars for masses below 1 M⊙ is due to the drop of the photometric completeness see the dotted line in Figure 7).
Concerning the ages, the median of the distribution is Myr, with an upper quartile of Myr and a lower quartile of Myr. As already noticed by Ascenso et al. (2007), it appears that star formation has been ongoing in Tr 14 for at least 5–6 Myr. The available observations do not allow us to conclude whether the star formation in the last 6 Myr was continuous or whether this young population of PMS objects is indeed the outcome of a few major bursts, as postulated by Ascenso et al. (2007).
On the other hand, it is clear that multiple bursts have occurred in this region. The distribution of PMS ages confirms that of the objects have ages older than 8 Myr, with a median age of Myr. This implies that in this region star formation started more than 8 Myr ago, at least as far back as Myr ago, followed by a major episode in the last 2–6 Myr. A similar behavior has already been observed in Galactic star forming regions (NGC 3603, Beccari et al. 2010; NGC 6823, Riaz et al. 2012; NGC 6611, De Marchi et al. 2013b) and in the Magellanic Clouds (Panagia et al., 2000; De Marchi et al., 2010, 2011a, 2011b; Spezzi et al., 2012; De Marchi et al., 2013a).
Our age resolution does not allow us to say whether there were multiple episodes in Tr14 before the most recent one, nor whether they were as prominent as the one responsible for the 2–4 Myr old population. However, if the fraction of PMS stars with H excess has an exponential decay with time (Fedele et al. 2010), episodes occurring more than 10 Myr ago might have contributed a large portion of the stars in this region.

It is important to recall that there are a number of uncertainties when searching for age spreads in starburst clusters (see e.g. the reviews by Preibisch, 2012, and Soderblom et al., 2013). From a theoretical point of view, while the absolute ages of PMS stars are only as good as the isochrones allow, relative ages are always better defined than a factor of two for ages up to Myr, as already shown by Romaniello et al. (2002) and Da Rio et al. (2010). From an observational point of view, the colors and magnitudes of the stars are affected by uncertainties induced by inaccurate evaluation of differential extinction, stellar variability (Herbst et al., 2002) and complex physical processes like episodic accretion (Baraffe et al., 2009). We stress once again here that the typical uncertainty on in the studied region is of the order of 0.08 mag, i.e. on . Hence, while an inaccurate estimate of would have an impact on the age determination of individual stars, we can exclude that it would have a significant impact in the age spread detected in the region. Unresolved binaries can also affect the apparent distribution of stars in the CMD and lead to an incorrect estimation of the age of such photometrically unresolved system. We stress anyway that the contamination for stars appearing older than 10 Myr should not be more than about 5% (for 100% unresolved binaries; Weidner et al., 2009). However, none of these effects can explain the different radial distributions of younger and older PMS stars as shown in a number of star-burst clusters (e.g. Beccari et al., 2010; De Marchi et al., 2011a, b, 2013a, 2013b).

Figure 6 already showed that this is also the case for Tr 14. To characterize this result in an even more solid statistical sense, in Figure 10 we compare the radial distribution of the older PMS stars ( Myr, solid line) with that of the PMS stars younger than 4 Myr (dashed line), with respect to the cluster centre. The latter age was selected to ensure that most of these stars have the same age as the massive objects that define the cluster, i.e. the O and B stars.
The figure clearly shows that the younger PMS stars are more centrally concentrated than the older generation, in agreement with the results found e.g. in NGC 3603 and NGC 6611 in the Galaxy (Beccari et al., 2010; De Marchi et al., 2013b) and in 30 Doradus, NGC 346 and NGC 602 in the Magellanic Clouds (see De Marchi et al., 2011a, b, 2013a, respectively). We used a Kolmogorov–Smirnov (K–S) test to check the statistical significance of the differences in the observed distributions. The test yields a confidence level exceeding that the two groups of stars have a different radial distributions, supporting the hypothesis that the two classes of PMS objects belong indeed to different generations of stars.
6 Mass accretion rates
The parameter defined in section 4 allows us to easily derive the emission line luminosity for our bona-fide PMS stars. As explained in DM10, is obtained from , from the photometric zero point and absolute sensitivity of the instrumental set-up and from the distance to the sources. We have assumed the and a distance modulus =12.3, as mentioned before. The median in our sample is L with the 17 and 83 percentile levels in the distribution at L and L, respectively.
Following DM10, we derived the accretion luminosity from the measured value of L(H). In that work it is shown that the ratio can be assumed to be constant and, from an elementary fit to the data in the compilation of Dahm (2008) of PMS stars in the Taurus–Auriga association, it is found that . The median value of that we find for the PMS stars in Tr 14 is .
The mass accretion rate is in turn related to via the free-fall equation, linking the luminosity released by the impact of the accretion flow with the rate of mass accretion, according to the relationship:
| (1) |
where is the gravitational constant, and the stellar mass and photospheric radius derived in Section 5, while is the inner radius of the accretion disc. The latter is rather uncertain and depends on the exact coupling between the accretion disc and the magnetic field of the star. Following Gullbring et al. (1998) we assume for all PMS objects.
The values of derived in this way for the PMS stars in Tr 14 are shown as black triangles in Figure 11, as a function of the stellar age. The solid line shows the temporal decline of for the evolution of viscous discs, as predicted by Hartmann et al. (1998) for stars of mass M⊙. It is clear that the distribution of for the PMS objects in our sample is much higher compared to the theoretical predictions. Da Rio et al. (2014) have shown that correlated uncertainties between and the estimated parameters of young stars (such as luminosity, effective temperature, mass, age) can introduce biases on the apparent decay of as a function of age. More generally, diagrams like those shown in Figure 11 can be used to study the temporal evolution of only if all stars, also the older ones, were formed under similar conditions. To avoid these possible sources of uncertainty, we concentrate on stars of similar age, Myr, which are numerous in Tr 14, as well as in the other cluster to which we will compare it later (Tr 37). The mean value of at an age of Myr is , while the theoretical model predicts a value of .
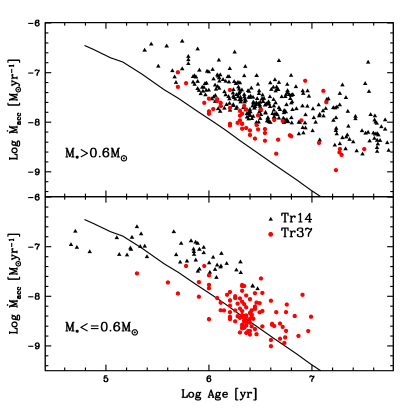
In order to better understand the origin of this apparent discrepancy we used the photometric catalogue of T-Taury stars belonging to the H II region IC 1396 in Cepheus OB2, including Trumpler 37 (Tr 37), published by Barentsen et al. (2011, hereafter B11). In that paper the authors use observations acquired with the Wide Field Camera at the Isaac Newton Telescope (INT) in the and bands, as part of the INT Photometric H-Alpha Survey (IPHAS; Drew et al. 2005). B11 used an observational strategy very similar to the one used in this paper to identify PMS stars from their H excess emission and to study their physical parameters and . We retrieved their catalogue of and magnitudes, which also contains the masses and radii derived for these objects. We followed an approach described above to determine EW, , and for the stars in the B11 catalogue. The values of found in this way are shown as red dots in Figure 11. The values are in full agreement with those found by B11 (see their Figure 16), confirming the validity of our approach.
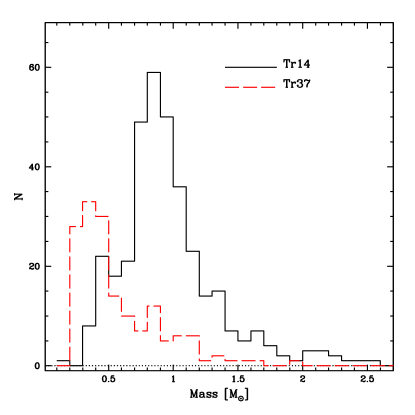
From the results shown in Figure 11 it is clear that the of the stars in Tr 14 are on average higher than those measured in Tr 37, which are more in agreement with the prediction form the viscous model. In fact, this is only effectively the case for the lower mass stars, shown in the lower panel of Figure 11, while the objects more massive than M⊙ even in Tr 37 have values systematically above those predicted by the models of Hartmann et al. (1998). To better characterise the differences between the stars that we have sampled in the two regions, we compare their mass distributions in Figure 12.
As already shown in Figure 9, the mass distribution for the PMS stars in our Tr 14 sample peaks at M⊙ and drops at lower masses because of photometric incompleteness (see also solid line in Figure 12). On the other hand, the catalogue of B11 samples a significantly different range of masses in Tr 37. The histogram (dashed line in Figure 12) clearly indicates that the majority of PMS objects in this star forming region have masses from M⊙ to M⊙, with a peak at M⊙. Since the mass accretion rate scales approximately linearly with the mass of the objects (e.g. De Marchi et al., 2011a; Barentsen et al., 2011; Spezzi et al., 2012; De Marchi et al., 2013a), the large difference in the sampled masses in the two datasets is a plausible explanation for the difference in the observed distribution of .
7 Spectral energy distributions
By combining the WFI optical photometry with the SOFI and Spitzer/IRAC datasets described in Section 2, we are able to derive the spectral energy distributions (SEDs) of the stars in the central around the cluster centre (see Figure 1). The flux at each wavelength has been corrected for extinction, according to the reddening values derived in Section 3 for the individual objects.
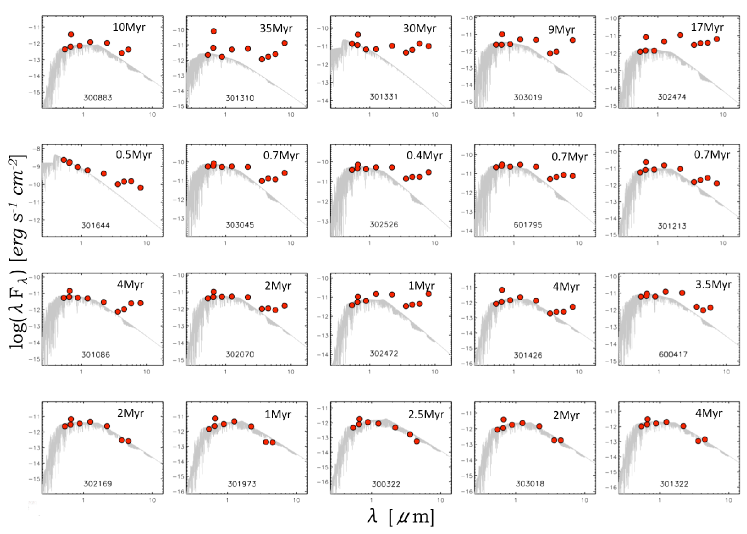
Of the 389 bona-fide PMS stars, 57 fall outside the area covered by the other photometric catalogues, while 227 PMS have at least a SOFI and/or Spitzer counterpart. We find these numbers quite reasonable, given that both the SOFI and Spitzer observations are considerably shallower than the WFI images and do not allow one to detect the lowest mass PMS stars observed in the optical bands. Moreover, the lower angular resolution of the near-IR observations further reduces the detection limits of the Spitzer and SOFI data. Nevertheless, the available data allow us for the first time to collect a sample of 227 SEDs of bona-fide PMS stars in Tr 14, some of which are shown in Figure 13. We note that the error bars in the figure are smaller than the symbol size due to the low flux uncertainties, and therefore are not shown.
Over-plotted on the observed SED of each star (thick dots), we show a synthetic spectrum (grey line) from the NextGen stellar atmosphere models (Allard et al., 2012) for the specific stellar parameters that we have derived in Section 5. We stress here that the models are not fitted to the observed SEDs but are directly calculated for the measured stellar parameters from our photometry.
The five SEDs in the top row of Figure 13 are for older PMS objects, while those shown in the second and third row are for PMS stars with ages younger than 5 Myr. Finally, the bottom row shows the SEDs for five bona-fide PMS stars that have excess H emission but no IR excess at the wavelengths covered by these observations. A visual inspection reveals that there is an excellent agreement between the atmospheric models and the observed SEDs.
It has been convincingly shown that the SEDs can be efficiently used to detect discs around PMS objects and to study their nature and evolution (see e.g. Espaillat et al., 2010; Fang et al., 2013; Merín et al., 2010, and references therein). Moreover, the slope of the SED in the wavelength region covered by the near-IR excess, i.e. the spectral index , can be used to characterize different object classes (Lada et al., 2006, ; see also Alcalá et al. 2008 and references therein). However, we stress that in the present work we are mainly interested to use the SEDs in order to identify stars with near-IR excess. Among the 227 PMS with an IR detection (either SOFI, Spitzer, or both), 82 (i.e. ) show near-IR excess at the sampled wavelengths. Only of them have ages older than 10 Myr, in relatively good agreement with the predictions made so far on the lifetime of accreting protoplanetary discs and based mainly on spectroscopic studies of nearby star-forming regions (e.g. Fedele et al., 2010). Finally, it’s interestingly to note that and47% of the young and old PMS objects respectively, show IR excess i.e., show a disk at the sampled IR wavelength.
At first sight, the number of H excess emitters detected in our optical images that also show an excess in the SOFI and Spitzer images might seem low. It is important to recall, however, that the observed SEDs in the near-IR depend on the opacity of the disc, which is governed by the dust. In particular, dust opacity is affected by the composition of the dust and by grain growth and settling. For example Espaillat et al. (2012) showed that, for the same dust-to-gas mass ratio, discs with small grain size are more flared than discs with large ones. However, the detection limit of the SOFI and Spitzer images and the lack of observations at wavelengths longer than 10 m do not allow us to investigate in detail the nature and the physical state of the discs in most of the bona-fide PMS stars detected in this work.
It is possible that most of the older PMS stars in our sample should be classified as transitional phase characterized by dust removal in the inner regions resulting in a deficit of infrared flux. This deficit has become the defining characteristic of transitional disks (TDs Merín et al., 2010). Our results would imply a scenario in which a transitional disc still hosts a significant amount of gas accreting onto the star, even at ages older than 10 Myr. Similar results were already obtained by Zuckerman et al. (1995) but interestingly, Manara et al. (2014) recently published a spectroscopic study of the gas content, accretion and wind properties of a sample of 22 TDs with X-Shooter. They find that 80% of the TDs in their sample show compatible with those of classical TTauri obects. Moreover, they conclude that in their somehow limited sample of TDs there is a gas rich inner disk with density similar to that of disks in classic PMSs. Bergin et al. (2013), using observations from the Herschel Space Observatory PACS Spectrometer, found that the old ( Myr) PMS star TW Hydrae is surrounded by a gas disc with mass exceeding M. This surprising result indicates that TW Hydrae is an old PMS star containing a massive gas disc that is several times the minimum mass required to make all the planets in our solar system. Even more recently, Roberge et al. (2013) and Moór et al. (2013) reported the discoveries of a low-mass protoplanetary-like gaseous disc, together with debris discs, around the older PMS stars 49 Ceti and HD 95086, with ages ranging from 10 to 30 Myr. All these results support a scenario in which old and evolved debris discs still host a significant amount of gas and confirm our results with completely independent measurements.
8 Summary
In this work we present optical observations of PMS stars in the cluster Tr 14 in the Carina Nebula, obtained with the WFI imager at La Silla. We further combine these optical observations with near-IR observations made with SOFI and Spitzer, in order to provide a more complete description of the cluster’s young stellar populations. The main results can be summarized as follows:
-
1.
We present the deepest optical CMD to date for this cluster.
-
2.
Using H photometry we are able to identify 356 bona-fide PMS stars showing H excess emission with EW. We interpret this observational feature as indication that these objects are still actively accreting gas from a circum-stellar disc.
-
3.
From the comparison of the HR diagram with PMS evolutionary models we derive ages and masses of the PMS stars. We find that most of the PMS objects are younger than 10 Myr with a median age of Myr. Surprisingly, we find that of the mass accreting objects are older than 8 Myr.
-
4.
The presence of candidate long-living accreting discs is in line with the findings in a number of Galactic (Beccari et al., 2010; De Marchi et al., 2013b) and extragalactic (Panagia et al., 2000; De Marchi et al., 2010, 2011a, 2011b; Spezzi et al., 2012; De Marchi et al., 2013a, b) starburst clusters.
-
5.
Using the derived stellar physical parameters (mass, radius) of the PMS objects and their H luminosities , we derive the accretion luminosity and mass accretion rates . We find that decreases with time, in line with the predictions of models of viscous discs, but the that we measure are systematically higher than those predictions. Taking into account the photometric completeness in the H observations and our requirement that a bona-fide PMS star be classified as such only if it has EW, we determine the detection limit to the measured rates. For comparison, we apply the same analysis to PMS stars in Tr 37, where the distribution of PMS masses peaks at M⊙. We demonstrate that our values are reliable and that it is the mass distribution of the PMS objects sampled in Tr 14 that affects the measured . Indeed, a K–S test demonstrates that, once the same mass range is selected, the distributions in Tr 14 and Tr 37 are indistinguishable from one another.
-
6.
We finally combine the optical WFI photometry with near-IR observations from SOFI and Spitzer, all corrected for extinction, in order to build SEDs for each PMS star in Tr 14. A comparison with synthetic spectra, calculated using NextGen atmosphere models for the specific physical parameters measured for these stars, indicates that only a small fraction of them have near-IR excess, at any age. The lack of data at wavelengths above m does not allow us to investigate in detail the nature and the physical properties of the discs. However, our analysis suggests the presence of transitional discs in which a large amount of gas is still present and sustains accretion onto the PMS object at ages older than 10 Myr. This scenario is supported by the recent discoveries with Herschel of transitional discs containing a massive gas component around the relatively old PMS stars TW Hydrae, 49 Ceti, and HD 95086. Our results are in full agreement with these findings and together with them they challenge the common-wisdom understanding of circumstellar disc evolution, possibly implying a new scenario for the planet formation mechanism. The existence of a population of old discs suggests that the planet formation process could proceed on much longer timescales than previously thought.
Acknowledgements.
We wish to thank the anonymous referee for insightful comments that have helped to improve the presentation of our work. This research has made use of the NASA/IPAC Infrared Science Archive, which is operated by the Jet Propulsion Laboratory, California Institute of Technology, under contract with the National Aeronautics and Space Administration. NP acknowledges partial sup- port by STScI DDRF grant D0001.82435. MZ was supported by Proyecto Fondecyt Regular 1110393, The BASAL Center for Astrophysics and Associated Technologies PFB-06, and from the Ministry of Economy, Development, and Tourism’s Iniciativa Cient fica Milenio through grant IC12009, awarded to the Millennium Institute of Astrophysics MAS.References
- Allard et al. (2012) Allard, F., Homeier, D., & Freytag, B. 2012, Royal Society of London Philosophical Transactions Series A, 370, 2765
- Appenzeller & Mundt (1989) Appenzeller, I., & Mundt, R. 1989, A&A Rev, 1, 291
- Ascenso et al. (2007) Ascenso, J., Alves, J., Vicente, S., & Lago, M. T. V. T. 2007, A&A, 476, 199
- Baraffe et al. (2009) Baraffe, I., Chabrier, G., & Gallardo, J. 2009, ApJl, 702, L27
- Barentsen et al. (2011) Barentsen, G., Vink, J. S., Drew, J. E., et al. 2011, MNRAS, 415, 103
- Beccari et al. (2010) Beccari, G., et al. 2010, ApJ, 720, 1108
- Beccari et al. (2014) Beccari, G., De Marchi, G., Panagia, N., & Pasquini, L. 2014, MNRAS, 437, 2621
- Bellazzini et al. (2002) Bellazzini, M., Fusi Pecci, F., Messineo, M., Monaco, L., & Rood, R. T. 2002, AJ, 123, 1509
- Bergin et al. (2013) Bergin, E. A., Cleeves, L. I., Gorti, U., et al. 2013, Nature, 493, 644
- Bertout (1989) Bertout, C. 1989, ARA&A, 27, 351
- Bessell et al. (1998) Bessell, M. S., Castelli, F., & Plez, B. 1998, A&A, 333, 231
- Calvet et al. (2000) Calvet, N., Hartmann, L., Strom, E. 2000, in “Protostars and Planets”, eds V. Mannings, A. Boss, S. Russell (Tucson: University of Arizona Press), 377
- Carraro et al. (2004) Carraro, G., Romaniello, M., Ventura, P., & Patat, F. 2004, A&A, 418, 525
- Da Rio et al. (2009) Da Rio, N., Robberto, M., Soderblom, D. R., et al. 2009, ApJs, 183, 261
- Da Rio et al. (2010) Da Rio, N., Gouliermis, D. A., & Gennaro, M. 2010, ApJ, 723, 166
- Da Rio et al. (2014) Da Rio, N., Jeffries, R. D., Manara, C. F., & Robberto, M. 2014, MNRAS, 439, 3308
- Degl’Innocenti et al. (2008) Degl’Innocenti, S., Prada Moroni, P.G., Marconi, M., Ruoppo, A. 2008, Ap&SS, 316, 25
- De Marchi et al. (2010) De Marchi, G., Panagia, N., & Romaniello, M. 2010, ApJ, 715, 1
- De Marchi et al. (2011a) De Marchi, G., Panagia, N., Romaniello, M., et al. 2011, ApJ, 740, 11
- De Marchi et al. (2011b) De Marchi, G., Paresce, F., Panagia, N., et al. 2011, ApJ, 739, 27
- De Marchi et al. (2013a) De Marchi, G., Beccari, G., Panagia, N. 2013a, ApJ, 775, 68
- De Marchi et al. (2013b) De Marchi, G., Panagia, N., Guarcello, M. G., & Bonito, R. 2013b, MNRAS, 435, 3058
- Dahm (2008) Dahm, S. 2008, AJ, 136, 521
- Espaillat et al. (2010) Espaillat, C., D’Alessio, P., Hernández, J., et al. 2010, ApJ, 717, 441
- Espaillat et al. (2012) Espaillat, C., Ingleby, L., Hernández, J., et al. 2012, ApJ, 747, 103
- Fang et al. (2013) Fang, M., Kim, J. S., van Boekel, R., et al. 2013, ApJs, 207, 5
- Fedele et al. (2010) Fedele, D., van den Ancker, M. E., Henning, T., Jayawardhana, R., & Oliveira, J. M. 2010, A&A, 510, A72
- Fender et al. (2009) Fender, R. P., Russell, D. M., Knigge, C., et al. 2009, MNRAS, 393, 1608
- Gullbring et al. (1998) Gullbring, E., Hartmann, L., Briceo, C., & Calvet, N. 1998, ApJ, 492, 323
- Hartmann et al. (1998) Hartmann, L., Calvet, P., Gullbring, E., D Alessio, P. 1998, ApJ, 495, 385
- Herbst et al. (2002) Herbst, W., Bailer-Jones, C. A. L., Mundt, R., Meisenheimer, K., & Wackermann, R. 2002, A&A, 396, 513
- Hora et al. (2008) Hora, J. L., Carey, S., Surace, J., et al. 2008, PASP, 120, 1233
- Hur et al. (2012) Hur, H., Sung, H., & Bessell, M. S. 2012, AJ, 143, 41
- Koenigl (1991) Koenigl, A. 1991, ApJl, 370, L39
- Lada et al. (2006) Lada, C. J., Muench, A. A., Luhman, K. L., et al. 2006, AJ, 131, 1574
- Lidman & Cuby (2000) Lidman, C., Cuby, J.C. 2000, SOFI user’s manual, Ref. LSO-MAN-ESO-40100-0004 (Garching: ESO)
- Lynden-Bell & Pringle (1974) Lynden-Bell, D., & Pringle, J. E. 1974, MNRAS, 168, 603
- Manara et al. (2014) Manara, C. F., Testi, L., Natta, A., et al. 2014, arXiv:1406.1428
- Marigo et al. (2008) Marigo, P., Girardi, L., Bressan, A., et al. 2008, A&A, 482, 883
- Merín et al. (2010) Merín, B., Brown, J. M., Oliveira, I., et al. 2010, ApJ, 718, 1200
- Mihalas & Binney (1981) Mihalas, D., & Binney, J. 1981, Galactic Astronomy: Structure and Kinematics (2d. ed.; San Francisco: Freeman)
- Moór et al. (2013) Moór, A., Juhász, A., Kóspál, Á., et al. 2013, ApJl, 777, L25
- Panagia et al. (2000) Panagia, N., Romaniello, M., Scuderi, S., Kirshner, R. 2000, ApJ, 539, 197
- Preibisch (2012) Preibisch, T. 2012, Research in Astronomy and Astrophysics, 12, 1
- Rigliaco et al. (2011) Rigliaco, E., Natta, A., Randich, S., Testi, L., & Biazzo, K. 2011, A&A, 525, A47
- Roberge et al. (2013) Roberge, A., Kamp, I., Montesinos, B., et al. 2013, ApJ, 771, 69
- Romaniello et al. (1998) Romaniello, M. 1998, PhD thesis, Scuola Normale Superiore, Pisa, Italy
- Romaniello et al. (2002) Romaniello, M., Panagia, N., Scuderi, S., & Kirshner, R. P. 2002, AJ, 123, 915
- Sana et al. (2010) Sana, H., Momany, Y., Gieles, M., et al. 2010, A&A, 515, A26
- Shu et al. (1994) Shu, F. H., Najita, J., Ruden, S. P., & Lizano, S. 1994, ApJ, 429, 797
- Soderblom et al. (2013) Soderblom, D. R., Hillenbrand, L. A., Jeffries, R. D., Mamajek, E. E., & Naylor, T. 2013, arXiv:1311.7024
- Spezzi et al. (2012) Spezzi, L., de Marchi, G., Panagia, N., Sicilia-Aguilar, A., & Ercolano, B. 2012, MNRAS, 421, 78
- Stetson (1987) Stetson, P. B. 1987, PASP, 99, 191
- Stetson (1994) Stetson, P.B., 1994, PASP, 106, 250
- Tognelli et al. (2012) Tognelli, E., Degl’Innocenti, S., Prada Moroni, P. G. 2012, A&A, 548, A41
- Vazquez et al. (1996) Vazquez, R. A., Baume, G., Feinstein, A., & Prado, P. 1996, A&As, 116, 75
- Weidner et al. (2009) Weidner, C., Kroupa, P., & Maschberger, T. 2009, MNRAS, 393, 663
- White & Basri (2003) White, R. J., & Basri, G. 2003, ApJ, 582, 1109
- Zuckerman et al. (1995) Zuckerman, B., Forveille, T., & Kastner, J. H. 1995, Nature, 373, 494