Addendum to “Constraints on and future prospects for Two-Higgs-Doublet Models in light of the LHC Higgs signal”
Abstract
We update the constraints on Two-Higgs-Doublet Models of Type I and II discussed in arXiv:1405.3584 using the latest LHC measurements of the Higgs signal as of Summer 2014. We provide explicit comparisons of the results before and after the Summer 2014 ATLAS and CMS updates. Overall, the changes with respect to arXiv:1405.3584 are rather small; to a large extent this is due to the fact that both the ATLAS and the CMS updates of the decay mode moved closer to SM expectations.
I Introduction
In a recent paper Dumont et al. (2014), we provided a comprehensive analysis of the status of Two-Higgs-Doublet Models (2HDMs) of Type I and Type II, considering both the cases where the observed Higgs particle at the LHC is the lighter CP-even state or the heavier CP-even state . To this end, we performed scans of the 2HDM parameter space taking into account all relevant constraints from precision electroweak data, from stability, unitarity and perturbativity of the potential, as well as from physics and from the direct searches at LEP. We also employed the most recent limits from searches for heavy Higgs-like states at the LHC. The central piece of the analysis however was to check for consistency with the various signal strength measurements of the observed Higgs boson at the LHC, including a consistent treatment of “feed down” from the production of heavier Higgs states. This was done based on the results published by ATLAS and CMS by June 2013, i.e. according to the status of the Moriond and LHCP 2013 conferences (see Belanger et al. (2013) for a summary).
Since then, a number of new measurements or updates of existing ones were published by the experimental collaborations. Most significant, from the point of view of our analysis of the 2HDMs, were the long-awaited final results for the decay mode from CMS Khachatryan et al. (2014) in July and the update of the results from ATLAS Aad et al. (2014) at the end of August 2014. There were also several other important new measurements or updates; for example uncertainties have been significantly reduced for the fermionic channels, particularly for in ttH production. All these new results were put together and analyzed in global coupling fits in Bernon et al. (2014).
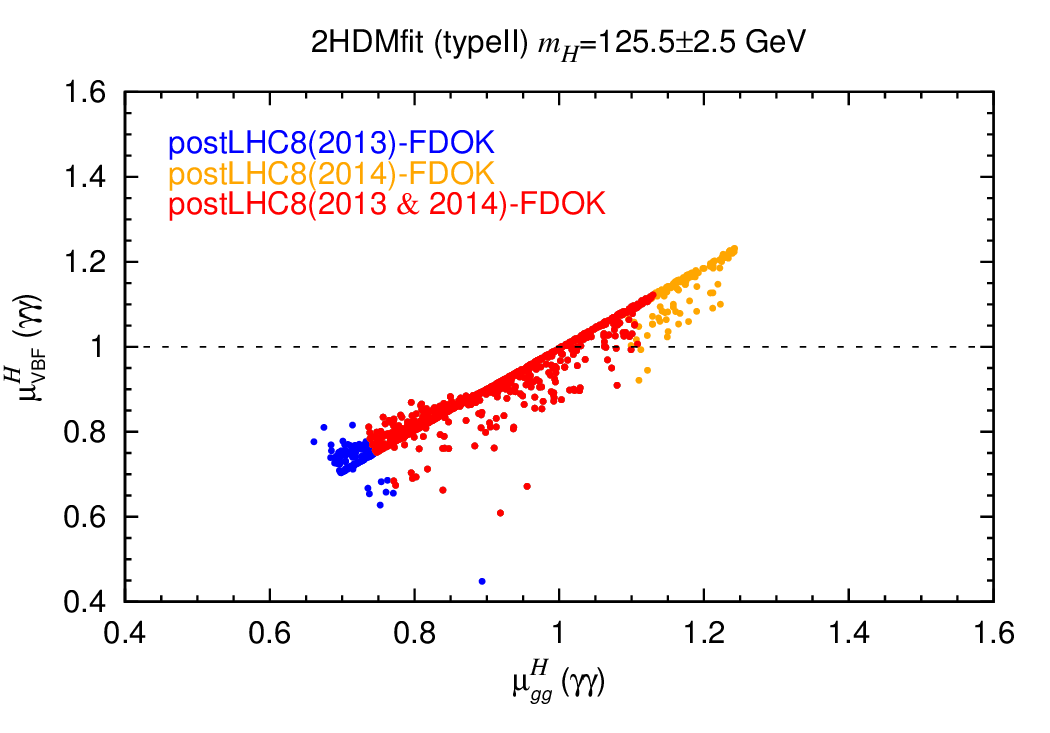
In the present note, we now revisit the analysis of Dumont et al. (2014) and ask what are the implications in the 2HDM context of all these new (or updated) results on the signal strengths of the Higgs boson. To this aim, we take the scan points of Dumont et al. (2014) and, leaving everything else the same, update the calculation for the signal strengths at GeV in the versus planes, Eq. (5) of Dumont et al. (2014), with the new numbers presented in Table I of Bernon et al. (2014). Points for which for each decay mode (that means points that are consistent within 95.4% confidence level (CL) with the observed signal strengths for each decay mode ) and that in addition pass all other relevant constraints will be called “postLHC8(2014)-FDOK” and compared to the corresponding points of Dumont et al. (2014), called “postLHC8(2013)-FDOK”. In the plots, we will moreover identify the points that fit both the 2013 and the 2014 analyses as “postLHC8(2013 & 2014)-FDOK”.
We note that in this addendum we focus on pointing out the small modifications that arise from the latest ATLAS and CMS results. For a detailed physics discussion and implications for future measurements, e.g. at the next run of the LHC at TeV, we refer to the main paper Dumont et al. (2014), whose results overall remain perfectly valid. For notations and conventions, we also refer to Dumont et al. (2014).
II scenarios
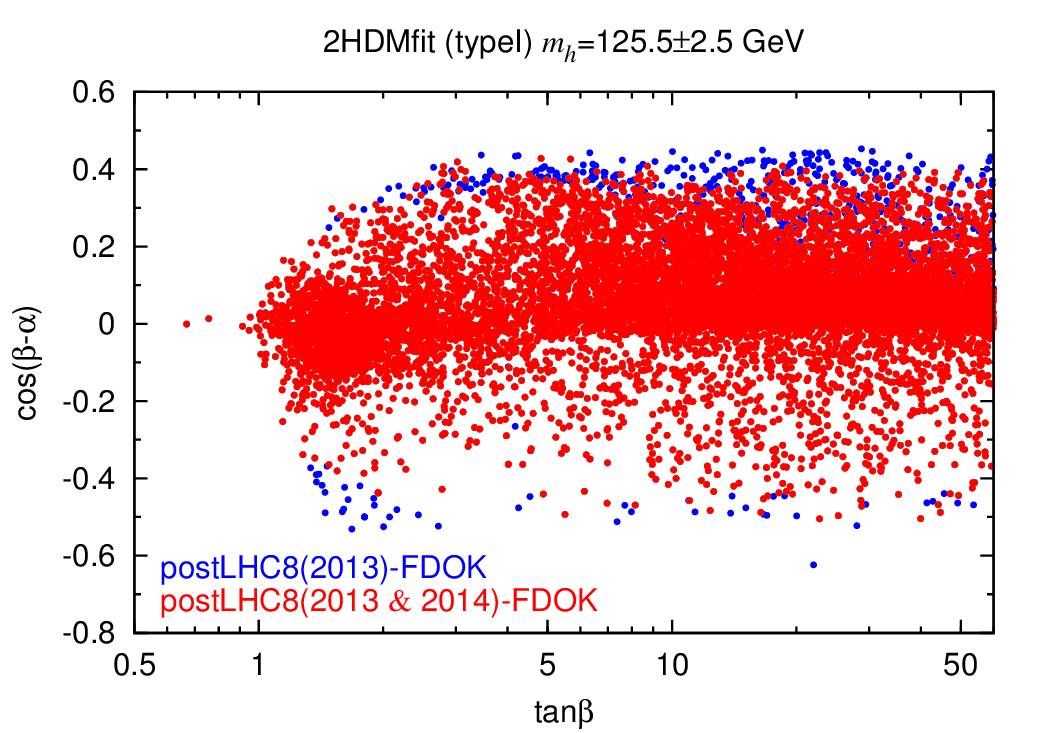
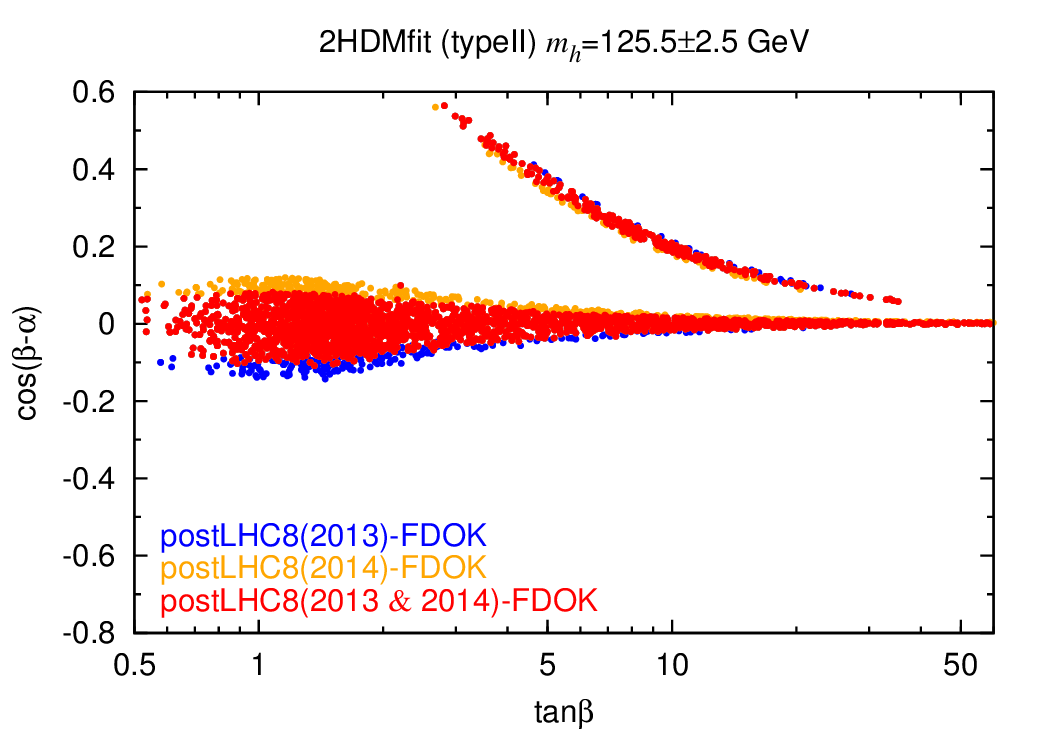
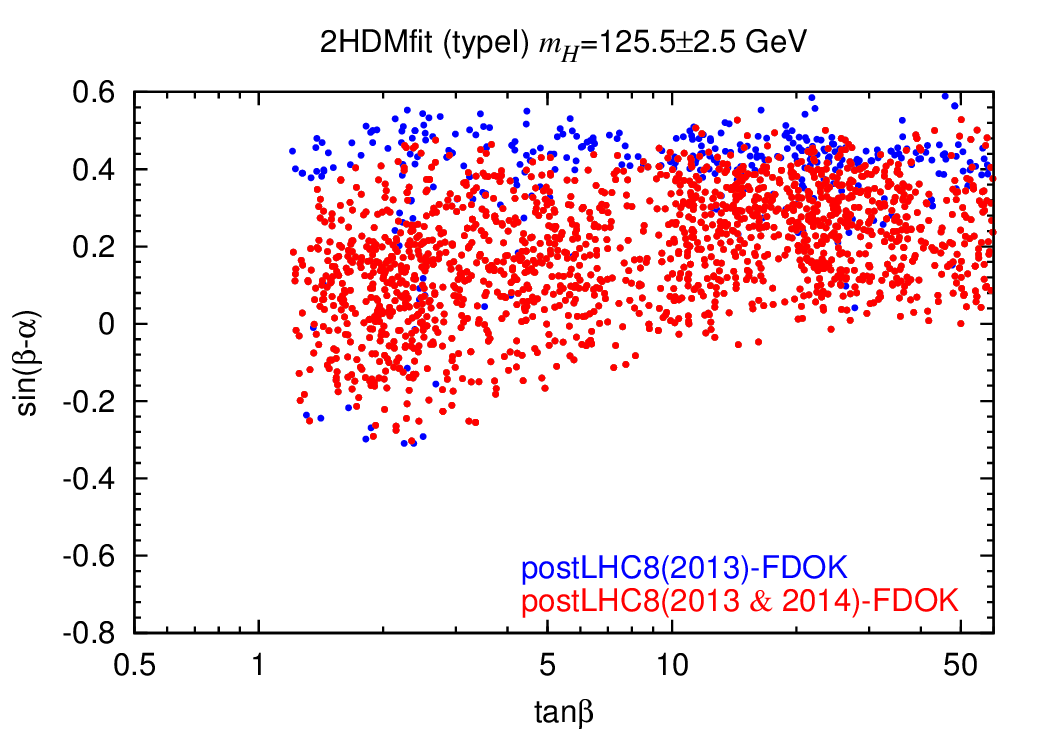
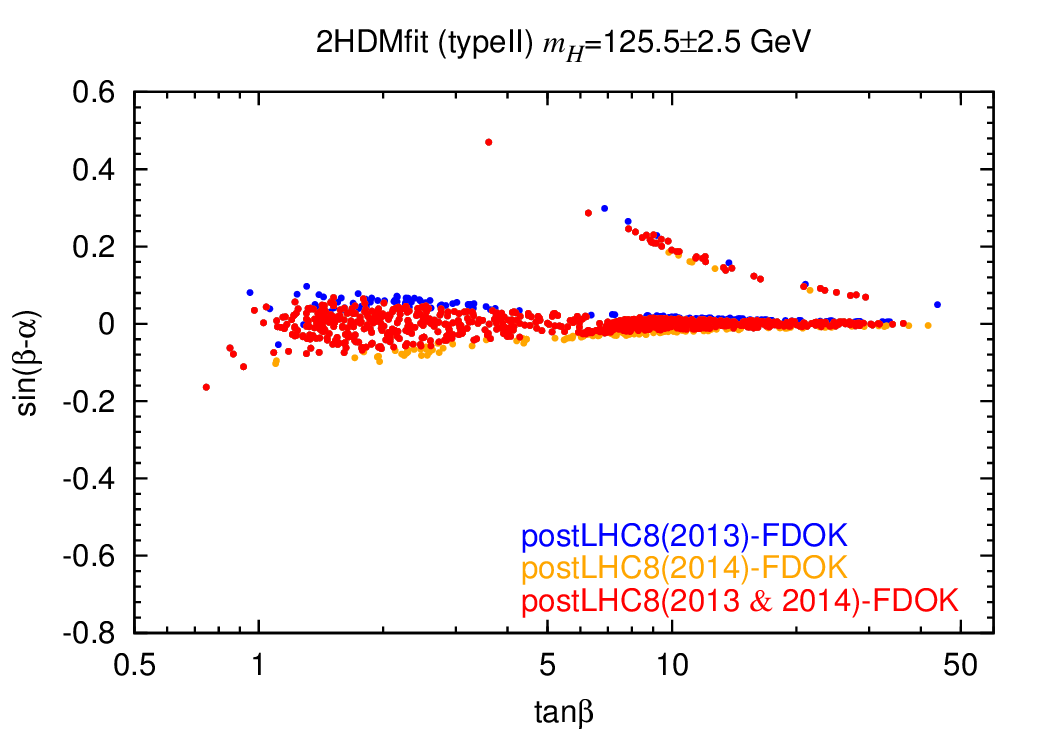
We begin by showing in Fig. 1 the points surviving all constraints in the versus plane for the scenarios. The red points satisfy the Higgs signal constraints from both 2013 and 2014, while orange (blue) points pass only the 2014 (2013) Higgs constraints. We see that, in Type I, large values of get slightly more constrained, while in Type II there is a narrow strip around and that is now excluded. On the other hand, in Type II slightly larger positive values of are allowed from the 2014 measurements. (Such orange points, which were not compatible with the 2013 results but are now allowed after the 2014 updates do occur only in Type II but not in Type I.) The banana-shaped branch spanning from to is still present; this corresponds to the solution with a flipped sign for .
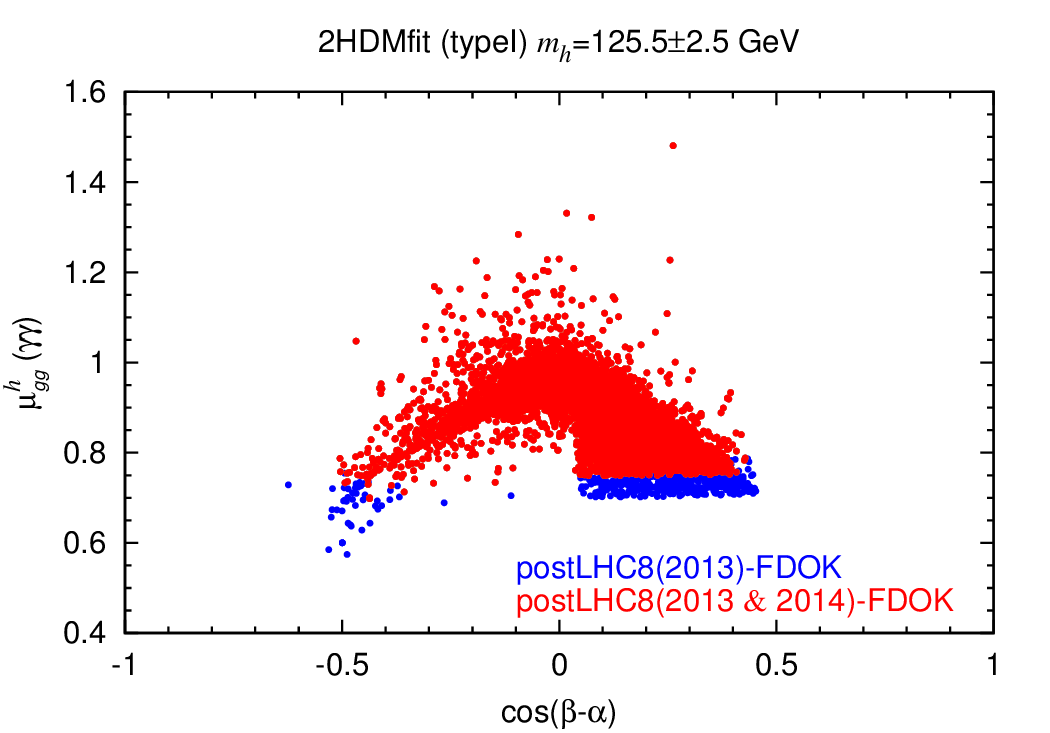
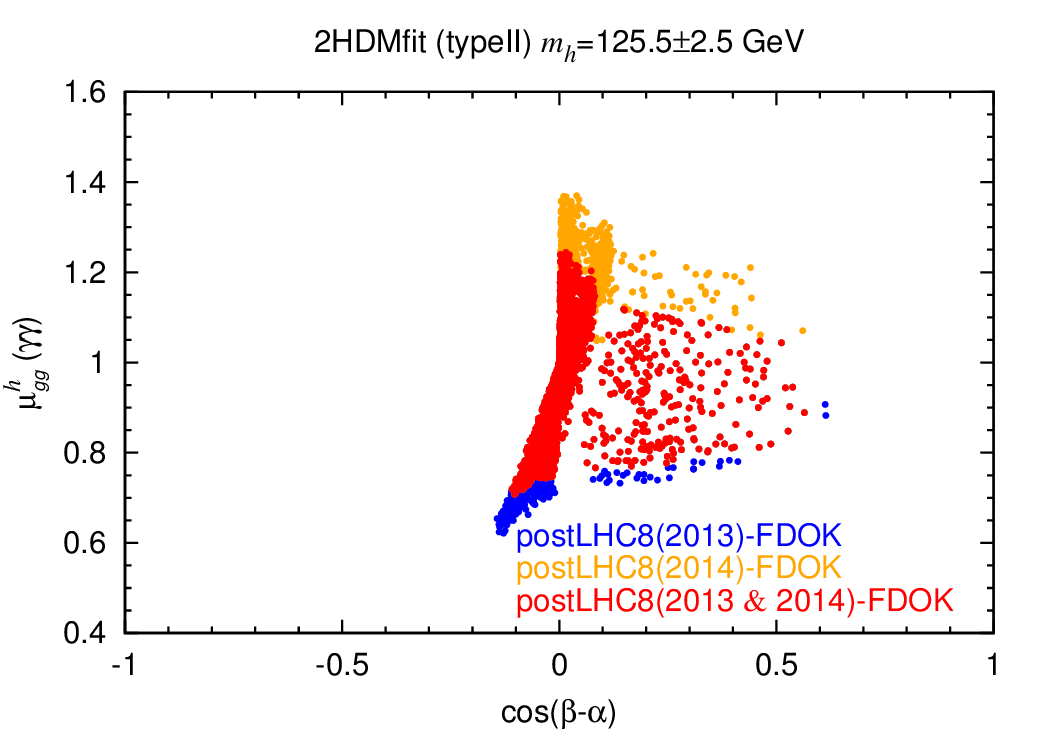
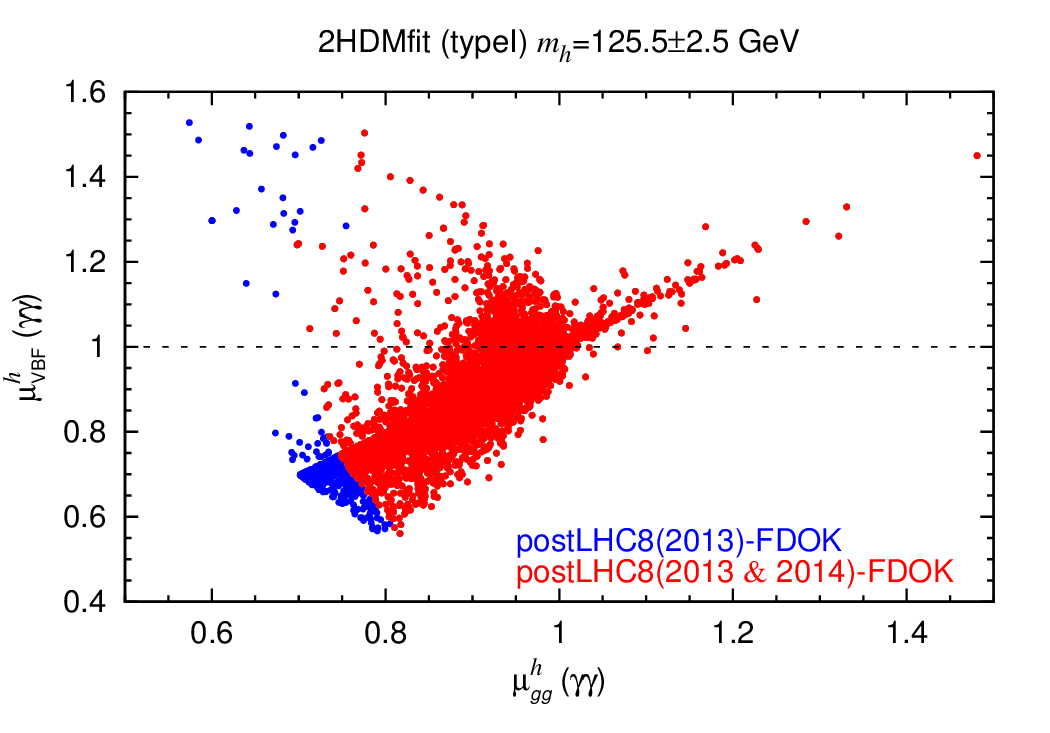
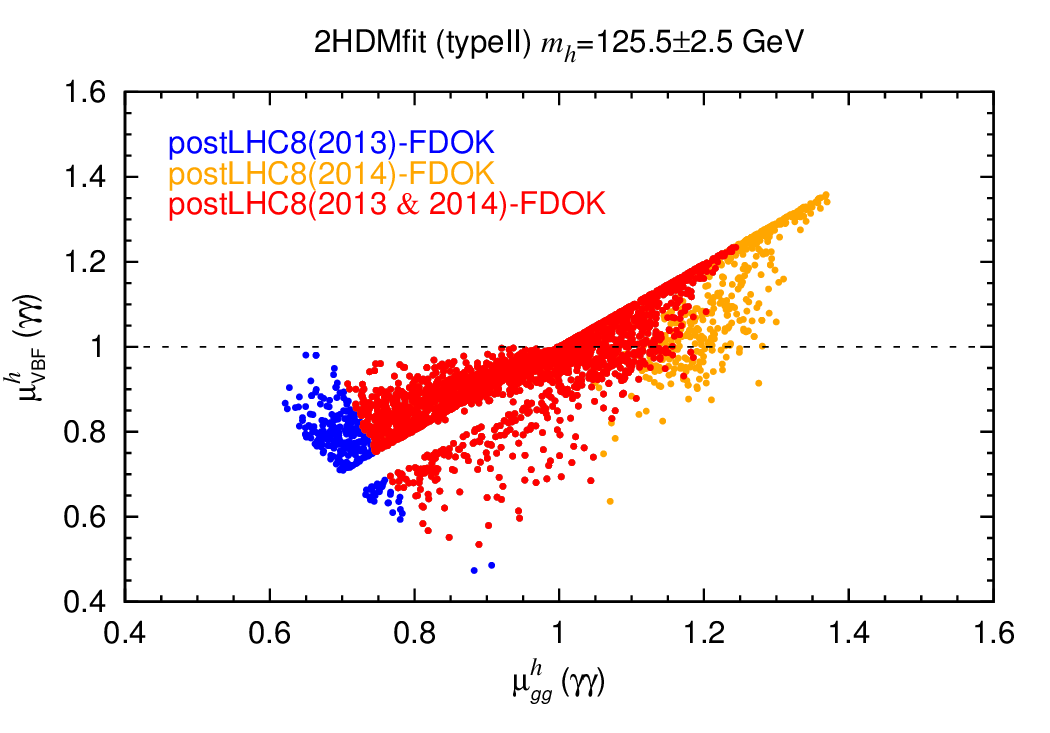
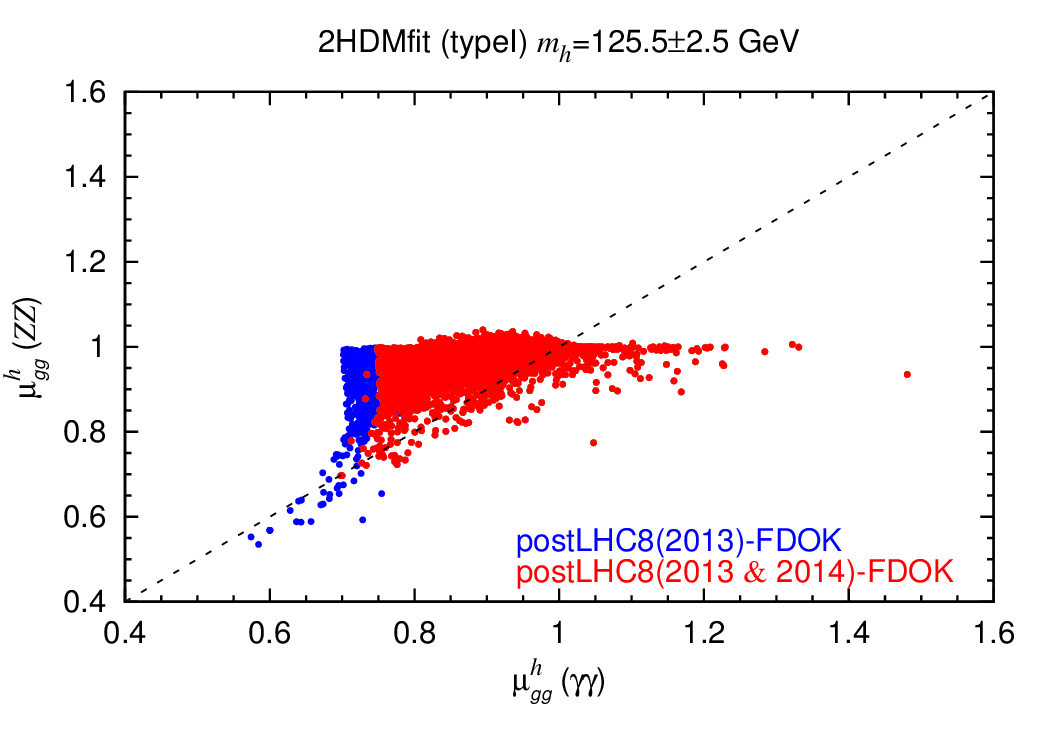
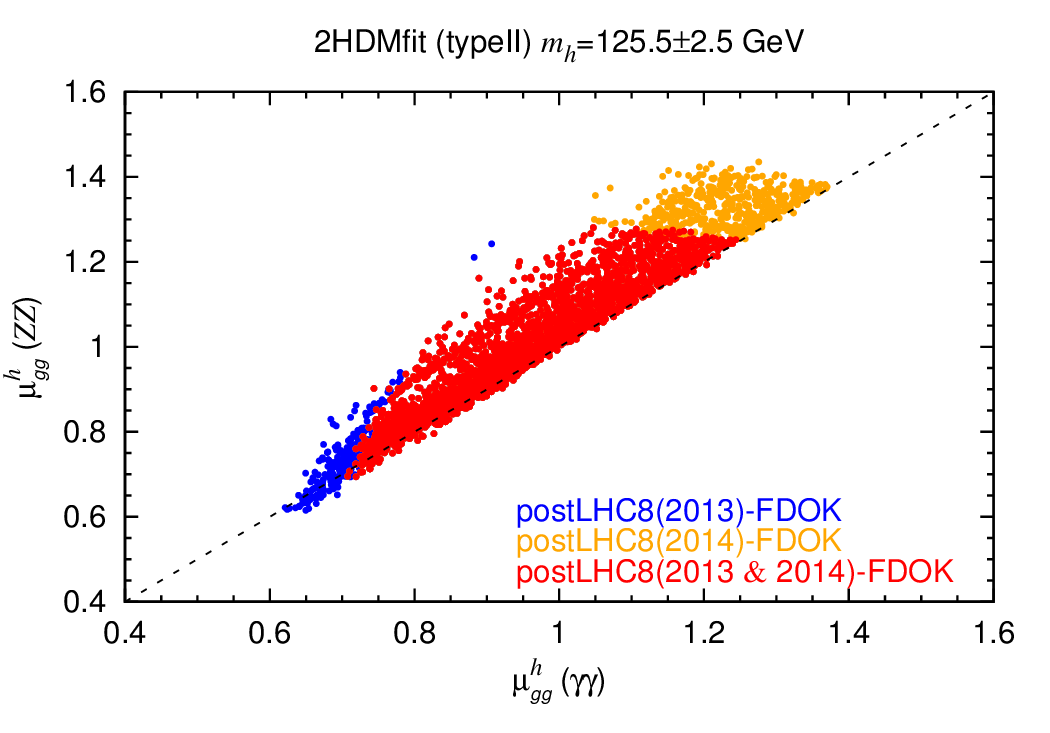
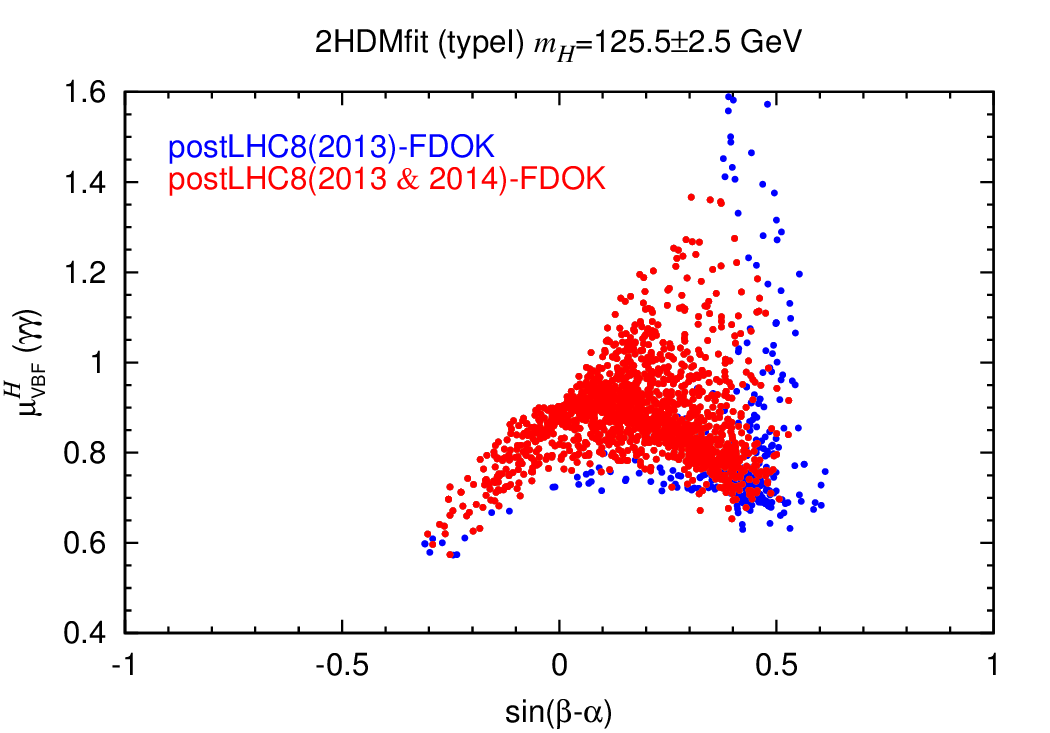
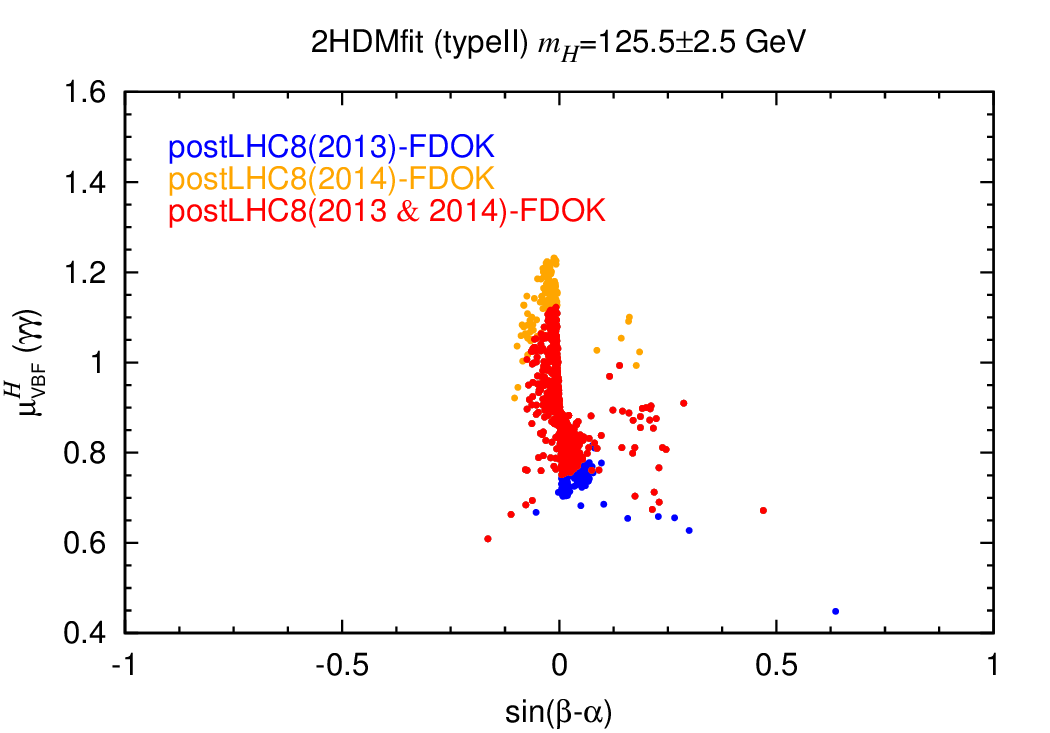
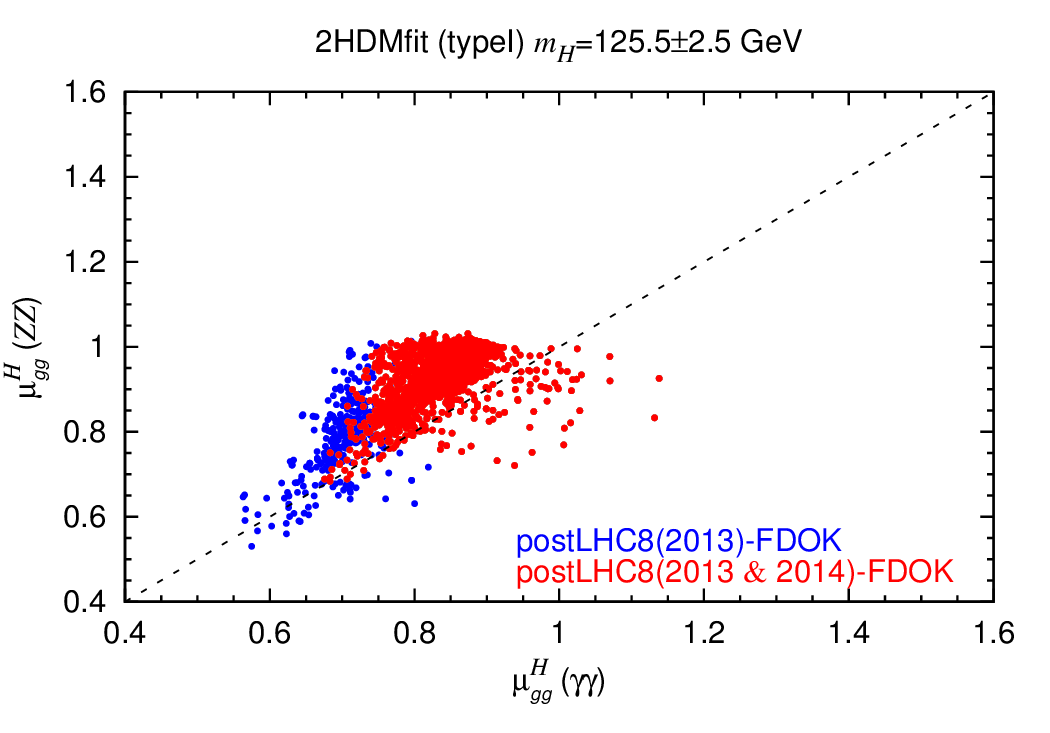
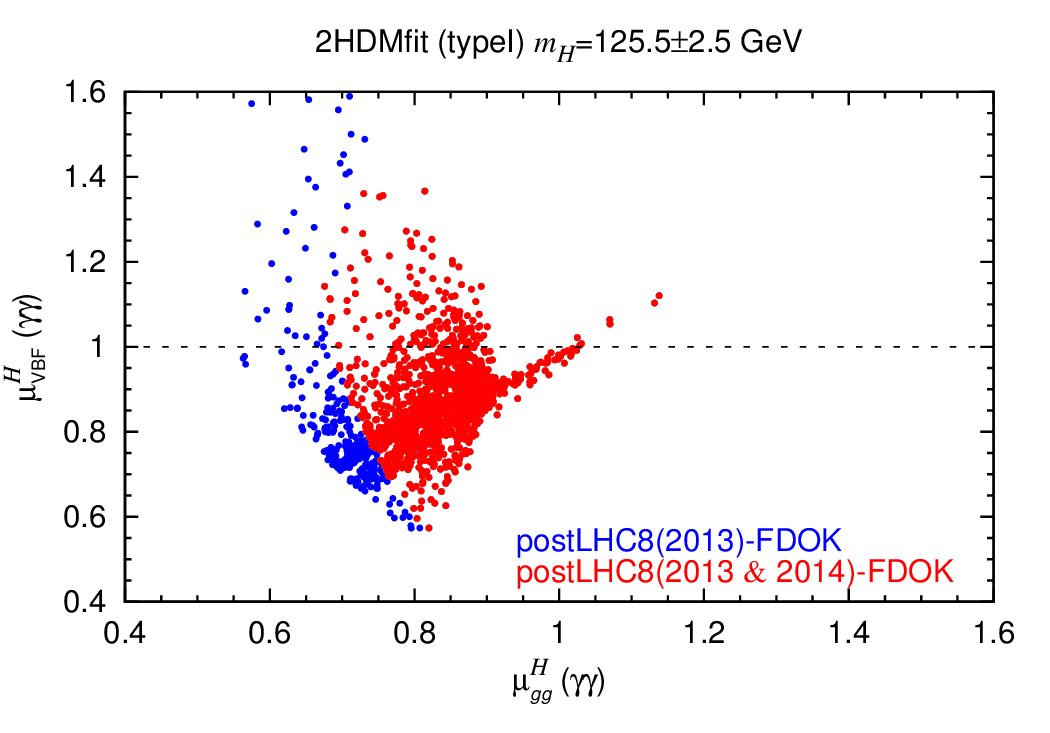
The reason for these slight changes lies mostly in the new combined signal strengths for the decay mode: and with a correlation of Bernon et al. (2014), as compared to and with a correlation of in 2013 Belanger et al. (2013). The result, after combining ATLAS and CMS data, is that the best-fit signal strength in the ggF mode111In ttH production, uncertainties are still too large to have any impact. has increased (although the new central value is consistent at the level with the 2013 results) while that in VBF+VH production has come down by a bit more than . The signal strengths as a function of are shown in the top row of Fig. 2. Here, one sees explicitly that the low values of are no longer allowed. Moreover, while there has been no change in the maximum obtainable in Type I, higher values up to about (vs. before) are attainable in Type II. The alert reader will have noticed that this upper limit is much lower than the range that should be allowed in principle. The limitation in fact comes from the decay mode in ggF production, for which we have from the 2014 measurements, and hence at 95.4% CL (as compared to in Spring 2013). The correlations between signal strengths in different channels are illustrated in the middle and bottom rows of Fig. 2.
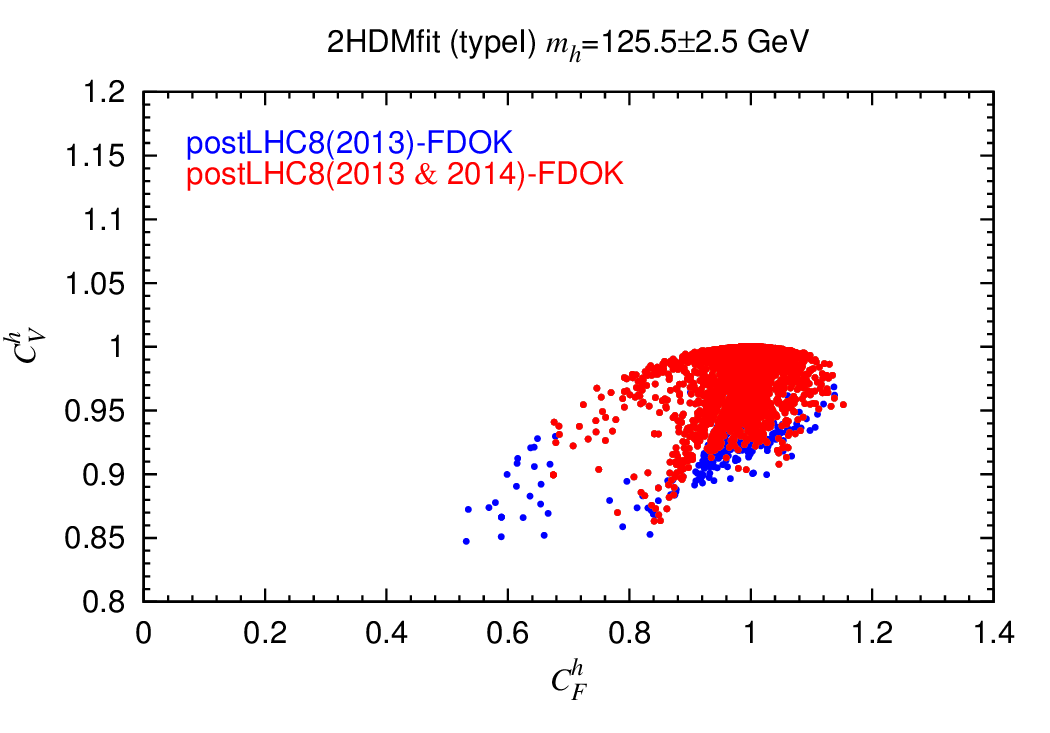
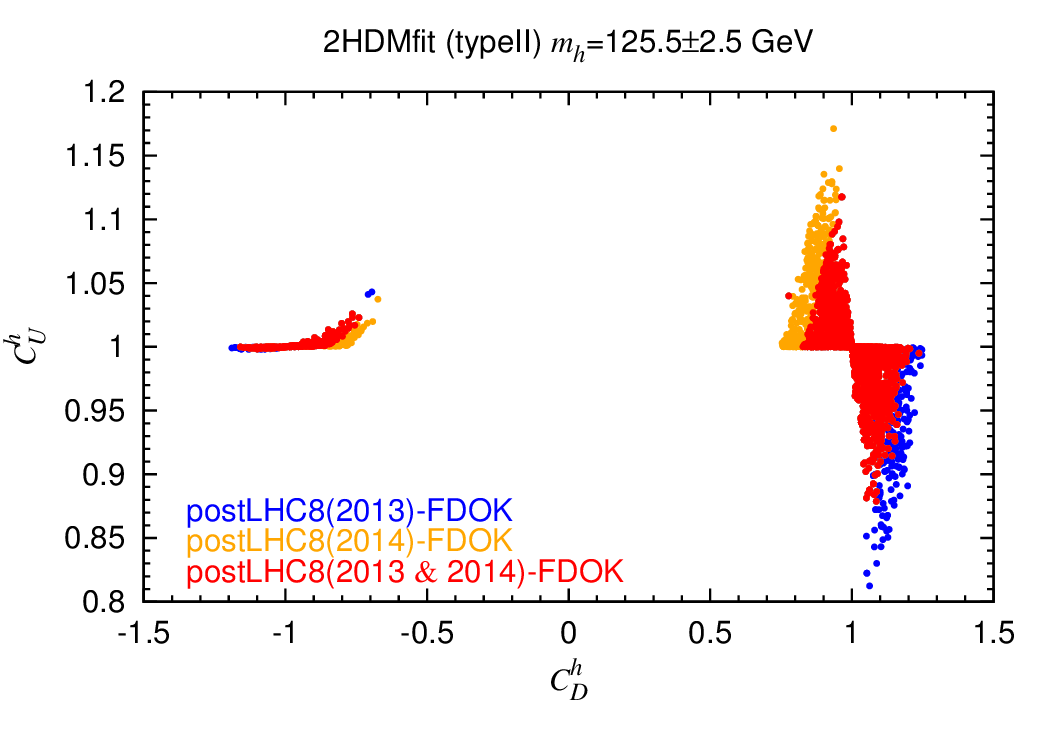
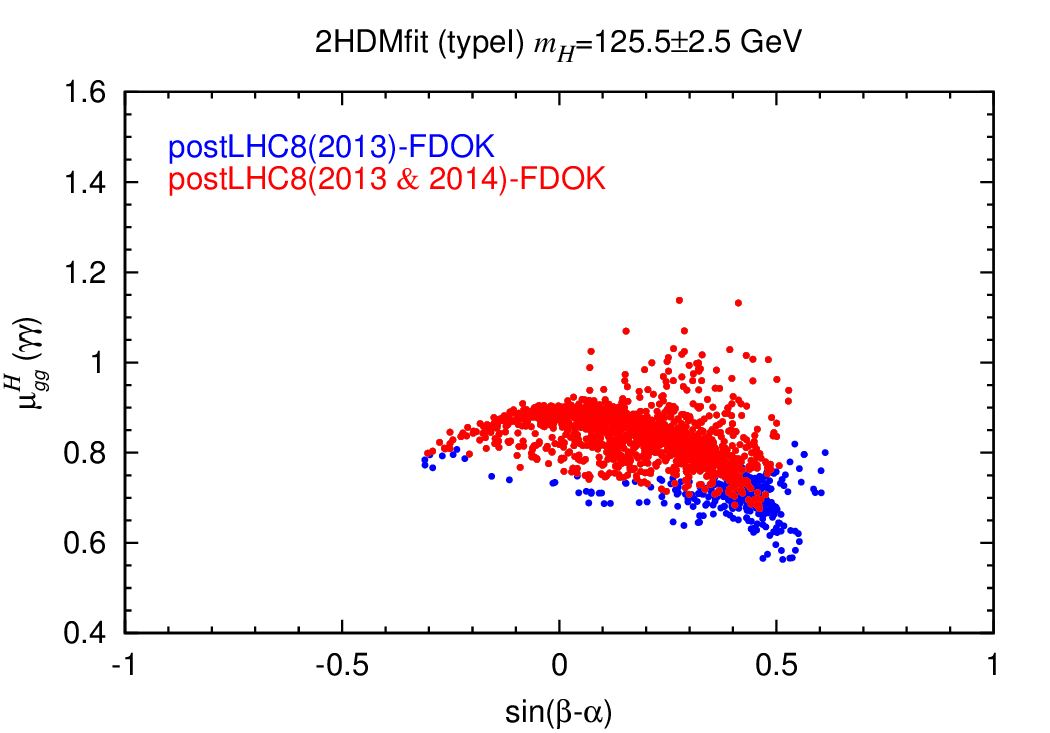
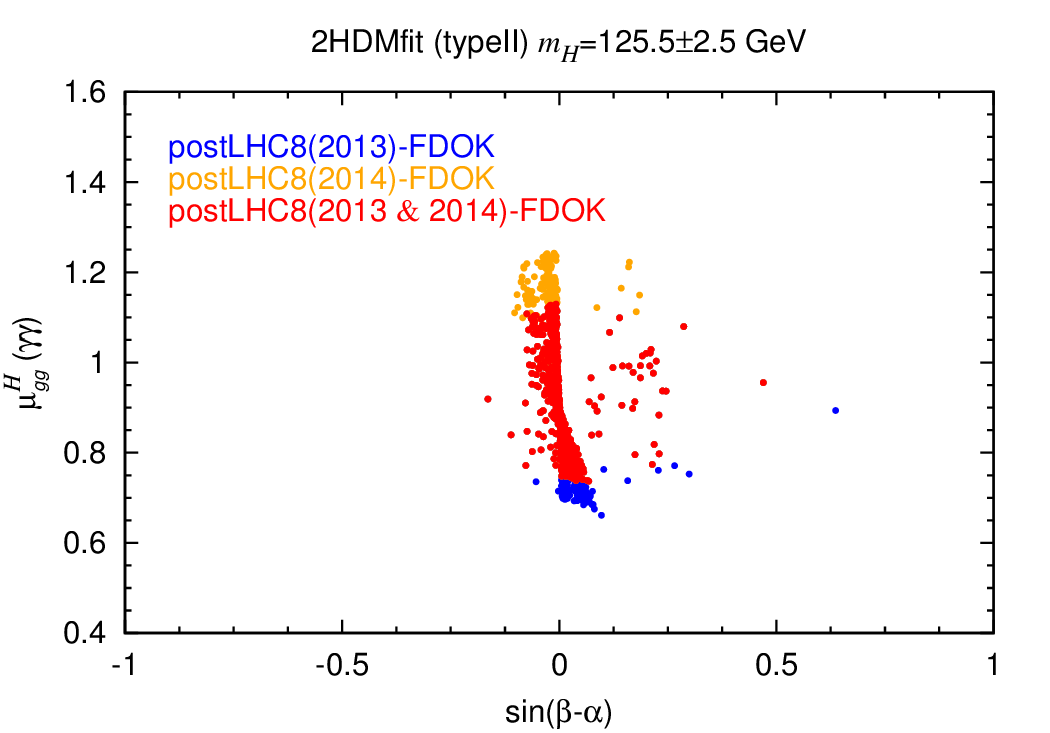
In Fig. 3, we plot vs. (Type I) and vs. (Type II) for the scenarios. Substantial suppression of the fermionic couplings is possible in both models. In both cases, an enhanced rate can come from a suppression of , which suppresses . In Type I, since , this goes hand-in-hand with a reduction of the coupling; depending on which effect dominates, can be enhanced, while is suppressed (cf. the middle-left plot in Fig. 2). This does not occur in Type II, where enhancement/suppression of and is anti-correlated. In this case leads to an enhancement and to a suppression of both and ; since works in the same direction, the effect can be more pronounced for than for (cf. the middle-right plot in Fig. 2)
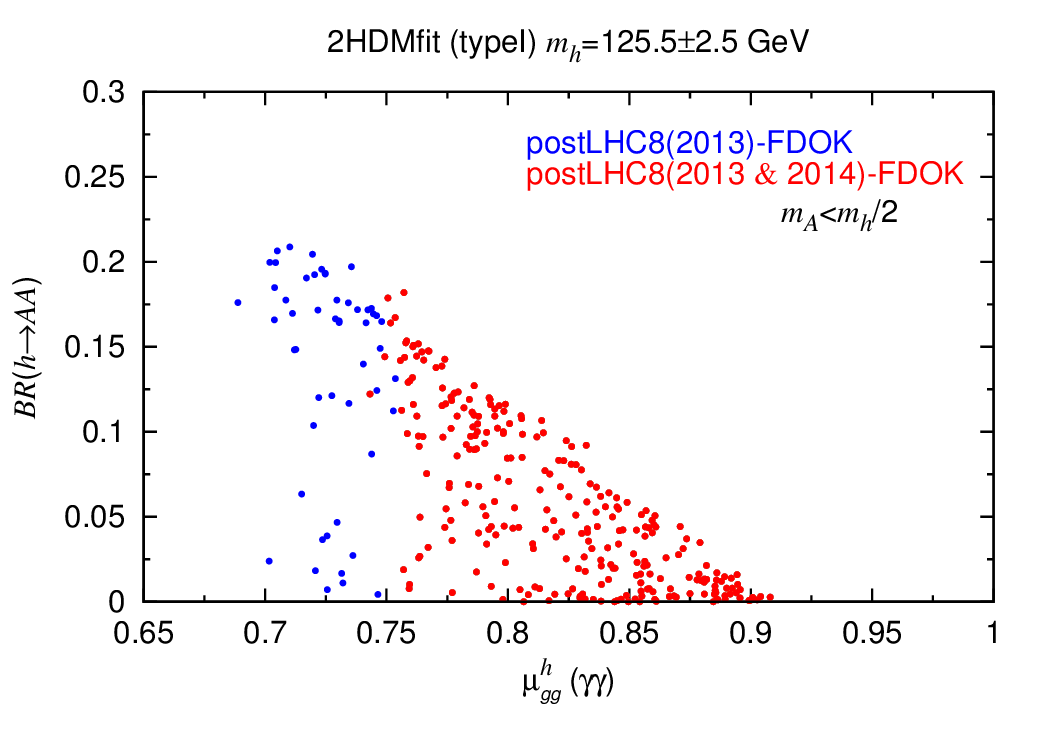
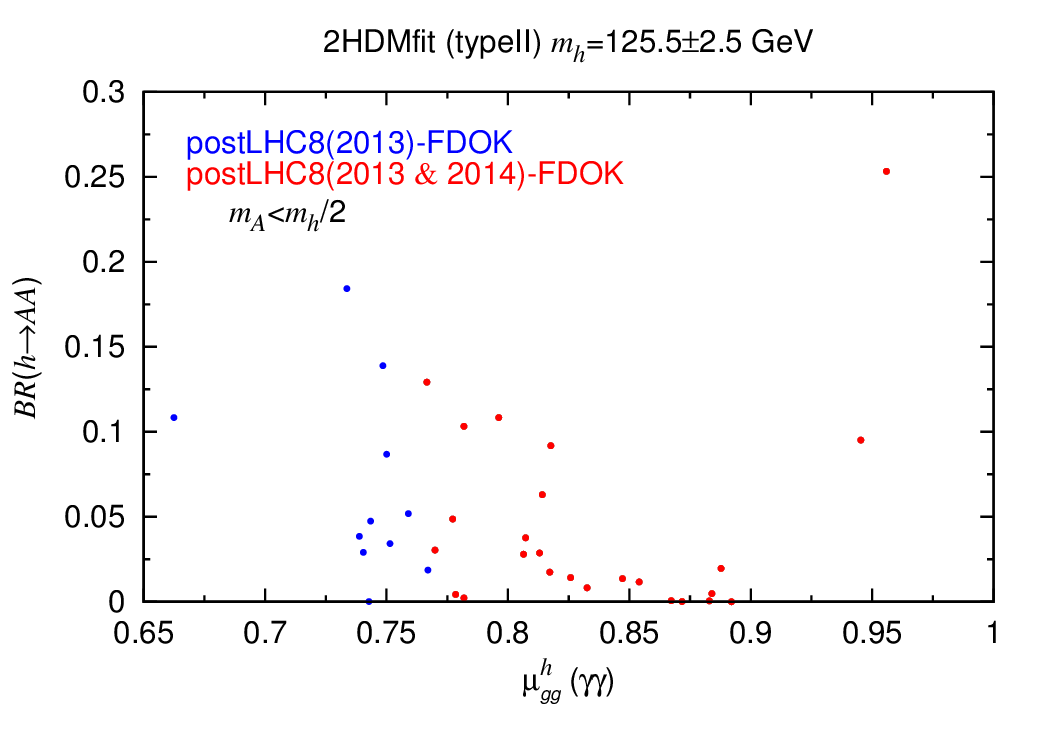
Regarding the allowed ranges of , and , there is no visible change with respect to Dumont et al. (2014). It is however interesting to take a closer look at the region , where decays are possible. In Fig. 4, we show the correlation between and . As one can see, large values of the former imply suppression of the latter. Although the effect is small, the requirement at constrains the maximum that can be obtained in Type I and Type II models. (In Type II, however, a focused scan would be needed for a quantitative interpretation of the results.) This limit is actually stronger than the “direct” constraint on unseen decays, Bernon et al. (2014), from the generic coupling fit.
III scenarios
Let us now turn to the case that the observed Higgs state at GeV is the heavier CP-even scalar . Analogous to Fig. 1, we show in Fig. 5 the points in the versus plane after all constraints have been applied. As before, we observe a slight narrowing of the allowed range, but no visible change in the direction. It is interesting to note, however, that in Type I requires . It is also remarkable that, while in Type I can still vary from about to (corresponding to ), in Type II one is pretty much forced into the decoupling/alignment regime, the few points with sizable being quite rare and associated with the branch having a negative sign for .
The signal strengths as a function of are shown in Fig. 6. Correlations of signal strengths are illustrated in Fig. 7. Analogous arguments as for the case apply. It is however worth noting that the direct correlation between , and in Type II is much stronger than for . As above, additional Type II points occur with and values beyond those found in Dumont et al. (2014). These would be removed if future measurements show that () is within () of unity. As was noted in Dumont et al. (2014), if deviations from the SM are required for both the and final states then the upper plots show that only a few points of the Type I model having can survive and that all Type II points will be removed by this constraint.
As regards the , and even the masses associated with a good fit by the to the LHC data and other limits, there is not much change with respect to Dumont et al. (2014). In particular the range of and masses discussed in Dumont et al. (2014) remains valid, the only modification is the slight narrowing in already visible in Fig. 5.

IV Conclusions
Overall, the new ATLAS and CMS analyses from Summer 2014 lead to relatively minor modifications of the preferred parameter ranges in 2HDM models of Type I and Type II, the most significant changes being slight upward shifts of the central and values. In both Type I and Type II this results in the exclusion of points with too low and/or . In addition, in Type II points with somewhat higher and (beyond those allowed in the 2013 analysis) are now allowed; such new points however do not occur in Type I. Apart from these small shifts the results and in particular the conclusions of Dumont et al. (2014) do not change.
A possibly important particular point is that the scenarios with low that escape all LEP and (so far) LHC limits and yet have quite substantial and production cross sections survive the latest data. It will be interesting to probe these scenarios, which are possible for both Type I and Type II in the case and for Type I in the case, in ongoing analyses of the 8 TeV LHC data and in future LHC running at higher energy.
V Acknowledgements
We thank Jérémy Bernon for discussions on the new signal strength constraints. This work was supported in part by US DOE grant DE-SC-000999 and by the “Investissements d’avenir, Labex ENIGMASS”. Y.J. is supported by LHC-TI fellowship US NSF grant PHY-0969510.
References
- Dumont et al. (2014) B. Dumont, J. F. Gunion, Y. Jiang, and S. Kraml, Phys.Rev. D90, 035021 (2014), arXiv:1405.3584 [hep-ph] .
- Belanger et al. (2013) G. Belanger, B. Dumont, U. Ellwanger, J. Gunion, and S. Kraml, Phys.Rev. D88, 075008 (2013), arXiv:1306.2941 [hep-ph] .
- Khachatryan et al. (2014) V. Khachatryan et al. (CMS Collaboration), (2014), arXiv:1407.0558 [hep-ex] .
- Aad et al. (2014) G. Aad et al. (ATLAS Collaboration), (2014), arXiv:1408.7084 [hep-ex] .
- Bernon et al. (2014) J. Bernon, B. Dumont, and S. Kraml, (2014), arXiv:1409.1588 [hep-ph] .