Azimuthally integrated HBT parameters for charged pions
in
nucleus-nucleus interactions versus collision energy
Abstract
In the paper energy dependence of space-time extent of emission region obtained from Bose – Einstein correlations is studied for charged pions in various ion collisions for all experimentally available energies. There is no dramatic change of HBT parameters with increasing of collision energy per nucleon-nucleon pair, , in domain of energies GeV. Energy dependence of estimations for emission duration is almost flat for all energy domain under study within large error bars. Analytic function is suggested for smooth approximation of energy dependence of main HBT parameters. Fit curves demonstrate reasonable agreement with experimental data for most HBT parameters in energy domain GeV. Estimations of some observables are obtained for energies of the LHC and FCC project.
PACS 25.75.-q, 25.75.Gz, 25.75.Nq
I Introduction
At present femtoscopic correlations in particular that based on Bose – Einstein correlations are unique experimental method for the determination of sizes and lifetimes of sources in high energy and nuclear physics. The discussion below is focused on specific case of femtoscopy, namely, on correlations in pairs of identical charged pions with small relative momenta – HBT-interferometry – in nucleus-nucleus collisions. Space-time characteristics for emission region of secondary particles created in (heavy) ion collisions are important for study of deconfinement state of strongly interacting matter – strong-coupling quark-gluon plasma (sQGP). Furthermore the study of energy dependence of femtoscopic observables can be useful for understanding in detail the transition from sQGP produced at higher energies to confined hadronic resonance matter created in final state at lower energies. HBT analysis allows studying dynamic features of interaction process at late, i.e. soft, stage of space-time evolution of multiparticle final state. Therefore the study of nucleus-nucleus collisions in wide energy domain by correlation femtoscopy seems important for better understanding both the equation of state (EOS) of strongly interacting matter and general dynamic features of soft processes.
The paper is organized as follows. In Sec. II, definitions of main observables for correlation femtoscopy are briefly described. The Sec. III devotes discussion of experimental energy dependence for space-time extent of source of charged pions and corresponding fits. Also estimations for femtoscopic observables are shown for the LHC and the Future Circular Collider (FCC) project energies. Some final remarks and conclusions are presented in Sec. IV.
II Method and variables
In general phenomenological parameterization of correlation function (CF) for two identical particles with 4-momenta and with taking into account different forms of corrections on Coulomb final state interaction (FSI) can be written as follows Okorokov-arXiv-1312.4269 :
| (1) |
where corresponds to the standard Coulomb correction, – the dilution procedure and – the Bowler–Sinyukov correction, is the relative 4-momentum, – the average 4-momentum of particles in pair (pair 4-momentum), for standard simplest (Gaussian) case
| (2) |
Here and are the matrices , – transposed vector , , where are parameters characterized the linear scales of homogeneity region Sinyukov-NATOSeries-346-309-1995 ; the products are taken on space components of vectors, is the parameter which characterizes the degree of source chaoticity. Taking into account the hypothesis of cylindrical symmetry of source the volume of homogeneity region is derived as follows Okorokov-ISHEPP-101-2006
| (3) |
The space component of pair 4-momentum () is decomposed on longitudinal and transverse parts of pair momentum. In the paper the decomposition of Pratt – Bertsch Pratt-PRD-33-1314-1986 ; Bertsch-PRC-37-1896-1988 is used for as well as the longitudinal co-moving system (LCMS) frame. The radius contains additional contribution from the temporal extent of the source. Therefore this parameter is usually excluded from calculation of and the volume of source can be written as follows
| (4) |
As seen , where denotes the source volume calculated from eq. (3) and the volume of emission region defined in accordance with eq. (4) is designated by . But it should be emphasized that in the limit for absolute value of transverse pair momentum vector , no transverse vector allows to distinguish between out- and side-components Wiedemann-PR-319-145-1999 ; Okorokov-UchPosob-2009 . This implies that . Consequently, it is expected for particles with low and both the relations (3) and (4) for freeze-out volume are valid for such particles.
The one of the important additional observables is the following difference Wiedemann-PR-319-145-1999 ; Okorokov-UchPosob-2009
| (5) |
If the emission function features no position-momentum correlation, then is finite at non-zero only due to explicit -dependence (resulting from the mass-shell constraint ) Wiedemann-PR-319-145-1999 . In this case
| (6) |
where is the transverse velocity of pair of particles with mass , , – the emission duration for the particle type under discussion. It should be stressed the last relation is valid in some specific cases 1D hydrodynamics while is violated in both the cascade approaches and multidimensional hydrodynamic models. Thus in the framework of some assumptions the gives direct access to the emission duration of the source and allows to partially disentangle the spatial and temporal information contained in radii parameters Wiedemann-PR-319-145-1999 . The sensitivity to the is the main advantage of the observable (5).
In the paper the following set of main femtoscopic observables is under consideration as well as the set of some important additional observables which can be calculated with help of HBT radii . The set of parameters characterizes the chaoticity of source and its 4-dimensional geometry at freeze-out stage completely. Scaled femtoscopic parameters , , and are calculated as follows Okorokov-arXiv-1312.4269 :
| (7) |
Here is radius and volume of spherically-symmetric nucleus, fm Valentin-book-1982 ; Mukhin-book-1983 . The change is made in the relation (7) in the case of non-symmetric nucleus-nucleus collisions Okorokov-arXiv-1312.4269 . One needs to emphasize the most central collisions are usually used for study the space-time characteristics of final-state matter, in particular, for discussion of global energy dependence of femtoscopic observables (see below Sec. 3). Thus the using of radius of all the nucleus in (7) seems reasonable. In general case the scale factor in (7) for calculation of normalized femtoscopic radii, and volume should takes into account the centrality of nucleus-nucleus collisions. The normalization procedure suggested in Okorokov-arXiv-1312.4269 allows to consider two data samples, namely, (i) only (quasi)symmetric heavy ion collisions and (ii) all available data for nucleus-nucleus collisions. Ensemble of experimental data reviewed in Okorokov-arXiv-1312.4269 with replacement of Au+Au points at GeV by the recent STAR results of high-statistics analysis for Au+Au collisions at and 200 GeV STAR-arXiv-1403.4972 is used in the present study. It should be noted that estimation based on Aamodt-PLB-696-328-2011 is used for at TeV here as well as in the previous analysis Okorokov-arXiv-1312.4269 . But recent study at the LHC energy Abelev-PRC-89-024911-2014 obtains slightly larger value of chaoticity () for two-pion correlations in kinematic domain under study. The change of the value in TeV-region of collision energies can influence on general trend and quantitative results discussed below for this femtoscopic parameter. Therefore this discrepancy should be investigated additionally. Such study is in the progress.
III Energy dependence of space-time extent of pion source
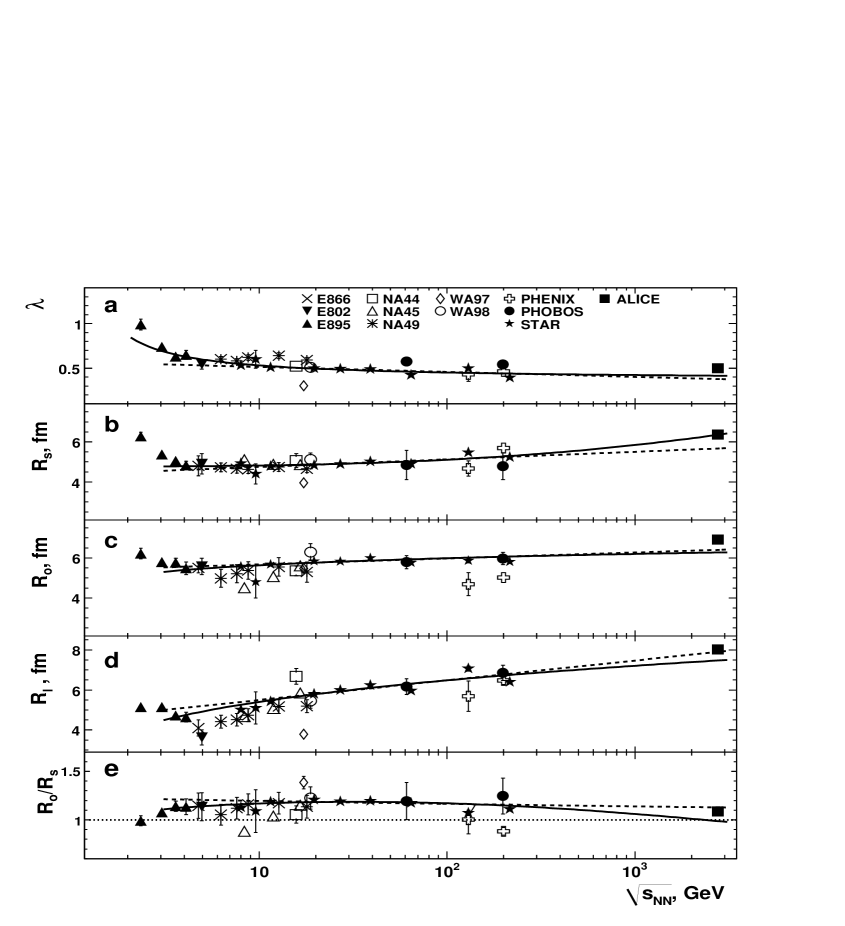
Dependencies of femtoscopic parameters , and are shown in Figs. 1a – d and Fig. 1e respectively. It should be stressed that the STAR results considered here were obtained for fit function (2) with taking into account two additional cross-terms for and as well as with improved Coulomb correction . The two sets of STAR results for are in a good agreement for previously study Okorokov-arXiv-1312.4269 and for present analysis for most femtoscopic parameters under consideration in Fig. 1. The some decreasing is seen for and transverse radii for Au+Au collisions at GeV with respect to the earlier STAR results from Okorokov-PRC-71-044906-2005 . The new results from STAR-arXiv-1403.4972 agree better with both the general trends and the results of other experiments (PHENIX and PHOBOS) at top RHIC energy GeV. The chaoticity parameter decreases with increasing relatively fast at lower (AGS) energies and shows the weak changing at GeV (Fig. 1a). Femtoscopic radii of source in transverse plane with respect to the beam direction, (Fig. 1b) and (Fig. 1c), show little change over a wide range of energy GeV which corresponds to highest AGS – SPS – RHIC beam collision energies. On the other hand, the value of source size in longitudinal direction, (Fig. 1d), appears to reach a minimum around GeV, rising in energy domain available at RHIC. As seen there is increasing of HBT radii (Figs. 1b – d) at growth of collision energy from GeV up to maximum available LHC energy TeV. The significant increasing of HBT radii is seen for much broader energy range (on about two order of magnitude TeV) only than it was expected early at the beginning of RHIC operation. Therefore the space-time extent of emission region at freeze-out changes slowly at increasing of collision energy. The transverse radius reflects the spatial extent of particle source, whereas is also affected by dynamics Retiere-PRC-70-044907-2004 ; Mount-PRC-84-014908-2011 and is believed to be related to the duration of particle emission Bertsch-NPA-498-173c-1989 . As indicated, for example, in STAR-arXiv-1403.4972 , the ratio was predicted to increase with beam energy by hydrodynamical calculations and might shows an significant enhancement if the life-time of the collision evolution (and, within these models, the duration of particle emission as a result) was to be extended by entrance into a different phase Bertsch-NPA-498-173c-1989 . There is no significant increasing of ratio in all experimentally available energy domain (Fig. 1e). Recent developments, in particular in viscous hydrodynamics, allow to get reasonable agreement between experimental and model values of at top RHIC energy and demonstrate that the behavior of experimental dependencies of on kinematic variables can be explained in particular by realistic EoS with crossover phase transition and sQGP at high temperatures Broniowski-PRL-101-022301-2008 ; Pratt-PRL-102-232301-2009 ; Karpenko-PLB-688-50-2010 ; Karpenko-PRC-81-054903-2010 ; Werner-PRC-82-044904-2010 ; Bozek-PRC-83-044910-2011 . Therefore the soft femtoscopic observables confirm the phase transition and creation of deconfinement state of strongly interacting matter in collider experiments.
Taking into account the view of experimental dependencies in Figs. 1a – d the following function is suggested
| (8) |
for smooth approximation of , , where , GeV2. Also the specific case of (8) at is under consideration. As seen from Figs. 1b – d there is indication on change of behavior of energy dependence (inflection point) for at GeV. This inflection point is seen most clear for (Fig. 1d). Therefore the fit function (8) is used for approximation of the energy dependence of HBT radii in the energy domain GeV only. Experimental energy dependence of is fitted by general function (8) at all available energies. As seen the point from the WA97 experiment Antinori-JPGNPP-27-2325-2001 differs significantly from other results at close energies for (Fig. 1a) and longitudinal radius (Fig. 1d). Thus for these parameters fits are made for data sample (i) with exception of the point from Antinori-JPGNPP-27-2325-2001 . For each main HBT parameters fits are made for both the statistical and total errors, where total errors of experimental points include available clear indicated systematic errors added in quadrature to statistical ones. The numerical values of fit parameters are presented in Table 1, where the second line for each HBT parameter corresponds to the approximation by specific case of (8). Fit curves are shown in Fig. 1 by solid lines for (8) and by dashed lines for specific case of fit function at with taking into account the statistical errors. In general fit function described above agrees reasonably with experimental dependence , (Fig. 1a – d). But the fit qualities are poor for all the main HBT parameters, especially for , with statistical errors taken into account (Table 1). Spread of experimental points leads to the statistically unacceptable values of In the case of inclusion of estimation for systematic uncertainty for Pb+Pb collisions at TeV leads to both the dramatic growth of and improvement of the fit quality at transition from statistical errors of experimental points to total errors in data sample (i) (Table 1). Inclusion of total errors allows to get a statistically acceptable fit qualities for HBT radii for both the function (8) and its specific case. It seems more complex fit function should be used in order to describe energy dependence of HBT radii at all available collision energies. This study is in the progress. Taking into account the similar behavior of the energy dependence of HBT radii (Figs. 2b – d) and elliptic flow Okorokov-SPMP-201-2008 at qualitative level the following functional form can be suggested as first approach for description of , in all experimentally available energy domain. Smooth solid and dashed curves shown in Fig. 1e are calculated for the ratio from the fit results for and (Table 1). As seen these curves agree with experimental points reasonably at GeV. In general fits by the function (8) at free and fixed show close behavior for all the main HBT parameters from with some differences at intermediate ( GeV) and high ( GeV) energies. These differences result in more significant discrepancy between fit curves for (Fig. 2e) and for other parameters from the set (see below).
| HBT | Fit with statistical errors | Fit with total errors | ||||||
|---|---|---|---|---|---|---|---|---|
| parameter | ||||||||
| (fixed) | (fixed) | |||||||
| (fixed) | (fixed) | |||||||
| (fixed) | (fixed) | |||||||
| (fixed) | (fixed) | |||||||
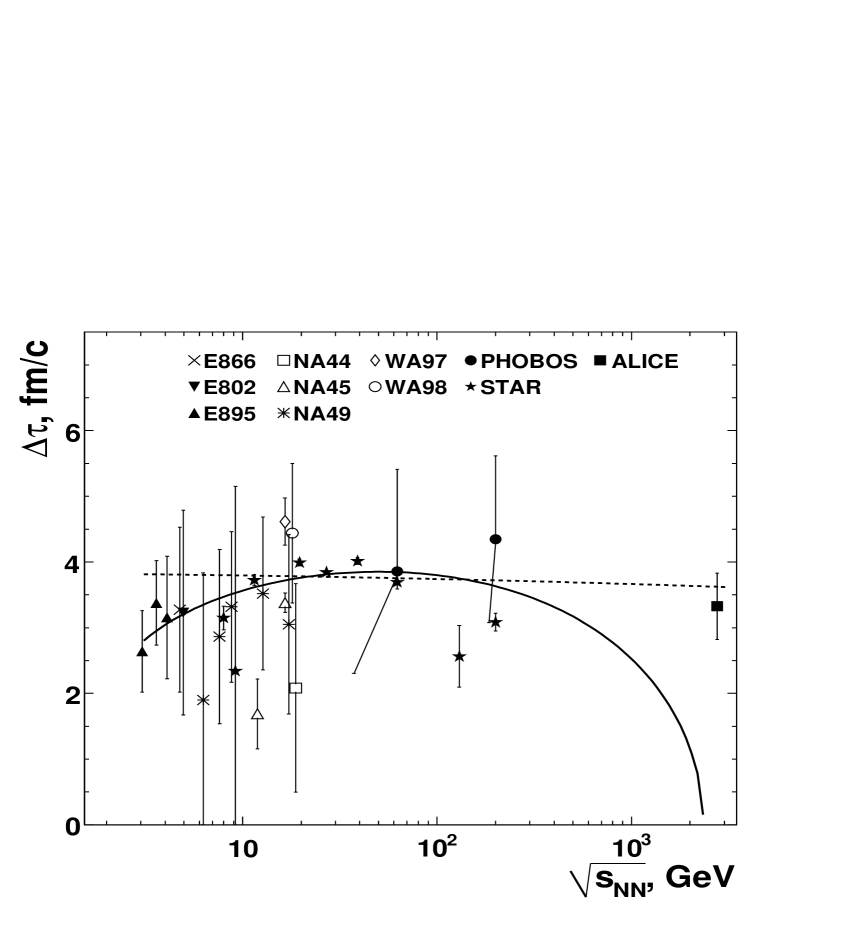
Fig. 2 demonstrates the energy dependence of for (quasi)symmetric heavy ion collisions. The emission duration in these collisions is calculated based on known HBT-radii (Figs. 1b – d), kinematic regime for pion pairs and on (6). The for pion pairs with GeV/. Value fm/ at GeV derived from the PHENIX results at this energy is not shown due to extremely large errors. As seen the emission duration for pions extracted from (5) is about fm/ for any energies under consideration. The visible energy dependence of emission duration is absent, is close to flat within large error bars. One can see more interesting behavior for this dependence for the STAR high-statistics data STAR-arXiv-1403.4972 only. But additional precise measurements are necessary in order to confirm the change of at GeV and locate the possible knee in the experimental dependence. Smooth solid and dashed curves shown in Fig. 2 are calculated for from the fit results for and (Table 1). It seems the function (8) at free agrees better with experimental points at GeV than that at fixed . But large error bars do not allow to choice preferable curve unambiguously. Moreover the general function (8) underestimates in TeV-region significantly.
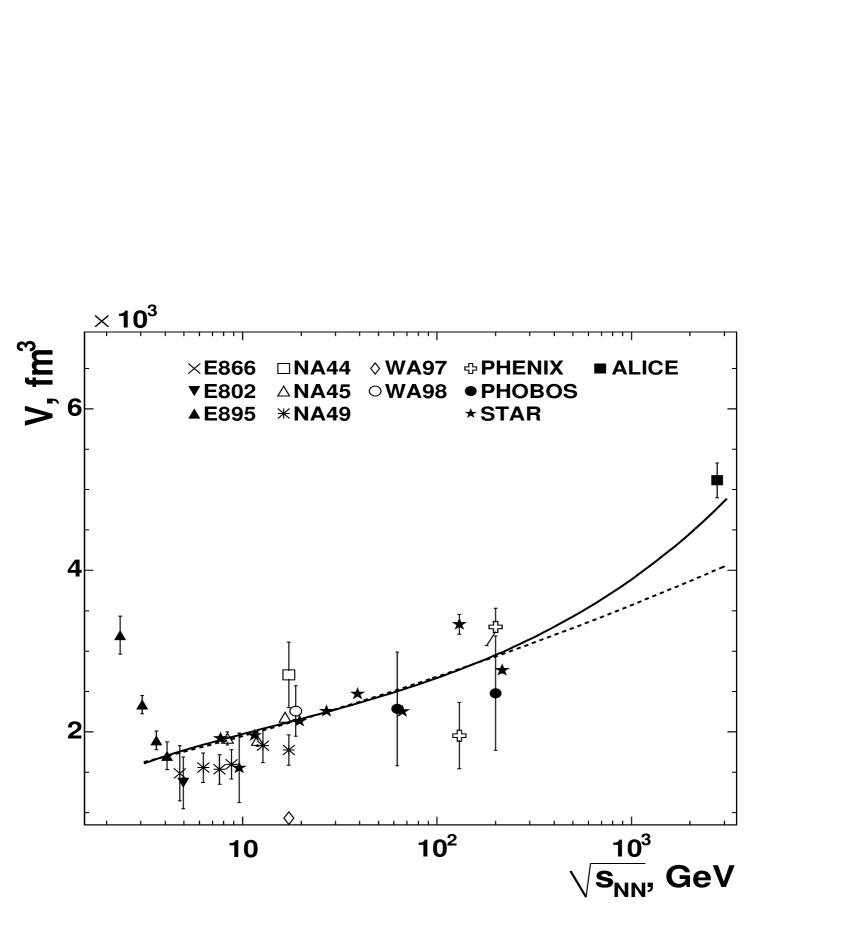
Volume of the homogeneity region in various heavy ion collisions is calculated based on known HBT-radii which are shown in Figs. 1b – d. Both the equations (3) and (4) are used for verification and increasing of reliability of results. The first approach is the same as in the previous study Okorokov-arXiv-1312.4269 . As expected the values of are similar for both the equations (3) and (4) that confirms the validity of the results from Okorokov-arXiv-1312.4269 . The energy dependence of estimations (4) for volume of emission region is shown in Fig. 3. It would be emphasized that values of calculated at and 200 GeV from the recent STAR high-statistics results STAR-arXiv-1403.4972 agree better, especially at top RHIC energy, with results of other experiments (PHENIX and PHOBOS) than that in earlier study Okorokov-arXiv-1312.4269 . The values of which are derived here from the STAR results obtained in the framework of the phase-I beam energy program (BES) at RHIC in energy domain GeV form the trend lies some higher than most of the results from AGS and SPS. But on the other hand the spread of results at GeV is within total errors if systematic uncertainties will be taken into account also. The values of from the STAR results at energies GeV STAR-arXiv-1403.4972 agree noticeably better with AGS and SPS results (Fig. 3) than that for . Results for volume at GeV which are derived from the STAR high-statistics data STAR-arXiv-1403.4972 based on (3) as well as on (4) agree better with (quasi)linear growth with from GeV up to highest RHIC energy than that the earlier data at close energies. Smooth solid and dashed curves shown in Fig. 3 are calculated for from equation (4) and the fit results for , (Table 1). Both the curves are very close at GeV but function (8) at underestimates in TeV-region significantly. Therefore the general function (8) is the preferable approximation of the experimental at GeV.
Predictions for values of the femtoscopic observables from sets , are obtained for heavy-ion mode energies of the LHC and the FCC project based on the fit results for the main HBT parameters. Estimations are shown in Table 2 for fits with inclusion of statistical errors, the second line for each collision energy corresponds to the using of the specific case of (8), the volume of homogeneity region is estimated with help of (4). Large uncertainties obtained for estimations based on the function (8) do not allow to distinguish predictions from (8) with free and with fixed . One can expect the volume of homogeneity region fm3 at TeV (LHC) and fm3 at TeV (FCC) based on the reasonable agreement between experimental data and solid curve at Fig. 3.
| , | HBT parameter | ||||||
|---|---|---|---|---|---|---|---|
| TeV | , fm | , fm | , fm | , fm/ | , fm3 | ||
| 5.52 | – | ||||||
| 39.0 | – | ||||||
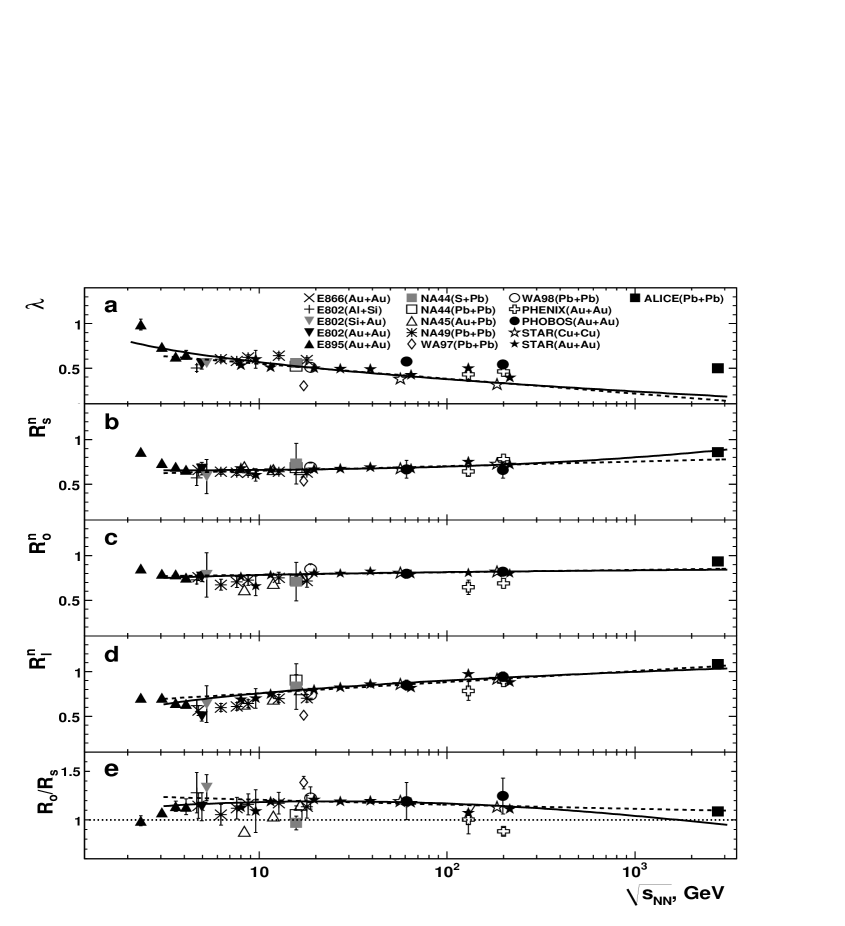
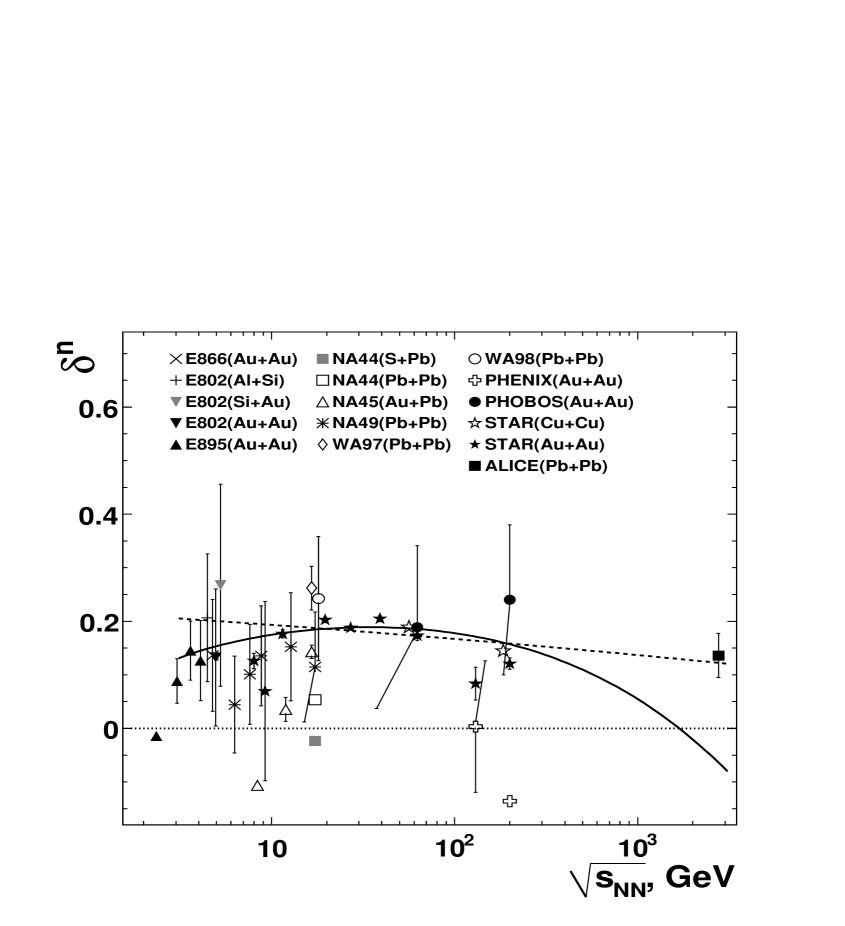
Fig. 4 shows the energy dependence of (a), scaled HBT-radii (b – d) and ratio (e) for both the symmetric and non-symmetric collisions of various nuclei. Fits of experimental dependencies for the data sample (ii) are made by (8) in the same energy domains and with the same error types as well as for the data sample (i) above. It seems the value from the WA97 experiment Antinori-JPGNPP-27-2325-2001 can not be excluded from the data sample (ii) because there are the STAR results for Cu+Cu collisions also (Fig. 4a). There are no physics reasons in order to exclude the points of these experiments from the fitted data sample (ii) in the case of all available nucleus-nucleus collisions. Furthermore the scaled value of longitudinal radius from Antinori-JPGNPP-27-2325-2001 agrees better with results of other experiments at close energies (Fig. 4d) than that for the data sample (i). Therefore there is no exception of any experimental point from fitted ensemble for any HBT observable in Fig. 4 in contrast with the fitting procedure for the data sample (i). The numerical values of fit parameters are presented in Table 3, where the second line for and each normalized HBT radius corresponds to the approximation by specific case of (8). Fit curves are shown in Fig. 4 by solid lines for (8) and by dashed lines for specific case of fit function at with taking into account statistical errors. Fit qualities are improved for in the case of total errors of experimental point and for at any error types of experimental point with respect to the corresponding fit results for the data sample (i) shown in Table 1. There is dramatic growth of values for fits of data (Fig. 4a) despite of qualitative agreement between smooth approximations and experimental values for range GeV. The fit by (8) at underestimates the value at the LHC energy TeV significantly. The values for asymmetric nucleus-nucleus collisions at intermediate energies GeV agree well with values of in symmetric heavy ion collisions at close energies. On the other hand the for Cu+Cu collisions is smaller systematically than in Au+Au collisions in energy range GeV (Fig. 4a). New experimental data are important for verification of the suggestion of separate dependencies for moderate and heavy ion collisions. Also the development of some approach is required in order to account for type of colliding beams in the case of parameter and improve quality of smooth approximation. In this case significant growth of as well as improvement of the fit quality at transition from statistical errors of experimental points to total errors in the data sample (ii) (Table 3) is dominated by inclusion of estimations for systematic uncertainties for Cu+Cu collisions and / or Pb+Pb ones at TeV. Smooth curves for normalized HBT radii and ratio are in reasonable agreement with experimental dependencies in fitted domain of collision energies GeV (Figs. 4b – e). Parameter values obtained for fit of with total uncertainties by (8) at are equal within errors with results from Alexander-JPGNPP-40-125101-2013 accounting for that experimental results studied here are obtained at . Dramatic improvement of the fit qualities for scaled HBT radii at transition from the data sample (ii) with statistical errors to the data sample with total errors (Table 3) is dominated mostly by the uncertainty in leads to additional errors due to scaling (7). At the same time inclusion of total uncertainties for Au+Au collisions at GeV results in significant decreasing of parameter in the case of scaled radius.
| HBT | Fit with statistical errors | Fit with total errors | ||||||
|---|---|---|---|---|---|---|---|---|
| parameter | ||||||||
| (fixed) | (fixed) | |||||||
| (fixed) | (fixed) | |||||||
| (fixed) | (fixed) | |||||||
| (fixed) | (fixed) | |||||||
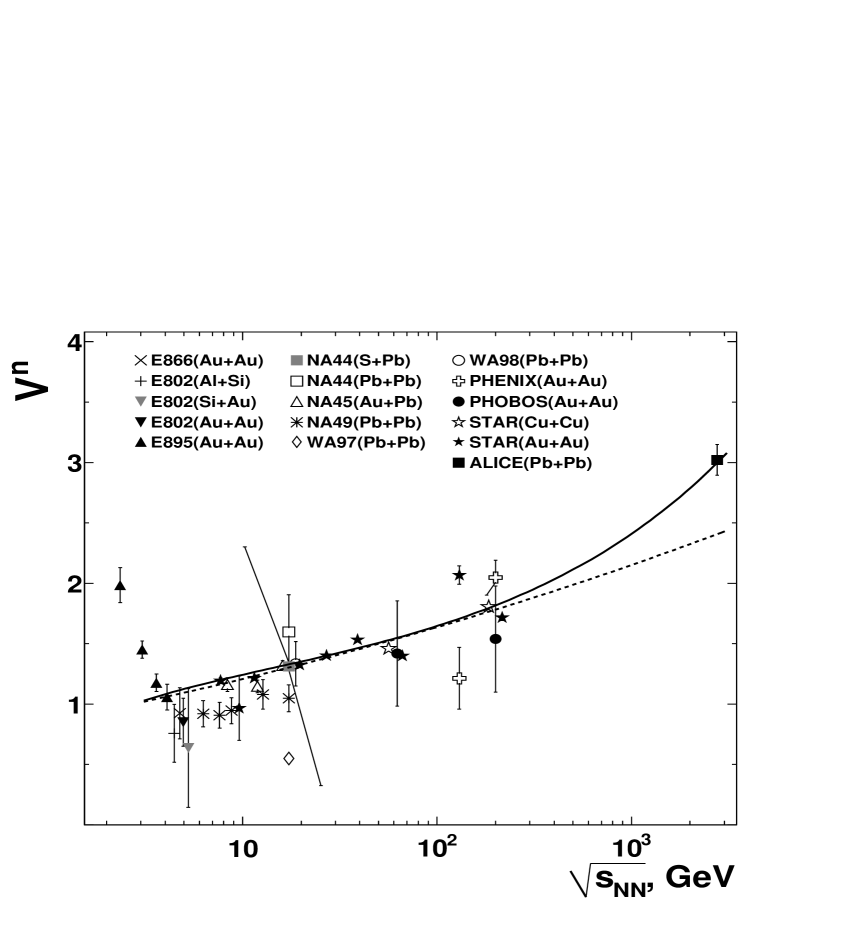
The corresponding dependencies for and are demonstrated in Fig. 5 and Fig. 6, respectively. The definition (4) for source volume is used in Fig. 6 as well as in Fig. 3 above. As well as in Okorokov-arXiv-1312.4269 results for pairs are shown in Figs. 4 – 6 also because femtoscopy parameters from the set depend on sign of electrical charge of secondary pions weakly. The relation is observed for of points in Fig. 5. In general the can be possible in the model of opaque source with surface dominated emission Heiselberg-EPJC-1-593-1998 ; McLerran-arXiv-nucl-th-0205028 . But possibly results should be similar for both the same ion beams and close kinematic regimes in various experiments. Therefore additional study is required in order to distinguish the physical and technique sources of negative values of the in Fig. 5 and to get a more definite explanation. The dependence is almost flat within large error bars in all energy domain under consideration. Taking into account the STAR high-statistics results STAR-arXiv-1403.4972 only one can see the indication on change of behavior of inside the range of collision energy GeV. This observation is in agreement with features of behavior of emission duration dependence on (Fig. 2) discussed above. The estimation of energy range agrees well with results of several studies STAR-arXiv-1403.4972 ; STAR-PRC-88-014902-2013 ; STAR-PRL-110-142301-2013 ; STAR-PRL-112-032302-2014 ; STAR-PRL-112-162301-2014 ; STAR-PRL-113-092301-2014 ; STAR-PRL-113-052302-2014 in the framework of the phase-I of BES program at RHIC which indicate on the transition from dominance of quark-gluon degrees of freedom to hadronic matter at GeV. But future precise measurements are crucially important for extraction of more definite physics conclusions. Smooth solid and dashed curves shown in Fig. 5 are calculated for from the fit results for and (Table 3). The situation is similar to that for : calculation based on the fit function (8) at free agrees reasonably with experimental points at GeV but underestimates in TeV-region significantly. The large errors in Fig. 6 for strongly asymmetric nuclear collisions is dominated by large difference of radii of colliding moderate and heavy nuclei and corresponding large uncertainty for . Smooth solid and dashed curves shown in Fig. 6 are calculated for from equation (4) and the fit results for , (Table 3). The fit results for normalized HBT radii obtained with general function (8) lead to very good agreement between smooth curve and experimental data in TeV-region in contrast with the curve obtained from corresponding fit results for (8) at .
Estimations for , , and normalized femtoscopic parameters at the LHC and the FCC energies are shown in Table 4 for fits of various nucleus-nucleus collisions with inclusion of statistical errors, the second line for each collision energy corresponds to the using of the specific case of (8) at , the volume of homogeneity region is estimated with help of (4). All the smooth approximations discussed above predict amplification of coherent pion emission with significant decreasing of . Uncertainties are large for estimations obtained on the basis of results of fits by function (8) at free . Thus values of femtoscopic observables in Table 4 are equal within errors for general and specific case of (8) at TeV (LHC) and TeV (FCC) as well as for estimations obtained on basis of the data sample (i) above.
| , | HBT parameter | ||||||
|---|---|---|---|---|---|---|---|
| TeV | |||||||
| 5.52 | |||||||
| 39.0 | |||||||
| – | |||||||
The energy dependencies for sets , of femtoscopic parameters with taking into account the scaling relation (7) and the high-statistics STAR data STAR-arXiv-1403.4972 demonstrate the reasonable agreement between values of parameters obtained for interactions of various ions (shown in Figs. 4 – 6). The observation confirms the suggestion Okorokov-arXiv-1312.4269 that normalized femtoscopic parameters allow to unite the study both the symmetric and asymmetric nucleus-nucleus collisions in the framework of united approach. This qualitative suggestion is confirmed indirectly by recent study of two-pion correlations in the collisions of the lightest nucleus (d) with heavy ion (Au) at RHIC. Estimations of space-time extent of the pion emission source in d+Au collisions at top RHIC energy PHENIX-arXiv-1404.5291 in dependence on kinematic observables (collision centrality, the mean transverse momentum for pion pairs) indicate similar patterns with corresponding dependencies in Au+Au collisions and indicate on similarity in expansion dynamics in collisions of various systems (d+Au and Au+Au at RHIC, p+Pb and Pb+Pb at LHC). The scaling results for some radii indicate that hydrodynamic-like collective expansion is driven by final-state rescattering effects PHENIX-arXiv-1404.5291 . On the other hand the normalized femtoscopic parameters allow to get the common kinematic dependencies only without any additional information about possible general dynamic features in different collisions. Thus the hypothesis discussed above is qualitative only. The future quantitative theoretical and phenomenological studies are essential for verification of general features of soft stage dynamics for different collisions at high energies.
IV Summary
The following conclusions can be obtained by summarizing of the basic results of the present study.
Energy dependence is investigated for range of all experimentally available initial energies and for estimations of the main femtoscopic parameters from set the ( and radii) derived in the framework of Gauss approach as well as for the set of important additional observables contains ratio of transverse radii, emission duration (or ) and HBT volume. There is no dramatic change of femtoscopic parameter values with increasing of in domain of collision energies GeV. The estimation of emission duration of pions is about fm/ for any energies under consideration. The energy dependence is almost flat for both the emission duration and the parameter within large error bars. The indication on possible curve knee at GeV obtained in the STAR high-statistics data agree with other results in the framework of the phase-I of the beam energy scan program at RHIC. But additional precise measurements are crucially important at various in order to confirm this feature in energy dependence of additional femtoscopic parameters ().
Analytic function is suggested for approximation of energy dependence of main HBT parameters. The fit curves demonstrate qualitative agreement with experimental data for at all available collision energies and for both the absolute and normalized HBT radii in energy domain GeV. Reasonable fit qualities are obtained for HBT radii at approximation of experimental points with total errors. Smooth curves calculated for energy dependence of the set of additional femtoscopic parameters agree reasonably with corresponding experimental data in the most cases. Estimations of femtoscopic observables are obtained on the basis of the fit results for energies of the LHC and the FCC project. For multi-TeV energy domain the emission region of pions will be characterized by decreased chaoticity parameter, linear sizes about fm in longitudinal direction and fm in transverse plane, volume of about fm3.
References
- (1) V. A. Okorokov, arXiv: 1312.4269 [nucl-ex]. 2013.
- (2) Yu. Sinyukov, In ”Hot hadronic matter: theory and experiment”. NATO ASI Series B346, 309 (1995). Plenum Publishing Corp., New York. Eds. J. Letessier, H. G. Gutbrod, J. Rafelski.
- (3) V. A. Okorokov, Strange particle femtoscopy in relativistic heavy ion collisions: experimental overview. Proceedings of the XVIII International Baldin Seminar on High Energy Physics Problems. Dubna. V. II, 2008. P. 101. Eds. by A.N. Sissakian, V.V. Burov, A.I. Malakhov.
- (4) S. Pratt, Phys. Rev. D33, 1314 (1986).
- (5) G. F. Bertsch, M. Gong, M. Tohyama, Phys. Rev. C37, 1896 (1988).
- (6) U. A. Wiedemann, U. Heinz, Phys. Rep. 319, 145 (1999).
- (7) V. A. Okorokov, E. V. Sandrakova, Fractals in fundamental physics. Fractal properties of multiparticle production and topology of sample. MEPhI, Moscow, 2009.
- (8) L. Valentin, Subatomic physics: nuclei and particles. V. I. Ermann, Paris, 1982.
- (9) K. N. Mukhin, Experimental nuclear physics. V. I. Energoatomizdat, Moscow, 1983.
- (10) L. Adamczyk et al., arXiv: 1403.4972 [nucl-ex]. 2014.
- (11) K. Aamodt et al., Phys. Lett. B696, 328 (2011).
- (12) B. Abelev et al., Phys. Rev. C89, 024911 (2014).
- (13) J. Adams et al., Phys. Rev. C71, 044906 (2005).
- (14) F. Retiére, M. A. Lisa, Phys. Rev. C70, 044907 (2007).
- (15) E. Mount et al., Phys. Rev. C84, 014908 (2011).
- (16) G. F. Bertsch, Nucl. Phys. A498, 173c (1989).
- (17) W. Broniowski, Phys. Rev. Lett. 101, 022301 (2008).
- (18) S. Pratt, Phys. Rev. Lett. 102, 232301 (2009).
- (19) Iu. A. Karpenko, Yu. M. Sinyukov, Phys. Lett. B688, 50 (2010).
- (20) Iu. A. Karpenko, Yu. M. Sinyukov, Phys. Rev. C81, 054903 (2010).
- (21) K. Werner et al., Phys. Rev. C82, 044904 (2010).
- (22) P. Bozek, Phys. Rev. C83, 044910 (2011).
- (23) F. Antinori et al., J. Phys. G: Nucl. Part. Phys. 27, 2325 (2001).
- (24) V. A. Okorokov, Azimuthal anisotropy and fundamental symmetries in QCD matter at RHIC. Proceedings of the XIII International Conference on Selected Problems of Modern Physics. Dubna. E1,2-2009-36, 2009. P. 201. Eds. B.M. Barbashov, S.M. Eliseev; arXiv: 0809.3130 [nucl-ex].
- (25) G. Alexander, I. Ben Mordechai, J. Phys. G: Nucl. Part. Phys. 40, 125101 (2013).
- (26) H. Heiselberg, A. P. Visher, Eur. Phys. J. C1, 593 (1998).
- (27) L. McLerran, S. S. Padula, arXiv: nucl-th/0205028. 2002.
- (28) L. Adamczyk et al., Phys. Rev. C88, 014902 (2013).
- (29) L. Adamczyk et al., Phys. Rev. Lett. 110, 142301 (2013).
- (30) L. Adamczyk et al., Phys. Rev. Lett. 112, 032302 (2014).
- (31) L. Adamczyk et al., Phys. Rev. Lett. 112, 162301 (2014).
- (32) L. Adamczyk et al., Phys. Rev. Lett. 113, 052302 (2014).
- (33) L. Adamczyk et al., Phys. Rev. Lett. 113, 092301 (2014).
- (34) A. Adare et al., arXiv: 1404.5291 [nucl-ex]. 2014.