Ion energy scaling under optimum conditions of laser plasma acceleration
Abstract
A new, maximum proton energy, , scaling law with the laser pulse energy, has been derived from the results of 3D particle-in-cell (PIC) simulations. Utilizing numerical modelling, protons are accelerated during interactions of the femtosecond relativistic laser pulses with the plain semi-transparent targets of optimum thickness [Esirkepov et al. Phys. Rev. Lett. 96, 105001 (2206)]. The scaling, , has been obtained for the wide range of laser energies, different spot sizes, and laser pulse durations. Our results show that the proper selection of foil target optimum thicknesses, results in a very promising increase of the ion energy with the laser intensity even in the range of parameters below the radiation pressure (light sail) regime. The proposed analytical model is consistent with numerical simulations.
Ion acceleration by intense ultra-short laser pulses has led to many original application such as: triggering of nuclear reactions bychenkov_99 ; labaune_13 ; research of warm dense matter warm_dense_matter ; laboratory astrophysics astrophysics ; radiography radiography_1 ; radiography_2 ; willingale_10 ; fast ignition roth_01 ; and, hadron therapy bulanov_02 . Both experiments exp_1 ; exp_2 and simulations sentoku_02 have demonstrated an increase of ion energy with a corresponding reduction of the target thickness. The high contrast pulses of modern lasers exp_1 ; exp_2 have enabled effective acceleration of ions from ultra-thin foils that are semi-transparent to laser light. In this regime, a high-intensity laser pulse expels electrons from the irradiated area of the foil in a forward direction that causes ion acceleration from the entire target volume through the mechanism combining elements of the Target Normal Sheath Acceleration (TNSA) mechanism and the Coulomb explosion, i.e. the directed Coulomb explosion bulanov_08 or alternatively interpreted as the ”break-out afterburner” BOA .
It is known that target thickness should be properly matched to the laser intensity esirkepov06 in order to obtain maximum ion energy. Although the optimum target thickness can be estimated in the order of magnitude from 2D PIC simulations esirkepov06 , the 3D PIC simulations are needed to correctly quantify target thickness for different laser intensities. The optimum target thickness was found in Ref. esirkepov06 , wherein the square root energy scaling for the proton energy with laser intensity (energy) was also inferred. The square root intensity scaling for the maximum proton energy is also predicted by the TNSA model, which is valid for thick targets fuchs06 . The 3D PIC simulations to find optimum target thickness for the laser pulse energy must also examine the dependence on different spot sizes and pulse durations. Such optimization should include a systematic study of laser light absorption (i.e. laser to electron energy conversion efficiency) in semi-transparent targets: a study that will form an important part of our paper. Our comprehensive study will quantify how all parameters of the pulse affect laser energy conversion to hot electrons and define the effectiveness of high-energy ion production. We will present the results of our 3D optimization study with PIC code Mandor mandor for acceleration of protons from thin targets triggered by femtosecond laser pulses. The main outcome of this paper is the dependence of maximum proton energies on the laser intensities under conditions of volumetric heating of optimum thickness targets.
We also propose a simple theoretical model that estimates maximum ion energy using the effective temperature of the laser heated electrons. Since the electric field that accelerates ions depends on the charge separation, the ratio of the Debye length of laser heated electrons to the foil thickness is the main controlling parameter of the theory. So far, only two asymptotic cases have been studied in detail: quasineutral expansion Mora_PRL_2003 and Coulomb explosion Kovalev_QE_2005 . None of these theories are fully applicable to thin semitransparent targets. We will show that our model, that is valid for arbitrary , qualitatively explains numerical simulations when the ponderomotive dependence wilks01 of the effective electron temperature on the absorbed laser energy is used.
It has been already shown that thin foils with optimum thicknesses are much better for proton acceleration. Making use of shorter laser pulses or tight laser focusing also results in some increase of proton energies humieres13 . Building on these results, we have performed 3D simulations of proton acceleration by ultrashort ( fs FWHM duration) tightly focused (FWHM of the laser spot ) laser pulses with the PIC code MANDOR mandor . As a reference we set the laser wavelength at m. Laser intensity is varied from to W/cm2, which corresponds to laser pulse energies from 0.03 J to 300 J. To examine pulse duration () and spot size () effects on ion acceleration, three additional sets of laser pulse parameters with the same full laser energy have been used: increased laser spot size, , and decreased one, , for fs and for the increased pulse duration, fs, for the hot spot size . A very tight laser pulse focusing to has been implemented by using the parabolic mirror simulation technique popov . For larger hot spots, Gaussian laser pulses have been used.
The laser pulse was focused on the front side of the thin CH2 plasma foils, that are composed of electrons, hydrogen ions, and fully ionized carbon ions (). The target has an electron density of (where is the plasma critical density), which corresponds to a solid mass density of CH2 ( g/cm3). The target thickness has been varied from nm to m.
We performed several runs with different target thicknesses that have been chosen according to the theoretically predicted optimum length, vshivkov , where . The results of the simulations for maximum proton energies are shown in the top panel of Fig. 1. They clearly confirm the existence of an optimum target thickness for which protons reach maximum energies.

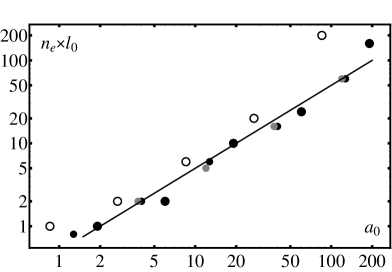
The optimum target thickness corresponding to the maximum of ion energies (Fig. 1, bottom panel) grows linearly with laser field amplitude, , where the numeric factor 0.5 is almost independent from the focal spot size and it is slightly above the theoretically predicted 1/ vshivkov . At the same time, this factor slightly increases with the laser pulse duration (see open circles in Fig. 1, bottom panel), i.e. the optimum regime of ion acceleration by the longer pulses requires thicker targets. The optimum target thickness corresponds to the partially transparent target vshivkov , when volumetrically heated electrons are swept out of the plasma in a forward direction and give rise to strong charge separation fields brantov13 , which accelerate ions by the directed Coulomb explosion bulanov_08 . The laser pulse can then expel a large number of hot electrons from the hot spot region and penetrate inside the target in a hole-boring like action. This is the reason why optimal target thickness is above theoretically predicted values and this is why longer laser pulses can penetrate through thicker targets.
Figure 2 shows the dependence of ion maximum energy on the laser pulse energy.
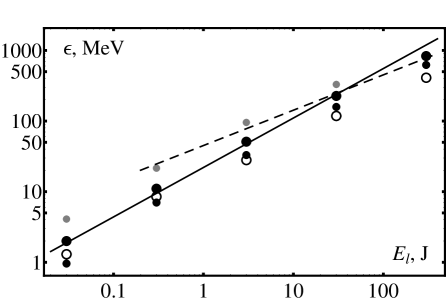
The results of our simulations for the maximum energy of the protons from the optimum thickness targets are well approximated by the scaling , which is different from the square root dependence reported earlier esirkepov06 . The numerical proportionality factor varies from for a long pulse (150 fs) and large focal spot diameter (), to for tight laser focusing into the focal spot of d=. Given laser energies the shorter laser pulse and tighter focusing gives higher maximum proton energy. The number of energetic protons also increases with the laser energy. Note that long pulses are more effective for proton acceleration if the laser energy is less than 1 J.
To better understand the proton energy scaling of Fig. 2, we have analyzed the laser energy absorption coefficient, , for semi-transparent targets. We define an absorption coefficient as the ratio of the particle kinetic energy to the initial laser energy. We found that for our parameters, the absorption coefficient of 30 fs pulse in the targets with optimum thickness increases with laser energy (see fig. 3) from values less than 10% for 0.03 J laser to 30 % for 30 J laser.
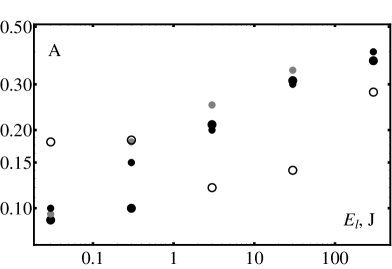
The absorption of longer laser pulses is better for small laser energies. It is also not a monotonic function of the pulse energy. It drops from 18% to 12% at 3 J laser pulse energy and then grows to for 300 J laser.
We will now demonstrate that the simple semi-analytic theory qualitatively agrees with our simulation results and captures the main elements of interaction physics and ion acceleration. Assume that ion plasma occupies the layer of the width along axis. The transversal size of the plasma is limited to the laser focal spot area, . For simplicity, we consider one ion species plasma where ions are initially at rest within . During subsequent ion outflow, electrons remain in equilibrium with the electrostatic field and are described by the Boltzmann distribution function with an effective temperature . The latter depends on laser intensity and can be time dependent due to adiabatic cooling after the pulse is terminated. Plasma expansion at will be symmetrical with respect to the plane . For small distances , where is the ion front position, three-dimensional effects due to transversal size of the plasma region can be neglected and outflow is treated as one-dimensional. Motion of ion plasma will be described by the following system of equations:
| (1) | ||||
where is defined by the initial electron density in the foil center , initial ion density , and charge . The parameter has a simple approximate dependence on the initial electron temperature Govras_JETPL_2013 . We have used the following dimensionless variables in the system of equations (1): spatial coordinate is measured in the unit of , time is normalized to and energies and are written in terms of . Thus far there are no analytic solutions for Eq. (1) at arbitrary . The only known solutions are for the case , i.e. for the quasineutral expansion, , Mora_PRL_2003 and for the case of , that is for the Coulomb explosion, Kovalev_QE_2005 . For the first case of the quasineutral expansion and electric field at the ion front is Mora_PRL_2003 , where =2.71828…. In the second limit of a Coulomb explosion, one finds and where is the front position of the expanding ion plasma Kovalev_QE_2005 .
To find an approximate solution of Eqns. (1) for the arbitrary ratio of we introduce the interpolating expression for that is valid for an arbitrary temperature . From the Poisson equation in Eq. (1) one obtains where we used . If we choose the expression for is satisfied and one obtains a correct asymptotics for both quasineutral outflow and for the Coulomb explosion regime. Solving Poisson equation in (1) with such an ion density, we obtain an implicit expression for the function :
| (2) |
Here . Note that Eq. (2) is simpler than that in Ref.Govras_JETPL_2013 and has no interpolation coefficient.
We assume that plasma electrons are heated during the laser pulse duration and reach the characteristic temperature . However, after that, , they adiabatically cool down as described in Kovalev_JETP_2002 . Temporal behaviour of electron temperature can be described as follows Kovalev_JETP_2002
| (3) |
where is the Heaviside step function and the characteristic cooling time is defined as . Where is the spatial scale of ion density and is the ion sound speed. We chose and as the typical parameters.
When ions reach the distance three-dimensional effects must be taken into account. For electric field decreases . Ensuring that the electric field satisfies two limits at the ion front, (2) for and for one may propose a smooth connecting expression valid for the front position at the arbitrary distance from the foil. In addition, a laser pulse introduces asymmetry into plasma expansion because all electrons are accelerated by the laser pulse in a forward direction on the rear side of the thin foil. We will assume that the electric field at is twice the value (2) defined above for the symmetric expansion of the hot plasma layer into a vacuum. Consequently, the electric field at the position of the ion front at the arbitrary time can be approximately written as follows:
| (4) |
where the time evolution of the electron temperature that contributes to (2) is given by the Eq. (3). Solving the equation of motion (1) for the ions at the front of the expanding plasma with the electric field (4) one obtains maximum ion energy .
To illustrate the results of our theoretical model we have plotted the maximum ion energy for the hydrogen foil as a function of the laser spot diameter (Fig. 4, top panel) and the pulse duration (Fig. 4, bottom panel).


We have assumed that the electron temperature obeys the ponderomotive scaling law wilks01 : , where is the laser amplitude, calculated using the absorbed fraction of laser intensity . The foil is assumed to be of an optimal thickness . Plots in Fig. 4 agree with simulations (c.f. Fig. 2) to the extent that for a given pulse energy, a defocussed laser light as well as a longer pulse duration lead to a maximum ion energy decrease.
In Fig. 5 we compare maximum energy of the protons for optimum target thicknesses from simulations (dots) and theory (lines).
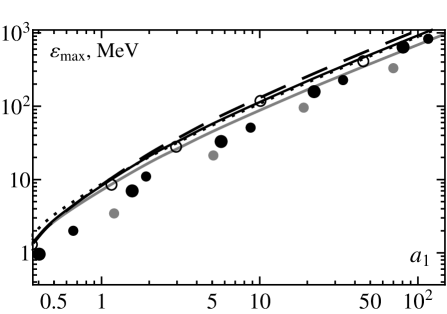
It is clearly seen that the theory correctly reproduces the dependence of the maximum proton energy on laser intensity. Since our theory considers single-ion-species (H) foil, the curves for analytical solutions in Fig 5 slightly overestimate simulation results (up to 30% for =30 fs). This is expected because carbon ions from CH2 foil are also accelerated thus making proton energy lower. Note that the apparent and very good agreement between theory and simulations for the long pulses (150 fs) is due to another limitation of the theoretical model that disregards the effect of the transversal (radial) electron current from the periphery of the focal spot to its centre. Such a flow of particles is able to provide more accelerated electrons on the rear side of the target for the long enough laser pulses. For , this effect may be significant. The velocity changes from to and the typical time of transversal electron motion, , will be in the order of a few tens of femtoseconds. Notwithstanding these approximations, Fig 5 demonstrates that overall, our simple theory correctly describes dependence of the maximum ion energy on laser and plasma parameters.
In summary, we have studied proton acceleration from ultra-thin targets with optimal thicknesses. For the first time, the absorption of laser light by semi-transparent plasma has been described. This permits an understanding of laser intensity dependence of maximum ion energy, for a wide range of laser energies (from 0.03 J to 300 J). A simple analytic theory has been proposed for the wide range of laser parameters. It agrees well with our simulation results. Both analytical and numerical predictions are quite optimistic about the ion energy gain even for laser intensities below the range required for radiation pressure (light sail) regime. In general, experiments show that ion energy increases slower with laser intensity as compared to scaling predictions. We believe that the systematic experimental study with targets of optimum thicknesses and high contrast laser pulses should confirm the theoretical predictions of our paper.
This work was supported by the Russian Foundation for Basic Research (Grants Nos. 14-02-31407-mol_a, 13-02-00426-a, 12-02-00231-a). Research of WR was partially supported by the Natural Sciences and Engineering Research Council of Canada.
References
- (1) V.Yu. Bychenkov, V.T. Tikhonchuk, and S.V. Tolokonnikov, JETP 88, 1137 (1999).
- (2) C. Labaune, S. Depierreux, C. Goyon, G. Loisel, V. Yahia, and J. Rafelski, Nature Comm. 4, 2506 (2013).
- (3) P. K. Patel, A. J. Mackinnon, M. H. Key, T. E. Cowan, M. E. Foord, M. Allen, D. F. Price, H. Ruhl, P.T. Springer, and R. Stephens, Phys. Rev. Lett. 91, 125004 (2003).
- (4) H.-S. Park, D. D. Ryutov, J. S. Ross, N. L. Kugland, S. H. Glenzer, C. Plechaty, S. M. Pollaine, B. A. Remington, A. Spitkovsky, L. Gargate, G. Gregori, A. Bell, C. Murphy, Y. Sakawa, Y. Kuramitsu, T. Morita, H. Takabe, D. H. Froula, G. Fiksel, F. Miniati, M. Koenig, A. Ravasio, A. Pelka, E. Liang, N. Woolsey, C. C. Kuranz, R. P. Drake, and M. J. Grosskopf, High Energy Density Phys. 8, 38 (2012).
- (5) M. Borghesi, A. Schiavi, D.H. Campbell, M.G. Haines, O. Willi, A.J. MacKinnon, L.A. Gizzi, M. Galimberti, R.J. Clarke and H. Ruhl, Plasma Phys. Control. Fusion 43, A267 (2001).
- (6) J. A. Cobble, R. P. Johnson, T. E. Cowan, N. Renard-Le Galloudec, and M. Allen, J. Appl. Phys. 92, 1775 (2002).
- (7) L. Willingale, P. M. Nilson, M. C. Kaluza, A. E. Dangor, R. G. Evans, P. Fernandes, M. G. Haines, C. Kamperidis, R. J. Kingham, C. P. Ridgers, M. Sherlock, A. G. R. Thomas, M. S. Wei, Z. Najmudin, K. Krushelnick, S. Bandyopadhyay, M. Notley, S. Minardi, M. Tatarakis, W. Rozmus, Phys. Plasmas 17, 043104 (2010).
- (8) M. Roth, T. E. Cowan, M. H. Key et al., Phys. Rev. Lett. 86, 436 (2001).
- (9) S. V. Bulanov and V. S. Khoroshkov, Plasma Phys. Rep. 28, 453 (2002).
- (10) A. Henig, S. Steinke, M. Schnurer, T. Sokollik, R. Horlein, D. Kiefer, D. Jung, J. Schreiber, B. M. Hegelich, X. Q. Yan, J. Meyer-ter-Vehn, T. Tajima, P.V. Nickles, W. Sandner, and D. Habs, Phys. Rev. Lett. 103, 245003 (2009);
- (11) F. Dollar, T. Matsuoka, G. M. Petrov, A. G. R. Thomas, S. S. Bulanov, V. Chvykov, J. Davis, G. Kalinchenko, C. McGuffey, L. Willingale, V. Yanovsky, A. Maksimchuk, and K. Krushelnick, Phys. Rev. Lett. 107, 065003 (2011).
- (12) Y. Sentoku, V. Yu. Bychenkov, K. Flippo, et al., Appl. Phys. B 74, 207 (2002).
- (13) S. S. Bulanov, A. Brantov, V. Yu. Bychenkov et al., Phys. Rev. E 78, 026412 (2008)
- (14) L. Yin, B. J. Albright, B. M. Hegelich, K. J. Bowers, K. A. Flippo, T. J. T. Kwan, and J. C. Fernandez, Phys. Plasmas 14, 056706 (2007).
- (15) T. Z. Esirkepov, M. Yamagiwa, and T. Tajima, Phys. Rev. Lett. 96, 105001 (2006).
- (16) J. Fuchs, P. Antici, E. d’Humieres, et al. Nature Phys. 2, 48 (2006).
- (17) P. Mora, Phys. Rev. Lett. 90, 185002 (2003).
- (18) V. Yu. Bychenkov and V. F. Kovalev, Quantum Electron. 35, 1143 (2005).
- (19) E. d’Humieres, A. V. Brantov, V. Yu. Bychenkov, V. Tikhonchuk, Phys. Plasmas (2013).
- (20) D. V. Romanov, V. Yu. Bychenkov, W. Rozmus, et al. Phys. Rev. Lett. 93, 215004 (2004).
- (21) K. I. Popov, V. Yu. Bychenkov, W. Rozmus, and R. D. Sydora, Phys. Plasmas 15, 013108 (2008).
- (22) V. A. Vshivkov, N. M. Naumova, F. Pegoraro, S. V. Bulanov, Phys. Plasmas 5, 2727 (1998).
- (23) A. V. Brantov, V. Yu. Bychenkov, Contrib. Plasma Phys. 53, 731 (2013)
- (24) E. A. Govras and V. Yu. Bychenkov, JETP Lett. 98, 70 (2013).
- (25) V. F. Kovalev, V. Yu. Bychenkov and V. T. Tikhonchuk, JETP 95, 226 (2002).
- (26) S.C. Wilks, A.B. Langdon, T.E. Cowan et al., Phys. Plasmas 8, 542 (2001).