On the Fe K absorption - accretion state connection in the Galactic center neutron star X-ray binary AX J1745.6-2901
Abstract
AX J1745.6-2901 is a high-inclination (eclipsing) neutron star Low Mass X-ray Binary (LMXB) located less than arcmin from Sgr A⋆. Ongoing monitoring campaigns have targeted Sgr A⋆ frequently and these observations also cover AX J1745.6-2901. We present here an X-ray analysis of AX J1745.6-2901 using a large dataset of 38 XMM-Newton observations, including eleven which caught AX J1745.6-2901 in outburst. Fe K absorption is clearly seen when AX J1745.6-2901 is in the soft state, but disappears during the hard state. The variability of these absorption features does not appear to be due to changes in the ionizing continuum. The small K/K ratio of the equivalent widths of the Fe xxv and Fe xxvi lines suggests that the column densities and turbulent velocities of the absorbing ionised plasma are in excess of cm-2 and km s-1. These findings strongly support a connection between the wind (Fe K absorber) and the accretion state of the binary. These results reveal strong similarities between AX J1745.6-2901 and the eclipsing neutron star LMXB, EXO 0748-676, as well as with high-inclination black hole binaries, where winds (traced by the same Fe K absorption features) are observed only during the accretion-disc-dominated soft states, and disappear during the hard states characterised by jet emission.
keywords:
Neutron star physics, X-rays: binaries, absorption lines, accretion, accretion discs, methods: observational, techniques: spectroscopic1 Introduction
Equatorial accretion disc winds have recently been demonstrated to be an ubiquitous feature of accreting black holes (Ponti et al. 2012). Such winds have almost always been observed during the soft state and typically disappear during the canonical hard state (Neilsen & Lee 2009; Ponti et al. 2012; Miller et al. 2012). The estimated wind mass outflow rates (Lee et al. 2002; Ueda et al. 2004; Miller et al. 2006; Neilsen et al. 2011; Ponti et al. 2012; King et al. 2012) and their tight connection with the accretion state suggest that winds are a fundamental component of the accretion process in black hole binaries.
Accreting Neutron Stars (NS) are also known to have equatorial absorbers and winds (Ueda et al. 2001; Sidoli et al. 2001; Parmar et al. 2002; Boirin et al. 2003; 2004; 2005; Diaz-Trigo et al. 2006; 2013, but see also Miller et al. 2011) however a one-to-one connection between the wind and accretion state has still to be established. A recent study focused on the absorption properties of the neutron star low-mass X-ray binary EXO 0748-676 (Ponti et al. 2014). This source has been continuously in outburst for 23 years (it was discovered in 1985 and it returned to quiescence in 2008; Parmar et al. 1985; Wolff et al. 2008; Hynes & Jones 2008). As characteristic of the high-inclination sources, EXO 0748-676 shows dips and eclipses. An inclination of was estimated (Parmar et al. 1985; 1986) for a primary mass of M⊙, which is consistent with dynamical estimates (Muñoz-Darias et al. 2011; Ratti et al. 2012). No Fe K absorption lines are detected during the more than 20 XMM-Newton observations which catch EXO 0748-676 in the hard state. Nonetheless, intense Fe xxiii, Fe xxv and Fe xxvi absorption lines are clearly observed in the single XMM-Newton observation where EXO 0748-676 is seen in the soft state (Ponti et al. 2014). This suggests that the wind–accretion state connection might also be present in some accreting neutron star binaries. To further test this hypothesis, we analyse the XMM-Newton and Swift observations (as well as NuSTAR data to constrain the broad band Spectral Energy Distribution; SED) of another well known high-inclination (dipping and eclipsing) accreting neutron star, AX J1745.6-2901.
At less than 1.5 arcminutes from Sgr A⋆, AX J1745.6-2901 lies within one of the most intensely observed patches of the X-ray sky. AX J1745.6-2901 was identified as a new transient X-ray burster near the Galactic center in 1993–1994 and 1997 ASCA observations (Maeda et al. 1996; Kennea et al. 1996; Sakano et al. 2002). Intensity dips with a period of hours were identified, indicating the high-inclination of the source. Excess soft X-rays during the dips are attributed to scattering by interstellar dust (Maeda et al. 1996).
Muno et al. (2003) catalogued a faint ( erg s-1, for an 8 kpc distance) Chandra X-ray source, CXOGC J174535.6-290133, confirmed to be the quiescent X-ray counterpart of AX J1745.6-2901 (Heinke et al. 2008). New transient outbursts were seen by Swift, INTEGRAL, XMM-Newton, Chandra and Suzaku in early 2006 (Kennea et al. 2006; Chenevez et al. 2006), in 2007–2008 (Wijnands et al. 2007; Porquet et al. 2007; Degenaar et al. 2009; Hyodo et al. 2009; Degenaar et al. 2010a), in 2010 (Degenaar 2010b), and 2013-2014 (Degenaar et al. 2013a; 2014a). The 2006 and 2010 outbursts were short (4 and 4–7 months respectively111The end date of the 2010 outburst is uncertain as it occured when AX J1745.6-2901 was too close to the Sun to be monitored by Swift or any other X-ray telescope.) and low luminosity (peak erg s-1), while the 2007–2008 and 2013–2014 outbursts were longer (1.5–1.7 years, and 1 year to date) and of higher luminosity (peak erg s-1 for both; Degenaar et al. 2010a; 2014a).
As observed in many other high-inclination systems (e.g. Boirin et al. 2004; Diaz-Trigo et al. 2006; 2013), AX J1745.6-2901 shows eclipses, dips, and Fe K absorption (both Fe xxv and Fe xxvi K and K absorption; Hyodo et al. 2009). The observed equivalent widths of these absorption lines range from 30 to 60 eV, and the lines are observed during all orbital phases (except eclipses). Therefore, a disc corona origin for the absorbing material has been proposed (Hyodo et al. 2009). Hyodo et al. (2009) suggested that the absorbing gas is outflowing with a bulk motion of km s-1, and also showed that the dip spectra are well-reproduced by increased absorption by cold (approximately neutral) material.
A total of 38 XMM-Newton observations included AX J1745.6-2901, of which 11 have caught the source in outburst. The detailed Swift monitoring of the Galactic center (Degenaar et al. 2009; 2010; 2013), comprising over 1000 Swift snapshot observations obtained between 2006 and 2014, allows us to place the XMM-Newton observations in context, tracking the accretion state of AX J1745.6-2901. Taken together, these data provide us with a unique opportunity to study the wind in AX J1745.6-2901 and determine whether the appearance/disappearance of the wind is linked to the accretion state of the source.
The paper is organised as follows. In Section 2 we present the XMM-Newton and Swift observations and data reduction methods. In Section 3 we present the method used to determine the accretion state. In Sections 4 and 5 we present detailed modelling of the XMM-Newton data using phenomenological and proper photo-ionisation models. Our results are summarised in Section 6.
2 Observations and data reduction
All spectral fits were performed using the Xspec software package (version 12.7.0). Uncertainties and upper limits are reported at the 90 per cent confidence level for one interesting parameter, unless otherwise stated. The reported X-ray fluxes are not corrected for Galactic absorption. To allow the use of statistics we group each spectrum to have a minimum of 25 counts in each bin. We adopt a nominal Eddington limit for AX J1745.6-2901 of L erg s-1(appropriate for a primary mass of M⊙ and cosmic composition; Lewin et al. 1993).
2.1 XMM-Newton
Several independent groups, with a wide variety of science goals have made XMM-Newton observations of the Galactic Centre field over the last decade. In this paper we combine all available data where AX J1745.6-2901 lies within the XMM-Newton field of view. This includes recent XMM-Newton observations which were designed to monitor the passage of G2 (Gillessen et al. 2012) at peri-center (PIs: Haggard; Ponti), and to track the evolution of the outburst of SGR J1745-2900 (Mori et al. 2013; Kennea et al. 2013; Rea et al. 2013; PI: Israel), data from the XMM-Newton scan of the central molecular zone (PI: Terrier), plus many older archival XMM-Newton observations (See Tab. 1 and Tab. 3 and 5 of Ponti et al. in prep.).
As of 2014 May 14 there were 34 observations publicly available in the XMM-Newton archive (Tab. 1), pointed near AX J1745.6-2901 and with EPIC-pn clean exposure longer than 3 ks. We add to this four new proprietary observations that were accumulated between August 2013 and April 2014.
Starting from the XMM-Newton Observation Data Files (ODF), we re-process all the data sets, with the latest version (13.5.0) of the XMM-Newton Science Analysis System (SAS), applying the most recent (as of 14/05/2014) calibrations. Because of the relatively small effective area of the MOS cameras in the Fe K band, we restrict our analysis here to data collected with the EPIC-pn camera.
The majority of the EPIC-pn observations have been accumulated in Full Frame mode with the medium filter. One observation (obsid 0112972101) was performed in Extended Full Frame mode, and two (obsid 0111350301 and 0111350101) used the thick filter.
Photon pile-up affected all observations in which AX J1745.6-2901 was found in the soft state (see Section 3; Tab. 1). To mitigate the effects of pile-up on the extracted spectra in the soft state, we adopt an annular extraction region centred on the source, with inner radius of arcsec and outer radius of arcsec (see e.g. van Peet et al. 2009). Discarding all the photons within arcsec of the peak of the source point-spread function (PSF), we remove of the encircled energy from the source which is concentrated on a small area (see fig. 7 in section 3.2.1.1 of the XMM-Newton users’ handbook 222http://xmm.esac.esa.int/external/xmm_user_support/documentation/uhb/index.html). This allows us to reduce the effects of pile-up significantly. An outer radius of arcsec allows us to retain of the remaining source photons, whilst keeping the instrumental background and diffuse emission low. For the hard state observations, which are not affected by pile-up, we extracted events using a circular region with arcsec radius. To compute the source flux during the quiescent (or close to quiescence) observations whilst minimising the contamination from instrumental background and diffuse emission, we used a small circular extraction region with a radius of arcsec (see Tab. 1).
We initially selected the background photons from a region of similar size and shape and on the same detector chip as the source region. However, due to the bright and highly inhomogeneously distributed diffuse emission near the Galactic center (Wang et al. 2002; Baganoff et al. 2003; Koyama et al. 2007; Ponti et al. 2010; 2013; Clavel et al. 2013), we decided to accumulate the background spectrum from the same region of the sky selected for the source during the XMM-Newton observations where AX J1745.6-2901 was in quiescence (see Tab. 1). To mitigate the effects of the spatial and long term temporal dependence of the internal EPIC-pn particle background, we selected only the quiescent state observations in which AX J1745.6-2901 was near the optical axis of the EPIC-pn instrument and which were taken after September 2006 (corresponding to the first observation in which AX J1745.6-2901 was observed in outburst by XMM-Newton, see Tab. 1). We identified periods of enhanced particle-induced background activity by calculating the full detector light curve in the 12–15 keV band, after excluding the events within a 2.5 arcmin radius of AX J1745.6-2901. Excluding all photons within 2.5 arcmin from the source ensures that more than of the photons from AX J1745.6-2901 are removed and that the emission from Sgr A⋆ and its immediate surrounding are also excluded. Time intervals with a count rate higher than the threshold specified in Tab. 1 were filtered out and not considered in further analysis.
In order to identify and remove type I bursts from the analysis we used a 3 s resolution hard-band X-ray light curve. The 5–10 keV band was chosen for this as it is only marginally affected by dipping (Diaz-Trigo et al. 2006; van Peet et al. 2009; Ponti et al. 2014). We identified the intervals where AX J1745.6-2901 was in eclipse using a 60s binned 5–10 keV light curve. The thresholds we applied are reported in Tab. 1.
Absorption dips are generally revealed by sudden increases in the hardness-ratio. Therefore, to investigate the dipping phenomenon we examined the hardness-ratio lightcurve, defined here as the ratio of the keV light curve to the keV light curve. Following van Peet et al. (2009) and Ponti et al. (2014) we determined the average hardness-ratio for those intervals clearly belonging to the persistent emission, and then flagged as dipping those periods having hardness-ratio 1.5 times larger than the persistent value. We note that the light curves of the source are only moderately affected by the dipping phenomenon. However this might be due to the high foreground absorption column density towards AX J1745.6-2901, which prevents us from directly studying the soft X-ray energies where dips are most easily revealed.
After applying the particle background cut and the removal of bursts and eclipses, we extracted, for each observation, a source spectrum of the persistent emission plus mild dipping (e.g. dips with hardness ratio lower than 1.5 time quiescence; see Tab. 1 and Ponti et al. 2014). For each spectrum, the response matrix and effective area have been computed with the XMM-SAS tasks rmfgen and arfgen.
2.2 NuSTAR
Several NuSTAR observations of the Sgr A⋆ field have been carried out to date, with the primary science goal of monitoring the time evolution of the newly discovered magnetar SGR J1745-29 (Kaspi et al. 2014). Four of these observations caught AX J1745.6-2901 during its 2013 outburst (which began on 2013 July 25). These four observations were carried out on 2013 July 31, August 8, 9 and 13, and have exposure times 22.3, 12.0, 11.2 and 11.7 ks respectively (NuSTAR obsids 80002013018, 80002013020, 80002013022 and 80002013024). No further NuSTAR observations of the Galactic Center were performed until June 2014. In each of the four NuSTAR observations AX J1745.6-2901 was the brightest source in the field of view, yielding adequate photon statistics to study spectral evolution over time. In this paper, NuSTAR data were used only to constrain the hardest and softest broad-band Spectral Energy Distributions (SED) exhibited by AX J1745.6-2901. Full details of the outburst evolution and an analysis of type-I X-ray bursts will be presented by Hailey et al. (in prep.), but here we briefly describe our NuSTAR data analysis.
All NuSTAR data processing was performed with the NuSTAR Data Analysis Software (NuSTARDAS) v.1.3.1. NuSTAR consists of two co-aligned X-ray telescopes (FPMA and FPMB) with an energy range 3–79 keV and having spectral resolution 400 eV (FMHM) at 10 keV (Harrison et al. 2013). We first filtered out time intervals containing type-I X-ray bursts in a similar way to that carried out for the XMM-Newton data, then extracted source photons from a arcsec radius circle around the source position of AX J1745.6-2901. This extraction region is well-calibrated for a point source, and results in negligible contamination from the nearby magnetar SGR J1745-29 ( arcmin away from AX J1745.6-2901). We extracted background spectra from a pre-outburst NuSTAR observation taken on 2013 July 7 (obsid 8002013016, i.e. the last observation before the outburst) using the source extraction region. We re-binned the NuSTAR spectra to minimum 30 counts per bin, and discarded events outside the nominal NuSTAR bandpass (3–79 keV). We found that the softest and hardest spectra of AX J1745.6-2901 were observed in obsids 80002013018 and 80002013024 respectively. We fit the softest observation (FPMA and FPMB spectra jointly) using the XSPEC model phabs*simpl*diskbb (see Steiner et al. 2009 for more details about the simpl Comptonization component). We use the same model to fit the hard state observation even if the peak of the disc blackbody component is not in the NuSTAR band (see §5.2). The fit parameters were later adopted to construct the input SED data for our photo-ionization models (Section 5).
2.3 Swift
The Swift telescope has been used to regularly monitor the Galactic center field since February 2006, typically making one or more short ( ks) snapshot observations on each day when the Galactic centre is visible (Degenaar et al. 2013b). Our reduction of the Swift-XRT (X-Ray Telescope, Burrows et al. 2000) data utilises a pipeline developed for monitoring campaigns of bright AGN (see Fabian et al. 2012, Cameron et al. 2012, Connolly et al. 2014). We have extracted an X-ray light-curve for AX J1745.6-2901 using all Swift-XRT ‘photon counting’ mode observations with a nominal aim point within 25 arcmin of Sgr A⋆. For the work presented in this paper we have analysed a total of 1116 Swift obsids, including over 2000 separate visits with a summed exposure time of 1226 ks.
The raw Swift-XRT datasets were downloaded from the HEASARC archive and reprocessed using the tool xrtpipeline (version 0.12.8). For each Swift visit we used xselect to extract source events from a 30 arcsec radius circular aperture centred on 17:45:35.65, -29:01:34.0 (J2000). Background events were extracted from a nearby 60 arcsec radius circular region containing no bright sources (centre 17:45:28.90, -29:03:44.2, J2000). We measured the number of detected counts in the source and background regions for each of a standard set of ten medium-width energy bands spanning the range 0.3–10 keV. The background-subtracted source count-rate in each energy band was calculated from the observed counts taking account of the relative sky areas of the source and background regions.
The sensitivity of Swift-XRT varies across the focal plane due to vignetting and the presence of bad pixels. We have compensated for the varying instrumental sensitivity between visits by calculating visit-specific corrections using the following method. For each visit we generated an arf file using the standard Swift tools (xrtexpomap and xrtmkarf). Using this visit-specific arf, the nominal XRT response matrix, a simple absorbed power-law spectral model and the fakeit function within xspec, we calculated the expected count-rate for the visit-specific source extraction aperture () and the count-rate expected using the nominal Swift-XRT effective area curve and an infinite radius aperture (). The count-rate measured in the th visit, , can then be detrended using the following relation . We assumed a simple spectral model consisting of a power-law slope of and Galactic cm-2, but note that the detrending method is only weakly dependent on spectral shape due to our use of medium-width energy bands.
The detrended count-rate in the 3–10 keV energy band was calculated by summing the detrended count-rates calculated for the 3–4, 4–5, 5–6, 6–7 and 7–10 keV bands. Uncertainties were calculated by summing in quadrature the uncertainties in each band.
In a number of visits the source position was located close to one or more of the bad columns on the Swift-XRT CCD, these data points have very uncertain correction factors and so are rejected from further consideration. Note that the Swift-XRT observations are expected to suffer from moderate pile-up effects when AX J1745.6-2901 is in its highest luminosity state. However, as we do not carry out a spectral analysis of the Swift-XRT data we do not attempt to correct for pile-up in this work.
3 Accretion state determination
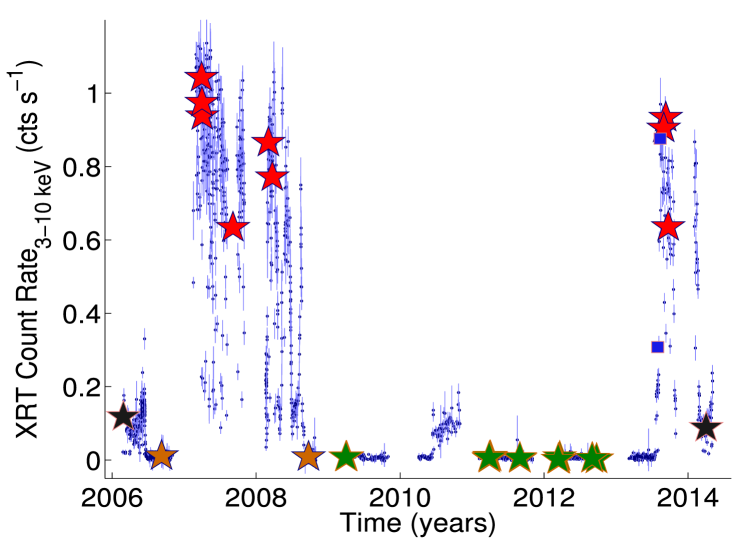
Figure 1 shows the long-term 3–10 keV light curve of AX J1745.6-2901 as measured by Swift-XRT. The locations and equivalent countrates for all XMM-Newton observations plus those for the hardest and softest NuSTAR observations are also indicated333We first derive the 3–10 keV flux from the best-fitting model (see § 4) for each of the XMM-Newton and NuSTAR spectra, and then use WebPIMMS http://heasarc.gsfc.nasa.gov/Tools/w3pimms.html to convert this to an equivalent Swift-XRT count rate.. During 11/38 XMM-Newton observations AX J1745.6-2901 was caught in outburst, with Ferg cm-2 s-1. AX J1745.6-2901 was in quiescence during 19/38 XMM-Newton observations, i.e. it was undetected in the 3–10 keV band, implying a luminosity lower than erg s-1 (assuming a distance of 8 kpc). During the remaining 8/38 observations AX J1745.6-2901 was detected (see Tab. 1) at a slightly higher flux of F erg cm-2 s-1 corresponding to luminosities of L erg s-1, and Eddington ratios of , therefore, although detected, it has still been caught in the quiescent state.
The observed high column density of neutral material ( cm-2) suggests that AX J1745.6-2901 is located at or behind the Galactic center (see Section 4.1). The distance of AX J1745.6-2901 along the line of sight is uncertain. If located at a distance of kpc, AX J1745.6-2901 has a peak luminosity of erg s-1 (see Section 4.2), corresponding to several per cent of the Eddington luminosity (for a NS mass of M⊙). The small angle between AX J1745.6-2901 and Sgr A⋆, and the significant increase in surface density of stars and X-ray binaries towards the Galactic center (e.g. Muno et al. 2003), makes the Galactic center the most probable location. Therefore we assume a distance to AX J1745.6-2901 of 8 kpc. Such a distance is further supported by observations of the brightest X-ray bursts emitted by AX J1745.6-2901, which reached the Eddington luminosity for a NS at 8 kpc (Maeda et al. 2006, Degenaar et al. 2009). The luminosities computed in this work can be scaled by a factor should a more reliable measurement of the distance of AX J1745.6-2901 become available.
It is well known that, at luminosities in the range % , NS-LMXBs typically alternate between two distinct states (e.g. van der Klis 2006), with state transitions following a hysteresis pattern in the Hardness Intensity Diagram (Muñoz-Darias et al. 2014). The X-ray spectra of NS-LMXBs in outburst (see Lin et al. 2007; Barret et al. 2001) are characterised by two main states: i) a hard state where the 3–10 keV emission is dominated by a power-law component and strong variability ( up to 20–40 %); ii) a soft state where the X-ray emission is dominated by a disc blackbody component and there is only weak broad-band variability ( %). Note that the same levels of rms and spectral properties characterize the hard and soft state in black hole X-ray binaries as well (e.g. Muñoz-Darias et al. 2011). NS-LMXBs can also show an additional X-ray emission component, associated with emission from the surface of the neutron star. Furthermore, the observed spectrum of AX J1745.6-2901 is significantly modified by absorption from a high column density of neutral material (consistent with observations of other Galactic center sources).
To determine the state of AX J1745.6-2901 in outburst, we investigated two independent measures: the X-ray variability and the shape of the X-ray continuum. We fitted the spectrum from each XMM-Newton obsid with three different continuum models (all absorbed by a column density of neutral material fitted with the phabs model with Anders & Grevesse 1989 abundances and Balucinska-Church & McCammon 1998 cross sections). They are: i) a multi-temperature disc blackbody (phabsdiskbb); ii) a single temperature blackbody component (phabsbbody); and iii) a power-law (phabspowerlaw) continuum model. We report in Table 2 the and best fit values for the power-law model and disc blackbody as well as the differences between the for the best-fitting power-law model compared to the for the best-fitting blackbody model. We find that for each of the observations where AX J1745.6-2901 has a high flux, the thermal (blackbody and disc blackbody) models give a significantly better fit compared to the power-law model. The power-law model is preferred in the two observations at the lowest flux. At the highest fluxes the best-fitting power-law spectral index indeed assumes very steep values () suggesting instead the presence of a thermal component. Despite the blackbody and disc blackbody models well reproducing the shape of the continuum of the high flux observations, the presence of very significant residuals in the Fe K band make the fit formally unacceptable (see Tab. 2). We note that an acceptable fit is obtained once the Fe K band ( keV) is excluded (see column 9 in Tab. 2).
We also investigated the X-ray variability of AX J1745.6-2901. We produced light curves in the 3–10 keV energy band444We consider only the hard X-ray band because, due to the high column density of neutral material towards AX J1745.6-2901, only a small fraction of keV source photons reach us (see e.g. Maeda et al. 2006; Degenaar et al. 2010a; or Fig. 5). from the XMM-Newton EPIC-pn data, with 73 ms time resolution555This is the finest time resolution available for the PrimeFullWindow observing mode., and cleaned of time intervals associated with dips and bursts (using the same criteria and thresholds used in Section 2.1 and Table 1). These light curves were used to compute the power spectral density (PSD) function of each obsid, and to derive an estimate of the high frequency (i.e. freq 0.1–7 Hz) fractional . However, since the detected EPIC-pn count rate is typically fairly low (i.e. between 0.8 and 7 ct s-1) the PSDs are dominated by counting noise and do not permit a reliable measurement of the intrinsic source variability.
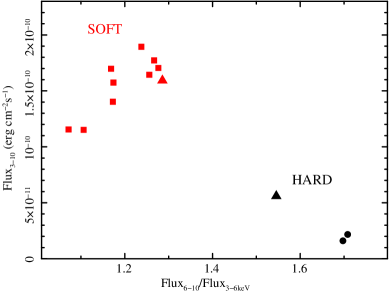
Finally, we identify the position of each observation of AX J1745.6-2901 in the Hardness Intensity Diagram (HID; see Fig. 2), which is often used to determine the source state (Fender et al. 2004; Belloni et al. 2011; Muñoz-Darias et al. 2014). The hardness-ratio is defined here as the ratio between the observed fluxes in the 6–10 keV and the 3–6 keV bands. As expected, thermal emission dominated observations have a markedly smaller hardness-ratio compared to power-law dominated ones. Note that the observed hardness-ratio indicates a real variation of the SED (e.g. it is not due to a variation of the neutral absorber; see Section 4.1). We therefore denote the thermal emission softer observations as ‘soft state’, and the power-law dominated harder observations as ‘hard state’.
4 Phenomenological models
In what follows (guided by the results presented in Section 3), we consider only an absorbed power-law spectral model for the hard state observations, and either an absorbed disc blackbody or an absorbed single blackbody component for the soft state observations (see Tab. 2).
4.1 Neutral absorbing material

Fig. 3 shows the best-fitting column density of neutral material during the soft and hard state observations. These measurements are consistent with a constant column density, despite the very large variation in source flux and spectral shape. This suggests that, despite AX J1745.6-2901 being a dipping source, the observed column density of neutral material is most probably attributable to absorption along the line of sight, i.e. physically unrelated to AX J1745.6-2901. In fact, the observed column density is within a factor 2 of the column densities measured towards two other nearby Galactic centre sources: Sgr A⋆ and SGR J1745-2900, and cm-2 respectively (Baganoff et al. 2003; Trap et al. 2011; Nowak et al. 2012; Rea et al. 2013). This high column density of neutral material supports the hypothesis that AX J1745.6-2901 is located either at or behind the Galactic center.
4.2 Thermal emission in the soft state
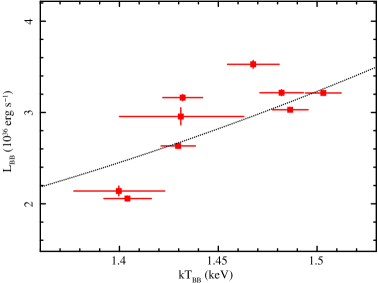
The upper panel of Fig. 4 shows the best-fitting temperature and luminosity for the soft state spectra fitted with a simple blackbody. During these observations AX J1745.6-2901 is observed at a luminosity between erg s-1. Given the high-inclination of the system, it is probable that the intrinsic disc luminosity is much higher. For example, simple geometrical considerations (not taking into account relativistic effects) suggest that for AX J1745.6-2901’s inclination angle of , the intrinsic disc luminosity should be a factor of higher than the observed luminosity666The inclination of AX J1745.6-2901 was proposed to be by Maeda et al. (1996). However, this value is a lower limit since (i) it assumes a 1 main sequence companion and (ii) the eclipses should be grazing. On the other hand, an inclination is not expected since the system does not show the typical properties of accretion disc corona sources (e.g. White & Holt 1982). Since the companion stars in LMXBs are typically evolved (and thus less massive than expected for a main sequence star), and this source displays relatively deep eclipses, we adopt an inclination angle of . In any case, we note that our results are not significantly dependent on small variations of this orbital parameter.. Therefore the intrinsic disc luminosity of AX J1745.6-2901 corresponds to per cent Eddington (versus per cent Eddington for the uncorrected luminosity). This places AX J1745.6-2901 in the typical luminosity range observed in ‘atoll’ sources (Gladstone et al. 2007; Muñoz-Darias et al. 2014). AX J1745.6-2901 would be characterised by even higher luminosities if it is in fact located far behind the Galactic center.
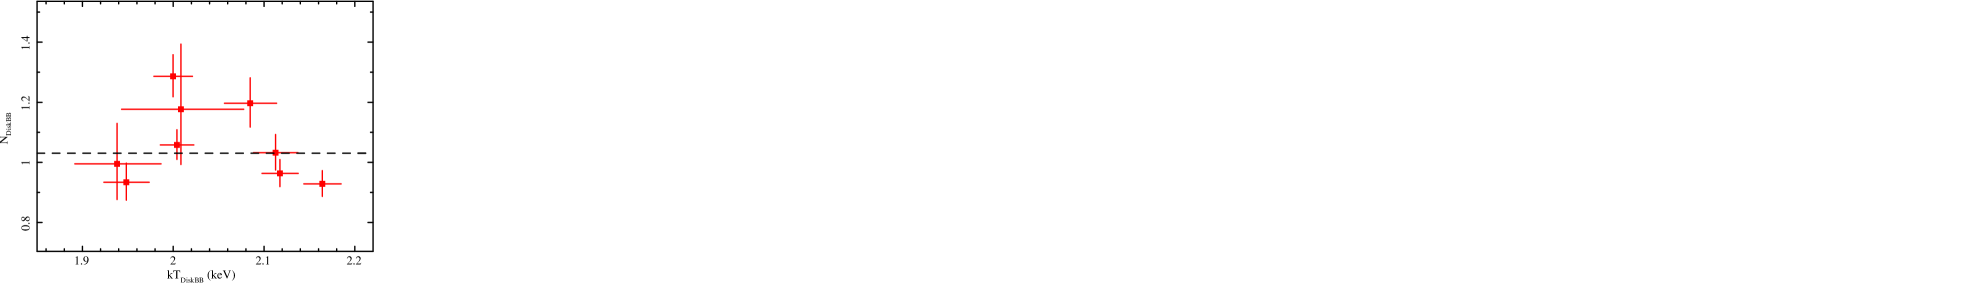
The upper panel of Fig. 4 shows a clear trend of larger luminosities with increasing blackbody temperatures. Blackbody temperature and luminosities are well correlated with a Spearman correlation coefficient of 0.78 (with an associated null hypothesis probability of corresponding to a confidence level of per cent)777 See Appendix A of Bianchi et al. (2009; see also Ponti et al. 2012b) for details on this procedure, which takes into account errors on the variable.. The line in Fig. 4 shows the relation, that is expected when the thermally emitting region varies in temperature but keeps a constant area. This simple relation reproduces the observed trend, however significant intrinsic scatter is present. This scatter might be produced by the emission from the boundary layer. In addition, the trend is supported by the results of spectral fits using a disc blackbody component (see lower panel of Fig. 4), which, to first approximation, are consistent with a disc having constant normalisation and an inner radius km (assuming a disc inclination of and a color to effective temperature ratio ; Shimura & Takahara 1995; Kubota et al. 1998).
4.3 Soft and hard state comparison
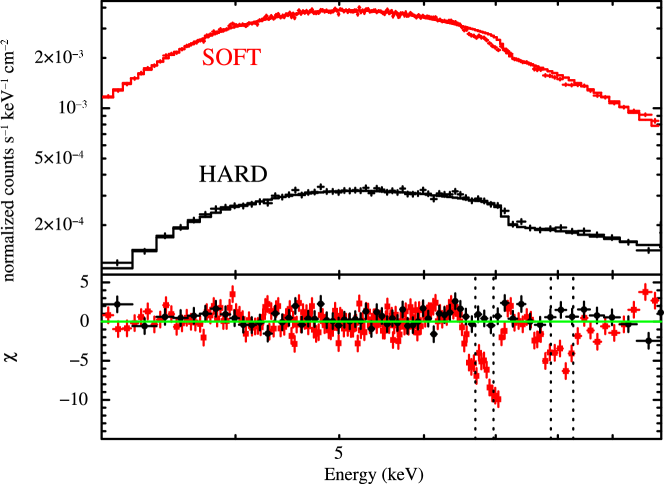
Fig. 5 shows the combined time-averaged spectra of all the soft- and all the hard state XMM-Newton observations, and their residuals with respect to an absorbed blackbody model (soft state) and to an absorbed power-law model (hard state).
Systematic negative residuals at the energies of the Fe xxv and Fe xxvi transitions are clearly visible in the time-averaged soft state spectrum. These absorption features are also visible, albeit at lower signal to noise ratio, in the spectra from individual soft state observations. The combined soft state spectrum shows very significant residuals at the energies of the Fe xxv K ( keV) and Fe xxvi K ( keV), as well as Fe xxv K ( keV) and Fe xxvi K ( keV) lines, with a possible contribution from Ni xxvii K and Fe xxv K lines. Similar absorption lines were also observed by Hyodo et al. (2009) in a single Suzaku observation. These features are therefore most probably produced by absorption from photo-ionised gas. In contrast, no significant narrow negative residuals are visible in the time averaged hard state spectrum, nor in the spectra from the individual hard state observations, with upper limits to the absolute value of the line equivalent width as stringent as eV.
This one-to-one correlation of wind-absorption with accretion state appears similar to that seen in the other well monitored neutron stars, EXO 0748-676 (Ponti et al. 2014), and in Galactic black hole binaries (Miller et al. 2008; 2012; Neilsen & Lee 2009; Ponti et al. 2012).
4.4 Fe xxv and Fe xxvi absorption line inter-observation variability
In order to examine in more detail the variability of these absorption lines, we fit the spectrum from each soft state observation with an absorbed single blackbody model plus two narrow absorption lines: (phabs(gaus+gaus+bbody)). Such lines have been observed in most high-inclination low-mass X-ray binaries and they are typically unresolved at the EPIC-pn CCD resolution (Diaz-Trigo et al. 2006). Hoever, grating observations of such features reveal typical widths of few km s-1 for these lines (Miller et al. 2008; Kallman et al. 2009). Therefore, at first, we fix the line widths of the Fe xxv and Fe xxvi absorption lines to 5 eV. For the measurement of absorption lines, we consider only the seven soft state XMM-Newton observations having clean exposure times longer than 5 ks (see Tab. 3). The addition of the two narrow absorption lines significantly improves the fit (compared to a simple absorbed blackbody model) from for 2324 dof to for 2296 dof. Clear residuals are still observed at energies corresponding to the Fe xxv K and Fe xxvi K lines. Addition of these two ionised narrow (with width fixed to 5 eV) Fe K absorption lines to the spectral model significantly improved the fit to for 2270 dof. The best fit parameters of these fits are reported in Tab. 3. To test whether or not these lines appear resolved, we then tie the width of all the lines to a single value that is left free to vary. We obtain a best-fitting energy of keV, corresponding to km s-1. However, we observe only a small improvement of the fit ( for 2269 dof, with associated F-test probability ), suggesting that these absorption lines are not (or are barely) resolved. Therefore, in the analysis that follows we keep the line widths fixed to 5 eV.
4.4.1 Fe K line energies
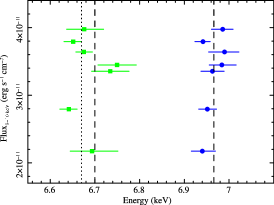
The left panel of Fig. 6 shows the best-fitting energies of the Fe xxv K and Fe xxvi K absorption features and the expected energies of the resonance Fe xxvi K and Fe xxv K lines and inter-combination Fe xxv K transitions (see also Tab. 3). No significant blue- or redshift is observed. However, due to the finite energy resolution and the uncertainty on the energy scale calibration of the EPIC-pn camera, only outflows with km s-1 would be detected. Higher energy resolution observations (together with better energy scale calibration) are thus required to measure outflows that are typically observed in Galactic BHs ( km s-1). Note that the Fe xxv and Fe xxvi K absorption features are observed at the expected energies of these transitions (see Tab. 3).
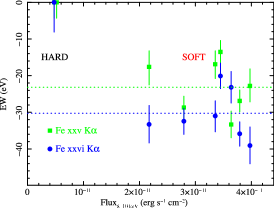
4.4.2 Fe K line equivalent widths
The middle and right panels of Fig. 6 show the observed equivalent widths of the Fe xxv, Fe xxvi K and K absorption lines (see also Tab. 3). These four absorption lines are all significantly detected in the individual spectrum from each soft state observation, with average equivalent widths in the range to eV. In contrast, from the single hard state spectrum we can only derive stringent upper limits (see Fig. 6 and Tab. 3). Within the soft state observations, we observe no clear trend of increasing or decreasing line equivalent widths with 8–10 keV flux.
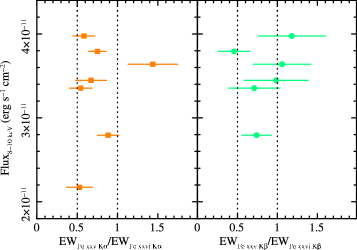
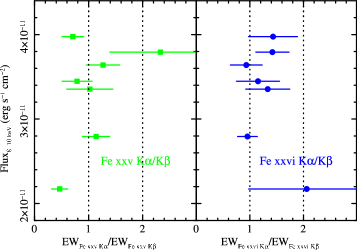
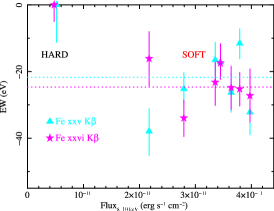
Figure 6 shows that both the Fe xxvi K (middle panel) and K (right panel) lines are typically more intense ( %) than the corresponding Fe xxv lines. The ratio between the equivalent widths of the Fe xxv and Fe xxvi lines is a sensitive probe of variations in the ionisation state of the absorbing highly ionised plasma. The left panel of Fig. 7 shows the Fe xxv over Fe xxvi equivalent width ratios for both the K and K lines. A small scatter between the different soft state observations is observed (at least for the K transitions), suggesting that despite ionisation effects being present888Given the high densities expected within such ionised absorbers in binaries, the recombination time is expected to be much shorter than the typical time intervals between the XMM-Newton observations., they do not play a major role here. In fact, no clear trend with flux is observed. This is probably due to the significant, but small, variations of the 8–10 keV flux.
We also note that the K lines are less than a factor of 2 stronger than the corresponding K lines. In particular, the Fe xxv K lines have equivalent widths comparable to the corresponding K lines, for both Fe xxv and Fe xxvi. As shown for the case of NGC 3516 (fig. 4 of Risaliti et al. 2005), these Fe K/Fe K ratios suggest high column densities for the absorbing medium ( cm-2) and high turbulent velocities of the order of km s-1. Note that the Fe xxv and Fe xxvi K lines could have a contribution from Ni xxvii K and Fe xxv K, respectively (see e.g., Hyodo et al. 2009). However these transitions have oscillator strengths significantly lower than the nearby Fe K transitions, therefore little contribution is expected. Also note that the possible contribution due to these lines has been considered by Risaliti et al. (2005).
5 Photo-ionisation models
To obtain realistic measurements of the ionisation state and column density of the absorbing ionised plasma, we now fit the observed spectra with realistic photo-ionisation models. Therefore we substitute the multi-Gaussian components with a single photo-ionised component. In such an analysis the relative strengths of the various absorption features are tied together in a physical manner.


5.1 Fits with the zxipcf model
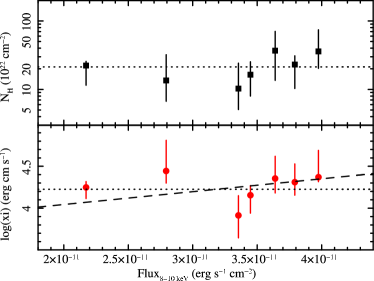
For an initial, approximate description of the ionised absorption, we use the zxipcf model, assuming that the obscuring plasma is totally covering the X-ray source: phabszxipcf(bbody). This component reproduces the absorption from photo-ionised gas illuminated by a power-law source with spectral index and is calculated assuming a micro-turbulent velocity of 200 km s-1 (Reeves et al. 2008; Miller et al. 2007). The addition of such a component drastically improves the fit ( for 14 new parameters) compared to the fit with a simple absorbed blackbody model (see Fig. 8). We find best-fitting column densities for the photo-ionised plasma in the range cm-2 (see the upper panel of Fig. 9) and best-fitting ionisation parameters (lower panel of Fig. 9). The column density of the ionised absorber is consistent with being constant between the different soft state observations (Fig. 9). Due to the high interstellar extinction towards AX J1745.6-2901, we cannot detect additional absorption lines (besides Fe K) and hence we can place only loose constraints on the plasma ionisation parameter. Furthermore the soft state XMM-Newton observations span only a small range ( a factor or 2) in luminosity. Therefore we cannot discriminate between a constant ionisation parameter (dotted lines in Fig. 9) and a scenario where the ionisation parameter varies linearly with the source luminosity (as expected in the over-simplified case of a constant SED; see dashed line in Fig. 9).
As a general comment, we note that the Fe xxv and Fe xxvi K and K lines are typically well reproduced by the zxipcf component, suggesting that these lines are indeed produced by photo-ionised absorbing material. However, we note significant residuals in several of the individual soft state spectra. This might be related to the small micro-turbulent velocity used to compute the zxipcf table, compared to the high values suggested by the Fe K/Fe K line ratios. Indeed, the earlier modelling with independent Gaussian absorption lines resulted in significantly better fits, suggesting that the zxipcf component cannot fully reproduce all the details of the observed ionised absorption (see Fig. 8).
5.2 Characteristic soft and hard state SEDs
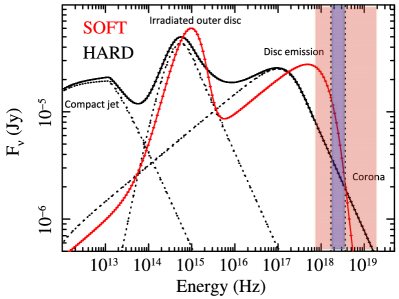
To compute a physically consistent photoionisation model for the Fe K absorption lines, the determination of the source flux and spectral shape in the to keV band is of primary importance (see the blue shaded band in Fig. 10). Photons below keV can not ionise the Fe K shell, therefore they can not produce either Fe xxv or Fe xxvi absorption lines. However, the physical properties of the ionised absorber (e.g. the plasma temperature) do also depend, albeit weakly, on lower and higher energy photons. To determine the extension of the source emission above keV, we fit the hardest and softest NuSTAR observations of the 2013 campaign to observe Sgr A⋆ (Hailey et al. in prep.). We fit the NuSTAR spectra over the keV energy band (see the pink band in Fig. 3) with an absorbed disc blackbody model providing the seed photons that are Comptonised and generate a power-law component (phabssimpldiskbb; Steiner et al. 2009). This allows us to constrain the emission from AX J1745.6-2901 in the full X-ray band. As typical for the soft state (Lin et al. 2007; Plant et al. 2014), the multi-temperature disc blackbody emission is well constrained and a very weak and steep power-law component is observed (see Hailey et al. in prep. for more details). A colder disc blackbody emission component is expected to be present during the hard state. Unfortunately, due to the significant Galactic absorption towards AX J1745.6-2901, our data are not sensitive to the disc emission during the hard state. We, therefore assume a fixed temperature of keV (e.g. Plant et al. 2014a,b). We also check that the derived ratio between fluxes of the disc and power-law components are within the typical range observed during the soft and hard states (Lin et al. 2007; Remillard & McClintock 2006). Optical and infrared observations of accreting black holes and neutron stars in the soft and hard states show evidence for irradiation of the outer disc (Hynes et al. 2002; Migliari et al. 2010). To model this, we added a thermal (blackbody) component with temperature K and K for the soft and hard state, respectively (Hynes et al. 2002). Finally, at radio-to-infrared frequencies we added a contribution from a compact jet, which is only observed in the hard state (Migliari et al. 2010). The soft and hard state SED are displayed with red and black lines in Fig. 10, respectively.
5.3 Self-consistent photo-ionised models
We prepared two ad-hoc tables (denoted IAsoft and IAhard) produced with the photo-ionization code Cloudy C13.00 (last described in Ferland et al. 2013). The model ingredients are: (1) the soft and hard SEDs presented in Sect. 5.2; (2) constant electron density cm-3; (3) ionization parameter in the range ; (4) intervening column density in the range ; (5) turbulence velocity km s-1; (6) chemical abundances as in Table 7.1 of Cloudy documentation.
We first fit the high quality soft state spectra with a model consisting of simple blackbody emission absorbed by both neutral material and by the soft state photo-ionised plasma model999We fitted the photo-ionised plasma component with the IA model fixing the turbulent velocity either to km s-1 or km s-1. Consistent results are obtained. However, assuming km s-1 leads to a slightly better fit. For this reason we, hereinafter, assume such turbulent velocity for the ionised plasma. (model: phabs*IAsoft*bbody). To highlight the effect of the ionised absorber, panel (a) of Fig. 8 shows the data and best fit obtained with such a model, once the ionised absorber component has been removed. In the same way, panel (b) of Fig. 8 shows the data-to-model ratio. We show for comparison (panel c) a model consisting of simple blackbody emission absorbed by both neutral material and by the zxipcf component (model: phabs*zxipcf*bbody).
Adopting the self-consistent absober model from Cloudy (panel d) significantly improves the fit ( for dof) compared to using the zxipcf absorber (compared to for dof). In particular the fit is improved at the energy ranges corresponding to the Fe K and K transitions; strong residuals are no longer present at these energies. However, the fit is still statistically unacceptable (null hypothesis probability -value=0.016) because significant residuals are still present in the keV range, as well as an excess of emission above keV. In Section 4.2 we observed a scaling of the thermal blackbody temperature with luminosity, suggesting an accretion disc origin for this emission, we therefore also attempt to model the continuum by replacing the simple blackbody component with a multi-temperature disc blackbody component. We obtain a significantly worse fit (see panel d of Fig. 8) with this model (phabs*IA*diskbb; for 2310 dof), and observe strong positive residuals in the range keV (panel e of Fig. 8). Note that the disc blackbody model replaces the previous excess above keV with a slight deficit. To check if the keV excess might be produced by a broad Fe K line, we add a diskline (Fabian et al. 1989) component to the model, representing the emission from a line reflected by an accretion disc (panel f of Fig. 8). We assume the line energy to be keV (the expected energy from neutral iron), the inner and outer disc radii to be rg, rg and a disc inclination of (the disc inner radius is assumed to be r km as measured in Section 4.2). We assume the same disc power-law emissivity index (controlling the radial dependence of the emissivity) for all soft state spectra and obtain a best-fitting value of . The addition of the diskline component significantly improves the fit ( for 2301 dof; see Fig. 8). This model now provides a completely statistically acceptable description of the data (-value=0.45). The broad Fe K line component is significantly detected (see Fig. 11) within each XMM-Newton observation, with an equivalent width in the range eV.
We note that the best fitting parameters of the ionised absorption component (, ) do not vary significantly if the continuum is modelled with either a blackbody or a disc blackbody component, and are also independent of whether the broad iron line is added to or excluded from the fit. The top and middle panels of Fig. 11 show the best fit column density and ionisation parameter of the ionised absorber model.
Fig. 11 shows that, as previously observed when fitting the absorption features with simple Gaussians or the zxipcf model, the ionisation level and column density parameters of the Cloudy ionised absorber model are consistent with being constant during all the soft state observations. No clear trends with luminosity are observed.

5.4 Does the wind disappear in the hard state because of ionisation effects?
As shown in Section 10, the SED of AX J1745.6-2901 changes dramatically between the soft- and the hard state. It is expected that, even if exactly the same absorbing material is present in both states, the variation of the source SED will change the ionised plasma ionisation state. For example, an increase of the source luminosity in the 8–10 keV band is expected to increase (possibly over-ionising) the plasma ionisation, changing the intensities of the Fe xxv and Fe xxvi absorption lines, and vice versa for a decrease in the source luminosity.
To check if this is indeed the case, we fist compute for each soft state spectrum, from the best fit column density and ionisation parameter, the product (where is the number density of the ionised absorbing plasma and is its distance from the primary source). In fact, a variation of the SED will change the ionisation state of the plasma, but it will leave the product constant (unless the plasma undergoes a true physical variation). Within the soft state observations, we observe this product to remain constant, with an average value of cm-1. To test if the absorber physically varied during the hard state, we first assume the same observed product also for the hard state observations. We then derive, given the observed SED, the absorbing plasma ionisation parameter for each hard state observation. In particular, the highest statistics hard state observation (obsid: 0690441801) is expected to have an ionisation parameter . We then fit this spectrum with the self-consistently ionised absorption model (phabs*IAhard*diskbb), imposing the expected ionisation parameter and leaving the column density free to vary between the lowest and highest value observed during the soft state observation. Even for the lowest column density observed during the soft state, the hard state ionisation model predicts, at such ionisation state, a very strong Fe xxv K line (see Fig. 12). The presence of such a line is excluded by the data (note that the inclusion of the broad disc line component does not change this conclusion). This suggests that ionisation effects are not able to explain the observed behaviour and that a true physical variation of the ionised absorber between the different states is required.

6 Conclusions
The XMM-Newton and Swift monitoring observations of the central arcmin of the Milky Way have detected several outbursts from the accreting neutron star system AX J1745.6-2901, allowing us to measure the spectral evolution during both the soft and hard states. Nine XMM-Newton observations caught AX J1745.6-2901 in the soft state and three in the hard state. Our main conclusions/findings can be summarised as follows:
-
•
As is commonly observed in NS-LMXB, the persistent emission of AX J1745.6-2901 during the soft state is dominated by a thermal optically thick component, most probably due to multi-temperature blackbody emission from the accretion disc, plus blackbody emission from the neutron star surface. This emission component is observed to vary in temperature with luminosity and to keep its emitting area roughly constant. The hard state emission (outside of dipping intervals) is well described by a power-law component. The low luminosity of the thermal component is consistent with the high-inclination of the system.
-
•
The persistent emission in both the soft and hard state is heavily absorbed by a large column density of neutral material cm-2. Such a large column density is within a factor 2 of that observed towards other Galactic center sources along nearby lines of sight, such as Sgr A⋆ and SGR J1745-2900, and is consistent with remaining constant between all XMM-Newton observations. This suggests that AX J1745.6-2901 is at (or behind) the Galactic center and that most of the obscuring column density is due to the interstellar medium (outside of dipping intervals).
-
•
Highly significant absorption features due to the Fe xxv and Fe xxvi K and K lines are detected in the spectra from all nine soft state observations. The Fe xxv and Fe xxvi K lines have typical equivalent widths of eV, very similar to the equivalent widths of the corresponding K lines ( eV). No absorption lines are observed in the hard state (very stringent upper limits are measured; eV). This wind-Fe K absorber vs. state connection is similar to what has been observed in EXO 0748-676, the only accreting neutron star for which the wind-accretion state connection has been investigated so far (Ponti et al. 2014). Moreover, such behaviour closely resembles what is seen in accreting black hole systems, where winds (traced by the same Fe K absorption features) are observed only during the accretion-disc-dominated soft states, and disappear during the hard states characterised by jet emission (Miller et al. 2008; 2012; Neilsen & Lee 2009; Ponti et al. 2012).
-
•
We observe the column density of the ionised material ( cm-2) to be consistent with being constant within the seven high-statistics soft state XMM-Newton observations. Moreover, we do not observe any trends in the Fe xxvi/Fe xxv K and K ratios, with the source keV luminosity, between the different soft state observations. This might be due to the relatively small range of luminosities spanned by the source (less than a factor of 3) and/or be induced by saturation of the lines.
-
•
Once the continuum and absorption components are fitted, a broad positive residual remains between keV. This excess can be reproduced by a standard ( eV) Fe K emission line from a standard (r rg, r rg) accretion disc seen at high-inclination. We note that because the system is highly inclined, the Fe K line is highly smeared. High signal to noise observations are mandatory to reveal the presence of similarly broad emission lines in other high-inclination systems.
Acknowledgments
The authors wish to thank Jan-Uwe Ness, Ignacio de la Calle and the rest of the XMM-Newton scheduling team for the enormous support that made the new XMM-Newton observations possible. GP and TMD acknowledge support via an EU Marie Curie Intra-European fellowship under contract no. FP-PEOPLE-2012-IEF-331095 and FP-PEOPLE-2011-IEF-301355, respectively. The GC XMM-Newton monitoring project is partially supported by the Bundesministerium für Wirtschaft und Technologie/Deutsches Zentrum für Luft- und Raumfahrt (BMWI/DLR, FKZ 50 OR 1408) and the Max Planck Society. This project was funded in part by European Research Council Advanced Grant 267697 ”4 sky: Extreme Astrophysics with Revolutionary Radio Telescopes”. DH acknowledges support from Chandra X-ray Observatory (CXO) Award Number GO3-14121X, operated by the Smithsonian Astrophysical Observatory for and on behalf of NASA under contract NAS8-03060, and also by NASA Swift grant NNX14AC30G. CH is supported by an NSERC Discovery Grant, and an Ingenuity New Faculty Award. ND is supported by NASA through Hubble Postdoctoral Fellowship grant number HST-HF-51287.01-A from the Space Telescope Science Institute. The scientific results reported in this article are based on observations obtained with XMM-Newton, Swift and NuSTAR.
References
- Anders & Grevesse (1989) Anders, E., & Grevesse, N. 1989, GeCoA, 53, 197
- Baganoff et al. (2003) Baganoff, F. K., Maeda, Y., Morris, M., et al. 2003, ApJ, 591, 891
- Barret (2001) Barret, D. 2001, Advances in Space Research, 28, 307
- Begelman et al. (1983) Begelman, M. C., McKee, C. F., & Shields, G. A. 1983, ApJ, 271, 70
- Belloni et al. (2011) Belloni, T. M., Motta, S. E., & Muñoz-Darias, T. 2011, Bulletin of the Astronomical Society of India, 39, 409
- Bianchi et al. (2009) Bianchi, S., Bonilla, N. F., Guainazzi, M., Matt, G., & Ponti, G. 2009, A&A, 501, 915
- Boirin & Parmar (2003) Boirin, L., & Parmar, A. N. 2003, A&A, 407, 1079
- Boirin et al. (2004) Boirin, L., Parmar, A. N., Barret, D., Paltani, S., & Grindlay, J. E. 2004, A&A, 418, 1061
- Boirin et al. (2005) Boirin, L., Méndez, M., Díaz Trigo, M., Parmar, A. N., & Kaastra, J. S. 2005, A&A, 436, 195
- Burrows et al. (2000) Burrows, D. N., Hill, J. E., Nousek, J. A., et al. 2000, Proc. SPIE, 4140, 64
- Cameron et al. (2012) Cameron, D. T., McHardy, I., Dwelly, T., et al. 2012, MNRAS, 422, 902
- Chenevez et al. (2006) Chenevez, J., Sanchez-Fernandez, C., Kuulkers, E., et al. 2006, The Astronomer’s Telegram, 756, 1
- Clavel et al. (2013) Clavel, M., Terrier, R., Goldwurm, A., et al. 2013, A&A, 558, A32
- Connolly et al. (2014) Connolly, S. D., McHardy, I. M., & Dwelly, T. 2014, MNRAS, 440, 3503
- Degenaar & Wijnands (2009) Degenaar, N., & Wijnands, R. 2009, A&A, 495, 547
- Degenaar & Wijnands (2010) Degenaar, N., & Wijnands, R. 2010a, A&A, 524, A69
- Degenaar et al. (2010) Degenaar, N., Wijnands, R., Kennea, J. A., & Gehrels, N. 2010b, The Astronomer’s Telegram, 2690, 1
- Degenaar et al. (2013) Degenaar, N., Kennea, J. A., Wijnands, R., et al. 2013a, The Astronomer’s Telegram, 5226, 1
- Degenaar et al. (2013) Degenaar, N., Miller, J. M., Kennea, J., et al. 2013b, ApJ, 769, 155
- Degenaar et al. (2014) Degenaar, N., Wijnands, R., Reynolds, M. T., et al. 2014a, IAU Symposium, 303, 315
- Degenaar et al. (2014) Degenaar, N., Wijnands, R., Reynolds, M. T., et al. 2014b, arXiv:1406.4508
- Díaz Trigo et al. (2006) Díaz Trigo, M., Parmar, A. N., Boirin, L., Méndez, M., & Kaastra, J. S. 2006, A&A, 445, 179
- Díaz Trigo & Boirin (2013) Díaz Trigo, M., & Boirin, L. 2013, Acta Polytechnica, 53, 659
- Fabian et al. (1989) Fabian, A. C., Rees, M. J., Stella, L., & White, N. E. 1989, MNRAS, 238, 729
- Fabian et al. (2012) Fabian, A. C., Zoghbi, A., Wilkins, D., et al. 2012, MNRAS, 419, 116
- Fender et al. (2004) Fender, R. P., Belloni, T. M., & Gallo, E. 2004, MNRAS, 355, 1105
- Ferland et al. (2013) Ferland, G. J., Porter, R. L., van Hoof, P. A. M., et al. 2013, Revista Mexicana de Astronomia y Astrofisica, 49, 137
- Gillessen et al. (2012) Gillessen, S., Genzel, R., Fritz, T. K., et al. 2012, Nature, 481, 51
- Gladstone et al. (2007) Gladstone, J., Done, C., & Gierliński, M. 2007, MNRAS, 378, 13
- Harrison et al. (2013) Harrison, F. A., Craig, W. W., Christensen, F. E., et al. 2013, ApJ, 770, 103
- Heinke et al. (2008) Heinke, C. O., Yusef-Zadeh, F., Genzel, R., et al. 2008, The Astronomer’s Telegram, 1513, 1
- Hynes et al. (2002) Hynes, R. I., Haswell, C. A., Chaty, S., Shrader, C. R., & Cui, W. 2002, MNRAS, 331, 169
- Hynes & Jones (2008) Hynes R., Jones E., 2008, ATel, 1816, 1
- Hyodo et al. (2009) Hyodo, Y., Ueda, Y., Yuasa, T., et al. 2009, PASJ, 61, 99
- Kallman et al. (2009) Kallman, T. R., Bautista, M. A., Goriely, S., et al. 2009, ApJ, 701, 865
- Kaspi et al. (2014) Kaspi, V. M., Archibald, R. F., Bhalerao, V., et al. 2014, ApJ, 786, 84
- Kennea & Skinner (1996) Kennea, J. A., & Skinner, G. K. 1996, PASJ, 48, L117
- Kennea et al. (2006) Kennea, J. A., Burrows, D. N., Campana, S., et al. 2006, The Astronomer’s Telegram, 753, 1
- Kennea et al. (2013) Kennea, J. A., Burrows, D. N., Kouveliotou, C., et al. 2013, ApJ, 770, L24
- King et al. (2012) King, A. L., Miller, J. M., Raymond, J., et al. 2012, ApJ, 746, L20
- Koyama et al. (2007) Koyama, K., Hyodo, Y., Inui, T., et al. 2007, PASJ, 59, 245
- Kubota et al. (1998) Kubota, A., Tanaka, Y., Makishima, K., et al. 1998, PASJ, 50, 667
- Lee et al. (2002) Lee, J. C., Reynolds, C. S., Remillard, R., et al. 2002, ApJ, 567, 1102
- Lewin et al. (1993) Lewin, W. H. G., van Paradijs, J., & Taam, R. E. 1993, SSRv, 62, 223
- Lin et al. (2007) Lin, D., Remillard, R. A., & Homan, J. 2007, ApJ, 667, 1073
- Maeda et al. (1996) Maeda, Y., Koyama, K., Sakano, M., Takeshima, T., & Yamauchi, S. 1996, PASJ, 48, 417
- Migliari et al. (2010) Migliari, S., Tomsick, J. A., Miller-Jones, J. C. A., et al. 2010, ApJ, 710, 117
- Miller et al. (2006) Miller, J. M., Raymond, J., Homan, J., et al. 2006, ApJ, 646, 394
- Miller et al. (2007) Miller, L., Turner, T. J., Reeves, J. N., et al. 2007, A&A, 463, 131
- Miller et al. (2008) Miller, J. M., Raymond, J., Reynolds, C. S., et al. 2008, ApJ, 680, 1359
- Miller et al. (2012) Miller, J. M., Pooley, G. G., Fabian, A. C., et al. 2012, ApJ, 757, 11
- Mori et al. (2013) Mori, K., Gotthelf, E. V., Zhang, S., et al. 2013, ApJ, 770, L23
- Muno et al. (2003) Muno, M. P., Baganoff, F. K., Bautz, M. W., et al. 2003, ApJ, 589, 225
- Muñoz-Darias et al. (2009) Muñoz-Darias, T., Casares, J., O’Brien, K., et al. 2009, MNRAS, 394, L136
- Muñoz-Darias et al. (2011) Muñoz-Darias, T., Motta, S., & Belloni, T. M. 2011, MNRAS, 410, 679
- Muñoz-Darias et al. (2014) Muñoz-Darias, T., Fender, R. P., Motta, S., & Belloni, T. M. MNRASin press
- Neilsen & Lee (2009) Neilsen, J., & Lee, J. C. 2009, Nature, 458, 481
- Neilsen et al. (2011) Neilsen, J., Remillard, R. A., & Lee, J. C. 2011, ApJ, 737, 69
- Nowak et al. (2012) Nowak, M. A., Neilsen, J., Markoff, S. B., et al. 2012, ApJ, 759, 95
- Parmar et al. (1985) Parmar, A. N., White, N. E., Giommi, P., et al. 1985, IAU circular, 4039, 1
- Parmar et al. (1986) Parmar, A. N., White, N. E., Giommi, P., & Gottwald, M. 1986, ApJ, 308, 199
- Parmar et al. (2002) Parmar, A. N., Oosterbroek, T., Boirin, L., & Lumb, D. 2002, A&A, 386, 910
- Plant et al. (2013) Plant, D. S., Fender, R. P., Ponti, G., Munoz-Darias, T., & Coriat, M. 2013, arXiv:1309.4781
- Plant et al. (2014) Plant, D. S., Fender, R. P., Ponti, G., Muñoz-Darias, T., & Coriat, M. 2014, MNRAS, 442, 1767
- Ponti et al. (2010) Ponti, G., Terrier, R., Goldwurm, A., Belanger, G., & Trap, G. 2010, ApJ, 714, 732
- Ponti et al. (2012) Ponti, G., Fender, R. P., Begelman, M. C., et al. 2012, MNRAS, 422, L11
- Ponti et al. (2012) Ponti, G., Papadakis, I., Bianchi, S., et al. 2012b, A&A, 542, A83
- Ponti et al. (2013) Ponti, G., Morris, M. R., Terrier, R., & Goldwurm, A. 2013, Cosmic Rays in Star-Forming Environments, 34, 331
- Ponti et al. (2014) Ponti, G., Muñoz-Darias, T., Fender, R. P., MNRAS, 2014 in press.
- Porquet et al. (2007) Porquet, D., Grosso, N., Goldwurm, A., et al. 2007, The Astronomer’s Telegram, 1058, 1
- Ratti et al. (2012) Ratti, E. M., Steeghs, D. T. H., Jonker, P. G., et al. 2012, MNRAS, 420, 75
- Rea et al. (2013) Rea, N., Esposito, P., Pons, J. A., et al. 2013, ApJ, 775, L34
- Remillard & McClintock (2006) Remillard, R. A., & McClintock, J. E. 2006, ARA&A, 44, 49
- Reeves et al. (2008) Reeves, J., Done, C., Pounds, K., et al. 2008, MNRAS, 385, L108
- Risaliti et al. (2005) Risaliti, G., Bianchi, S., Matt, G., et al. 2005, ApJ, 630, L129
- Sakano et al. (2002) Sakano, M., Koyama, K., Murakami, H., Maeda, Y., & Yamauchi, S. 2002, ApJS, 138, 19
- Sidoli et al. (2001) Sidoli, L., Oosterbroek, T., Parmar, A. N., Lumb, D., & Erd, C. 2001, A&A, 379, 540
- Shimura & Takahara (1995) Shimura, T., & Takahara, F. 1995, ApJ, 445, 780
- Steiner et al. (2009) Steiner, J. F., Narayan, R., McClintock, J. E., & Ebisawa, K. 2009, PASP, 121, 1279
- Trap et al. (2011) Trap, G., Goldwurm, A., Dodds-Eden, K., et al. 2011, A&A, 528, A140
- Ueda et al. (2001) Ueda, Y., Asai, K., Yamaoka, K., Dotani, T., & Inoue, H. 2001, ApJ, 556, L87
- Ueda et al. (2004) Ueda, Y., Murakami, H., Yamaoka, K., Dotani, T., & Ebisawa, K. 2004, ApJ, 609, 325
- van der Klis (2006) van der Klis, M. 2006, Compact stellar X-ray sources, 39
- van Peet et al. (2009) van Peet, J. C. A., Costantini, E., Méndez, M., Paerels, F. B. S., & Cottam, J. 2009, A&A, 497, 805
- Wang et al. (2002) Wang, Q. D., Gotthelf, E. V., & Lang, C. C. 2002, Nature, 415, 148
- White & Holt (1982) White, N. E., & Holt, S. S. 1982, ApJ, 257, 318
- Wijnands et al. (2007) Wijnands, R., Klien Wolt, M., Kuulkers, E., et al. 2007, The Astronomer’s Telegram, 1006, 1
- Wolff et al. (2008) Wolff, M., Ray, P., Wood, K., & Wijnands, R. 2008, The Astronomer’s Telegram, 1812, 1
| XMM-Newton | |||||||||
|---|---|---|---|---|---|---|---|---|---|
| OBSID | Rev | START (UTC) | EXP | CL EXP | STATE | F3-6 | F6-10 | F8-10 | Threshold |
| (ks) | (ks) | ( erg cm-2 s-1) | (ct s-1) | ||||||
| 0690441801 | 2622 | 2014-04-03 05:06:00 | 86.5 | 69.1 | H | 5.95 | 10.1 | 4.75 | 3.5/0.24/1.5/0.65/0.5/1.5 |
| 0724210501 | 2525 | 2013-09-22 21:15:49 | 43.9 | 30.0 | S | 55.8 | 59.8 | 21.7 | 10/1.1/1.4/5/3.8/1.5 |
| 0700980101 | 2519 | 2013-09-10 03:30:45 | 38.7 | 30.6 | S | 78.3 | 91.5 | 33.5 | 13/1.5/1.4/7/5/1.5 |
| 0724210201 | 2514 | 2013-08-30 20:13:12 | 58.5 | 45.7 | S | 72.9 | 91.5 | 34.5 | 13/1.6/1.5/7/4.5/1.4 |
| 0694641101 | 2343 | 2012-09-24 10:16:44 | 41.9 | 35.6 | Q | 0.8 | |||
| 0694641001 | 2343 | 2012-09-23 20:20:07 | 47.9 | 40.8 | Q | 0.85 | |||
| 0694640301 | 2331 | 2012-08-31 11:20:26 | 41.9 | 35.5 | Q | 0.75 | |||
| 0674601001 | 2249 | 2012-03-21 03:30:40 | 23.9 | 17.2 | Q | 0.7 | |||
| 0674600801 | 2248 | 2012-03-19 03:52:38 | 22.9 | 15.0 | Q | 0.7 | |||
| 0674601101 | 2247 | 2012-03-17 02:30:16 | 28.0 | 9.8 | Q | 0.6 | |||
| 0674600701 | 2246 | 2012-03-15 04:47:06 | 15.9 | 0.1‡ | Q | 0.8 | |||
| 0674600601 | 2245 | 2012-03-13 03:52:36 | 21.5 | 7.4 | Q | 0.9 | |||
| 0658600201 | 2148 | 2011-09-01 20:03:48 | 53.2 | 36.5 | Q | 0.9 | |||
| 0658600101 | 2148 | 2011-08-31 23:14:23 | 49.9 | 41.9 | Q | 0.9 | |||
| 0604301001 | 2073 | 2011-04-05 07:09:33 | 50.7 | 28.7 | Q | 0.6 | |||
| 0604300901 | 2072 | 2011-04-03 07:52:07 | 46.9 | 16.8 | Q | 0.6 | |||
| 0604300801 | 2071 | 2011-04-01 07:48:13 | 48.8 | 29.5 | Q | 0.7 | |||
| 0604300701 | 2070 | 2011-03-30 07:44:39 | 48.9 | 28.5 | Q | 0.6 | |||
| 0604300601 | 2069 | 2011-03-28 07:49:58 | 48.8 | 24.9 | Q | 0.6 | |||
| 0554750601 | 1707 | 2009-04-05 02:17:13 | 39.1 | 27.3 | Q | 0.6 | |||
| 0554750501 | 1706 | 2009-04-03 01:33:27 | 44.3 | 33.4 | Q | 0.65 | |||
| 0554750401 | 1705 | 2009-04-01 00:55:25 | 39.9 | 27.5 | Q | 0.65 | |||
| 0511000401 | 1610 | 2008-09-23 15:15:50 | 6.9 | 4.4 | D | 0.15 | 0.23 | 0.10 | |
| 0505670101 | 1518 | 2008-03-23 14:59:43 | 105.7 | 65.2 | S | 64.6 | 75.7 | 27.9 | 11/1.3/1.3/5/4/1.6 |
| 0511000301 | 1508 | 2008-03-03 23:25:56 | 6.9 | 4.4 | S | 72.4 | 85.0 | 31.1 | 12/1.5/1.4/5/3.7/20 |
| 0504940201 | 1418 | 2007-09-06 10:05:50 | 13.0 | 8.5 | S | 54.7 | 60.5 | 22.2 | 12/1.2/1.5/4.2/3.2/2.5 |
| 0402430401 | 1340 | 2007-04-03 14:32:24 | 105.7 | 38.6 | S | 74.9 | 95.6 | 36.4 | 12/1.5/1.4/6/4.3/1.5 |
| 0402430301 | 1339 | 2007-04-01 14:45:02 | 105.4 | 59.6 | S | 78.2 | 99.0 | 37.9 | 12/1.4/1.3/6/5/2 |
| 0402430701 | 1338 | 2007-03-30 21:05:17 | 34.2 | 24.4 | S | 84.6 | 105 | 39.8 | 12/1.5/1.4/6/4.3/2 |
| 0302884001 | 1236 | 2006-09-08 16:56:48 | 6.9 | 3.4 | D | 0.37 | 0.68 | 0.33 | 2/0/1.1/0.08/0.07/0.6 |
| 0302882601 | 1139 | 2006-02-27 04:04:34 | 6.9 | 4.0 | H | 8.02 | 13.7 | 6.28 | 4/0.001/1.2/0.9/0.6/5 |
| 0202670801 | 867 | 2004-09-02 03:01:39 | 135.2 | 75.2 | D | 0.21 | 0.38 | 0.18 | 0.65 |
| 0202670701 | 866 | 2004-08-31 03:12:01 | 135.2 | 81.8 | D | 0.20 | 0.28 | 0.12 | 0.6 |
| 0202670601 | 789 | 2004-03-30 14:46:36 | 134.4 | 27.2 | D | 0.37 | 0.68 | 0.33 | 0.6 |
| 0202670501 | 788 | 2004-03-28 15:03:52 | 133.0 | 13.7 | D | 0.23 | 0.44 | 0.22 | 0.6 |
| 0111350301 | 516 | 2002-10-03 06:54:11 | 17.3 | 7.6 | D | 0.44 | 0.87 | 0.43 | 0.55 |
| 0111350101 | 406 | 2002-02-26 03:16:43 | 52.8 | 35.8 | D | 0.11 | 0.19 | 0.09 | 0.6 |
| 0112972101 | 318 | 2001-09-04 01:20:42 | 26.7 | 18.2 | Q | 0.55 | |||
| XMM-Newton | phabs*power-law | phabs*diskbb | |||||||
| OBSID | STATE | NH | /dof | NH | TDBB | /dof | /dof | PL-BB | |
| ( cm-2) | ( cm-2) | (keV) | (no Fe K) | ||||||
| 0690441801 | H | 1347.5/1259 | 1372.9/1034 | -63.3 | |||||
| 0724210501 | S | 639.8/332 | 425.4/332 | 202.7/192 | 223.1 | ||||
| 0700980101 | S | 908.9/332 | 500.6/332 | 200.9/192 | 469.5 | ||||
| 0724210201 | S | 986.7/332 | 506.4/332 | 208.8/192 | 528.4 | ||||
| 0505670101 | S | 952.8/332 | 570.2/332 | 198.1/192 | 388.8 | ||||
| 0511000301 | S | 374.9/332 | 346.6/332 | 208.0/192 | 28.5 | ||||
| 0504940201 | S | 429.0/332 | 374.1/332 | 194.1/192 | 55.8 | ||||
| 0402430401 | S | 813.0/332 | 499.4/332 | 193.0/193 | 349.6 | ||||
| 0402430301 | S | 965.1/332 | 577.1/332 | 202.6/192 | 349.5 | ||||
| 0402430701 | S | 592.0/332 | 405.9/332 | 163.8/192 | 192.2 | ||||
| 0302882601 | H | 247.1/246 | 254.3/246 | -2.5 | |||||
| XMM-Newton | phabs*bbody*(gaus+gaus+gaus+gaus) | |||||||||
|---|---|---|---|---|---|---|---|---|---|---|
| OBSID | Fe xxv K | Fe xxvi K | Fe xxv K | Fe xxvi K | ||||||
| E (keV) | EW (eV) | E (keV) | EW (eV) | E (keV) | EW (eV) | E (keV) | EW (eV) | |||
| 0690441801 | H† | |||||||||
| 0724210501 | S | 319.1/324 | ||||||||
| 0700980101 | S | 327.2/324 | ||||||||
| 0724210201 | S | 379.8/324 | ||||||||
| 0505670101 | S | 348.3/324 | ||||||||
| 0402430401 | S | 321.8/324 | ||||||||
| 0402430301 | S | 339.3/324 | ||||||||
| 0402430701 | S | 287.4/324 | ||||||||