Once Upon a Crime: Towards Crime Prediction
from Demographics and Mobile Data
Abstract
In this paper, we present a novel approach to predict crime in a geographic space from multiple data sources, in particular mobile phone and demographic data. The main contribution of the proposed approach lies in using aggregated and anonymized human behavioral data derived from mobile network activity to tackle the crime prediction problem. While previous research efforts have used either background historical knowledge or offenders’ profiling, our findings support the hypothesis that aggregated human behavioral data captured from the mobile network infrastructure, in combination with basic demographic information, can be used to predict crime. In our experimental results with real crime data from London we obtain an accuracy of almost 70% when predicting whether a specific area in the city will be a crime hotspot or not. Moreover, we provide a discussion of the implications of our findings for data-driven crime analysis.
I. Introduction
Crime, in all its facets, is a well-known social problem affecting the quality of life and the economic development of a society. Studies have shown that crime tends to be associated with slower economic growth at both the national level [24] and the local level, such as cities and metropolitan areas [12]. Crime-related information has always attracted the attention of criminal law and sociology scholars. Dating back to the beginning of the 20th century, studies have focused on the behavioral evolution of criminals and its relations with specific characteristics of the neighborhoods in which they grew up, lived, and acted.
The study of the impact on behavioral development of factors like exposure to specific peer networks, neighborhood characteristics (e.g. presence/absence of recreational/educational facilities) and poverty indexes, has provided a wealth of knowledge from both individual and collective standpoints [44]. Existing works in the fields of criminology, sociology, psychology and economics tend to mainly explore relationships between criminal activity and socio-economic variables such as education [17], ethnicity [6], income level [26], and unemployment [19].
Several studies in criminology and sociology have provided evidence of significant concentrations of crime at micro levels of geography, regardless of the specific unit of analysis defined [7, 46]. It is important to note that such clustering of crime in small geographic areas (e.g. streets), commonly referred to as hotspots, does not necessarily align with trends that are occurring at a larger geographic level, such as communities. Research has shown, for example, that in what are generally seen as good parts of town there are often streets with strong crime concentrations, and in what are often defined as bad neighborhoods, many places are relatively free of crime [46].
In 2008, criminologist David Weisburd proposed to switch the popular people-centric paradigm of police practices to a place-centric one [45], thus focusing on geographical topology and micro-structures rather than on criminal profiling. In our paper, crime prediction is used in conjunction with a place-centric definition of the problem and with a data-driven approach: we specifically investigate the predictive power of aggregated and anonymized human behavioral data derived from a multimodal combination of mobile network activity and demographic information to determine whether a geographic area is likely to become a scene of the crime or not.
As the number of mobile phones actively in use worldwide approaches the 6.8 billion mark111http://www.itu.int, they become a very valuable and unobtrusive source of human behavioral data: mobile phones can be seen as sensors of aggregated human activity [14, 23] and have been used to monitor citizens’ mobility patterns and urban interactions [21, 48], to understand individual spending behaviors [33], to infer people’s traits [13, 37] and states [3], to map and model the spreading of diseases such as malaria [47] and H1N1 flu [20], and to predict and understand socio-economic indicators of territories [15, 36, 34]. Recently, Zheng et al. proposed a multi-source approach, based on human mobility and geographical data, to infer noise pollution [49] and gas consumption [29] in large metropolitan areas.
In this paper, we use human behavioral data derived from a combination of mobile network activity and demography, together with open data related to crime events to predict crime hotspots in specific neighborhoods of a European metropolis: London. The main contributions of this work are:
-
1.
The use of human behavioral data derived from anonymized and aggregated mobile network activity, combined with demographics, to predict crime hotspots in a European metropolis.
-
2.
A comprehensive analysis of the predictive power of the proposed model and a comparison with a state-of-the-art approach based on official statistics.
-
3.
A discussion of the theoretical and practical implications of our proposed approach.
This paper is structured as follows: section II describes relevant previous work in the area of data-driven crime prediction; the data used for our experiments are described in section III; the definition of the research problem tackled in this work and detailed information on the methodology adopted is provided in IV; finally, we report our experimental results and provide a discussion thereof in sections V and VI, respectively.
II. Related Work
Researchers have devoted attention to the study of criminal behavior dynamics both from a people- and place- centric perspective. The people-centric perspective has mostly been used for individual or collective criminal profiling. Wang et al. [42] proposed Series Finder, a machine learning approach to the problem of detecting specific patterns in crimes that are committed by the same offender or group of offenders. In [31], it is proposed a biased random walk model built upon empirical knowledge of criminal offenders behavior along with spatio-temporal crime information to take into account repeating patterns in historical crime data. Furthermore, Ratcliffe [28] investigated the spatio-temporal constraints underlying offenders’ criminal behavior.
An example of a place-centric perspective is crime hotspot detection and analysis and the consequent derivation of useful insights. A novel application of quantitative tools from mathematics, physics and signal processing has been proposed by Toole et al. [39] to analyse spatial and temporal patterns in criminal offense records. The analyses they conducted on a dataset containing crime information from 1991 to 1999 for the city of Philadelphia, US, indicated the existence of multi-scale complex relationships both in space and time. Using demographic information statistics at community (town) level, Buczak and Gifford [9] applied fuzzy association rule mining in order to derive a finite (and consistent among US states) set of rules to be applied by crime analysts. Other common models are the ones proposed by Eck et al. [16] and by Chainey et al. [11] that rely on kernel density estimation from the criminal history record of a geographical area. Similarly, Mohler et al. [25] applied the self-exciting point process model (previously developed for earthquake prediction) as a model of crime. The major problem of all these approaches is that they relies on the prior occurrence of crimes in a particular area and thus cannot generalize to previously unobserved areas.
More recently, the proliferation of social media has sparked interest in using this kind of data to predict a variety of variables, including electoral outcomes [40] and market trends [4]. In this line, Wang et al. [43] proposed the usage of social media to predict criminal incidents. Their approach relies on a semantic analysis of tweets using natural language processing along with spatio-temporal information derived from neighborhood demographic data and the tweets metadata.
In this paper, we tackle the crime hotspot forecasting problem by leveraging mobile network activity as a source of human behavioral data. Our work hence complements the above-mentioned research efforts and contributes to advance the state-of-the-art in quantitative criminal studies.
III. Datasets
The datasets we exploit in this paper were provided during a public competition - the Datathon for Social Good - organized by Telefónica Digital, The Open Data Institute and MIT during the Campus Party Europe 2013 at the O2 Arena in London in September 2013.
Participants were provided access to the following data, among others:
-
•
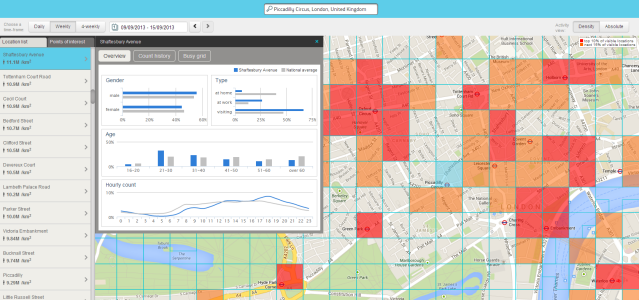
Anonymized and aggregated human behavioral data computed from mobile network activity in the London Metropolitan Area. We shall refer to this data as the Smartsteps dataset, because it was derived from Telefonica Digital’s Smartsteps product222http://dynamicinsights.telefonica.com/488/smart-steps. A sample visualization of the Smartsteps product can be seen in Figure 1;
-
•
Geo-localised Open Data, a collection of openly available datasets with varying temporal granularity. This includes reported criminal cases, residential property sales, transportation, weather and London borough profiles related to homelessness, households, housing market, local government finance and societal wellbeing (a total of 68 metrics).
We turn now to describing the specific datasets that we used to predict crime hotspots.
A. Smartsteps Dataset
The Smartsteps dataset consists of a geographic division of the London Metropolitan Area into cells whose precise location (lat,long) and surface area is provided. Note that the actual shape of the cell was not provided. In total, there were 124119 cells. We shall refer to these cells as the Smartsteps cells.
For each of the Smartsteps cells, a variety of demographic variables were provided, computed every hour for a 3-week period, from December 9th to 15th, 2012 and from December 23rd, 2012 to January 5th, 2013.
In particular:
(1) Footfall, or the estimated number of people within each cell. This estimation is derived from the mobile network activity by aggregating every hour the total number of unique phonecalls in each cell tower, mapping the cell tower coverage areas to the Smartsteps cells, and extrapolating to the general population –by taking into account the market share of the network in each cell location; and
(2) an estimation of gender, age and home/work/visitor group splits.
That is, for each Smartsteps cell and for each hour, the dataset contains an estimation of how many people are in the cell, the percentage of these people who are at home, at work or just visiting the cell and their gender and age splits in the following brackets: 0-20 years, 21-30 years, 31-40 years, etc…, as shown in Table 1.
| Type | Data |
|---|---|
| Origin-based | total # people |
| # residents | |
| # workers | |
| # visitors | |
| Gender-based | # males |
| # females | |
| Age-based | # people aged up to 20 |
| # people aged 21 to 30 | |
| # people aged 31 to 40 | |
| # people aged 41 to 50 | |
| # people aged 51 to 60 | |
| # people aged over 60 |
Figure 1 shows a sample visualization of the information made available from the SmartSteps platform.
B. Criminal Cases Dataset
The criminal cases dataset includes the geo-location of all reported crimes in the UK but does not specify their exact date, just the month and year. The data provided in the public competition included the criminal cases for December 2012 and January 2013.
In detail, the crime dataset includes: the crime ID, the month and year when the crime was committed, its location (longitude, latitude, and address where the crime took place), the police department involved, the lower layer super output area code, the lower layer super output area name and its type out of 11 possible types (e.g. anti-social behavior, burglary, violent crime, shoplifting, etc.).
Lower Layer Super Output Areas (LSOAs) are small geographical areas defined by the United Kingdom Office for National Statistics following the 2001 census. Their aim here is to define areas, based on population levels, whose boundaries would not change over time. LSOAs are the smallest type of output areas used for official statistics, have a mean population of 1,500 and a minimum population threshold of 1,000.
The ground truth crime data used in our experiments corresponds to the crimes reported in January 2013 for each of the Smartsteps cells.
C. London Borough Profiles Dataset
The London borough profiles dataset is an official open dataset containing 68 different metrics about the population of a particular geographic area. The spatial granularity of the bourough profiles data is at the LSOA level.
In particular, the information in this dataset includes statistics about the population, households (census), demographics, migrant population, ethnicity, language, employment, NEET (Not in Education, Employment, and Training) people, earnings, volunteering, jobs density, business survival, house prices, new homes, greenspace, recycling, carbon emissions, cars, indices of multiple deprivation, children in out-of-work families, life expectancy, teenage conceptions, happiness levels, political control (e.g. proportion of seats won by Labour, LibDem and Conservatives), and election turnout.
IV. Methodology
We cast the problem of crime hotspot forecasting as a binary classification task. For each Smartsteps cell, we predict whether that particular cell will be a crime hotspot or not in the next month. In this section we provide details of the experimental setup that we followed.
A. Data Preprocessing and Feature Extraction
Starting from the bulk of data described in Section III, we performed the following preprocessing steps.
A.1. Referencing all geo-tagged data to the Smartsteps cells
As the SmartSteps cell IDs, the borough profiles and the crime event locations are not spatially linked in the provided datasets, we first geo-referenced each crime event by identifying the Smartsteps cell which is the closest to the location of the crime. We carried out a similar process for the borough profile dataset. As a result, each crime event and the borough profile information were linked to one of the Smartsteps cells.
A.2. Smartsteps features
Diversity and regularity have been shown to be important in the characterization of different facets of human behavior and, in particular, the concept of entropy has been applied to assess the predictability of mobility [35] and spending patterns [22, 33], the socio-economic characteristics of places and cities [15] and some individual traits such as personality [13]. Hence, for each Smartsteps variable (see Table 1) we computed the mathematical functions which characterize the distributions and information theoretic properties of such variables, e.g. mean, median, standard deviation, min and max values and Shannon entropy.
In order to be able to also account for temporal relationships inside the Smartsteps data, the same computations as above were repeated on sliding windows of variable length (1-hour, 4-hour and 1 day), producing second-order features that help reduce computational complexity and the feature space itself, while preserving useful data properties.
A.3. London borough profile features
No data preprocessing was needed for the London borough profiles. Hence, we used the original 68 London borough profile features.
A.4. Crime hotspots ground-truth data
The distribution of the criminal cases data is reported in Table 2.
| Min. | Q1 | Median | Mean | Q3 | Max. |
|---|---|---|---|---|---|
| 1 | 2 | 5 | 8.2 | 10 | 289 |
Given the high skewness of the distribution (skewness = 5.88, kurtosis = 72.5, mean = 8.2, median = 5; see Table 2) and based on previous research on urban crime patterns [2], we split the criminal dataset with respect to its median into two classes: a low crime (class ’0’) when the number of crimes in the given cell was less or equal to the median, and a high crime (class ’1’) when the number of crimes in a given cell was larger than the median.
Following the empirical distribution, the two resulting classes are approximately balanced (53.15% for the high crime class).
B. Feature Selection
We randomly split all data into training (80% of data) and testing (20% of data) sets. In order to accelerate the convergence of the models, we normalized each dimension of the feature vector [5].
As an initial step, we carried out a Pearson correlation analysis to visualize and better understand the relationship between variables in the feature space. We found quite a large subset of features with strong mutual correlations and another subset of uncorrelated features. There was room, therefore, for feature space reduction. We excluded using principal component analysis (PCA) because the transformation it is based on produces new variables that are difficult to interpret in terms of the original ones, which complicates the interpretation of the results.
We turned to a pipelined variable selection approach, based on feature ranking and feature subset selection, which was perfomed using only data from the training set.
The metric used for feature ranking was the mean decrease in the Gini coefficient of inequality. This choice was motivated because it outperformed other metrics, such as mutual information, information gain and chi-square statistic with an average improvement of approximately 28.5%, 19% and 9.2% respectively [32]. The Gini coefficient ranges between , expressing perfect equality (all dimensions have the same predictive power) and , expressing maximal inequality in predictive power. The feature with maximum mean decrease in Gini coefficient is expected to have the maximum influence in minimizing the out-of-the-bag error. It is known in the literature that minimizing the out-of-the-bag error results in maximizing common performance metrics used to evaluate models (e.g. accuracy, F1, AUC, etc…) [41].
In the subsequent text and tables this metric is presented as a percentage.
The feature selection process produced a reduced subset of 68 features (from an initial pool of about 6000 features), with a reduction in dimensionality of about 90 times with respect to the full feature space. The top 20 features selected by the model are included in Table 4.
C. Model Building
We trained a variety of classifiers on the training data following 5-fold cross validation strategy: logistic regression, support vector machines, neural networks, decision trees, and different implementations of ensembles of tree classifiers with different parameters.
The decision tree classifier based on the Breiman’s Random Forest (RF) algorithm yielded the best performance when compared to all other classifiers. Hence, we report the performance results only for the the best model, based on this algorithm.
We took advantage of the well-known performance improvements that are obtained by growing an ensemble of trees and voting for the most frequent class. Random vectors were generated before the growth of each tree in the ensemble, and a random selection without replacement was performed [8].
The consistency of the random forest algorithm has been proven and the algorithm adapts to sparsity in the sense that the rate of convergence depends only on the number of strong features and not on the number of noisy or less relevant ones [1].
V. Experimental Results
In this section we report the experimental results obtained by the Random Forest trained on different subsets of the selected features and always on the test set, which was not used during the training phase in any way.
The performance metrics used to evaluate our approach are: accuracy, F1, and AUC score. As can be seen on Table 3, the model achieves almost 70% accuracy when predicting whether a particular Smartsteps cell will be a crime hotspot in the following month or not. Table 3 includes all performance metrics obtained by our model.
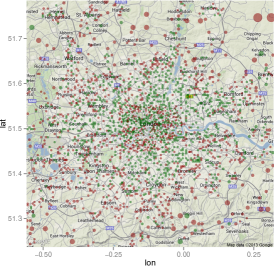
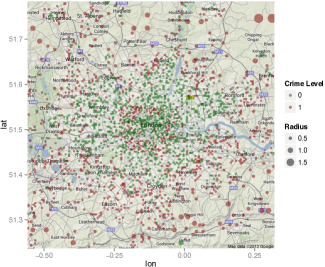
A spatial visualisation of our results is reported on a map of the London metropolitan area in Figure 3 and compared with a similar visualisation of the ground truth labels in Figure 3. In the maps, green represents ”low crime level” and red ”high crime level”.
Second order features, which we introduced to capture intertemporal dependencies for our problem, not only made the feature space more compact, but also yielded a significant improvement in model performance metrics.
In order to understand the value added by the Smartsteps data, we compared the performance of the Random Forest using all features with two different models trained with (i) only the subset of selected features derived from the borough profiles dataset (Borough Profiles) and (ii) only the subset of selected features derived from the Smartsteps dataset (Smartsteps).
Table 3 reports accuracy, F1, and the area under the ROC curve metrics for each of the models. In this Table, we also report the performance of (iii) a simple majority classifier, which always returns the majority class (”High Crime”) as prediction (accuracy=53.15%).
As can be seen on Table 3, the borough-only model yields an accuracy of 62.18%, over 6% lower than the accuracy obtained with the Smartsteps model (68.37%). The Smartsteps+Borough model yields an increase in accuracy of over 7% when compared with the borough profiles model (69.54% vs 62.18% accuracy) while using the same number of variables.
| Model | Acc.,% | Acc. CI, 95% | F1,% | AUC |
|---|---|---|---|---|
| Baseline Majority Classifier | 53.15 | (0.53, 0.53) | 0 | 0.50 |
| Borough Profiles Model (BPM) | 62.18 | (0.61, 0.64) | 57.52 | 0.58 |
| Smartsteps | 68.37 | (0.67, 0.70) | 65.43 | 0.63 |
| Smartsteps + BPM | 69.54 | (0.68, 0.71) | 67.23 | 0.64 |
| Rank | Features | 0 | 1 | MeanDecreaseAccuracy | MeanDecreaseGini |
|---|---|---|---|---|---|
| 1 | smartSteps.daily.ageover60.entropy.empirical.entropy.empirical | 4.48 | 5.43 | 9.02 | 18.75 |
| 2 | smartSteps.daily.athome.mean.sd | 3.20 | 7.60 | 8.91 | 27.13 |
| 3 | smartSteps.daily.age020.sd.entropy.empirical | 5.69 | 3.97 | 8.85 | 16.88 |
| 4 | smartSteps.daily.age020.mean.entropy.empirical | 3.09 | 5.88 | 8.85 | 17.26 |
| 5 | smartSteps.daily.age020.mean.sd | 4.50 | 5.27 | 8.65 | 16.03 |
| 6 | smartSteps.daily.athome.min.entropy.empirical | 6.39 | 2.32 | 8.61 | 15.99 |
| 7 | smartSteps.daily.athome.sd.sd | 3.22 | 8.58 | 8.60 | 45.82 |
| 8 | smartSteps.daily.athome.sd.mean | 3.35 | 5.83 | 8.57 | 24.93 |
| 9 | smartSteps.daily.ageover60.entropy.empirical.sd | 4.62 | 4.95 | 8.56 | 20.45 |
| 10 | smartSteps.daily.athome.sd.median | 5.41 | 5.04 | 8.50 | 26.48 |
| 11 | smartSteps.daily.age3140.entropy.empirical.max | 2.33 | 5.79 | 8.44 | 16.24 |
| 12 | smartSteps.daily.age3140.min.sd | 6.81 | 4.06 | 8.31 | 36.52 |
| 13 | smartSteps.daily.athome.min.sd | 4.36 | 6.85 | 8.29 | 34.26 |
| 14 | smartSteps.daily.athome.sd.max | 4.13 | 6.87 | 8.27 | 34.89 |
| 15 | smartSteps.monthly.athome.max | 3.92 | 5.42 | 8.26 | 29.86 |
| 16 | smartSteps.monthly.athome.sd | 4.43 | 4.17 | 8.21 | 39.70 |
| 17 | smartSteps.daily.age5160.entropy.empirical.entropy.empirical | 4.74 | 4.11 | 8.13 | 16.64 |
| 18 | smartSteps.daily.age020.sd.sd | 3.67 | 5.88 | 8.12 | 16.86 |
| 19 | smartSteps.daily.athome.entropy.empirical.entropy.empirical | 5.13 | 4.82 | 8.08 | 18.55 |
| 20 | smartSteps.daily.athome.max.sd | 2.83 | 6.29 | 8.07 | 26.85 |
VI. Discussion
The results discussed in the previous section show that usage of human behavioral data (at a daily and monthly scale) significantly improves prediction accuracy when compared to using rich statistical data about a borough’s population (households census, demographics, migrant population, ethnicity, language, employment, etc…). The borough profiles data provides a fairly detailed view of the nature and living conditions of a particular area in a city, yet it is expensive and effort-consuming to collect. Hence, this type of data is typically updated with low frequency (e.g. every few years). Human behavioral data derived from mobile network activity and demographics, though less comprehensive than borough profiles, provides significantly finer temporal and spatial resolution.
Next, we focus on the most relevant predictors of crime level which show interesting associations. We first take a look at the top-20 variables in our model, which are sorted by their mean reduction in accuracy (see Table 4).
The naming convention that we used for the features shown in Table 4 is: the original data source (e.g. ”smartSteps”) is followed by the temporal granularity (e.g. ”daily”), the semantics of the variable (e.g. ”athome”), and its statistics at (e.g. ”mean”). Note that second order features where we computed statistics across multiple days appear after the first statistics. For example, feature 2 in the Table, ”smartSteps.daily.athome.mean.sd”, is generated by computing the standard deviation of the daily means of the percentage of people estimated to be at home.
As shown in the Table, the Smartsteps features have more predictive power than official statistics coming from borough profiles. No features listed in the top-20 are actually obtained using borough profiles. Moreover, Table 4 shows that higher-level features extracted over a sequence of days from variables encoding the daily dynamics (all features with the label smartSteps.daily.*) have more predictive power than features extracted on a monthly basis. For example, feature 2 in Table 4. This finding points out at the importance of capturing the temporal dynamics of a geographical area in order to predict its levels of crime.
Furthermore, features derived from the percentage of people in a certain cell who are at home (all features with .athome. in their label) both at a daily and monthly basis seem to be of extreme importance. In fact, 11 of the top 20 features are related to the at home variable.
It is also interesting to note the role played by diversity patterns captured by Shannon entropy features [30]. The entropy-based features (all features with .entropy. in their label) in fact seem useful for predicting the crime level of places (8 features out of the top 20 are entropy-based features). In our study, the Shannon entropy captures the predictable structure of a place in terms of the types of people that are in that area over the course of a day. A place with high entropy would have a lot of variety in the types of people visiting it on a daily basis, whereas a place with low entropy would be characterised by regular patterns over time. In this case, the daily diversity in patterns related to different age groups, different use (home vs work) and different genders seems a good predictor for the crime level in a given area. Interestingly, Eagle et al. [15] found that Shannon entropy used to capture the social and spatial diversity of communication ties within an individual’s social network was strongly and positively correlated with economic development.
As previously described, borough profile features (official statistics) have lower predictive power with respect to accuracy than features extracted from aggregated mobile network activity data. Six borough profile features were selected in the final feature vector, including the proportion of the working age population who claim out of work benefits, the largest migrant population, the proportion of overseas nationals entering the UK and the proportion of resident population born abroad –metrics based on 2011 Census Bureau data. The predictive power of some of these variables is in line with previous studies in sociology and criminology. For example, several studies show a positive association among unemployment rate and crime level of an area [27]. Still under debate is the positive association among number of immigrants and crime level [18]. However, our experimental results show that the static nature of these variables makes them less useful in predicting crime level’s of a given area when compared with less detailed but daily information about the types of people present in a same area throughout the day.
VII. Implications and Limitations
We have outlined and tested a multimodal approach to automatically predict with almost 70% accuracy whether a given geographical area will have high or low crime levels in the next month. The proposed approach could have clear practical implications by informing police departments and city governments on how and where to invest their efforts and on how to react to criminal events with quicker response times. From a proactive perspective, the ability to predict the safety of a geographical area may provide information on explanatory variables that can be used to identify underlying causes of these crime occurrence areas and hence enable officers to intervene in very narrowly defined geographic areas.
The distinctive characteristic of our approach lies in the use of features computed from aggregated and anonymized mobile network activity data in combination with some demographic information. Previous research efforts in criminology have tackled similar problems using background historical knowledge about crime events in specific areas, criminals’ profiling, or wide description of areas using socio-economic and demographic indicators. Our findings provide evidence that aggregated and anonymized data collected by the mobile infrastructure contains relevant information to describe a geographical area in order to predict its crime level.
The first advantage of our approach is its predictive ability. Our method predicts crime level using variables that capture the dynamics and characteristics of the demographics and nature of a place rather than only making extrapolations from previous crime histories. Operationally, this means that the proposed model could be used to predict new crime occurrence areas that are of similar nature to other well known occurrence areas. Even though the newly predicted areas may not have seen recent crimes, if they are similar enough to prior ones, they could be considered to be high-risk areas to monitor closely. This is an important advantage given that in some areas people are less inclined to report crimes [38]. Moreover, our approach provides new ways of describing geographical areas. Recently, some criminologists have started to use risk terrain modeling [10] to identify geographic features that contribute to crime risk, e.g. the presence of liquor stores, certain types of major stores, bars, etc. Our approach can identify novel risk-inducing or risk-reducing features of geographical areas. In particular, the features used in our approach are dynamic and related to human activities.
Our study has several limitations due to the constraints of the datasets used. First of all, we had access only to 3 weeks of Smartsteps data collected between December 2012 and the first week of January 2013. In addition, the crime data provided was aggregated on a monthly basis. Having access to crime events aggregated on a weekly, daily or hourly basis would enable us to validate our approach with finer times granularity, predicting crimes in the next week, day or even hour.
VIII. Conclusion
In this paper we have proposed a novel approach to predict crime hotspots from human behavioral data derived from mobile network activity, in combination with demographic information. Specifically, we have described a methodology to automatically predict with almost 70% of accuracy whether a given geographical area of a large European metropolis will have high or low crime levels in the next month. We have shown that our approach, while using a similar number of variables, significantly improves prediction accuracy (6%) when compared with using traditional, rich –yet expensive to collect– statistical data about a borough’s population. Moreover, we have provided insights about the most predictive features (e.g. home-based and entropy-based features) and we have discussed the theoretical and practical implications of our methodology. Despite the limitations discussed above and the additional investigations needed to validate our approach and the robustness of our indicators, we believe that our findings open the door to exciting avenues of research in computational approaches to deal with a well-known social problem such as crime.
IX. Acknowledgments
Source data processing, reported data transformations and feature selection, which were derived from anonymised and aggregated mobile network dataset, provided by Telefónica Digital Limited were done only during the public competition – “Datathon for Social Good” organized by Telefónica, The Open Data Institute and the MIT during the Campus Party Europe 2013 at the O2 Arena in London during 2-7 September 2013, in full compliance with the competition rules and legal limitations imposed by the “Terms and Conditions” document.
The work of Andrey Bogomolov is partially supported by EIT ICT Labs Doctoral School grant and Telecom Italia Semantics and Knowledge Innovation Laboratory (SKIL) research grant T.
References
- [1] G. Biau. Analysis of a random forests model. The Journal of Machine Learning Research, 98888(1):1063–1095, 2012.
- [2] S. L. Boggs. Urban crime patterns. American Sociological Review, 30(6):pp. 899–908, 1965.
- [3] A. Bogomolov, B. Lepri, and F. Pianesi. Happiness recognition from mobile phone data. In SocialCom 2013, pages 790–795, 2013.
- [4] J. Bollen, H. Mao, and X. Zeng. Twitter mood predicts the stock market. Journal of Computational Science, 2(1):1–8, 2011.
- [5] G. E. P. Box and D. R. Cox. An Analysis of Transformations. Journal of the Royal Statistical Society. Series B (Methodological), 26(2):211–252, 1964.
- [6] J. Braithwaite. Crime, Shame and Reintegration. Ambridge: Cambridge University Press, 1989.
- [7] P. L. Brantingham and P. J. Brantingham. A theoretical model of crime hot spot generation. Studies on Crime & Crime Prevention, 1999.
- [8] L. Breiman. Bagging predictors. Machine Learning, 24(2):123–140, 1996.
- [9] A. L. Buczak and C. M. Gifford. Fuzzy association rule mining for community crime pattern discovery. In ACM SIGKDD Workshop on Intelligence and Security Informatics, page 2. ACM, 2010.
- [10] J. Caplan and L. Kennedy. Risk terrain modeling manual: Theoretical framework and technical steps of spatial risk assessment for crime analysis. Rutgers Center on Public Security, 2010.
- [11] S. Chainey, L. Tompson, and S. Uhlig. The utility of hotspot mapping for predicting spatial patterns of crime. Security Journal, 21:4–28, 2008.
- [12] J. Cullen and S. Levitt. Crime, urban flight, and the consequences for the cities. Review of Economics and Statistics, (81):159–169, 2009.
- [13] Y.-A. de Montjoye, J. Quoidbach, F. Robic, and A. Pentland. Predicting personality using novel mobile phone-based metrics. In Social Computing, Behavioral-Cultural Modeling and Prediction, pages 48–55. Springer, 2013.
- [14] W. Dong, B. Lepri, and A. Pentland. Modeling the co-evolution of behaviors and social relationships using mobile phone data. In MUM 2011, 2011.
- [15] N. Eagle, M. Macy, and R. Claxton. Network diversity and economic development. Science, 328(5981):1029–1031, 2010.
- [16] J. Eck, S. Chainey, J. Cameron, and R. Wilson. Mapping crime: understanding hotspots. National Institute of Justice: Washington DC, 2005.
- [17] I. Ehrlich. On the relation between education and crime. 1975.
- [18] L. Ellis, K. Beaver, and J. Wright. Handbook of crime correlates. Academic Press, 2009.
- [19] R. B. Freeman. The economics of crime. Handbook of labor economics, 3:3529–3571, 1999.
- [20] E. Frias-Martinez, G. Williamson, and V. Frias-Martinez. An agent-based model of epidemic spread using human mobility and social network information. In Social Computing (SocialCom), 2011 International Conference on, pages 57–64. IEEE, 2011.
- [21] M. Gonzalez, C. Hidalgo, and L. Barabasi. Understanding individual mobility patterns. Nature, 453(7196):779–782, 2008.
- [22] C. Krumme, A. Llorente, M. Cebrian, A. Pentland, and E. Moro. The predictability of consumer visitation patterns. Scientific Reports, (1645), 2013.
- [23] J. Laurila, D. Gatica-Perez, I. Aad, J. Blom, O. Bornet, T. Do, O. Dousse, J. Eberle, and M. Miettinen. From big smartphone data to worldwide research: The mobile data challenge. Pervasive and Mobile Computing, 9:752–771, 2013.
- [24] H. Mehlum, K. Moene, and R. Torvik. Crime induced poverty traps. Journal of Development Economics, (77):325–340, 2005.
- [25] G. Mohler, M. Short, P. Brantingham, F. Schoenberg, and G. Tita. Self-exciting point process modeling of crime. Journal of the American Statistical Association, (106):100–108, 2011.
- [26] E. B. Patterson. Poverty, income inequality, and community crime rates. Criminology, 29(4):755–776, 1991.
- [27] S. Raphael and R. Winter-Ebmer. Identifying the effect of unemployment on crime. Journal of Law and Economics, 44(1), 2001.
- [28] J. H. Ratcliffe. A temporal constraint theory to explain opportunity-based spatial offending patterns. Journal of Research in Crime and Delinquency, 43(3):261–291, 2006.
- [29] J. Shang, T. W. Zheng, Y., and E. Chang. Inferring gas consumption and pollution emission of vehicles throughout a city. In KDD 2014, 2014.
- [30] C. Shannon. A mathematical theory of communication. Bell System Technical Journal, 27:379–423, 623–656, July, October 1948.
- [31] M. B. Short, M. R. D’Orsogna, V. B. Pasour, G. E. Tita, P. J. Brantingham, A. L. Bertozzi, and L. B. Chayes. A statistical model of criminal behavior. Mathematical Models and Methods in Applied Sciences, 18(supp01):1249–1267, 2008.
- [32] S. R. Singh, H. A. Murthy, and T. A. Gonsalves. Feature selection for text classification based on gini coefficient of inequality. Journal of Machine Learning Research-Proceedings Track, 10:76–85, 2010.
- [33] V. K. Singh, L. Freeman, B. Lepri, and A. S. Pentland. Predicting spending behavior using socio-mobile features. In Social Computing (SocialCom), 2013 International Conference on, pages 174–179. IEEE, 2013.
- [34] C. Smith-Clarke, A. Mashhadi, and L. Capra. Poverty on the cheap: Estimating poverty maps using aggregated mobile communication networks. In 32nd ACM Conference on Human Factors in Computing Systems (CHI2014), 2014.
- [35] C. Song, Z. Qu, N. Blumm, and A. Barabasi. Limits of predictability in human mobility. Science, (327):1018–1021, 2010.
- [36] V. Soto, V. Frias-Martinez, J. Virseda, and E. Frias-Martinez. Prediction of socioeconomic levels using cell phone records. In UMAP 2011, pages 377–388, 2011.
- [37] J. Staiano, B. Lepri, N. Aharony, F. Pianesi, N. Sebe, and A. Pentland. Friends don’t lie - inferring personality traits from social network structure. In ACM Ubicomp 2012, pages 321–330, 2012.
- [38] R. Tarling and K. Morris. Reporting crime to the police. British Journal of Criminology, (50):474–479, 2010.
- [39] J. L. Toole, N. Eagle, and J. B. Plotkin. Spatiotemporal correlations in criminal offense records. ACM Trans. Intell. Syst. Technol., 2(4):38:1–38:18, July 2011.
- [40] A. Tumasjan, T. O. Sprenger, P. G. Sandner, and I. M. Welpe. Predicting elections with twitter: What 140 characters reveal about political sentiment. ICWSM, 10:178–185, 2010.
- [41] E. Tuv, A. Borisov, G. Runger, and K. Torkkola. Feature selection with ensembles, artificial variables, and redundancy elimination. The Journal of Machine Learning Research, 10:1341–1366, 2009.
- [42] T. Wang, C. Rudin, D. Wagner, and R. Sevieri. Learning to detect patterns of crime. In Machine Learning and Knowledge Discovery in Databases, pages 515–530. Springer, 2013.
- [43] X. Wang, M. S. Gerber, and D. E. Brown. Automatic crime prediction using events extracted from twitter posts. In Social Computing, Behavioral-Cultural Modeling and Prediction, pages 231–238. Springer, 2012.
- [44] S. K. Weinberg. Theories of criminality and problems of prediction. The Journal of Criminal Law, Criminology, and Police Science, 45(4):412–424, 1954.
- [45] D. Weisburd. Place-based policing. Ideas in American Policing, 9:1–16, 2008.
- [46] D. Weisburd and L. Green. Defining the street-level drug market. 1994.
- [47] A. Wesolowski, N. Eagle, A. Tatem, D. Smith, R. Noor, and C. Buckee. Quantifying the impact of human mobility on malaria. Science, 338(6104):267–270, 2012.
- [48] Y. Zheng, L. Capra, O. Wolfson, and H. Yang. Urban computing: concepts, methodologies, and applications. ACM Transaction on Intelligent Systems and Technology, 2014.
- [49] Y. Zheng, T. Liu, Y. Wang, Y. Liu, Y. Zhu, and E. Chang. Diagnosing new york city’s noises with ubiquitous data. In ACM Ubicomp 2014, 2014.