33email: jma20@st-andrews.ac.uk 44institutetext: Jeremiah Horrocks Institute, University of Central Lancashire, PR1 2HE Preston, UK 55institutetext: Dipartimento di Fisica e Astronomia ‘G. Galilei’, Università di Padova, vicolo dell’Osservatorio 3, I-35122 Padova, Italy 66institutetext: INAF - Osservatorio Astronomico di Padova, vicolo dell’Osservatorio 5, I-35122 Padova, Italy
Secular- and merger-built bulges in barred galaxies
Abstract
Context. Historically, galaxy bulges were thought of single-component objects at the center of galaxies. However, this picture is now questioned since different bulge types, namely classical and pseudobulges, with different formation paths have been found coexisting within the same galaxy.
Aims. We study the incidence, as well as the nature, of composite bulges in a sample of 10 face-on barred galaxies to constrain the formation and evolutionary processes of the central regions of disk galaxies.
Methods. We analyze the morphological, photometric, and kinematic properties of each bulge. Then, by using a case-by-case analysis we identify composite bulges and classify every component into a classical or pseudobulge. In addition, bar-related boxy/peanut (B/P) structures were also identified and characterized.
Results. We find only three galaxies hosting a single-component bulge (two pseudobulges and one classical bulge). Thus, we demonstrate the high incidence of composite bulges (70%) in barred galaxies. We find evidence of composite bulges coming in two main types based on their formation: secular-built and merger- and secular-built. We call secular-built to composite bulges made of entirely by structures associated with secular processes such as pseudobulges, central disks, or B/P bulges. We find four composite bulges of this kind in our sample. On the other hand, merger- and secular-built bulges are those where structures with different formation paths coexist within the same galaxy, i.e., a classical bulge coexisting with a secular-built structure (pseudobulge, central disk, or B/P). Three bulges of this kind were found in the sample. We remark on the importance of detecting kinematic structures such as drops to identify composite bulges. A large fraction (80%) of galaxies were found to host drops or plateaus in our sample revealing their high incidence in barred galaxies.
Conclusions. The high frequency of composite bulges in barred galaxies points towards a complex formation and evolutionary scenario. Moreover, the evidence for coexisting merger- and secular-built bulges reinforce this idea. We discuss how the presence of different bulge types, with different formation histories and timescales, can constrain current models of bulge formation.
Key Words.:
Galaxies: bulges – Galaxies: evolution – Galaxies: formation – Galaxies: kinematics and dynamics – Galaxies: photometry – Galaxies: structure1 Introduction
The central role of the bulges of disk galaxies on our understanding of galaxy formation and evolution is a generally accepted fact. The bulge prominence is the main feature by which galaxies are classified into Hubble types, accounting for more than one quarter of the stellar mass budget in the local Universe (Driver et al., 2007; Gadotti, 2009). Bulges influence the size, strength, and incidence of bars (Sellwood, 1981; Laurikainen et al., 2009; Aguerri et al., 2009), which in turn have a profound effect on the rest of the stellar and gaseous mass distribution. Bulges host central supermassive black holes, which themselves influence galaxy evolution and star formation (Springel et al., 2005). Remarkably, the mass of the supermassive black hole correlates with the random motions of stars in the bulge (Gebhardt et al., 2000), suggesting that these objects of vastly different scales somehow regulate each other (but see Kormendy et al., 2011). However, despite their importance, questions such as how much of their observed morphology is due to fast/long-term processes or how much is due to internal/external evolution remain unanswered. In fact, these different formation processes are reflected in the two types of bulges which are thought to exists: classical and disk-like bulges.
Classical bulges can be formed via dissipative collapse of protogalactic gas clouds (Eggen et al., 1962) or by the coalescence of giant clumps in primordial disks (Bournaud et al., 2007). On the other hand, they could also grow out of disk material externally triggered by satellite accretion during minor merging events (Aguerri et al., 2001; Eliche-Moral et al., 2006) or by galaxy mergers (Kauffmann, 1996) with different merger histories (Hopkins et al., 2010). Extreme cases of polar bulges sticking out from the disk plane have also been observed (Corsini et al., 2012, and references therein). Observationally, the surface-brightness distribution of classical bulges generally follows a de Vaucouleurs law (Andredakis et al., 1995). They appear rounder than their associated disks and their kinematics are well described by rotationally flattened oblate spheroids with little or no anisotropy (Kormendy & Illingworth, 1982). In addition, they have photometric and kinematic properties which satisfy the fundamental plane (FP) correlation (Bender et al., 1992; Falcón-Barroso et al., 2002; Aguerri et al., 2005).
Disk-like bulges (also known as pseudobulges) are thought to be the products of secular processes driven by bars (see Kormendy & Kennicutt, 2004). Bars are ubiquitous in disk galaxies (Aguerri et al., 2009). They are efficient mechanisms for driving gas inward to the galactic center triggering central star formation generally associated with a pseudobulge. Nevertheless, Eliche-Moral et al. (2011) recently proposed that pseudobulges might also be created by the secular accretion of low-density satellites into the main galaxy, thus providing an alternative to bar-driven growth of pseudobulges. Observationally, pseudobulges have an almost exponential surface-brightness distribution (Fisher & Drory, 2008), and they are mainly oblate spheroids (Méndez-Abreu et al., 2010) with apparent flattenings similar to their associated disks. Pseudobulges rotate as fast as disks and usually deviate from the FP (Carollo, 1999).
Other central structures usually referred to as bulges include boxy/peanut (B/P) bulges. It is nowadays well established that these are structures related to the secular evolution of bars (Combes & Sanders, 1981; Chung & Bureau, 2004). As bars evolve, stars can be moved perpendicular to the disk plane due to a coherent bending of the bar producing its characteristic shape (Debattista et al., 2004; Martinez-Valpuesta et al., 2006). Therefore, B/P structures share the photometric and kinematic properties of bars (Méndez-Abreu et al., 2008b; Erwin & Debattista, 2013).
Mixed types of classical and pseudobulges can also occur in the same galaxy (Athanassoula, 2005; Gadotti, 2009; Nowak et al., 2010; Kormendy & Barentine, 2010). Furthermore, their combination with B/P structures in barred galaxies is also expected. The frequency of these composite bulges is still not well-determined, and, more puzzlingly, different combinations of bulge types can successfully explain observations (de Lorenzo-Cáceres et al., 2012). Besides bulges, a variety of structures present in the center of disk galaxies have been found: nuclear stellar disks, characterized by a smaller scale-length and higher central surface-brightness with respect to the large kiloparsec scale disks typical of lenticular and spiral galaxies (see Morelli et al., 2010, and references therein); nuclear clusters, are common structures in late Hubble types with linear scales from a few up to 20 pc (Böker et al., 2002; Seth et al., 2006); and nuclear bars, subkiloparsec scale bars usually lying inside typical large galactic bars (Prieto et al., 1997; Laine et al., 2002; Erwin, 2004). This complex picture of the central regions of disk galaxies, containing several structural and kinematic components formed through very different mechanisms, further complicate the identification of different bulge types.
One promising path to uncover the real nature of bulges in disk galaxies is through the combination of structural and kinematic diagnostics. Thus far, the most commonly used diagnostic to distinguish bulge types was based only on the photometry, assuming that light profiles of classical bulges are better described by a Sérsic profile with , whereas pseudobulges should have (Fisher & Drory, 2008). Recently, Fabricius et al. (2012) studied the photometric and kinematic properties for a sample of 45 bulges in disk galaxies. They demonstrate that these combined properties are useful to distinguish classical from pseudobulges even if some unclear cases are still present.
In this paper we present intermediate-resolution kinematics and structural properties of 10 face-on barred galaxies. We use this information to reveal the nature of the different components present in the galaxy centers, and more specifically the nature of their bulges. Kinematic measurements of face-on galaxies, and in particular of barred galaxies are rare in the literature (but see Bershady et al., 2010). They are usually avoided since problems due to the effects of projection on the velocity rotation curves are difficult to overcome. However, stellar kinematic measurements of face-on galaxies provide access to the vertical component of both the velocity ellipsoid and higher order moments of the line of sight velocity distribution (LOSVD) providing new hints to the identification and understanding of galaxy structural components.
The paper is organized as follow: Sect. 2 describes the sample selection. Sects. 3 and 4 detail the observations, data reduction and analysis of the photometric and spectroscopic data, respectively. Sect. 5 presents the analysis of the structural and kinematic properties of the bulges. Sect. 6 describes the different bulge types present in our sample. The conclusions are given in Sect. 7. Appendix A summarizes the main characteristics of each sample galaxy. Throughout the article we assume a flat cosmology with = 0.3, = 0.7, and a Hubble constant = 70 km s-1 Mpc-1.
2 Sample selection
The sample of face-on barred galaxies was selected from the NASA/IPAC Extragalactic Database (NED) as bright () and undisturbed objects, with a disk inclination lower than , a bar length larger than to avoid seeing effects, a disk diameter smaller than to allow an accurate spectroscopic sky subtraction, no strong evidence of dust and no bright foreground stars in the Digitized Sky Survey (DSS) image. To define the final galaxy sample, their disk inclinations, bar lengths, and bar position angles were first determined from ellipse fits to the Two-Microns All Sky Survey (2MASS) Large Galaxy Atlas (Jarrett et al., 2003) band archival images following the method described in Aguerri et al. (2009). The main properties of the sample galaxies are given in Table 1.
| Galaxy | RA | DEC | Morph. Type | ||
|---|---|---|---|---|---|
| (h:m:s) | (∘:’:”) | (∘) | |||
| (1) | (2) | (3) | (4) | (5) | (6) |
| IC 1815 | 02:34:20.0 | +32:25:46 | SB0 | 0.0157 | 30 |
| NGC 0043 | 00:13:00.7 | +30:54:55 | SB0 | 0.0160 | 25 |
| NGC 0098 | 00:22:49.5 | -45:16:08 | SB(r)bc | 0.0206 | 22 |
| NGC 0175 | 00:37:21.5 | -19:56:03 | SB(r)ab | 0.0130 | 20 |
| NGC 0521 | 01:24:33.8 | +01:43:53 | SB(r)bc | 0.0167 | 14 |
| NGC 0621 | 01:36:49.0 | +35:30:44 | SB0 | 0.0172 | 34 |
| NGC 1640 | 04:42:14.5 | -20:26:05 | SB(r)b | 0.0054 | 20 |
| NGC 2493 | 08:00:23.6 | +39:49:50 | SB0 | 0.0130 | 20 |
| NGC 4477 | 12:30:02.2 | +13:38:12 | SB(s)0:? | 0.0045 | 27 |
| NGC 4838 | 12:57:56.1 | -13:03:36 | (R’)SB(r)b: | 0.0167 | 22 |
3 Surface photometry
3.1 Observations and data reduction
Imaging of the sample galaxies was obtained from three different sources (see Table 2): the Sloan Digital Sky Survey Data Release 8 (SDSS-DR8; Aihara et al., 2011), the acquisition images taken at the time of the spectroscopic observations at the Very Large Telescope (VLT), and 2MASS (Skrutskie et al., 2006).
For the purpose of this paper, we preferred to use the images from the SDSS since they are well calibrated and with sufficient resolution and depth to safely obtain an accurate photometric decomposition. Unfortunately, they were only available for 5 galaxies in our sample. In our analysis we used the band images.
When the SDSS images were not available, we analyzed the uncalibrated acquisition images from the VLT. The acquisition images were deliberately taken using the band Bessel filter and with an exposure time usually of a few minutes. We reduced this data using the bias and dome flat-field images available for the corresponding nights, however, the photometric calibration was not performed due to the lack of photometric standards stars. It is worth noting that absolute calibration is not necessary to obtain the galaxy structural parameters used in this work. Three galaxies (NGC 0098, NGC 1640, and NGC 4838) of the sample were analyzed using these images.
For the remaining two galaxies (IC 1815 and NGC 0621) we use the band images available in the 2MASS survey. Even though the image quality and depth of these images is clearly poorer than the previous ones, in Méndez-Abreu et al. (2008a) we already demonstrated the usefulness of 2MASS imaging for photometric decompositions of bright galaxies such as those in this work. Therefore, for the sake of completeness, and after a careful visual inspection of the fits and the residuals, we included the corresponding analysis in the present study.
| Galaxy | Filter | Source | FWHM |
|---|---|---|---|
| (″) | |||
| (1) | (2) | (3) | (4) |
| IC 1815 | 2MASS | 3.1 | |
| NGC 0043 | SDSS | 1.2 | |
| NGC 0098 | VLT | 0.7 | |
| NGC 0175 | SDSS | 1.2 | |
| NGC 0521 | SDSS | 0.8 | |
| NGC 0621 | 2MASS | 2.9 | |
| NGC 1640 | VLT | 0.7 | |
| NGC 2493 | SDSS | 1.1 | |
| NGC 4477 | SDSS | 1.2 | |
| NGC 4838 | VLT | 0.8 |
3.2 Photometric decomposition
The structural parameters of the sample galaxies were derived by applying a two-dimensional photometric decomposition to the galaxy images previously described. Several codes are available to perform photometric decompositions such as GALFIT (Peng et al., 2002), GIM2D (Simard et al., 2002), or BUDDA (de Souza et al., 2004). We used the GASP2D algorithm developed by Méndez-Abreu et al. (2008a). We will briefly describe in the following the main characteristics of GASP2D. The galaxy surface-brightness distribution (SBD) was assumed to be the sum of a bulge, disk, and bar component. No other additional components such as lenses or ovals present in a fraction of bar galaxies (Prieto et al., 2001; Laurikainen et al., 2009) were considered in our photometric decomposition.
The Sérsic law (Sérsic, 1968), also known as the law or generalized de Vaucouleurs law, was adopted to describe the surface brightness of the bulge component
| (1) |
where is the radius measured in the Cartesian coordinates describing the reference system of the bulge in the plane of the sky. , , and are the effective (or half-light) radius, the surface brightness at , and a shape parameter describing the curvature of the SBD, respectively, and (Caon et al., 1993). The bulge isophotes are ellipses centered on the galaxy center (, ), with constant position angle and constant axial ratio .
The SBD of the disk component was assumed to follow an exponential law (Freeman, 1970)
| (2) |
where is the radius measured in the Cartesian coordinates describing the reference system of the disk. and are the central surface brightness and scale-length of the disk, respectively. The disk isophotes are ellipses centered on (, ), with constant position angle and constant axial ratio .
The projected surface density of a three-dimensional Ferrers ellipsoid (Ferrers 1877, see also Aguerri et al. 2009) was used to describe the SBD of the bar component
| (3) |
where is the radius measured in the Cartesian coordinates describing the reference system of the bar and using generalized ellipses (Athanassoula et al., 1990). , and represent the central surface brightness, length and shape parameter of the bar, respectively. Due to the high degree of degeneracy that the parameter introduces during the fit, we decided to keep it as a fixed parameter during the fitting process. The default value used was (see also Laurikainen et al., 2005).
The bar strength represents the contribution of the bar to the total galaxy potential. We compute the bar strength using the recipe of Whyte et al. (2002) which is based on the bar axis ratio
| (4) |
where is the axial ratio of the bar corrected for the inclination of the disk (see Abraham et al., 1999). We used the bar ellipticities measured from our photometric decomposition, which can strongly differ from those derived from the maximum of the ellipse averaged isophotal radial profiles (see Gadotti, 2008).
To derive the photometric parameters of the different components we iteratively fitted a model of the SBD to the pixels of the galaxy image, using a non-linear least-squares minimization based on a robust Levenberg-Marquardt method (Moré et al., 1980). The actual computation has been done using the MPFIT algorithm (Markwardt, 2009) under the IDL 333Interactive Data Language is distributed by ITT Visual Information Solutions. It is available from http://www.ittvis.com environment. Each image pixel has been weighted according to the variance of its total observed photon counts due to the contribution of both the galaxy and sky, and determined assuming photon noise limitation and taking into account the detector readout noise. The seeing effects were taken into account by convolving the model image with a circular Moffat (Trujillo et al., 2001) point spread function (PSF) with the full width at half maximum (FWHM) measured directly from stars in the galaxy image (Table 2).
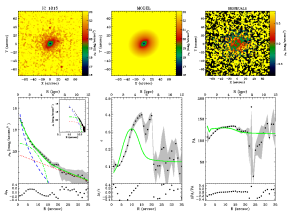
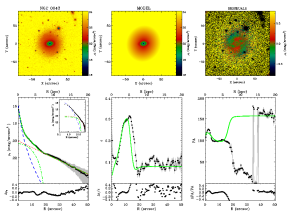
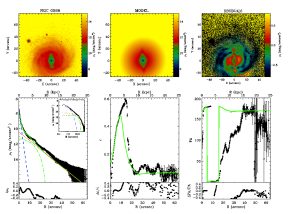
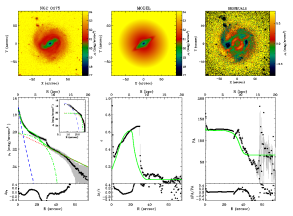
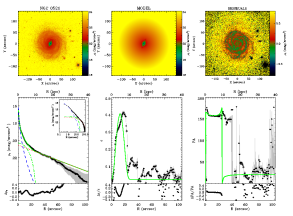
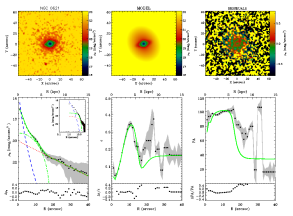
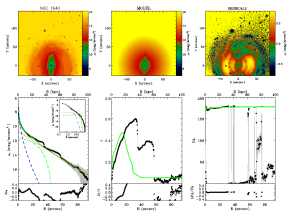
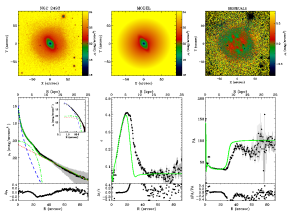
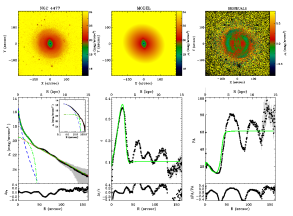
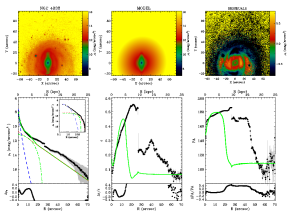
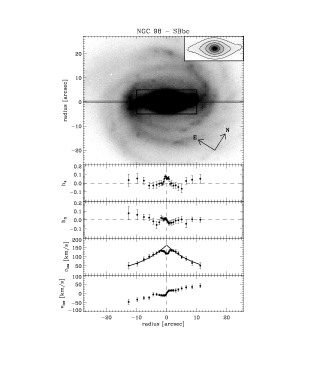
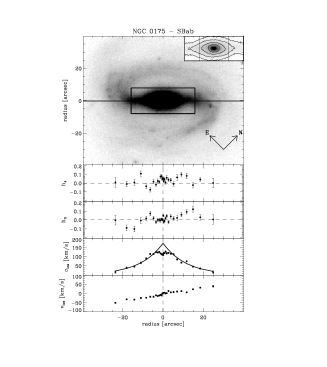
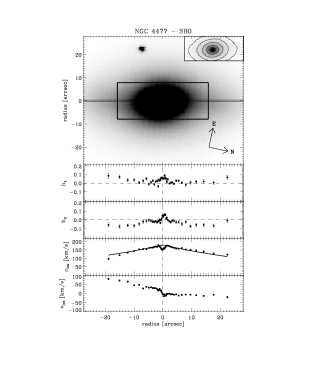
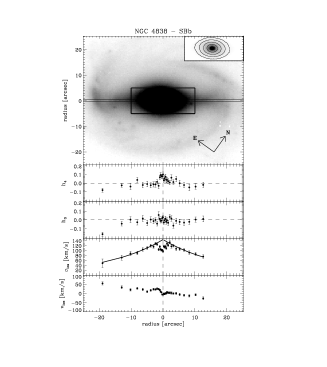
Figure 1 shows the GASP2D fits for each galaxy in the sample. The parameters derived for the structural components are collected in Table 3.
The formal errors obtained from the minimization procedure are usually not representative of the real errors in the structural parameters (Méndez-Abreu et al., 2008a). Therefore, the errors given in Table 3 were obtained through a series of Monte Carlo simulations. A set of 500 images of galaxies with a Sérsic bulge, an exponential disk, and a Ferrers bar was generated. The structural parameters of the artificial galaxies were randomly chosen among the ranges obtained for our sample galaxies (Table 3). The simulated galaxies were assumed to be at a distance of 51 Mpc, which corresponds to the mean of our galaxy sample. The adopted pixel scale, CCD gain, and read-out-noise were chosen to mimic the instrumental setup of the photometric observations. Finally, a background level and photon noise were added to the artificial images to yield a signal-to-noise ratio similar to that of the observed ones. The images of artificial galaxies were analyzed with GASP2D as if they were real. Thus, the initial conditions in the fitting procedure were computed independent of their actual values for each model galaxy. The errors on the fitted parameters were estimated by comparing the input and measured values assuming they were normally distributed. The mean and standard deviation of the relative errors of the artificial galaxies were adopted as the systematic and typical errors for the observed galaxies. It is worth noting that systematic errors associated with PSF and sky background uncertainties were not taken into account in the simulations and therefore the quoted errors might still be underestimated (e.g., Méndez-Abreu et al., 2008a).
| Galaxy | |||||||||||||
|---|---|---|---|---|---|---|---|---|---|---|---|---|---|
| (″) | (∘) | (″) | (∘) | (″) | (∘) | (″) | |||||||
| (1) | (2) | (3) | (4) | (5) | (6) | (7) | (8) | (9) | (10) | (11) | (12) | (13) | (14) |
| IC 1815 | 2.9 0.3 | 3.4 0.5 | 0.79 0.08 | 120.8 13.2 | 15.4 3.1 | 0.87 0.17 | 115.8 23 | 17.2 2.5 | 0.32 0.04 | 132.2 19 | 0.33 | 0.09 | 5.00 |
| NGC 0043 | 2.3 0.1 | 2.2 0.2 | 0.87 0.04 | 119.0 6.0 | 14.2 0.7 | 0.91 0.04 | 157.3 7.8 | 19.9 1.3 | 0.44 0.03 | 94.4 6.6 | 0.21 | 0.07 | 5.52 |
| NGC 0098 | 1.6 0.1 | 1.2 0.1 | 0.73 0.04 | 206.6 12.3 | 9.6 0.6 | 0.93 0.05 | 201.6 12 | 26.1 2.0 | 0.20 0.01 | 36.5 2.9 | 0.11 | 0.08 | 3.25 |
| NGC 0175 | 3.0 0.3 | 1.3 0.2 | 0.71 0.07 | 124.4 13.6 | 20.3 2.2 | 0.94 0.09 | 66.7 6.6 | 43.8 6.5 | 0.20 0.02 | 123.3 12 | 0.07 | 0.11 | 5.12 |
| NGC 0521 | 3.6 0.4 | 2.4 0.3 | 0.94 0.10 | 167.4 18.4 | 36.6 4.0 | 0.97 0.09 | 21.2 2.1 | 28.5 4.2 | 0.26 0.02 | 156.9 15 | 0.08 | 0.02 | 6.70 |
| NGC 0621 | 1.6 0.2 | 1.7 0.2 | 0.89 0.08 | 62.4 6.9 | 13.3 2.7 | 0.83 0.16 | 34.5 6.8 | 19.5 2.9 | 0.35 0.05 | 104.4 15 | 0.27 | 0.14 | 4.00 |
| NGC 1640 | 3.4 0.2 | 1.9 0.2 | 0.69 0.03 | 220.1 11.0 | 16.6 0.8 | 0.94 0.04 | 225.1 11 | 46.0 2.3 | 0.19 0.00 | 223.9 11 | 0.09 | 0.07 | 5.00 |
| NGC 2493 | 4.6 0.2 | 2.0 0.2 | 0.88 0.04 | 44.6 2.2 | 23.5 1.2 | 0.94 0.04 | 100.8 5.0 | 34.0 1.7 | 0.36 0.01 | 31.8 2.0 | 0.26 | 0.10 | 8.68 |
| NGC 4477 | 6.1 0.2 | 1.6 0.1 | 0.86 0.02 | 24.6 0.7 | 32.2 1.0 | 0.89 0.02 | 61.1 1.8 | 45.6 1.5 | 0.39 0.01 | 10.2 0.3 | 0.20 | 0.08 | 12.2 |
| NGC 4838 | 1.8 0.1 | 1.4 0.1 | 0.83 0.05 | 219.0 13.1 | 11.2 0.7 | 0.93 0.05 | 162.2 9.7 | 25.2 1.5 | 0.31 0.01 | 54.8 3.2 | 0.10 | 0.12 | 3.25 |
4 Long-slit spectroscopy
4.1 Observations and data reduction
The long-slit spectroscopic observations were performed using both the VLT at the European Southern Observatory (ESO) and Hobby-Eberly Telescope (HET) at McDonald Observatory (Table 4). In all cases the slit was placed along the major axis of the bar.
The VLT observations were carried out in service mode using the Focal Reducer Low Dispersion Spectrograph 2 (FORS2) mounting the volume-phased holographic grism GRIS_1028z29 with 1028 and the slit. The detector was a mosaic of 2 MIT/LL CCDs, each with pixels of m2. The wavelength range from 7681 Å to 9423 Å was covered in the reduced spectra with a reciprocal dispersion of 0.858 Å pixel-1 and a spatial scale of pixel-1 after a pixel binning. Using standard IRAF555IRAF is distributed by NOAO, which is operated by AURA Inc., under contract with the National Science Foundation. routines, all the spectra were bias subtracted, flat-field corrected, cleaned of cosmic rays, corrected for bad pixels, and wavelength calibrated. The accuracy of the wavelength rebinning (1 km s-1) was checked by measuring the wavelengths of the brightest night-sky emission lines. The instrumental resolution was Å (FWHM) corresponding to km s-1 at 8552 Å. The spectra obtained for the same galaxy were co-added using the center of the stellar continuum as reference. In the resulting spectra the sky contribution was determined by interpolating along the outermost at the edges of the slit and then subtracted.
The HET observations were carried out in service mode using the Marcario Low Resolution Spectrograph (LRS) with the E2 phase volume holographic GRISM and slit. The detector was a Ford Aerospace 30721024 pixels of 1515 m2 yielding a spatial scale of 0235 pixel-1. The wavelength range covered from 4790 Å to 5850 Å and was sampled with 0.38 Å pixel-1. We used standard IRAF routines to reduce the long-slit spectra. In addition to the bias subtraction, flat field correction, and cosmic ray rejection, we corrected for a two degree tilt between the slit and the CCD rows by performing a subpixel shifting of the CCD columns. After this correction, we performed the wavelength calibration using neon arc frames. The accuracy of the wavelength rebinning (1 km s-1) was checked by measuring the wavelengths of the brightest night-sky emission lines. The instrumental resolution was Å (FWHM) corresponding to km s-1 at 5200 Å. No correction for anamorphic distortion was performed on our spectra due to a lack of suitable stars to trace this effect. Based on Fig. 2 in Saglia et al. (2010), variations of up to 10 pixels are expected in the red and blue extremes of the CCD (see also Fabricius et al., 2012). However, for the central wavelengths, the anamorphic distortion is negligible for every spatial position in the CCD. Since we are interested in measuring the Mg I triplet, we perform the fit using only a small spectral region thus avoiding as much as possible this effect. In addition, possible variations are expected to be well below the typical spatial bin sizes that we use at the ends of the slit. To correct for flexure of the instrument during the night we measured the wavelength position of the 5577Å skyline and correct the wavelength calibration to zeroth order by adding a constant offset. The median absolute offset of all observations is 5 km s-1 .
| Galaxy | Telesc. | Instr. | PA | Exp Time | |
|---|---|---|---|---|---|
| (km s-1) | (∘) | (min) | |||
| (1) | (2) | (3) | (4) | (5) | (6) |
| IC 1815 | HET | LRS | 42 | 131 | 130 |
| NGC 0043 | HET | LRS | 42 | 98 | 330 |
| NGC 0098 | VLT | FORS2 | 27 | 32 | 445 |
| NGC 0175 | VLT | FORS2 | 27 | 125 | 445 |
| NGC 0521 | VLT | FORS2 | 27 | 156 | 445 |
| NGC 0621 | HET | LRS | 42 | 100 | 230 |
| NGC 1640 | VLT | FORS2 | 27 | 47 | 445 |
| NGC 2493 | HET | LRS | 42 | 32 | 445 |
| NGC 4477 | VLT | FORS2 | 27 | 13 | 145 |
| NGC 4838 | VLT | FORS2 | 27 | 52 | 445 |
4.2 Measuring stellar kinematics
The stellar kinematics of the sample galaxies were measured from the galaxy absorption features present in the wavelength range centered on either the Ca II triplet (8498, 8542, 8662 Å) for the VLT spectra or Mg I line triplet (5164, 5173, 5184 Å) for the HET spectra using the penalized pixel-fitting method (pPXF; Cappellari & Emsellem, 2004). The spectra were rebinned along the dispersion direction to a logarithmic scale, and along the spatial direction to obtain a signal-to-noise ratio S/N=20 per resolution bin at the outer radii. It increases to S/N 50 at the center of the galaxies.
A linear combination of stellar templates convolved with the line-of-sight velocity distribution (LOSVD) described by the Gauss-Hermite expansion (van der Marel & Franx, 1993) was fitted to each galaxy spectrum by minimization in the pixel space. This allowed us to derive radial profiles of the mean velocity (), velocity dispersion (), and third- () and fourth-order () Gauss-Hermite moments. The stellar templates used in this study were obtained from the Ca II triplet library (Cenarro et al., 2001), which cover the spectral range between 8350-9020 Å at 1.5 Å (FWHM), and the INDO-US library (Valdes et al., 2004), which covers the wavelength range 3460-9464 Å at 1.36 Å (FWHM) for the VLT and HET spectra, respectively. Prior to fitting, they were convolved with a Gaussian to match the instrumental resolution of our spectra. The uncertainties on the kinematic parameters were estimated by Monte Carlo simulations including photon, read-out, and sky noise.
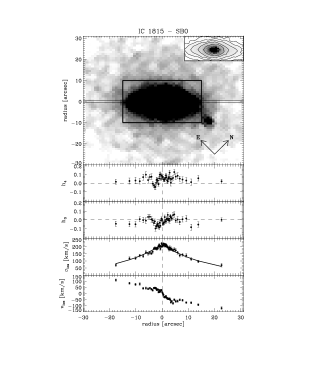
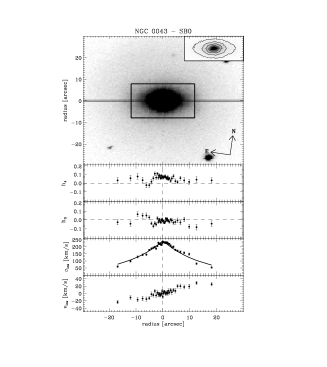
Figure 2 shows the kinematic radial profiles for the sample galaxies. It is worth remembering here that the radial profiles obtained in this paper are along the major axis of the bars. This implies that radial velocities should be corrected not only for inclination, but also for the different position angle with respect to the line-of-nodes (LON). In addition, galaxies in the sample are nearly face-on, thus our LOS samples mostly the vertical components of the velocity and velocity dispersion.
![[Uncaptioned image]](/html/1409.2876/assets/x15.png)
![[Uncaptioned image]](/html/1409.2876/assets/x16.png)
![[Uncaptioned image]](/html/1409.2876/assets/x17.png)
![[Uncaptioned image]](/html/1409.2876/assets/x18.png)
5 Results
5.1 Photometric properties of the sample
Figure 2 shows the distribution of Sérsic index, bulge-to-total () and bar-to-total () luminosity ratios, and bar strength.

The Sérsic index distribution for our sample galaxies covers the range with six of them having . We did not find any correlation between Sérsic index and Hubble type. We found a large spread of Sérsic index ranging from for our sample of 5 lenticular galaxies, whereas the remaining spirals all have . This behaviour for the lenticular galaxies is not surprising, and has been already noticed in previous studies (Méndez-Abreu et al., 2008a; Laurikainen et al., 2010). The low values found in our galaxies can be explained by the inclusion of a bar component in our photometric decompositions. Several works (Aguerri et al., 2005; Balcells et al., 2007; Gadotti, 2008; Laurikainen et al., 2010) have shown how the presence of another component (mainly a bar) at the center of the galaxy, and properly taken into account in the photometric decomposition, reduces the index of the bulge.
The effect of including a bar in the photometric decomposition is also clearly shown in the distribution. Our sample spans only the range between even if it is biased toward early-type disk galaxies. Gadotti (2008) estimated that not including the bar in the photometric decomposition can result in an overestimation of the ratio by a factor of 2. Our distribution is also in agreement with other results (Aguerri et al., 2005; Laurikainen et al., 2007).
The bar-to-total () ratio covers the range from indicating that bars contribute marginally to the total luminosity, and possibly to the total mass of the galaxy. Nonetheless, they are able to change the morphology and dynamics of their central regions. The bar strength distribution spans from . We found that bars in lenticular galaxies are weaker than in spirals. Similar results have been already found in the literature (i.e., Aguerri et al., 2009) but our sample is too small to reach more statistically meaningful conclusions.
5.2 drops
Central reductions of the stellar velocity dispersion of galaxies are usually called drops (Emsellem et al., 2001). Figure 2 shows clearly the ubiquity of drops and plateaus in our galaxy sample. We found a clear drop in the central velocity dispersion of five galaxies and another three show a plateau in their central regions. This means that of our sample galaxies show this kinematic feature in their centers. This is consistent with previous results for barred galaxies (Pérez et al., 2009).
In order to characterize the drop properties we fitted an exponential profile to the velocity dispersion profile of each galaxy. In the fit, we excluded the central region of each galaxy where the drop/plateau appears. Both sides of the radial profiles were fitted simultaneously and the errors on the velocity dispersion were used as weights into the fit. The results of these fits are also plotted in Fig. 2 and the values of the resulting scale-lengths are quoted as in Table 5. For each galaxy where a drop, or a plateau, is present we measured: the drop radius, as the radius where the velocity dispersion profile departs from the exponential fit; the maximum and minimum of the velocity dispersion within this radius; and the integrated velocity dispersion difference between the best fit and actual radial profile. These values, together with other kinematic properties, are listed in Table 5.
| Galaxy | ||||||||
|---|---|---|---|---|---|---|---|---|
| (km s-1) | (km s-1) | (km s-1) | (km s-1) | (′′) | (km s-1) | (km s-1) | (′′) | |
| (1) | (2) | (3) | (4) | (5) | (6) | (7) | (8) | (9) |
| IC 1815 | 21314 | 217 | 21210 | 216 | – | – | – | 17.8 |
| NGC 0043 | 2343 | 243 | 2343 | 241 | – | – | – | 14.6 |
| NGC 0098 | 1172 | 163 | 1172 | 161 | 1.50.3 | 1341 | 81 | 10.6 |
| NGC 0175 | 1124 | 174 | 1124 | 172 | 2.60.3 | 1261 | 154 | 11.4 |
| NGC 0521 | 1981 | 255 | 1981 | 252 | 3.50.2 | 2012 | 220 | 13.8 |
| NGC 0621 | 2295 | 277 | 2295 | 274 | 2.70.3 | 2342 | 169 | 11.0 |
| NGC 1640 | 74 7 | 113 | 742 | 112 | 1.60.1 | 94 1 | 140 | 18.9 |
| NGC 2493 | 26210 | 284 | 2588 | 281 | 1.50.4 | 2701 | 32 | 27.3 |
| NGC 4477 | 1543 | 180 | 1574 | 179 | 1.50.1 | 1771 | 35 | 45.7 |
| NGC 4838 | 10714 | 145 | 10510 | 144 | 2.20.1 | 1312 | 105 | 18.5 |
Figure 3 shows the relation between the radius of the drop, or plateau, and the effective radius of the photometric bulges as defined in Sect. 3.2. As expected, most of our bulges are larger than the drops, indicating that more than one structural component is present in the galaxy center. However, this does not hold for NGC 0621 and NGC 4838. The case of NGC 0621 is particularly intriguing due to the double symmetric dip present in its velocity dispersion profile (Fig. 2), pointing out that the underlying structure producing this kinematic feature is larger than the photometric bulge. For those galaxies with we suggest that what is causing the drop can be identified with a pseudobulge.

No correlation was found between the drop parameters (radius, peak-to-valley value, or integrated ) and Sérsic index. It is interesting to note, however, that drops are found only in galaxies with . Two out of the four galaxies with present peaked velocity dispersion profiles (IC 1815 and NGC 0043) and they are lenticular galaxies, whereas the other two (NGC 0521 and NGC 2493) show only plateaus.
5.3 Central velocity dispersion
We calculated the central velocity dispersion of our sample galaxies in two different ways: first, we directly computed as the measured value of the velocity dispersion in the center; secondly, we performed the luminosity weighted average of the velocity dispersion profile within an eighth of the bulge effective radius () obtained from the photometric decomposition. This quantity is commonly used in the literature to compare the velocity dispersion of different systems at the same physical radius (Jørgensen et al., 1995). These two values were also computed using the inwards extrapolation of the best exponential fit to the velocity dispersion radial profile. Thus, we will refer to the former as measured and the later as model corrected velocity dispersion, respectively. In this way, both values will be similar for galaxies with peaked velocity dispersion profiles and different for drop, or plateau galaxies. It is worth noticing that due to the face-on nature of the sample, the values represent mainly the vertical component of the velocity ellipsoid. These values are shown in Table 5.
We find a mild correlation (Spearman correlation coefficient =0.67) between the Sérsic index and the central value of the velocity dispersion (Fig. 4). This is in agreement with recent results by Fabricius et al. (2012) who found some differences in the velocity dispersion distribution for bulges with and . In Fig. 4 a clear transition region around and km s-1 is visible.
Figure 4 also shows the correlations between the central velocity dispersion and two bar properties: the bar strength (, =0.75) and the scale-length of the velocity dispersion radial profile (, =0.63). The former correlation indicates that strong bars usually have smaller central velocity dispersion. The latter shows how more radially extended bar have higher central velocity dispersions.

5.4 Faber-Jackson relation
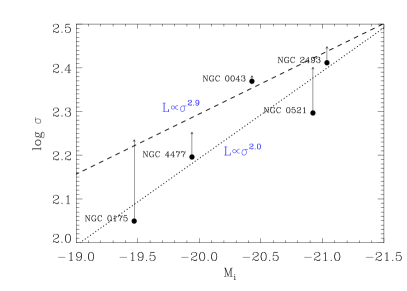
Figure 5 shows the Faber-Jackson (FJ) relation obtained for our five bulges with SDSS photometry in the band. The remaining galaxies have either uncalibrated photometry or images in band so they are not directly comparable. The black dots represent the value of as measured from the observed profiles, the head of the arrows show the model corrected values of as measured over the best exponential fit performed to the radial velocity dispersion profiles. Note that all galaxies but NGC 0043 host a drop or plateau, and therefore the differences can be large.
The measured FJ relation gives a scaling , similar to what is found in low luminosity ellipticals (Matković & Guzmán, 2005; Cody et al., 2009). However, the slope for the model corrected FJ relation is significantly different with a value , demonstrating the importance of being able to resolve the drops, but still different from the canonical value expected from the virial theorem, and therefore for classical bulges.
Note that according to Fig. 3, NGC 0175 and NGC 0521 host drops of dimensions comparable to their bulges, thus they can be associated to disk-like structures such as pseudobulges. In Fig. 5, they also fall below the FJ relation, as expected if they are pseudobulges (Kormendy & Kennicutt, 2004).
5.5 B/P bulges through spectroscopy and morphology
B/P bulges are usually detected in edge-on galaxies due to their characteristic shape. The pioneering surveys carried out by de Souza & Dos Anjos (1987) and Shaw (1987) demonstrated that they are common structures observed in edge-on galaxies. More recently, the presence of these structures have been unambiguously related to the presence of a bar component (Bureau & Freeman, 1999; Lütticke et al., 2000). However, recently different methodologies have been used to identify these structures in less inclined galaxies. Debattista et al. (2005) proposed a kinematic diagnostic to search for B/P bulges in face-on galaxies based on a double minimum in the radial profile along the bar major axis. Méndez-Abreu et al. (2008b) observationally confirmed this prediction on NGC 0098 where a clear double minimum in is present before the end of the bar. We search for similar features in the radial profiles of our sample of face-on galaxies (Fig. 2). We did not find any other example as clear-cut as NGC 0098 in the whole sample. Some galaxies show marginal detections such as NGC 1640 (), NGC 2493 (), or NGC 0043 (, but visible only on the approaching side). Two possibilities can be argued to explain the non-detections: first, not all barred galaxies host a B/P bulge and therefore the non-detection of minima could imply that no B/P is present in those galaxies; second, it is possible that the quality of our galaxy spectra is not sufficient to disentangle more subtle features in the profiles (see Debattista et al. 2005 for examples of the minima variations).
Recently, Erwin & Debattista (2013) demonstrated the possibility of detecting B/P structures in moderately inclined galaxies using just their morphology. Their method is based on the detection of characteristic features in the galaxy isophotes created by the projection of the thick B/P structure combined with a thinner and larger bar. In practice, the bar isophotes are made of two regions: the interior of the bar is broad and slightly boxy in shape, while the outer part of the bar forms narrower spurs, almost always offset or even rotated with respect to the major axis of the inner, boxy region. Even if our galaxies are, by choice, face-on rather than moderately inclined, we analyzed the isophotes of the galaxies in our sample in order to search for these features. In Fig. 6 we show the isophotes for our sample galaxies. The only marginal case of this morphology is found in NGC 0175, which has inner boxy isophotes and offset spurs. The radius of this inner boxy structure is about 7, which roughly corresponds to a minimum in the approaching side of the radial profile. However, we did not find photometric signs of a B/P bulge in NGC 0098. Therefore, we conclude that at these inclinations the photometric detection of B/P bulges is strongly dependent on the bar-disk orientation (Erwin & Debattista, 2013).

6 Discussion
6.1 A zoo of bulge types
As commented previously, bulges come in different flavours and a careful case-by-case study is needed to unveil their real nature. However, the most commonly used recipe to classify bulges in their different types is by analyzing their surface-brightness distribution. Since pseudobulges share many properties of galaxy disks, it is expected that their surface brightness follows an exponential profile. On the other hand, classical bulges which are expected to better resemble the properties of ellipticals might follow a more steep profile. In terms of the Sérsic parametrization of bulges, pseudobulges should have a Sérsic index whereas a classical bulge should have . This diagnostic has been proposed as a good proxy for separating bulge types (Kormendy & Kennicutt, 2004; Drory & Fisher, 2007; Fisher & Drory, 2008, 2011). Recently, Fabricius et al. (2012) carried out an extensive study of how structural properties such as the Sérsic index are related to the stellar kinematics. They found that both properties are correlated and that photometric properties can be used to safely determine the bulge nature. However, morpho-kinematics relations show a significant degree of scatter and a safe classification of bulge type should be done on an individual basis.
We performed an accurate case-by-case study based on the morphological, photometric, and kinematic properties of bulges. A crucial point in our analysis is that the LOS velocity dispersion probed in this work can be directly related to the vertical component of the velocity ellipsoid. Since pseudobulges are associated to disk structures, and these are supposed to be dynamically cold, the vertical component of the velocity ellipsoid in pseudobulges should be low enough to maintain a disk structure. We apply this condition to our classical vs. pseudobulge selection by imposing that all classical bulges should have km s-1. This limit is based on our relation between the Sérsic index and the central velocity dispersion of bulges (Fig. 4) which shows that around and km s-1 there is a transition region that might be used to distinguish classical from pseudobulges in disk galaxies. In fact, the Sérsic index was also used in our classification by imposing a boundary line around . However, a larger sample of galaxies with vertical velocity dispersions measured is needed to confirm this result.
One possible source of scatter in previous works using statistical limits to separate bulge types might be the presence of multiple structures in the galaxy centers. We carefully checked for the presence of composite bulges in our sample. Particular attention was paid to the presence of B/P structures as explained in Sect. 5.5. We found hints, either photometric or kinematic, for B/P bulges in 5 galaxies of the sample (NGC 0043, NGC 0098, NGC 0175, NGC 1640, and NGC 2493). In all these cases the estimated radius of the B/P components was much larger that the bulge effective radius indicating that they co-exist with another classical or pseudobulge. However, it is worth noting that the detection of the B/P structures is marginal in some cases. On the other hand, the presence of drops, or plateaus, is also used in this work to identify embedded pseudobulges. Fig. 3 shows how the extension of the drops can be comparable, larger, or smaller than the photometric bulge effective radius therefore implying the presence of a single, or composite bulge in our sample galaxies. In particular, when the effective radius of the photometric bulge is larger than the drops, or plateaus, we assume there is a nuclear cold component (usually considered as a pseudobulge). Then, the properties of the region attributed to the photometric bulge define the classification of the secondary bulge. Particular attention was paid to assure the presence of two different components in the center of these galaxies (NGC 1640, NGC 2493, and NGC 4477), and discard a possible fake detection of the nuclear disk due to the exponential fading of the surface brightness. We exclude possible light contamination effects caused by other galaxy components. The photometric bulge effective radius is between two to four times the size of the central drops, or plateaus. Furthermore, the , i.e., the radius where the bulge light dominates over every other galaxy component (see Morelli et al., 2008), spans from three to nine times the size of the drops and plateaus. Finally, we compute the luminosity ratio within one finding that at least 75% of the galaxy light at this radius comes from the photometric bulge. Therefore, we suggest that the nuclear disk and the outer photometric bulge are not the same structure.
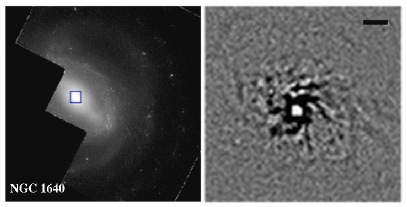
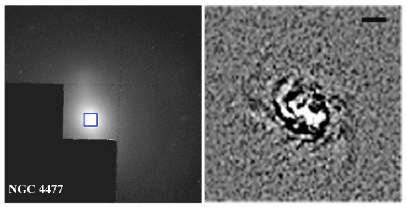
High spatial resolution images represent a powerful tool for investigating the presence of different structures in the very inner regions of disk galaxies. They have been used in some studies to reveal the presence of nuclear spirals, nuclear bars, and nuclear star forming rings which are indicative of the presence of a pseudobulge (Kormendy & Kennicutt, 2004). Unfortunately, in our sample only two galaxies have been observed with HST (NGC 1640 and NGC 4477). Both of them host a central cold component clearly visible in the velocity dispersion profile as a drop with a spiral disk counterpart showing up in the HST images (Fig. 7). However, the photometrically defined bulges of these galaxies are much larger than the nuclear spiral disks, independently confirming that those bulges are, at least, composed of two different structures. In the two galaxies with available HST images, we suggest the photometric bulge is a pseudobulge, but this should be distinguished from the nuclear disk. On the other hand, some galaxies (NGC 0098, NGC 0175, and NGC 0521) have a central cold component, identified from their drop, which corresponds in size with the photometrically defined bulge (Fig. 3). In this case the direct link of a central disk with pseudobulges seems more obvious, even though HST images would be necessary to confirm this structural counterpart.
Appendix A gives a complete description of the bulge properties and classification obtained for each galaxy of the sample. The final classification as well as the main bulge morpho-kinematic characteristics are summarized in Table 6.
| Galaxy | CLASSICAL | PSEUDO | B/P | Comments | |||||||
|---|---|---|---|---|---|---|---|---|---|---|---|
| km s-1 | km s-1 | Spurs | |||||||||
| (1) | (2) | (3) | (4) | (5) | (6) | (7) | (8) | (9) | (10) | ||
| IC 1815 | y | y | n/a | n | n | n/a | n | n | Classical | ||
| NGC 0043 | y | y | n/a | n | n | n/a | y | n | Classical + B/P? | ||
| NGC 0098 | n | n | n | y | y | y | y | n | Pseudo + B/P | ||
| NGC 0175 | n | n | n | y | y | y | y | y | Pseudo + B/P | ||
| NGC 0521 | n | y | n | y | n | y | n | n | Pseudo | ||
| NGC 0621 | y | n | n | n | y | y | n | n | Classical + inner bar | ||
| NGC 1640 | n | n | y | y | y | n | y | y | Central spiral disk + pseudo + B/P? | ||
| NGC 2493 | y | y | y | n | n | n | y | n | Central cold structure + classical + B/P? | ||
| NGC 4477 | n | n | y | y | y | n | n | n | Central spiral disk + pseudo | ||
| NGC 4838 | n | n | n | y | y | y | n | n | Pseudo |
6.1.1 Single-component bulges
Only 3 out of 10 galaxies in our sample have been identified as hosting a single-component bulge (IC 1815, NGC 0521, and NGC 4838). This implies that 70% of our galaxies host composite bulges. This result proves the complexity of bulge structures in barred galaxies. Moreover, the fraction of single-component bulges should be considered as a upper limit since fainter nuclear structures not resulting in a -drop, or plateau, can still be present in the galaxies. Two galaxies, NGC 0521 and NGC 4838, host a pseudobulge indicating a possible secular formation, most likely due to the presence of a bar (Kormendy & Kennicutt, 2004). On the other hand, IC 1815 hosts a classical bulge. A likely scenario for the assembly of classical bulges implies their formation through major merger events. Therefore, this galaxy hints at an early formation of the bulge before the bar forms in a rebuilt disk after the major merger. Another possible scenario could indicate a joint formation of both components due to un-equal mass mergers or interactions as proposed by Pérez et al. (2009) for early-type barred galaxies.
6.1.2 Composite secular-built bulges
We refer to composite secular-built bulges as those bulges composed by two or more structures associated to secular processes, namely pseudobulges, central disks, or B/P bulges. Four galaxies in our sample host a composite secular-built bulge (NGC 0098, NGC 0175, NGC 1640, and NGC 4477). Taking into account the previously noticed single-component pseudobulges, 60% of our sample consist of bulges formed mainly by secular processes.
Three galaxies (NGC 0098, NGC 0175, and NGC 1640) show features linked to the presence of a B/P structure in addition to the pseudobulge. B/P structures are associated to the evolution of bars in galaxy disks (Combes & Sanders, 1981; Martinez-Valpuesta et al., 2006), and therefore it is not surprising to find the co-existence of both components in the center of barred galaxies. However, due to inclination-related problems on detecting B/P components in relatively face-on galaxies, the identification of these composite systems have been elusive. Kormendy & Barentine (2010) detected one of these systems in the edge-on galaxy NGC 4565 using near-infrared imaging. They demonstrated that the B/P structure is associated to a bar structure with a tiny pseudobulge contributing only about 6% to the total galaxy light. A similar study was presented by Barentine & Kormendy (2012) for NGC 5746. The present work opens a new way to study these composite systems in face-on galaxies, allowing a more straightforward detection of different bulge types within the same galaxy.
Other secular-built central structures, namely central spiral disks, have been also identified in two galaxies (NGC 1640 and NGC 4477) of our sample using available HST observations. These central spiral disks are also clearly visible in their velocity dispersion profiles as a drop and their dimensions are consistent with being the same structure. On the other hand, the photometrically defined bulges are much larger than the nuclear spiral disks and their properties are consistent with being pseudobulges. Thus, we suggest these galaxies formed their pseudobulge and also their central spiral disk through secular processes.
6.1.3 Composite merger- and secular-built bulges
We consider merger- and secular-built bulges as those bulges composed of a merger-built bulge, namely a classical bulge, and at least one secular-built structure, i.e., pseudobulge, central disk, or B/P. Three galaxies (NGC 0043, NGC 0621, and NGC 2493) from our sample satisfy these criteria showing evidences for composite bulges associated to different formation mechanisms. These bulges represent a challenge to formation models that need to accommodate merger-built classical bulges with either central rotationally supported or bar associated structures.
We have found the co-existence of a classical and B/P structure in two galaxies, NGC 0043 and NGC 2493. Different formation scenarios for these bulges include an early bulge formation through major mergers with a subsequent bar development on a rebuilt disk or a coeval formation of bulge and bar triggered by un-equal mass mergers or interactions (Pérez et al., 2009). The presence of the B/P structure imposes a further constraint on the timeline of bulge evolution. The usual time for a bar to be settled in a galaxy disk can vary depending on the galaxy and halo properties (Athanassoula et al., 2013) but it generally takes about 1-2 Gyr. Taking into account that the formation of B/P structures also imply a delay of about 1-2 Gyr after the bar is formed (Martinez-Valpuesta et al., 2006). This would imply our classical bulges in these two lenticular galaxies are at least older than 3-4 Gyr. In addition, this result can be interpreted as bars being long-lived structures as claimed in previous papers based on theory (Kraljic et al., 2012), kinematics (Gadotti & de Souza, 2005), and stellar populations (Gadotti & de Souza, 2006; Sánchez-Blázquez et al., 2011).
NGC 0621 presents a double, symmetric drop of the velocity dispersion. These drops are located farther than the photometric bulge and therefore cannot be associated with an embedded component. Our most likely explanation of the drops is due to the presence of an inner bar. Thus, the drops of the velocity dispersion are connected to the sigma hollows discovered by de Lorenzo-Cáceres et al. (2008). However, other possibilities such as the presence of an inner ring cannot be ruled out, but its position outside the bulge region makes this scenario less likely.
Our galaxies show composite bulges structurally different from those described in Nowak et al. (2010). They found small classical bulges embedded in larger pseudobulges, with this happening even in double-bar galaxies (i.e., NGC 3368). However, we always found a large photometrically defined classical bulge with an inner cold structure related to a pseudobulge. This description is more similar to the scenario proposed by de Lorenzo-Cáceres et al. (2012) for the bulge of the double-barred galaxy NGC 0357.
6.2 Origin of drops
We found drops in five galaxies of our sample: NGC 0098, NGC 0621, NGC 1640, NGC 4477, and NGC 4838. Central plateaus were found in three other galaxies: NGC 0175, NGC 0521, and NGC 2493. This means that 80% of our sample galaxies do not present a centrally peaked velocity dispersion. The incidence of drops in barred galaxies is still an open debate. For instance, Pérez et al. (2009) found a 70% of galaxies hosting drops in their sample of barred galaxies whereas Chung & Bureau (2004) found only 40%. In mixed, barred and non-barred, samples the incidence of drops is around 50% (Falcón-Barroso et al., 2006; Peletier et al., 2007). Therefore, the high fraction of drops found in our sample seems to indicate a connection between bars and drops, contrary to the previous claims by Comerón et al. (2008). However, it is not clear whether our sample is too small to extract statistical conclusions or if the medium-resolution spectroscopy on face-on galaxies more easily reveals these structures.
The standard explanation for these drops is the presence of central cold stellar disks formed from gas inflow (Emsellem et al., 2001; Wozniak et al., 2003). Wozniak & Champavert (2006) using dynamical simulations, predicted that these features can last for more than 1 Gyr if the central region is continuously fed by fresh gas leading to a continuous star formation activity. On the contrary, Athanassoula & Misiriotis (2002) found drops in N-body dissipationless simulations, and Bureau & Athanassoula (2005) showed that they can arise from the orbital structure of strongly barred galaxies. Another possibility is that the central -drop might be caused by the bulge itself, which therefore shows disk-like properties that indicate it is a pseudobulge rather than a classical one (de Lorenzo-Cáceres et al., 2012). Within this new context, the -drop is not actually a drop with respect to the higher velocity dispersion of the bulge, but the maximum velocity dispersion of the pseudobulge itself.
Only two galaxies in our sample have high spatial resolution images from the HST. Both of them host a drop: NGC 1640 and NGC 4477 (Fig. 7). After unsharp masking the images, a nuclear disk with spiral arms showed up in both galaxies. The dimensions of these structures are in good agreement with the size of the drop. This seems to favour the scenario in which cold nuclear stellar disks can originate from gas inflow along the bar (Emsellem et al., 2001; Wozniak et al., 2003). It is worth noting that these nuclear disks are not directly connected with the photometric bulge, therefore indicating the presence of two coexistent components.
On the other hand, three galaxies show drops with dimensions comparable to that of their host bulges. Therefore, these cold structures can be associated with the presence of a pseudobulge as in the scenario proposed by de Lorenzo-Cáceres et al. (2012) for NGC 0357.
Finally, Fabricius et al. (2012) suggest that classical bulges show preferentially peaked velocity dispersion profiles while pseudobulges have plateaus or even drops. We confirm this result with our face-on sample. Two out of the four classical bulges show peaked velocity dispersion profiles in our sample (IC 1815 and NGC 0043). NGC 2493 also hosts a classical bulge and presents the shallower plateau of the sample, being recognizable only after fitting an exponential model to the velocity dispersion profile. NGC 0621 shows a symmetrical double drop which we interpret as due to the presence of a nuclear bar.
7 Conclusions
We have studied the photometric and kinematic properties of bulges using a sample of 10 face-on barred galaxies. An accurate two-dimensional photometric decomposition was applied to the galaxy images in order to derive the structural properties of their bulges and bars. Intermediate resolution long-slit spectroscopy along the bar major axis was used to derive the LOSVD radial profiles.
We found a rough correlation among the structural and kinematic properties for different bulge types, similar to the results by Fabricius et al. (2012). Even if the scatter is high, we tentatively found that a Sérsic index combined with a central vertical velocity dispersion km s-1 provides a good boundary line between classical and pseudobulges.
A careful case-by-case analysis of the bulges allowed us to identify, and classify, the different bulge types present in our sample galaxies: classical vs pseudobulges. In addition, B/P structures associated with the presence of a bar were also identified. Special attention was paid to the presence of composite bulges. Indeed, we distinguish between single-component bulges and composite bulges in our sample. We found only 3 single-component bulges in our sample: 2 are pseudobulges and 1 is a classical bulge. The presence of a classical bulge in a barred galaxy implies that it was likely formed before the bar.
We found evidence for the presence of multiple bulges within the so called “bulge region”. These composite bulges have already been found in a handful of galaxies (Erwin et al., 2003; Nowak et al., 2010; de Lorenzo-Cáceres et al., 2012). However, the high incidence (70%) of these composite bulges in our sample indicates that mixed types might be very frequent in barred galaxies. We found four secular-built composite bulges with structures compatible with being formed by secular processes. More interestingly, we also found three bulges where merger- and secular-built bulges co-exist. This kind of composite bulges is not completely surprising, and their presence within barred galaxies have already been considered in theoretical studies (Samland & Gerhard, 2003; Athanassoula, 2005). However, the merger- and secular-built bulges found in our sample is new, and different from previous works (Nowak et al., 2010), since we found large classical bulges with smaller pseudobulges coexisting in the nuclear regions.
We found a high fraction (70%) of drops or plateaus in our sample. These drops are usually connected with the presence of a rapidly rotating structure in the center of the galaxies. We confirm this interpretation in two galaxies with HST imaging where a clear spiral disk, comparable in size with that of the drops, is found. In some cases the size of the drop is comparable with the size of the photometric bulge while in others the bulge can be more than a factor of two larger. This might imply different origins for the drops and the presence of different coexisting structures within the same bulge, respectively.
Acknowledgements.
We thank P. Erwin and A. de Lorenzo-Cáceres for useful discussions and suggestions. We thank the referee for his/her constructive comments which helped to improve the paper. This work has been partly funded by the Spanish Ministry for Science, project AYA 2010-21887-C04-04. JMA acknowledges support from the European Research Council Starting Grant (SEDmorph; P.I. V. Wild). VPD is supported by STFC Consolidated grant #ST/J001341/1. E. M. C. acknowledges financial support from Padua University by the grants 60A02-5052/11, 60A02-4807/12, and 60A02-5857/13. Funding for SDSS, SDSS-II, and SDSS-III has been provided by the Alfred P. Sloan Foundation, the Participating Institutions, the National Science Foundation, and the U.S. Department of Energy Office of Science. This publication makes use of data products from the Two Micron All Sky Survey, which is a joint project of the University of Massachusetts and the Infrared Processing and Analysis Center/California Institute of Technology, funded by the National Aeronautics and Space Administration and the National Science Foundation. This research has made use of the NASA/IPAC Extragalactic Database (NED) which is operated by the Jet Propulsion Laboratory, California Institute of Technology, under contract with the National Aeronautics and Space Administration.References
- Abraham et al. (1999) Abraham, R. G., Merrifield, M. R., Ellis, R. S., Tanvir, N. R., & Brinchmann, J. 1999, MNRAS, 308, 569
- Aguerri et al. (2001) Aguerri, J. A. L., Balcells, M., & Peletier, R. F. 2001, A&A, 367, 428
- Aguerri et al. (2005) Aguerri, J. A. L., Elias-Rosa, N., Corsini, E. M., & Muñoz-Tuñón, C. 2005, A&A, 434, 109
- Aguerri et al. (2009) Aguerri, J. A. L., Méndez-Abreu, J., & Corsini, E. M. 2009, A&A, 495, 491
- Aihara et al. (2011) Aihara, H., Allende Prieto, C., An, D., et al. 2011, ApJS, 193, 29
- Andredakis et al. (1995) Andredakis, Y. C., Peletier, R. F., & Balcells, M. 1995, MNRAS, 275, 874
- Athanassoula (2005) Athanassoula, E. 2005, MNRAS, 358, 1477
- Athanassoula et al. (2013) Athanassoula, E., Machado, R. E. G., & Rodionov, S. A. 2013, MNRAS, 429, 1949
- Athanassoula & Misiriotis (2002) Athanassoula, E. & Misiriotis, A. 2002, MNRAS, 330, 35
- Athanassoula et al. (1990) Athanassoula, E., Morin, S., Wozniak, H., et al. 1990, MNRAS, 245, 130
- Balcells et al. (2007) Balcells, M., Graham, A. W., & Peletier, R. F. 2007, ApJ, 665, 1084
- Barentine & Kormendy (2012) Barentine, J. C. & Kormendy, J. 2012, ApJ, 754, 140
- Bender et al. (1992) Bender, R., Burstein, D., & Faber, S. M. 1992, ApJ, 399, 462
- Bershady et al. (2010) Bershady, M. A., Verheijen, M. A. W., Swaters, R. A., et al. 2010, ApJ, 716, 198
- Böker et al. (2002) Böker, T., Laine, S., van der Marel, R. P., et al. 2002, AJ, 123, 1389
- Bournaud et al. (2007) Bournaud, F., Elmegreen, B. G., & Elmegreen, D. M. 2007, ApJ, 670, 237
- Bureau & Athanassoula (2005) Bureau, M. & Athanassoula, E. 2005, ApJ, 626, 159
- Bureau & Freeman (1999) Bureau, M. & Freeman, K. C. 1999, AJ, 118, 126
- Buta et al. (2009) Buta, R. J., Knapen, J. H., Elmegreen, B. G., et al. 2009, AJ, 137, 4487
- Caon et al. (1993) Caon, N., Capaccioli, M., & D’Onofrio, M. 1993, MNRAS, 265, 1013
- Cappellari & Emsellem (2004) Cappellari, M. & Emsellem, E. 2004, PASP, 116, 138
- Carollo (1999) Carollo, C. M. 1999, ApJ, 523, 566
- Cenarro et al. (2001) Cenarro, A. J., Cardiel, N., Gorgas, J., et al. 2001, MNRAS, 326, 959
- Chung & Bureau (2004) Chung, A. & Bureau, M. 2004, AJ, 127, 3192
- Cody et al. (2009) Cody, A. M., Carter, D., Bridges, T. J., Mobasher, B., & Poggianti, B. M. 2009, MNRAS, 396, 1647
- Combes & Sanders (1981) Combes, F. & Sanders, R. H. 1981, A&A, 96, 164
- Comerón et al. (2008) Comerón, S., Knapen, J. H., & Beckman, J. E. 2008, A&A, 485, 695
- Comerón et al. (2010) Comerón, S., Knapen, J. H., Beckman, J. E., et al. 2010, MNRAS, 402, 2462
- Corsini et al. (2012) Corsini, E. M., Méndez-Abreu, J., Pastorello, N., et al. 2012, MNRAS, 423, L79
- de Lorenzo-Cáceres et al. (2008) de Lorenzo-Cáceres, A., Falcón-Barroso, J., Vazdekis, A., & Martínez-Valpuesta, I. 2008, ApJ, 684, L83
- de Lorenzo-Cáceres et al. (2012) de Lorenzo-Cáceres, A., Vazdekis, A., Aguerri, J. A. L., Corsini, E. M., & Debattista, V. P. 2012, MNRAS, 420, 1092
- de Souza & Dos Anjos (1987) de Souza, R. E. & Dos Anjos, S. 1987, A&AS, 70, 465
- de Souza et al. (2004) de Souza, R. E., Gadotti, D. A., & dos Anjos, S. 2004, ApJS, 153, 411
- Debattista et al. (2004) Debattista, V. P., Carollo, C. M., Mayer, L., & Moore, B. 2004, ApJ, 604, L93
- Debattista et al. (2005) Debattista, V. P., Carollo, C. M., Mayer, L., & Moore, B. 2005, ApJ, 628, 678
- Driver et al. (2007) Driver, S. P., Allen, P. D., Liske, J., & Graham, A. W. 2007, ApJ, 657, L85
- Drory & Fisher (2007) Drory, N. & Fisher, D. B. 2007, ApJ, 664, 640
- Eggen et al. (1962) Eggen, O. J., Lynden-Bell, D., & Sandage, A. R. 1962, ApJ, 136, 748
- Eliche-Moral et al. (2006) Eliche-Moral, M. C., Balcells, M., Aguerri, J. A. L., & González-García, A. C. 2006, A&A, 457, 91
- Eliche-Moral et al. (2011) Eliche-Moral, M. C., González-García, A. C., Balcells, M., et al. 2011, A&A, 533, A104
- Emsellem et al. (2001) Emsellem, E., Greusard, D., Combes, F., et al. 2001, A&A, 368, 52
- Erwin (2004) Erwin, P. 2004, A&A, 415, 941
- Erwin et al. (2003) Erwin, P., Beltrán, J. C. V., Graham, A. W., & Beckman, J. E. 2003, ApJ, 597, 929
- Erwin & Debattista (2013) Erwin, P. & Debattista, V. P. 2013, MNRAS, 431, 3060
- Fabricius et al. (2012) Fabricius, M. H., Saglia, R. P., Fisher, D. B., et al. 2012, ApJ, 754, 67
- Falcón-Barroso et al. (2006) Falcón-Barroso, J., Bacon, R., Bureau, M., et al. 2006, MNRAS, 369, 529
- Falcón-Barroso et al. (2002) Falcón-Barroso, J., Peletier, R. F., & Balcells, M. 2002, MNRAS, 335, 741
- Ferrers (1877) Ferrers, N. M. 1877, Quart. J. Pure and Appl. Math, 14, 1
- Fisher & Drory (2008) Fisher, D. B. & Drory, N. 2008, AJ, 136, 773
- Fisher & Drory (2011) Fisher, D. B. & Drory, N. 2011, ApJ, 733, L47
- Freeman (1970) Freeman, K. C. 1970, ApJ, 160, 811
- Gadotti (2008) Gadotti, D. A. 2008, MNRAS, 384, 420
- Gadotti (2009) Gadotti, D. A. 2009, MNRAS, 393, 1531
- Gadotti & de Souza (2005) Gadotti, D. A. & de Souza, R. E. 2005, ApJ, 629, 797
- Gadotti & de Souza (2006) Gadotti, D. A. & de Souza, R. E. 2006, ApJS, 163, 270
- Gebhardt et al. (2000) Gebhardt, K., Bender, R., Bower, G., et al. 2000, ApJ, 539, L13
- Ho (2007) Ho, L. C. 2007, ApJ, 668, 94
- Hopkins et al. (2010) Hopkins, P. F., Bundy, K., Croton, D., et al. 2010, ApJ, 715, 202
- Jarrett et al. (2003) Jarrett, T. H., Chester, T., Cutri, R., Schneider, S. E., & Huchra, J. P. 2003, AJ, 125, 525
- Jørgensen et al. (1995) Jørgensen, I., Franx, M., & Kjaergaard, P. 1995, MNRAS, 276, 1341
- Kauffmann (1996) Kauffmann, G. 1996, MNRAS, 281, 487
- Kormendy & Barentine (2010) Kormendy, J. & Barentine, J. C. 2010, ApJ, 715, L176
- Kormendy et al. (2011) Kormendy, J., Bender, R., & Cornell, M. E. 2011, Nature, 469, 374
- Kormendy & Illingworth (1982) Kormendy, J. & Illingworth, G. 1982, ApJ, 256, 460
- Kormendy & Kennicutt (2004) Kormendy, J. & Kennicutt, Jr., R. C. 2004, ARA&A, 42, 603
- Kraljic et al. (2012) Kraljic, K., Bournaud, F., & Martig, M. 2012, ApJ, 757, 60
- Laine et al. (2002) Laine, S., Shlosman, I., Knapen, J. H., & Peletier, R. F. 2002, ApJ, 567, 97
- Laurikainen et al. (2005) Laurikainen, E., Salo, H., & Buta, R. 2005, MNRAS, 362, 1319
- Laurikainen et al. (2007) Laurikainen, E., Salo, H., Buta, R., & Knapen, J. H. 2007, MNRAS, 381, 401
- Laurikainen et al. (2009) Laurikainen, E., Salo, H., Buta, R., & Knapen, J. H. 2009, ApJ, 692, L34
- Laurikainen et al. (2010) Laurikainen, E., Salo, H., Buta, R., Knapen, J. H., & Comerón, S. 2010, MNRAS, 405, 1089
- Lütticke et al. (2000) Lütticke, R., Dettmar, R.-J., & Pohlen, M. 2000, A&AS, 145, 405
- Markwardt (2009) Markwardt, C. B. 2009, in Astronomical Society of the Pacific Conference Series, Vol. 411, Astronomical Data Analysis Software and Systems XVIII, ed. D. A. Bohlender, D. Durand, & P. Dowler, 251
- Martinez-Valpuesta et al. (2006) Martinez-Valpuesta, I., Shlosman, I., & Heller, C. 2006, ApJ, 637, 214
- Matković & Guzmán (2005) Matković, A. & Guzmán, R. 2005, MNRAS, 362, 289
- Méndez-Abreu et al. (2008a) Méndez-Abreu, J., Aguerri, J. A. L., Corsini, E. M., & Simonneau, E. 2008a, A&A, 478, 353
- Méndez-Abreu et al. (2008b) Méndez-Abreu, J., Corsini, E. M., Debattista, V. P., et al. 2008b, ApJ, 679, L73
- Méndez-Abreu et al. (2010) Méndez-Abreu, J., Simonneau, E., Aguerri, J. A. L., & Corsini, E. M. 2010, A&A, 521, A71+
- Moré et al. (1980) Moré, J. J., Garbow, B. S., & Hillstrom, K. E. 1980, Argonne National Laboratory Report ANL-80-74
- Morelli et al. (2010) Morelli, L., Cesetti, M., Corsini, E. M., et al. 2010, A&A, 518, A32
- Morelli et al. (2008) Morelli, L., Pompei, E., Pizzella, A., et al. 2008, MNRAS, 389, 341
- Nowak et al. (2010) Nowak, N., Thomas, J., Erwin, P., et al. 2010, MNRAS, 403, 646
- Peletier et al. (2007) Peletier, R. F., Falcón-Barroso, J., Bacon, R., et al. 2007, MNRAS, 379, 445
- Peng et al. (2002) Peng, C. Y., Ho, L. C., Impey, C. D., & Rix, H. 2002, AJ, 124, 266
- Pérez et al. (2009) Pérez, I., Sánchez-Blázquez, P., & Zurita, A. 2009, A&A, 495, 775
- Prieto et al. (2001) Prieto, M., Aguerri, J. A. L., Varela, A. M., & Muñoz-Tuñón, C. 2001, A&A, 367, 405
- Prieto et al. (1997) Prieto, M., Gottesman, S. T., Aguerri, J.-A. L., & Varela, A.-M. 1997, AJ, 114, 1413
- Saglia et al. (2010) Saglia, R. P., Fabricius, M., Bender, R., et al. 2010, A&A, 509, A61
- Samland & Gerhard (2003) Samland, M. & Gerhard, O. E. 2003, A&A, 399, 961
- Sánchez-Blázquez et al. (2011) Sánchez-Blázquez, P., Ocvirk, P., Gibson, B. K., Pérez, I., & Peletier, R. F. 2011, MNRAS, 415, 709
- Sellwood (1981) Sellwood, J. A. 1981, A&A, 99, 362
- Sérsic (1968) Sérsic, J. L. 1968, Atlas de galaxias australes, ed. Sersic, J. L.
- Seth et al. (2006) Seth, A. C., Dalcanton, J. J., Hodge, P. W., & Debattista, V. P. 2006, AJ, 132, 2539
- Shaw (1987) Shaw, M. A. 1987, MNRAS, 229, 691
- Simard et al. (2002) Simard, L., Willmer, C. N. A., Vogt, N. P., et al. 2002, ApJS, 142, 1
- Skrutskie et al. (2006) Skrutskie, M. F., Cutri, R. M., Stiening, R., et al. 2006, AJ, 131, 1163
- Springel et al. (2005) Springel, V., Di Matteo, T., & Hernquist, L. 2005, MNRAS, 361, 776
- Trujillo et al. (2001) Trujillo, I., Aguerri, J. A. L., Cepa, J., & Gutiérrez, C. M. 2001, MNRAS, 328, 977
- Valdes et al. (2004) Valdes, F., Gupta, R., Rose, J. A., Singh, H. P., & Bell, D. J. 2004, ApJS, 152, 251
- van der Marel & Franx (1993) van der Marel, R. P. & Franx, M. 1993, ApJ, 407, 525
- Whyte et al. (2002) Whyte, L. F., Abraham, R. G., Merrifield, M. R., et al. 2002, MNRAS, 336, 1281
- Wozniak & Champavert (2006) Wozniak, H. & Champavert, N. 2006, MNRAS, 369, 853
- Wozniak et al. (2003) Wozniak, H., Combes, F., Emsellem, E., & Friedli, D. 2003, A&A, 409, 469
Appendix A Notes on individual galaxies
IC 1815: Only 2MASS imaging is available for this galaxy. The Sérsic index of the bulge () is the highest of our sample. The velocity profile shows a mild double-hump profile at but the velocity dispersion does not show any evidence of flattening or depression in the central regions. The central velocity dispersion is larger than 200 km s-1 suggesting the bulge is pressure supported. We suggest this galaxy hosts a classical bulge.
NGC 0043: The SDSS image shows a smooth surface-brightness distribution with the weakest bar of our sample. The bulge Sérsic index is . No clear signs of a double-hump rotation curve or depression in the central velocity dispersion are found. These characteristics point towards the presence of a classical bulge. However, the radial profile is asymmetric, showing a clear minimum on the approaching side of the galaxy at . This corresponds to 1/3 of the bar length, in agreement with the findings of Méndez-Abreu et al. (2008b) and suggesting the presence of a B/P bulge. We suggest this galaxy hosts a classical bulge and possibly a B/P bulge too.
NGC 0098: The residuals of the photometric decomposition are large due to the prominence of the spiral arms. The best fit bulge model has an effective radius which corresponds fairly well with the size of the drop present in the stellar kinematics (). The rotation curve shows a step rise in this inner region and anti-correlates with the moment. The Sérsic index () is compatible with a disk-like structure. The spectroscopic observations of this galaxy were already analyzed in Méndez-Abreu et al. (2008b) and the characteristic minimum in the radial profile produced by a B/P bulges was found at . We suggest this galaxy hosts a pseudobulge at the very center and B/P bulge farther out.
NGC 0175: Also known as NGC 0171 in NED. A truncated disk is clearly visible in its SDSS surface-brightness profile. The bulge accounts for only 7% of the total galaxy light, in good agreement with the result obtained by Buta et al. (2009). They used deep band imaging to study the bar properties and suggested that an elongated inner ring is present in the galaxy center. The velocity dispersion profile shows a central plateau which does not correspond to any clear increasing rotation. Ho (2007) reported a central velocity dispersion =104 km s-1 which agrees with our value (=112 km s-1). The size of the plateau is barely smaller () than the bulge effective radius (). In Sect. 5.5 we speculate also about the presence of B/P structure at based on its morphological and kinematic features. We suggest that this galaxy hosts an inner ring that can be associated to a pseudobulge and an outer B/P bulge.
NGC 0521: A truncated disk is clearly visible in the SDSS surface-brightness profile. Buta et al. (2009) found the presence of an inner ring with a radius (see also Comerón et al. 2010). The velocity dispersion radial profile shows a central plateau with , which corresponds to a steep rise of the rotation curve (showing a marked double-hump profile). The velocity anti-correlates with . The bulge effective radius is . We suggest this galaxy hosts a central rotating structure that can be associated with a pseudobulge.
NGC 0621: Only 2MASS imaging was available for this galaxy. The velocity dispersion radial profile in the center shows a peculiar double drop, symmetric with respect to the galaxy center. This behavior of the velocity dispersion is similar to the hollows discovered in de Lorenzo-Cáceres et al. (2008), which are related to the presence of an inner bar. These hollows have turned out to be more common than expected and have been detected in other galaxies (de Lorenzo-Cáceres et al. 2012). Moreover, the size of the drop () also point towards the inner bar scenario since it is much larger that the bulge effective radius (). We consider that the high central velocity dispersion obtained for this galaxy, which suggests there is a classical bulge, fits well in the scenario of a double bar, since a high velocity dispersion contrast is a necessary condition to observe the hollows (de Lorenzo-Cáceres et al. 2008). Nevertheless, we cannot rule out other possibilities such as the presence of an inner ring. Therefore, we suggest this galaxy hosts an inner bar (or inner ring) and possibly a classical bulge.
NGC 1640: The SDSS image shows the presence of strong dust lanes along the bar major axis. This is confirmed by the band image of the HST/WFPC2. In fact, this high spatial resolution image shows how the dust lanes converge to the galaxy center where inner spiral arms can be clearly seen in the unsharp masked image (Fig. 7). The radius of this inner structure, as measured from the WFPC2 image, is , which corresponds to the size of the drop (1.6″). On the contrary, the bulge effective radius is much larger (3.4″). The radial profiles show hints of a double minimum at , i.e., at 1/6 of the bar radius. We suggest that this galaxy hosts a central spiral disk, a slightly larger pseudobulge, and possibly an outer B/P bulge.
NGC 2493: No sign of dust obscuration is seen in the SDSS image. There is a mild plateau in the center of the velocity dispersion profile which can be better distinguished when comparing with the best fit exponential model extrapolation. The size of the plateau () is much smaller than the bulge effective radius (4.6″). The radial profile shows hints of a double minimum at (i.e., at 1/3 of the bar radius). We suggest that this galaxy hosts a central cold structure, a classical bulge and possibly a B/P bulge.
NGC 4477: The residuals obtained from the photometric decomposition of this galaxy are quite low, indicating that the parametric model for the bulge, bar, and disk describes the SBD well. The central region of this galaxy is unveiled thanks to the HST/WFPC2 image in the band. Strong dust obscuration is seen throughout the bar region and inner spiral arms are clearly seen in the unsharp masked image (Fig. 7). The radius of this structure is which corresponds to the small drop () present in the velocity dispersion profile. We suggest that this galaxy hosts an central spiral disk and a pseudobulge.
NGC 4838: The velocity dispersion radial profile shows a strong drop in the center. The rotation curve is strongly asymmetric and presents also a step rise but only on the receding side, the rotation curve being strongly asymmetric. The size of the (2.2″) roughly corresponds with the effective radius of the bulge (1.8″). We suggest that this galaxy hosts a pseudobulge.