High-redshift quasars host galaxies: is there a stellar mass crisis?
Abstract
We investigate the evolutionary properties of a sample of quasars at using the semi-analytical hierarchical model GAMETE/QSOdust. We find that the observed properties of these quasars are well reproduced by a common formation scenario in which stars form according to a standard IMF, via quiescent star formation and efficient merger-driven bursts, while the central BH grows via gas accretion and BH-BH mergers. Eventually, a strong AGN driven wind starts to clear up the ISM of dust and gas, damping the star formation and un-obscuring the line of sight toward the QSO. In this scenario, all the QSOs hosts have final stellar masses in the range M⊙, a factor 3-30 larger than the upper limits allowed by the observations. We discuss alternative scenarios to alleviate this apparent tension: the most likely explanation resides in the large uncertainties that still affect dynamical mass measurements in these high-z galaxies. In addition, during the transition between the starburst-dominated and the active QSO phase, we predict that of the progenitor galaxies can be classified as Sub Millimeter Galaxies, although their number rapidly decreases with redshift.
keywords:
Galaxies: evolution, high-redshift, ISM; quasars: general; ISM: dust, extinction; submillimetre: galaxies1 Introduction
High redshift quasars (QSOs), the bright active nuclei (AGN) of galaxies, are among the most important sources of information on the Universe at early cosmic epochs. Their large luminosities ( erg/s) at imply that super massive black holes (SMBHs), with masses (e.g. Fan et al. 2001, 2003; Willott et al. 2007), were already in place; so far, the most distant QSO observed is ULAS J1120+0641 at (Mortlock et al. 2011) and its estimated BH mass, , must have formed in less than Myr.
In the Local Universe, tight correlations between BH masses and several properties of their host galaxies (such as the stellar bulge mass, luminosity, and velocity dispersion) have been observed, suggesting a common formation scenario (co-evolution) for galaxies and BHs at their center, but the physical drivers of this co-evolution may be different in different kind of galaxies (for a recent thorough review see Kormendy & Ho 2013).
The mean BH-stellar bulge mass ratio, , estimated from observations of a sample of quasar is about 10 times higher than the local value (Wang et al. 2010). Although these results could be biased by large uncertainties and observational selection effects (Lauer et al. 2007; Volonteri & Stark 2011), a possible explanation to this discrepancy could be that BHs form before or faster than their host galaxy stellar bulges at these early epochs (Lamastra et al. 2010).
Given the large energy released by BH accretion, QSOs activity is expected to play a critical role in shaping the star formation history (SFH) of the host galaxy, ultimately self-regulating BH growth. Indeed, massive, large scale gas outflows associated to QSOs have been recently detected from the Local Universe up to (Feruglio et al. 2010; Nesvadba et al. 2010, 2011; Maiolino et al. 2012; Cicone et al. 2012).
Finally, observations of high-z galaxies and quasars reveal a rapidly enriched interstellar medium (ISM). Emission line ratios are seen to trace super-solar gas metallicities (up to ) in Broad (Nagao et al. 2006, 2012; Juarez et al. 2009) and Narrow (Matsuoka et al. 2009) Line Regions, with almost no redshift evolution. Dust thermal emission for a sample of quasars in the Sloan Digital Sky (SDSS) survey has been detected through millimetre (mm) and sub-mm observations, suggesting large masses of dust, of a few (e.g. Bertoldi et al. 2003; Priddey et al. 2003; Robson et al. 2004; Beelen et al. 2006; Wang et al. 2008). Moreover, significant dust reddening is present along several high-z AGN and Gamma Ray Bursts (GRBs) lines of sight (Gallerani et al. 2010; Stratta et al. 2011; Hjort et al. 2013)
From the theoretical point of view, many efforts have been made so far to shed light on the formation and growth of the first galaxies, their central SMBHs and/or the evolution of the ISM properties. Some of these issues have been approached with semi-analytical models, providing insights either on the evolution of the dust and metals in the host galaxies (e.g. Morgan & Edmunds 2003; Hirashita & Ferrara 2002; Dwek, Galliano & Jones 2007; Valiante et al. 2009; Gall et al. 2010, 2011; Dwek & Cherchneff 2011; Mattsson 2011, Pipino et al 2011, Calura et al. 2013) or on the formation and growth of the central BHs (e.g. Somerville et al. 2008; Menci et al. 2008; Lamastra et al. 2010, Volonteri et al. 2003; Volonteri & Rees 2006; Devecchi et al. 2010, 2012). On the other hand, high-resolution and/or zoomed-in numerical simulations represent the most sophisticated tools to investigate the physical processes which drive and regulate the BH-galaxy co-evolution (e.g. Di Matteo et al. 2005, 2008, 2012; Hopkins et al. 2006, 2011; Booth & Shaye 2009; Li et al 2007, 2008; Sijacki et al 2009; DeBhur et al. 2010, DeGraf et al. 2012; Bellovary et al. 2011, 2013). These studies have demonstrated that in order to investigate the formation and growth of black holes and their host galaxies, one must embed their evolution in a cosmological setting (Volonteri & Bellovary 2013).
To interpret the observed/inferred properties of high-z quasars mentioned above, all the aspects of BH-galaxy co-evolution must be explained and modelled simultaneously in an adequate, self-consistent cosmologically evolving context. As an attempt to progress in this direction, we have developed a semi-analytical model for the formation and evolution of high redshift quasars, GAMETE/QSOdust (Valiante et al. 2011), which is able to follow the hierarchical assembly and merger history of both the host galaxy and its central BH. The formation and evolution of the chemical properties of the host galaxy, namely the mass of gas, stars, metals and dust are consistently followed in the model.
As a pilot study we have used this model to investigate possible evolutionary scenarios of one of the best studied quasars, SDSS J1148+5251 (hereafter J1148), observed at redshift . In Valiante et al. (2011) we pointed out that the the observed properties of J1148, such as the BH mass, the mass of gas and dust in the ISM, are reproduced only if distinct evolutionary paths are followed. In particular, if stars form according to a Larson Initial Mass Function (IMF), with a characteristic mass (see Eq 3), that we call standard IMF , at the end of its evolution, J1148 settles on the local relation and the stellar mass at exceeds the upper limit set by the observed dynamical mass by a factor of 3-10 (model B3). Alternatively, a Larson IMF but with a larger characteristic mass of (), that we call top-heavy IMF, can be assumed (model B1). Note that these results have been recently confirmed by Calura et al. (2013).
Although a top-heavy IMF (model B1) enables to reproduce the observed dust mass and the deviation of J1148 from the local Mbh-Mstar relation, the predicted star formation rate at is Myr, more than one order of magnitude smaller than the observed value ( Myr). This rate is too small to power the observed Far Infra-Red (FIR) luminosity (Schneider et al. 2014b).
Hence, our studies suggest that J1148 has built up a large stellar mass of M⊙ over its evolution and that its final is . However, this conclusion implies that current dynamical mass measurements may have missed an important fraction of the host galaxy stellar mass.
In the present work, we extend our analysis to a larger sample of quasars observed between redshift and . The main aim is to assess the robustness of our previous findings and to test if the best-fit scenario proposed to explain the formation and chemical evolution of J1148 and its host galaxy (Valiante et al. 2011; Schneider et al. 2014b) can explain the properties of the first QSOs in general.
The paper is organized as follows: in section 2 we describe the sample of high-redshift quasars that we have selected; a brief presentation of the model, with the new features that we have recently implemented, is given in section 3; the results of the analysis are presented in section 4 and 5 and discussed in section 6, where we also draw our conclusions.
In this analysis, we assume a Lambda Cold Dark Matter (CDM) cosmology with , , , and km s-1 Mpc.
2 The sample of high redshift quasars
| QSO name | z | ( M⊙) | (M⊙) | (M⊙) | LFIR (1013L⊙) | SFR (103 M) | (M⊙) |
|---|---|---|---|---|---|---|---|
| SDSS J0338+0012 | 5.0 | 2.51.8 | 8.24.1 | 1.20.2 | 1.060.23 | 6.8 | |
| SDSS J0129-0035 | 5.77 | 0.17 0.051 | 1.241.01 | 2.61.6 | 1.550.3 | 1.40.3 | 2.4 |
| SDSS J0927+2001 | 5.79 | 2.3 0.69 | 4.83.9 | 11.45.0 | 1.670.3 | 1.50.4 | 6.9 |
| SDSS J1044-0125 | 5.78 | 0.890.7 | 0.840.5 | 1.170.3 | 1.080.24 | 1.8 | |
| SDSS J0840+5624 | 5.84 | 1.98 0.59 | 1.51.4 | 24.310.7 | 2.080.4 | 1.90.4 | 3.2 |
| SDSS J1425+3254 | 5.89 | 1.2 0.36 | 2.01.6 | 15.38.2 | 1.440.3 | 1.3 0.3 | 2.2 |
| SDSS J1335+3533 | 5.9 | 2.35 0.71 | 1.861.4 | 3.161.02 | 1.520.3 | 1.40.3 | 2.4 |
| SDSS J2310+1855 | 6.0 | 5.43.8 | 6.81.9 | 4.00.6 | 3.70.3 | 9.0 | |
| SDSS J2054-0005 | 6.04 | 1.2 0.36 | 1.231.02 | 4.32.6 | 1.510.34 | 1.40.3 | 2.35 |
| ULAS J1319+0950 | 6.13 | 2.1 0.63 | 1.61.3 | 9.54.3 | 2.60.4 | 2.40.5 | 4.05 |
| SDSS J1048+4637 | 6.23 | 1.10.9 | 4.53.2 | 1.820.25 | 1.70.4 | 2.8 | |
| SDSS J1148+5251 | 6.42 | 2.31.9 | 3.41.3 | 2.20.33 | 2.00.5 | 3.4 |
We have collected from the literature a sample of 12 quasars observed between and whose BH mass is known and which are detected through CO and dust continuum emission. Their main physical properties are summarized in Table 1.
2.1 Black hole mass
The masses of the BHs given in Table 1 are taken from the
literature.
For QSOs J0338 and J1148, MBH is computed with
virial estimators using MgII and CIV line widths.
Different virial estimators or scaling relations may provide a factor
of difference in the estimated BH mass (Barth et al. 2003;
Dietrich & Haman 2004; De Rosa et al. 2011).
This is the case of J1148, for which a mass of
M⊙ is obtained from MgII-based scaling relations (Willott et al. 2003;
Barth et al. 2003) while a larger value ( M⊙) is obtained
using the CIV line width (Barth et al. 2003).
For J0338, different emission lines and/or scaling relations instead provide
similar results: M⊙ and M⊙
are estimated using two different CIV-based scaling relations (Dietrich &
Hamann 2004) and the MgII line emission (Maiolino et al. 2007).
The BH masses of J1148 and J0338 quoted in Table 1 are the
average of the different values given in the literature.
The BH mass of J1044 has been computed both from the bolometric
luminosity, Lbol (, Priddey et al. 2003;
, Wang et al. 2010) and from the quasar CIV line
emission (, Jiang et al. 2007) and we adopted the
average value.
The BH mass of the most luminous quasar of the sample, J2310, is the
average of two different values from Wang et al. 2013 ()
and Fan et al. in prep. (, private communication).
Finally, for the remaining quasars in the
sample, we report the values inferred by Wang et al. (2008, 2010, 2013) from
Lbol assuming Eddington-limited accretion.
No errors are given in the literature for these objects.
Since typical uncertainties on the BH masses quoted above are about
, we assume for these quasars a error.
2.2 Molecular gas and dynamical constraints
The molecular gas mass, , in galaxies is usually inferred from the CO() emission line luminosity, through the relation where is the CO luminosity to mass conversion factor (see e.g. Solomon & Vanden Bout 2005 and Carilli & Walter 2013). For those sources in which only line luminosities are available, we convert the lowest CO() transition detected to the CO() luminosity using the CO excitation ladder (lines ratios) observed in high redshift quasars, including J1148 (Riechers et al. 2009; Wang et al. 2010; Carilli & Walter 2013)111 We adopt for QSOs J0840 and J0927 and for J1148 and J1048 (Carilli & Walter 2013). For higher transitions we assume in the case of J0338 and for the remaining objects (Riechers et al. 2009).. However, this represents only a minor correction in estimates of the molecular gas mass in quasar hosts (e.g. Riechers et al. 2009, 2011; Wang et al. 2010). The major source of uncertainty is represented by the unknown value. This factor strongly depends on galaxy properties, such as the gas metallicity, temperature, excitation, and velocity dispersion (see the review by Bolatto et al. 2013), and direct measurements of its value are currently unavailable at high redshifts.
In this work, we adopt the
value M(K km s-1 pc2) which has
been suggested to trace molecular gas in Ultra Luminous Infra Red Galaxies
(ULIRGs; Solomon et al. 1997; Downes & Solomon 1998).
A ULIRGs-like conversion factor is usually assumed as a good approximation
for high redshift galaxies, including Sub Millimetre Galaxies (SMGs) and QSOs
(Tacconi et al. 2008; Bothwell et al. 2010; Ivison et al. 2011; Magdis et
al. 2011; Magnelli et al. 2012).
Errorbars in Table 1 account for the uncertainty on the
observed CO emission line flux () and for the large scatter
() in the adopted conversion factor.
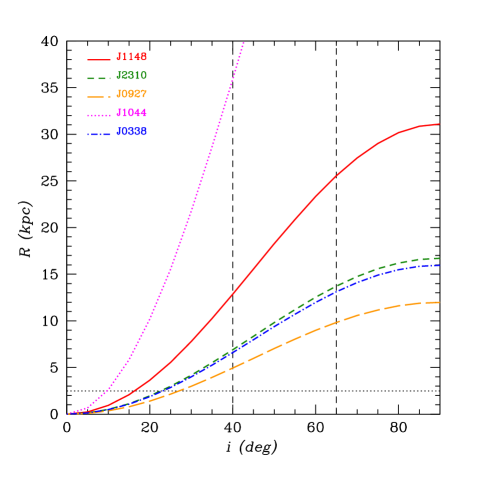
The dynamical mass has been estimated from CO observations, using the formula (Neri et al. 2003; Walter et al. 2004; Solomon & Vanden Bout 2005) where and are the molecular disk radius and its maximum circular velocity, respectively. We take FWHMsin (Wang et al. 2010) where FWHMCO is the Full Width at Half Maximum of the CO lines and is the disk inclination angle. For QSO J1148, the CO emission is spatially resolved out to a radius of about kpc from the central source and the emitting gas is assumed to form an inclined disk with , where indicates face on disks (Walter et al. 2004). Since J1148 is the only objects for which the disk radius can be constrained by the observations, we adopt kpc for all the other quasars in the sample. Differences in the values of sin quoted in Table 1 with respect to previous estimates given in the literature are primarily due to different ways of estimating from the CO FWHM and/or different assumptions on (Maiolino et al. 2007; Walter et al. 2004). We will discuss the dependence on the assumed inclination angle below.
The stellar mass (dynamical bulge) of the quasar hosts is computed as . Strictly speaking, this should be considered as an upper limit to the stellar mass, both because we are neglecting the contributions of atomic gas and dark matter (see the discussion in Section 6), and we are using a conversion factor which maximizes Mstar. In fact, had we used the Milky Way value M⊙ (K km s-1 pc2)-1, the inferred M would be higher, and consequently Mstar lower than the values adopted here. An average uncertainty of is assigned to both the inclination-corrected dynamical mass Mdyn and stellar mass (Walter et al. 2004).
In Fig. 1 we show the relation of the selected high-redshift quasars compared with data and empirical fit obtained for local galaxies by Sani et al. (2011). In the upper panel, an inclination angle is adopted for all quasars, while in the lower panel an average value of is assigned to all QSOs but J1148 (Wang et al. 2010).
As discussed by Wang et al. (2010), observations seem to indicate a deviation from the BH-host scaling relations inferred for local galaxies: , and ratios are about one order of magnitude higher in QSOs, suggesting a faster evolution of the first SMBHs with respect to their host stellar bulge (Walter et al. 2004; Peng et al. 2006; Riechers et al. 2008; Merloni et al. 2010; Wang et al. 2010, 2013). However, this result depends on the adopted disk inclination angle: a lower disk inclination angle results in a shift towards higher dynamical masses (and hence stellar masses), but the displacement on the or plane still persists for some of of the selected quasars. For these quasars, a very small inclination angle, , a more extended disk (larger radius, ) or a different, more complex, description of the disk geometry would be required to reconcile the inferred dynamical/stellar mass with present-day values (Wang et al. 2010, 2013; Valiante et al. 2011).
In addition, it has been pointed out that the observed offset between the high redshift QSOs and BH-bulge relation today may be strongly biased by selection effects (Lauer et al. 2007; Volonteri & Stark 2011): observations at high redshifts are often limited to the most luminous quasars, actually tracing a narrow range of BH masses and host galaxy properties and thus, not representing the whole population of high redshift BHs and hosts. On the other hand, selecting galaxies of similar luminosity, or BH mass, in the local Universe would predict a very similar offset, given the scatter in the BH-host correlations.
2.3 Dust mass, FIR luminosity and SFR
The mass of dust, , of each quasar in the sample is estimated from the rest-frame FIR flux density, assuming optically thin emission:
| (1) |
where is the flux observed in a given band, is the opacity coefficient per unit dust mass, is the Planck function for a dust temperature , and is the luminosity distance to the source. In the Rayleigh-Jeans part of the spectrum, dust radiates as a ’grey-body’ with . The same fit of the spectrum adopted for J1148 in Valiante et al. (2011) is used here to derive dust temperature , and FIR luminosity for quasars detected at different wavelengths in the range (350-1200) : J0338, J0927, J2310 and J1148 (Leipski et al. 2013; Fan et al. in prep. private communication). We adopt different absorption coefficients per unit dust mass, and spectral index given in the literature (see Table 1 in Valiante et al. 2011). For these quasars the computed dust temperature ranges between 37 K and 59 K and the values quoted in the table are the average dust mass obtained with this method. The other quasars in the sample do not have detailed spectral Energy Distrubutions (SEDs) as the previous ones. For these objects, we have computed from the continuum detection at 1200 m, using the same set of parameters, , , and obtained from the best-fit of the FIR emission of J1148. The resulting mass of dust ranges between M⊙ and M⊙, with errorbars accounting for the minimum and maximum values.
The SFRs are usually inferred adopting the Kennicutt (1998) relation between the rate of star formation and the FIR luminosity: . This scaling relation assumes that stars have solar metallicity and are formed in a 10-100 Myr burst according to a Salpeter IMF. For the same FIR luminosity, a factor 25 lower SFRs are obtained if a standard ( M⊙) or a top-heavy ( M⊙) IMFs are adopted222Correcting for the different IMF we found FIR-to-SFR conversion factors of and for a Larson standard and top-heavy IMF, respectively.. The SFRs listed in Table 1 are obtained from the FIR luminosity in the wavelength range , adopting the conversion factor of required for a Larson IMF with characteristic mass M⊙.
In addition, the above relation between and SFR relies on the assumption of starburst-dominated dust heating, when all the FIR luminosity is re-emitted by dust heated by young stars. For this reason, we consider these values as upper limits to the real rates of star formation as in luminous QSOs a non negligible contribution to dust heating ( up to ) may come from the AGN itself (Wang et al. 2010; Schneider et al. 2014b), further lowering the estimated SFRs by a factor .
Finally, as a reference for the ISM gas metallicity, we adopt the value inferred from observations of the Narrow Line Regions (NLRs) of high-redshift quasars, which do not show a significant redshift evolution up to (Nagao et al. 2006; Matsuoka et al. 2009).
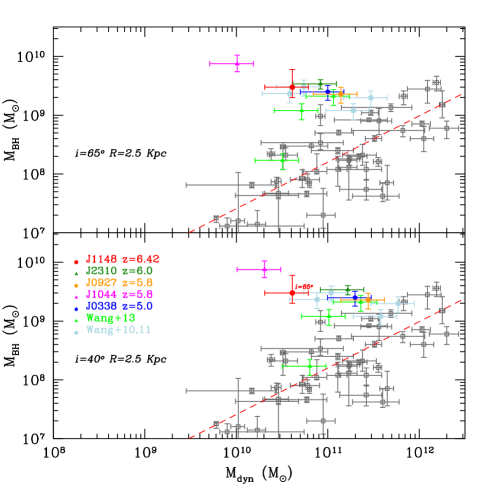
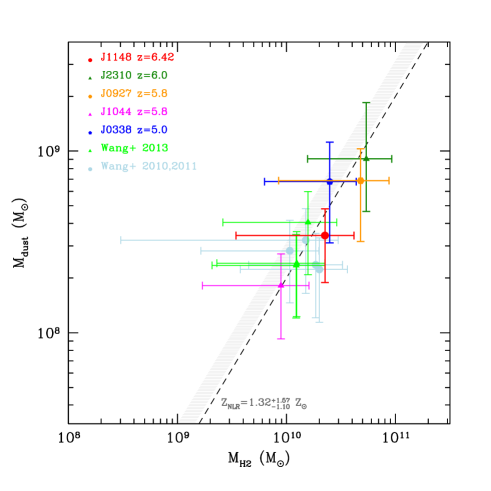
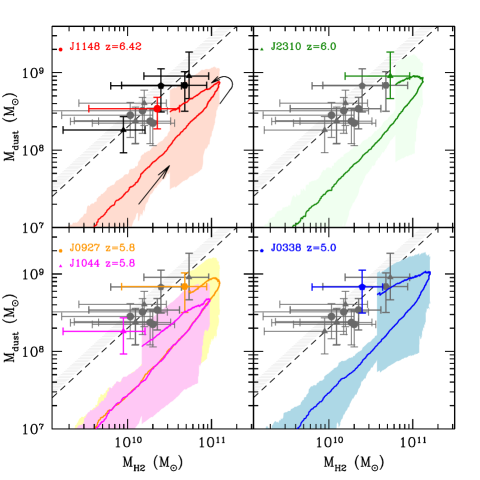
Fig. 2 shows the dust mass as a function of the H2 mass for the quasars sample. The data clearly point to a tight correlation between the masses of dust and H2, suggesting that dust is mostly associated to the dense molecular component of the ISM. A similar conclusion is drawn by the analysis of the SED of J1148, which requires that of dust is distributed into dense clumps (Schneider et al. 2014b). The grey region in Fig. 2 represents the mass of gas-phase metals obtained as , with the dashed line indicating the solar abundances, . All the data points lie close to this region, indicating that the large dust masses require almost all the heavy elements present in dense clouds traced by CO emission to be in the form of dust grains.
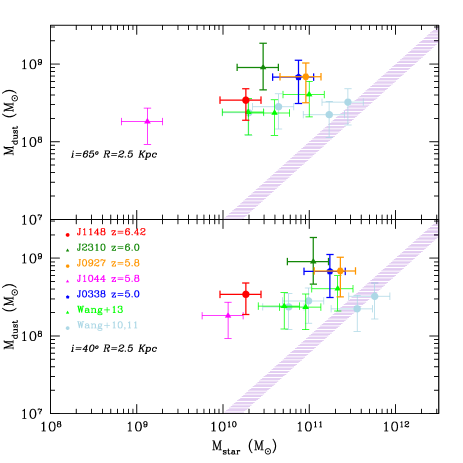
Fig. 3 shows the dust mass as a function of the
stellar mass for the 12 QSOs in the sample. Since stellar masses have been computed as the
difference between the dynamical and molecular gas masses, their values
depend on the assumed inclination angle ( upper panel, or
lower panels).
The pink shaded area in the figure represents the maximum mass of dust produced
by a stellar population formed in a single instantaneous burst at solar
metallicity.
It is obtained assuming a maximum IMF-averaged dust yield333The
IMF-weighted stellar yield is defined as the total mass of dust and metals
produced per unit stellar mass formed in an instantaneous burst of star
formation. Here we use the values obtained for stars formed with
and a Larson IMF with two different values of the characteristic mass,
(standard and top-heavy).
of . This includes contribution from supernovae
(SNe, Bianchi & Schneider 2007) and intermediate mass (AGB,
Ferrarotti & Gail 2006)
stars and the range spans variations in the adopted IMF (standard/top-heavy).
The figure shows that for the majority of the QSOs in the sample, the
mass released by the stars falls short of the observed value. Not surprisingly,
the only two exceptions are objects whose stellar masses
are large enough to lie within the scatter of the local
relation (see Fig.1).
Note that here we are assuming that SNe produce
M⊙ of dust but that moderate destruction by the reverse
shock leads to an effective yield of M⊙
(Bianchi & Schneider 2007), consistent with observations of SN remnants (see
Fig. 6 of Schneider et al. 2014a). The effect of a higher SN-dust yield will
be discussed in Section 6.
In addition, here we are neglecting the destruction of dust grains by SN
shocks in the ISM, hence maximizing the contribution from stellar sources.
Therefore, alternative processes must play a role.
Dust condensation in quasar winds (Elvis et al. 2002) and grain growth in
molecular clouds have been proposed as alternative dust sources.
The first possibility has not been deeply investigated yet, but Pipino et al. (2011)
suggest that the
contribution of the quasar winds to dust production should be negligible with
respect to that of stellar sources on the large galactic scales.
On the other hand, dust accretion in molecular clouds is already considered the
primary non-stellar source of dust in the Milky Way and the Large Magellanic
Cloud (Zhukovska et al. 2008; Zhukovska & Henning 2013; Schneider et al. 2014a) and
it has also been advocated to solve the so-called
dust budget crisis in high redshift galaxies and quasars, where the dust
produced by stellar sources is not enough to explain the observed dust
masses (Michalowski et al. 2010; Valiante et al. 2011; Pipino et al. 2011;
Rowlands et al. 2014).
In summary, it appears that QSOs at redshifts show similar properties, both for the central engine (the mass of the BH) and for the host galaxy (the dynamical, dust and molecular gas masses), pointing to a common evolutionary scenario.
3 Summary of the model
In this section, we give a brief summary of the hierarchical semi-analytical model GAMETE/QSOdust, presenting the additional features that have been recently implemented. We refer the interested reader to Valiante et al. (2011) for a more complete presentation of the model.
GAMETE/QSOdust describes the co-evolution of BHs and their host galaxies, following at the same time the metal and dust enrichment of the interstellar medium. The observed properties of the quasars can be used to constrain the set of model parameters which define a specific evolutionary scenario, such as the efficiency of star formation and the efficiencies of BH accretion and feedback.
We start with a dark matter halo of M⊙, which is believed to host SMBHs (Fan et al. 2004). This massive halo is decomposed into progressively smaller dark matter progenitors, backward in time, according to the Extended Press-Schechter (EPS) theory, using a binary Monte Carlo algorithm with mass accretion (see Salvadori et al. 2007 and Valiante et al. 2011 for details)444Note that, the EPS formalism underestimates the abundance of massive halos ( M⊙) at redshift with respect to N-body simulations. However, the discrepancy between the semi-analytical prediction and numerical simulations is within a factor of 2, and typically lower than (Lacey & Cole 1994; Somerville et al. 2000). This does not significantly affect the our study.. With this method, we produce several hierarchical merger histories along which the gradual build up of the nuclear SMBH and the host galaxy proceeds hand in hand.
At each redshift, seed BHs of M⊙ are assigned to progenitors, corresponding to density fluctuations, at the time they reach the threshold mass required to form stars. As a result, BH seeds are planted in only a fraction of progenitor halos at (see Figure 2 in Valiante et al. 2011). The results are not sensitive to the adopted BH seed mass provided that M⊙. This is due to the interplay between Eddington-limited BH accretion and AGN feedback processes which efficiently regulate the BH growth. The value of this mass threshold as well as the dependence on the assumed seed BH mass are discussed in Valiante et al. (2011).
In modelling the evolution and feedback of the BH, we were guided by several
works, among which Springel, Di Matteo & Hernquist (2005), Di Matteo et al.
(2005, 2008) and Sijacki et al. (2007).
Accretion onto the BH is assumed to proceed at the Eddington-limited rate, with
a gas accretion rate defined as the minimum between the Eddington value
and the accretion rate computed using the Bondi-Hoyle-Lyttleton formula
(BHL, Eqs. 5 and 6 in Valiante et al. 2011).
The BHL accretion rate is proportional to the BH mass and to
the gas density at the so-called Bondi radius (see Eq 6 in Valiante et al.
2011).
This density is computed assuming an isothermal profile with a flat core.
However, due to the lack of spatial resolution and
proper physical modelling of the gas conditions close to the BH, we introduce a
parameter, , that represents the efficiency of gas accretion (Springel
et al. 2005; Di Matteo et al. 2005).
The fraction of energy released by the accreting BH that is transferred to
the host galaxy, is commonly parametrized as (Di Matteo et al. 2005),
, where is
the radiative efficiency, is the gas accretion rate and
is the wind efficiency tuned to reproduce the final host gas
mass. Indeed, a robust prediction of the model is that the evolution of the
nuclear BH and of the host galaxy are tightly coupled by quasar feedback in
the form of strong galaxy-scale winds (Valiante et al. 2011):
.
For J1148, the predicted mass outflow rates are in excellent agreement with the
observations (Valiante et al. 2012).
At each time, the SFR is assumed to be proportional to the available mass of gas, , with a total efficiency, , that is enhanced during major mergers:
| (2) |
where is the dynamical time, and are the quiescent and starburst efficiencies, respectively. The latter efficiency has been parametrized as a normalized Gaussian distribution of the mass ratio of the merging halos (Valiante et al. 2011).
Finally, the enrichment of the host galaxy ISM in metals and dust is computed in a self-consistent way assuming that both AGB stars and SNe contribute to the total metals and dust mass budget, injecting their products into the ISM according to the progenitor stars evolutionary timescales. The life-cycle of dust implemented in GAMETE/QSOdust is regulated by both destruction by interstellar shocks and grain growth.
The semi-analytical model GAMETE/QSOdust has the advantage to enable
an extensive investigation of the parameter space on relatively short computational
times.
The choice of the main free parameters, namely the efficiency of quiescent
() and bursting () star formation, BHL accretion
() and AGN-driven wind , all concur in shaping the
predicted SFH, picturing different plausible evolutionary scenarios.
In all models presented in Valiante et al. (2011), and
have been chosen to reproduce the final SMBH and gas masses
while the SF efficiencies have been changed to investigate the effect of
different SFHs on the evolution of the host galaxy properties.
In the present work we will focus on one of these models (B3)
as our reference model and apply it to the selected sub-sample of quasars,
to check whether they follow a common evolutionary scenario, as suggested by
the similar properties of their central engine and host galaxies.
3.1 The fiducial scenario
Our fiducial model is able to reproduce the final dust mass for J1148 providing a sustained SFR as inferred from the FIR luminosity of this quasar. In this model, stars form according to a Larson IMF:
| (3) |
with and a characteristic stellar mass , normalized to 1 in the M⊙ mass range (standard IMF). At each redshift, stars form quiescently out of the available gas in each progenitor galaxy with an efficiency . Each time a major merger occurs, a burst of star formation with efficiency is triggered, providing an additional contribution to the stellar mass formed; the value of this parameter depends on the merging galaxies mass ratio, reaching a maximum of (see Table 2). For J1148 we assumed and . However, the choice of the BH accretion and AGN-driven wind efficiencies in the present work will be discussed in the next section.
The final stellar mass is predicted to be . This is one order of magnitude larger than for J1148, displacing the final from the observational data point toward the local correlation.
3.2 New features of the model
The improvement of the code was guided by two important results: (i) grain growth in dense molecular gas is required to reproduce the mass of dust in J1148, and (ii) more than of the total dust budget must be distributed in dense clumps to reproduce the observed SED of J1148 (Schneider et al. 2014b). These conclusions are supported by the relations shown in Fig. 2 and 3 discussed in Section 2. Indeed, efficient grain growth requires both dust and gas-phase metals to be in molecular clouds, where the dust is shielded from the destructive effect of interstellar shocks.
For these reasons, we have improved the prescriptions in our semi-analytical model in order to mimic a two-phase ISM, namely a diffuse environment (warm/hot atomic gas) in which the expanding ejecta of SN shocks can destroy the dust and a cold-dense medium (the total mass of material in molecular clouds) in which star formation and grain growth take place. Hereafter, we will refer to these two components of the ISM as diffuse gas and dense gas or molecular clouds (MC). The total ISM mass is divided in these two different components, and .
At the time of the virialization of its host dark matter halo, each galaxy is composed only by diffuse gas, i.e. and . Then, the time evolution of these two components as well as the evolution of metals and dust in the two phases, is followed by solving a network of differential equations. In details:
| (4) |
and
| (5) |
As soon as a progenitor galaxy reaches the threshold mass for star formation, MC are assumed to condense out of the diffuse gas and stars form in MC at a rate SFR(t). The stellar products (gas, heavy elements and dust) as well as the material accreted from the external medium are returned/injected into the diffuse medium at rates , , and given by Salvadori et al. (2008) and Valiante et al. (2009). Finally, and are the rate at which the gas is ejected out of the diffuse ISM and MCs, respectively. These two terms are parametrised as:
| (6) |
and
| (7) |
where is the total gas outflow rate due to both SN and AGN feedback (see Valiante et al. 2011, 2012 for details on these two contributions) and is the cold gas mass fraction.
The physical processes driving the formation of cold dense molecular clouds (gravity, magnetic fields, turbulence, shocks, radiation) or controlling their survival against disruptive events (cloud-cloud collision and/or winds from massive stars) are still far from being understood (see Dobbs et al. 2013 for a thorough review of the current state of the field). A detailed description of the formation and evolution of single clouds is beyond the scope of this work. Here we are interested in the variation of the total amount of material that can be found in MC, constrained to reproduce the observed mass of molecular gas. Therefore, the term approximates the cycling of gas between the diffuse and dense phases, including both cloud formation and dispersion from/into the diffuse gas.
The rates describing the cycling of material between the two ISM phases can be written as where and represent the condensation and disruption efficiencies and and are MC formation and destruction timescales, respectively. These two timescales are assumed to be proportional to the dynamical time, , so that in each progenitor halo the SFR and the rate of mass exchange between the two phases are proportional to each other.
| (8) |
and
| (9) |
Hence, , where , to ensure the formation of MC.
The new features of the code and their dependence on the parameters space have been extensively tested applying the model to the Milky Way. More details of this analysis and a comparison with observational data will be given in a forthcoming work (De Bennassuti et al. 2014). Here we fix the cloud formation (A) and dispersal (B) coefficients to reproduce the observed molecular gas mass. In particular, J1148 requires that and that .
Similarly, the total mass of heavy elements (gas-phase metals and dust) in the two phases evolves according to the following equations:
| (10) | |||||
and
| (11) | |||||
where and are the metallicities of the diffuse and dense gas.
The major improvement in the chemical network is in the equations describing the evolution of the dust. In the previous work (Valiante et al. 2011), we assumed that at each time a fixed fraction of the total dust mass is shielded against destruction by interstellar shocks and can experience grain growth; in addition, no dust ejection in SN-driven or BH-driven outflows was implemented. These assumptions, although oversimplified, allowed us to reproduce the observed dust mass of J1148, pointing out that grain growth in MC dominates the dust mass even at . In this work, we overcome these two limitations, as we can now follow consistently the evolution of the two different phases as a function of time. In the new chemical network, dust evolution is described as:
| (12) | |||||
and
| (13) | |||||
where and are the dust-to-gas ratios in the two phases. The destruction timescale is the same as in Valiante et al. (2011, eq. 13). Note that the time evolution of the total mass of metals and dust are and , consistently with Eqs. 17 and 18 in Valiante et al. (2011). In each phase, the mass of the gas-phase metals can be computed as .
The considerations discussed in section 2 and, in particular, the observed tight correlation between the observed and suggest that rapid and highly efficient grain growth takes place in the dense molecular gas of high-redshift QSOs. We therefore maximize the dust accretion process assuming that all the gas-phase metals, , that collapse in MC (during the clouds condensation stage) and survive the SF process (are not reincorporated into stars) can be accreted onto dust grains. Hence, in each galaxy of the merger tree the grain growth rate is computed as:
| (14) | |||||
where is the mass fraction of gas-phase metals in the diffuse phase. Hence, in our formulation the dust accretion timescale depends on local conditions (metallicity and gas mass in MC), and shows a large variation among different progenitor galaxies, with average values ranging between a few Myr to a few tens of Myr.
4 Model results
All the quasars in the sample show similar properties
in terms of the SMBH, molecular gas, dynamical and dust masses.
Thus, one can expect that their evolution has occurred along
similar pathways. To investigate this issue, we apply the 2-phase fiducial
model to 5 out of the 12 quasars listed in Table 1:
J1148 at , J2310 at , J0927 and J1044 at , and J0338 at
.
As shown in Fig. 1, J1148 and J1044
are the most peculiar objects in the sample, presenting the largest
deviation from the local relation. Conversely, J0927 and
J0338 are located closer to the local value in the BH-dynamical/stellar mass
plane, but still outside the observed scatter. Finally, J2310 is the brightest
quasar in the sample, with the largest estimated dust mass.
For each quasar, we compute 50 different merger histories. In all the figures presented in this section, the solid lines indicate the results averaged over the 50 merger trees and the shaded area show the dispersion. For all but the quasars J0338 and J1044, we use the 2-phase fiducial model with the same parameters adopted in the model B3 presented in Valiante et al. (2011) and the new free parameter suited for J1148 (see Table 2).
| QSO | ||||||
|---|---|---|---|---|---|---|
| J0338 | 0.1 | 0.05 | 8.0 | 230 | 3.08 | |
| J0927 | 0.1 | 0.05 | 8.0 | 200 | 3.08 | |
| J1044 | 0.1 | 0.05 | 8.0 | 210 | 3.08 | |
| J2310 | 0.1 | 0.05 | 8.0 | 200 | 3.08 | |
| J1148 | 0.1 | 0.05 | 8.0 | 200 | 3.08 |
The QSO J0338 requires a higher BH accretion efficiency in the BHL formula (see eq. 6 in Valiante et al. 2011), , to compensate for the lower gas density at . Indeed, both in semi-analytical models and in hydrodynamical simulations, parametrizes out poor knowledge of the gas density in the vicinity of the BH accretion radius. In the case of J1044, a higher BHL accretion efficiency, , combined with a lower BH-feedback efficiency, , are required in order to ensure the growth of the largest SMBH of the sample, with a final BH mass of M⊙ at . Even if detailed local variations of the gas density can not be captured by a semi-analytical approach, in our model the average gas density, the rate of major mergers and the distribution of seed BHs in the first progenitors, which depend on redshift, all concur in shaping the evolution of the QSO. For a discussion of the non-linear dependence of BH growth on the alpha parameter, the AGN wind efficiency, and the adopted mass of BH seeds we refer the interested reader to Valiante et al. (2011).
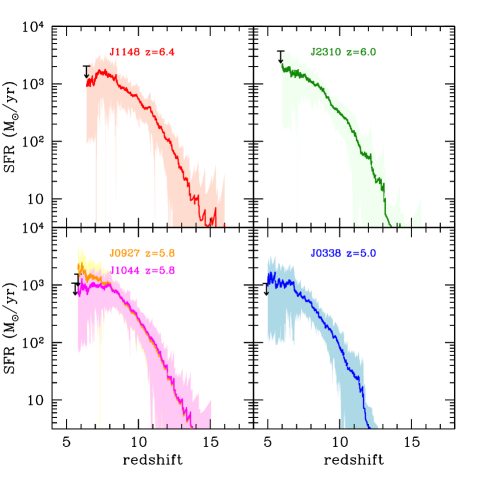
In Fig. 4 we show that all quasars follow a bursting SFHs with high final rates ranging between 800 and 2000 . These values are in good agreement with the rates computed from the FIR luminosity, once the correction due to the (non-negligible) contribution of the AGN to dust heating is taken into account (see discussion in Section 2). In all the panels, the data points indicate the SFRs corrected for the Larson IMF with , which are approximately a factor 2 lower than the values for a Salpeter IMF quoted in Table 1. The down-turns and the modulations of the SFHs at are due to the negative effect of BH feedback, which drives a powerful outflow of material.
The corresponding evolutionary paths followed in the plane are shown in Fig. 5; for reference, we also show the observed values for high redshift QSOs (filled data) and local galaxies (open squares). As expected, the final SMBHs are all reproduced by the model, while the high SF efficiencies result in final stellar masses in the range M⊙, required to reproduce the observed dust mass and final SFRs. These are a factor of larger than the the observed values estimated as , which are shown by the filled data points in all panels. This tension is less critical for quasars like J0927 and J0338 which are found to lie within the scatter of the correlation observed for local galaxies.
The differences among different quasars can be explained by noting that,
although similar final BH masses are produced and the same value for
the SF efficiency is adopted for all quasars (see Table 2), the nuclear BHs grow at
slightly different rates: on the one hand the assembly of the SMBHs of J2310, J0927,
and J0338 is slower than that of J1148, allowing a times larger
final stellar masses; on the other hand, a SFH and a final stellar mass similar
to that of J1148 are found for J1044, where the larger SMBH
mass requires a faster BH growth with respect, for example, to quasar
J0927, observed at the same redshift.
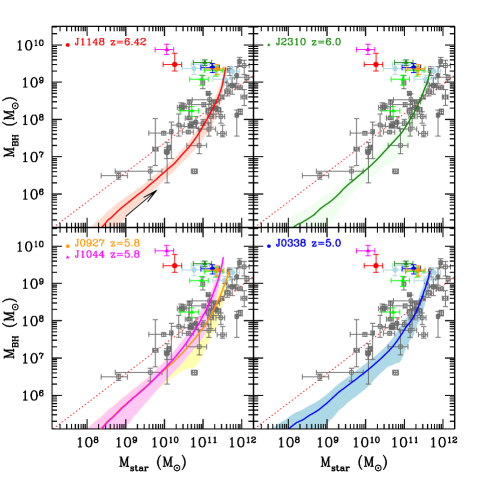
. Filled data points represent the high redshift quasars, as labelled in each panel, while open squares are a collection of local galaxies with the empirical fit (dashed line) by Sani et al. (2011).
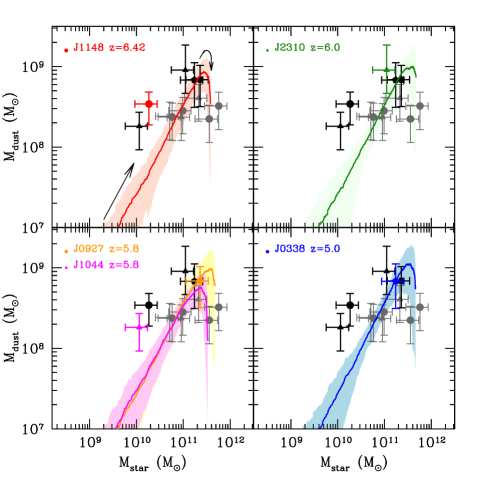
Finally, Figs. 6 and 7 show the evolution of the mass of dust as a function of the molecular gas and stellar masses, respectively.
The model well reproduces the observed dust and molecular gas masses but over-predicts the final stellar mass. The curves show the redshift evolution of these quantities as predicted by the fiducial model B3 for each selected QSO. Following the hierarchical build-up of the host galaxy, the dust mass increases with increasing molecular and stellar masses (see black arrows in the upper left panels), driven by the enrichment of the ISM with heavy elements and dust and by efficient grain growth in MCs. At the final redshift, each evolutionary track matches the corresponding observed data point in the plane, but it is off-set toward larger stellar masses in the plane. These evolutionary paths confirm for a larger sample of QSOs the results obtained from our previous analysis that was applied to QSO J1148 only (Valiante et al. 2011, 2012; Schneider et al. 2014b).
In the picture of the Galaxy-BH co-evolution, the so-called cosmic cycle (Hopkins et al. 2006), the onset of the active quasar phase follows in time a stage in which the emission of the central source is completely obscured by the surrounding optically thick material. At this stage, the BH continues to grow in the buried quasar while a strong starburst ( M⊙/yr) is ongoing. These are the properties of Sub Millimeters Galaxies (SMG) that are observed to have dust and molecular/stellar masses comparable to high redshift quasars hosts (Santini et al 2010; Michalovski et al. 2010; Magnelli et al. 2012).
In the models shown in Figs. 6 and 7, the transition between a starburst-dominated and a QSO-dominated evolution is regulated by the growth of the central SMBH. When the stellar bulge reaches a mass the ISM is enriched by a large dust mass, , with a dust-to-gas ratio , comparable to the values inferred for SMGs and ULIRGs (Santini et al. 2010). At this stage, the nuclear BH has already grown to a mass M⊙, a strong energy-driven wind starts to clear up the ISM of dust and gas through a large outflow, damping the star formation rate and un-obscuring the line of sight toward the QSO (see the hook-like shapes in the tracks of Figs. 6 and 7). For the QSOs that we have investigated, we predict a final gas (molecular+atomic) mass of M⊙ and an AGN-driven gas outflow rate ranging between Myr. At these large rates, AGN-driven winds would be able to completely deplete the host galaxies of their gas content in less than Myr, shutting down both the star formation and the BH activity, and leaving behind a dead quasar that will presumably evolve in a red (cD) galaxy. In other words, our model predicts the active quasar phase to last yr. This value is in perfect agreement with typical quasar lifetime values ( yr) required to match the present-day BH mass function and the QSO luminosity function at (Haiman & Loeb 1998; Martini et al. 2004), as well as with estimates obtained through the transverse proximity effect (Worseck 2007; Gallerani 2008).
.
5 The SMG progenitors of high-z QSOs hosts
All the evolutionary tracks discussed in the previous Section represent the time evolution of the global SFH, dust, stellar, and gas content of the host galaxy, without discriminating among the properties of single progenitor systems of the final QSO host. In reality, at each redshift a given QSO host is characterized by a large number of progenitor galaxies, each one characterized by its specific evolution. Hence, the hypothesis that high redshift QSOs have passed through an SMG-phase has to be tested against the properties of their individual progenitors.
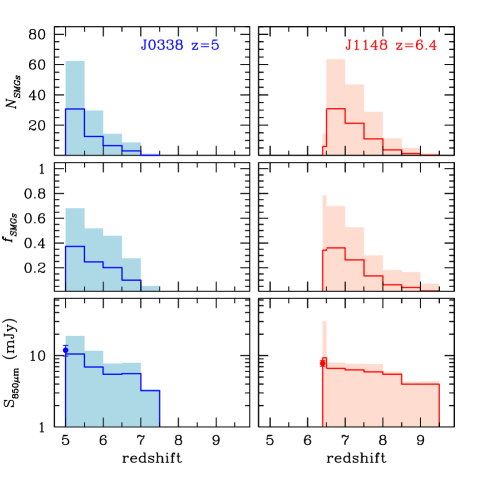
We focus on two QSOs, J1148 and J0338, that represent the most and the less distant QSOs among the objects that we have considered in the present study. Following Hayward et al. (2013), we compute the flux density at of each progenitor galaxy in the merger trees as:
| (15) |
Among all the progenitors, we classify as starbursts those which are characterized by a SFR Myr, and as SMG starbursts which also have a dust mass M⊙ and a flux density of mJy (Coppin et al. 2008; Michalovski et al. 2010, 2012; Magnelli et al. 2010,2012; Hayward et al. 2011, 2012).
In Fig. 8 we show the redshift distribution of the average number of SMG, NSMGs, and of the average fraction of starbursts which are SMG, ; for both quasars, each quantity is averaged over 50 different merger trees. As it can be seen in the upper and middle panels, the first progenitor galaxies of J1148 (J0338) start to enter the SMG phase at redshifts ; hence in the last Gyrs of their evolution. At earliest epochs, there are many starbursting progenitors but the dust content in their ISM is too low to power a significant FIR luminosity. Thereafter, an increasing number of progenitors are classified as SMGs, reaching up to of the total starbursts progenitors around the final redshift . As it is shown in the bottom panels of the figure, both QSO hosts meet the criteria to be characterized as SMGs.
We conclude that if the semi-empirical formula (eq. 15) that we have used to compute the flux density at 850 m can be extrapolated at redshifts , we should expect to observe SMG precursors of high-z QSOs up to although their number rapidly decreases with redshift.
Current surveys show that observed redshift distribution of SMGs has a maximum at (Chapman et al. 2005; Yun et al. 2012, Smolcic et al. 2012). The redshift distribution and evolution of SMGs appear to be very similar to those of QSOs, suggesting a link between the two populations of objects (Maiolino 2008). The exact SMGs number counts at require the identification of the optical (or near-IR) counterparts of SMGs to determine their redshift through spectroscopic followup. Most of the SMG detections have been obtained so far through single dish telescopes, whose angular resolution is low (). This implies that several optical/near-IR candidate couterparts are found within the telescope beam. It is therefore necessary to obtain mm-submm observations of high-z SMGs at higher angular resolution to better constrain their redshift evolution. PdBI observation, characterized by angular reolution , have indeed shown that the surface density of SMGs is higher than predicted by models (Smolcic et al. 2012 and references therein). Moreover, submm color-selection techniques have recently enabled the detection of a massive starburst galaxy at redshift 6.34 (Riechers et al. 2013). Although these observations are very challenging, larger and deeper mm surveys in the future will allow to better constrain the evolution of starburst galaxies at high redshift.
6 Discussion and Conclusions
In this paper we have presented a 2-phase semi-analytical model for the formation and evolution of high redshift quasars and their host galaxies in the framework of hierarchical structure formation. The model allows to investigate possible pathways to the assembly of the first SMBHs and of their host galaxies through cosmic times. The evolution of the mass of gas, metals and dust are consistently followed in both the diffuse and dense ISM as described in Section 3. This model has been applied to a sample of quasars observed at redshifts and that show similar observed properties.
To explain the observed properties of these quasars, our study points to a common evolutionary scenario: during the hierarchical assembly of the host DM halo, stars form according to a standard IMF (hence a Larson IMF with a characteristic mass of M⊙), via quiescent star formation and efficient merger-driven bursts. At the same time, the central BH grows via gas accretion and mergers with other BHs. As the BH reaches a threshold mass of M⊙ its growth becomes more rapid and the predicted evolution steepens (see fig. 5). In this scenario, all the QSOs host galaxies are characterized by final stellar masses in the range M⊙, a factor 3-30 larger than the maximum values allowed by the observed . Note that similar conclusions have been found by numerical simulations aimed to describe both the formation mechanism, metal enrichment and dust properties of QSOs, among which J1148, (Li et al. 2007, 2008), which also predict by a final stellar mass of M⊙.
To better understand this apparent tension among model predictions and
observed data, in our
previous investigations, which have focused on J1148, we have explored
alternative scenarios that we critically propose here for discussion:
A top-heavy stellar initial mass function?
A top-heavy IMF represents an alternative way to increase the integrated dust
and metal yields without requiring a higher star formation efficiency and thus
a larger final stellar mass.
At high redshift, a stellar mass distribution biased towards more massive stars
could be favoured by the physical properties of the ISM (Schneider & Omukai
2010; Smith et al. 2009; Jappsen et al. 2009; Klessen, Spaans & Jappsen 2007).
In Valiante et al. (2011), we have shown that models with Larson
IMF and a characteristic mass M⊙ (top-heavy IMF)
can reproduce the chemical properties of the host galaxy of J1148 without
exceeding the upper limit set by the observed on the
final stellar mass. However, this requires a lower SF efficiency and thus a
lower SFR, which at is M yr555this
value is the average over 50 different merger tree realizations with the
error representing the dispersion.
This is too small to account for the observed FIR luminosity of the QSO of
L⊙ (see Table 1).
In fact, using the conversion factor between the SFR and the FIR luminosity for a
top-heavy IMF (see Section 2.3), we find that
L⊙, a factor of smaller than the observed value.
This simple argument has been further confirmed by a detailed radiative transfer model
(Schneider et al. 2014b).
Hence, a top-heavy IMF model could accomodate the tension beween the dust and stellar
masses but at the price of underpredicting the final SFR and FIR luminosity.
A larger stellar dust yield?
An alternative solution could be to assume more efficient sources of dust, hence to increase the stellar dust yield. In our model, dust is produced by the two main stellar sources, AGB stars and SNe (Valiante et al. 2009, 2011). Depending on the stellar progenitor mass and initial metallicity, AGB stars with masses in the range M⊙ can release M⊙ of dust (Ferrarotti & Gail 2006; Zhukovska et al. 2008). Dust formation in SN ejecta represents a rapid and efficient way to enrich the ISM. SN dust yields for stars in the mass range M⊙ with metallicities have been taken from the grid developed by Bianchi & Schneider (2007). These authors find that of dust form in the ejecta but that only between 2 and 20 per cent of the initial dust mass survives the passage of the reverse shock, on time-scales of about yr from the stellar explosion, depending on the density of the surrounding interstellar medium. Our fiducial model assumes moderate destruction by the reverse shock, with effective SN yields of M⊙ (Valiante et al. 2009). Assuming these dust yields, it has been shown that the dust mass released by stellar sources only (SNe and AGB stars) is not enough to explain the dust mass observed in high redshift QSOs (see fig. 3) and grain growth in MC has been invoked or adopted in models as a possible solution (e.g. Draine 2009; Michalowski et al. 2010, Valiante et al. 2011; Mattsson et al. 2011; but see also Zafar & Watson 2013). Similar conclusions have been recently drawn by Rowlands et al. (2014) for SMG. They find that the dust mass observed in a sample of high-redshift () SMG requires much higher SN yields and/or efficient grain growth in molecular clouds.
Recent Herschel observations have shown that previous
detection of dust in SNe and SNRs based on mid-IR photometry
may have missed the dominant cold dust components: indeed,
a dust mass of M⊙ has been detected in SN1987A
(Matsuura et al. 2011) and comparable values have been observed in
Cas A (Barlow et al. 2010; Nozawa et al. 2010) and the Crab (Gomez et al. 2012).
While this is certainly an important confirmation of theoretical models,
none of the above SNR is old enough (ages yr)
for the reverse shock to have significantly affected the newly formed dust.
In addition, even adopting maximally efficient SN yields,
the mass of dust in high-z objects could not have originated by
stellar sources only, unless dust destruction by interstellar shocks is
neglected (Dwek. Galliano & Jones 2007; Gall et al. 2011; Zafar & Watsson 2013).
While grain destruction in the ISM is still subject to many uncertainties,
theoretical models show that sputtering in gas-grain collisions and vaporization in
grain-grain collisions can be very efficient (Jones et al. 1996;
Jones & Nuth 2011, Jones 2012; Bocchio et al. 2012; Jones et al. 2013;
Asano et al. 2013).
Silicate and carbon dust destruction occurs on timescales Myr that
are comparable or even shorter than the evolutionary timescales of high-z galaxies.
Observations indicate that dust destruction takes place in
regions of the ISM shocked to velocities of the order of 50 - 150 km s-1
(Welty et al. 2002; Podio et al. 2006; Slavin 2009).
In addition massive gas outflows on galactic scales have been observed for
starbursts and QSOs both in the local Universe and at high-z (Feruglio et al.
2010, Nesvabda et al 2010, 2011; Maiolino et al. 2012; Cicone et al. 2012).
An outflow rate of M yr has been inferred from CII
observations of J1148 (Maiolino et al. 2012), in good agreement with model
predictions (Valiante et al. 2012).
In these extreme environments, it is hard to believe that all the newly formed
dust injected by stellar sources is conserved in the ISM, without being
destroyed or being ejected out of the galaxy. Hence we conclude that maximally
efficient stellar dust yields may provide a solution only if all the stellar
dust injected in the ISM is conserved, without destruction and/or ejection.
Shorter evolutionary timescale? The fiducial scenario that we have presented predicts that high redshift QSO hosts are characterized by SFR Myr in the last Myr of their hierarchical assembly. The associated stellar mass formed in this starburst is and exceeds the upper limits inferred from . For the two QSOs J1044 and J1148, the stellar mass is within the observed upper limits only assuming a burst of shorter duration, Myr. This time-scale is comparable to the lifetime of a star and can be shown to be too short to explain the observed dust masses of QSO hosts and the mass of the nuclear SMBHs.
For a 20 Myr burst, the IMF-weighted stellar dust yield ranges between () and () for a standard and a top-heavy IMF, and the values in parenthesis indicate the corresponding yields when maximally efficient SN dust models with no reverse shock destruction are considered (Valiante & Schneider 2014). Hence, the dust mass produced by a young starburst is at most M⊙, too small to account for the observed dust masses.
Moreover, if QSO host galaxies were only 20 Myr old, their SMBH should have grown from a seed of comparable mass, M⊙, assuming continuous accretion at the Eddington rate. This is about orders of magnitude higher that the heaviest seed BHs expected to form by gas- or stellar-dynamic direct collapse (Bromm & Loeb 2003; Begelman, Volonteri & Rees 2006; Lodato & Natarajan 2007; Omukai et al. 2008, Devecchi & Volonteri 2009; Bellovary et al. 2011).
Hence, we conclude that observations do not support the idea that high-z QSO hosts
have evolved to their final in only 20 Myr.
Are dynamical mass measurements missing some of the stars?
Possible solutions to the discrepancy between the stellar mass predicted by theoretical models and the upper limits derived from can be found in the assumptions made to estimate the dynamical and molecular gas masses from the observations. As we have discussed in Section 2, the largest uncertainties are due to the assumed properties of the CO-emitting disk; in particular, the radius and the inclination angle .
Observational constraints on these two parameters are available only for J1148, in which high resolution imaging has enabled to resolve CO emission within kpc and (Walter et al. 2004, Riechers et al. 2009). As we have discussed in Section 2.2, a disk radius of and inclination angles have been commonly assumed to describe high-z QSOs (Wang et al. 2010, 2013). It is important to note, however, that such compact regions represent only a very small fraction of the virial radius, , for these very massive halos. This may be an indication of a more extended distribution of their actual baryonic content (Khandai et al. 2012, see discussion below).
To accommodate the stellar masses predicted by the fiducial models, , the minimum upward correction to ranges between 2 - 3 for J2310, J0927, and J0338; larger corrections are required for J1148 (a factor 10) and J1044 (a factor 15). In Fig. 9, for each QSO we show the properties of the disk that would yield, for a given CO line FWHM, the minimum dynamical mass expected by the models, : , where sin , and is the observed mass given in Table 1. It is clear from the figure that a given dynamical mass can be accommodated within a radius that grows with the inclination angle.
For J1148, the predicted dynamical mass M⊙ would be enclosed within a radius of kpc or within a highly inclined disk (Wang et al. 2010). However, high-resolution Very Large Array (VLA) observations of the CO emission show that the emission breaks up into two regions, separated by 1.7 kpc, possibly revealing an ongoing merger (Walter et al.2004) and thus, indicating a more complex gas dynamics than described by a simple disk model.
Fig. 9 shows that for QSOs which would require a relatively small correction to the inferred dynamical mass (J2310, J0927 and J0338), a disk radius in the range (5-8) kpc would be adequate if seen with an inclination angle of ; conversely, a disk radius of 2.5 kpc would require an inclination angle of . For J1044, in which the largest fraction of stars is missing, the predicted dynamical mass would be accommodated within a radius of kpc or .
It is important to note that recent ALMA observations have marginally resolved the [CII] emission in QSOs J2310 and J1044 (Wang et al. 2013). For J2310, the estimated inclination angle is , larger than the value used to infer the dynamical mass from the CO. However, Wang et al. (2013) underline that the measurement of the sizes of high redshift sources and thus of the disk inclination angles are still highly uncertain even at the spatial resolution with ALMA. For J1044, ALMA observations pointed out that there are differences in the [CII] and CO spectra which may indicate a more complex dynamics. The [CII] line profile of this source has a larger redshift and a broader line width with respect to that of the CO(6-5) detection. These suggest either a difference in the kinematical properties of the two gas components or that a significant fraction of the CO emission may be undetected.
However, for most of these high redshift sources the apparent tension between model predictions and observational data may be alleviated by modifying the adopted gas disk geometry or by allowing for more complex merger-like gas distributions. Note that Narayanan et al. (2009) have modeled CO molecular lines in high redshift SMGs via numerical simulations, showing that if SMGs are typically a transient phase of major mergers, the usage of standard CO techniques to infer physical quantities may lead to inaccurate measurements of the true enclosed dynamical mass by a factor from the actual value. Deep imaging of the CO line emission with better measurements of the CO line profile and spatial distribution is needed to better constrain the dynamical masses of these systems.
The idea of a more complex and extended distribution of the stars in
high-z QSO host galaxies,
is supported by recent hydrodynamical simulations (Khandai et al. 2012).
The simulations show that quasar host galaxies at are indeed compact
gas-rich systems with the bulk of star formation occurring in the very inner
regions. These regions are surrounded by a number of star forming clouds,
providing a significant amount of stars, distributed on a larger scale, within
the DM halo virial radius ( kpc).
This suggest that the regions in which the CO is observed (when spatially
resolved) may not trace the spatial distribution of the stellar
component of the whole galaxy.
We conclude that high-z QSO host galaxies follow a complex evolution and gain the bulk of their stellar mass content through intense dust-enshrouded starbursts that occur as early as 500 Myr after the Big Bang. The star formation history and metal enrichment of these galaxies are tightly coupled to the growth of their nuclear black hole. When the black hole has grown to a mass M⊙, a strong energy-driven wind starts to clear up the ISM of dust and gas through a large outflow, damping the star formation rate and rendering the QSO optically bright. At this stage, the stellar bulge has already grown to values that exceed the upper limits inferred from dynamical mass and molecular gas measurements. However, for most of these sources the apparent tension between model predictions and observational data may be alleviated by modifying the adopted gas disk geometry or by allowing for more complex merger-like gas distributions. Deep imaging of the CO line emission with better measurements of the CO line profile and spatial distribution is needed to better constrain the dynamical masses of these systems.
Acknowledgments
We thank the anonymous referee for usefull suggestions and comments. We thank E. Sani for providing useful data, X. Fan and P. Santini for fruitful discussion and comments. SS acknowledges support from Netherlands Organization for Scientific Research (NWO), VENI grant 639.041.233. The research leading to these results has received funding from the European Research Council under the European Union’s Seventh Framework Programme (FP/2007-2013) / ERC Grant Agreement n. 306476. This research was supported in part by the National Science Foundation under Grant No. NSF PHY11-25915.
References
- [1] Asano R., Takeuchi T.T., Hirashita H., Nozawa T., 2013, MNRAS, 432, 637
- [2] Barlow M.J., Dunlap B.H., Clemens J.C., Lynas-Gray A.E., Ivarsen K.M. Lacluyze A.P., Reichart D.E., Haislip J.B., Nysewander M.C., 2010 MNRAS, 403, 324
- [3] Barth A.J., Martini P., Nelson C.H., Ho L.C., 2003, ApJ, 594, L95
- [4] Beelen A., Cox P., Benford D.J., Dowell C.D., Kovacs A., Bertoldi F., Omont A., Carilli C.L. 2006, ApJ, 642, 694
- [5] Bellovary G., Volonteri M., Governato F., Shen S., Quinn T., Wadsley J., 2011, ApJ, 742, 13
- [6] Begelman M.C., Volonteri M., Rees M.J., 2006, MNRAS, 370, 289
- [7] Bellovary G., Brooks A., Volonteri M., Governato F., Quinn T., Wadsley J., 2013, ApJ, 779, 136
- [8] Bertoldi F., Carilli C.L., Cox P., Fan X., Strauss M.A., Beelen A., Omont A., Zylka R. 2003, A&A, 406, L55
- [9] Bianchi S., 2008, A&A, 490, 461
- [10] Bianchi S., Schneider R., 2007, MNRAS, 378, 973
- [11] Bocchio M., Micelotta E.R., Gautier A.L., Jones A.P., 2012, A&A, 5435, A124
- [12] Bolatto A.D., Wolfire M., Leroy A.K., 2013, ARA&A, 51, 207
- [13] Booth C.M., & Schaye J., 2009, MNRAS, 398, 53
- [14] Bothwell M.S., Chapman S.C., Tacconi L., Smail I., Ivison R.J., Casey C.M., Bertoldi F., Beswick R., et al., 2010, MNRAS, 405, 219
- [15] Bromm, V. & Loeb A. 2003, ApJ, 596, 34
- [16] Calura F., Gilli R., Vignali C., Pozzi F., Pipino A., Matteucci F., 2014, MNRAS, (pre-print arXiv:1312.1087)
- [17] Carilli C.L., Walter F., 2013, ARA&A, 51, 105
- [18] Chapman S.C., Blain A.W. Smail I., Ivison R.J., 2005, ApJ, 622, 772
- [19] Cicone C., Feruglio C., Maiolino R., Fiore F., Piconcelli E., Menci N., Aussel H., Sturm E., 2012, A&A, 543, 99
- [20] Coppin K.E.K., Swinbank A.M., Neri R., Cox P., Alexander D.M., Smail I., Page M.J., Stevens J.A., 2008, MNRAS, 389, 45
- [21] De Bennassuti M., Schneider R., Valiante R., Salvadori S., 2014, in prep.
- [22] DeBuhr J., Quataert E., Ma C.P., Hopkins F., 2010, MNRAS, 406, L59
- [23] DeGraf C., Di Matteo T., Khandai N., Croft R., Lopez J., Springel V., 2012, MNRAS, 424, 1829
- [24] De Rosa G., Decarli R., Walter F., Fan X., Jiang L., Kurk J., Pasquali A., Rix H.W., 2011, ApJ, 739, 56
- [25] Devecchi B., Volonteri M., Colpi M., Haardt F., 2010, MNRAS, 409, 1057
- [26] Devecchi B., Volonteri M., Rossi E.M., Colpi M., Portegies Zwart S., 2012, MNRAS, 421, 1465
- [27] Dietrich M., Hamann F., 2004, ApJ, 611, 761
- [28] Di Matteo T., Springel V., Hernquist L., 2005, Nat, 433, 604
- [29] Di Matteo T., Colberg J., Springel V., Hernquist L., 2008, ApJ, 676, 33
- [30] Di Matteo T., Khandai N., DeGraf C., Feng Y., Croft R.A., Lopez J., Sringel V., 2012, ApJ, 745, L29
- [31] Dobbs C.L., Krumholz M.R., Ballesteros-Paredes J., Bolatto A.D., Fukui Y., Heyer M., Mac Low M.M., Ostriker E.C., Vazquez-Semadeni E., 2013 (arXiv:1312.3223)
- [32] Downes D., & Solomon P.M., 1998, ApJ, 507, 615
- [33] Draine B.T. 2009, in Cosmic Dust Near and Far, ed. T. Henning, E. Grün, and J. Steinacker. (San Francisco: ASP), ASP Conf. Series, 414, 453
- [34] Dwek E., Galliano F., Jones A.P., 2007, ApJ, 662, 927
- [35] Dwek E., Cherchneff I., 2011, ApJ, 727, 63
- [36] Elvis M., Marengo M., Karovska M., 2002, ApJ, 567, L107
- [37] Fan X., Narayanan V.K., Lupton R.H., Strauss M.A., Knapp G.R., Becker R.H., White R.L., Pentericci L., et al., 2001, AJ, 122, 2823
- [38] Fan X., Strauss M.A., Schneider D.P., Becker R.H., White R.L. Haiman Z., Gregg M., Pentericci L., et al., 2003, AJ, 125, 1649
- [39] Fan X., Hennawi J.F., Richards G.T., Strauss M.A., Schneider D.P., Donley J.L., Young J.E., Annis J., et al., 2004, AJ, 128, 515
- [40] Fan X., et al., 2014, in prep.
- [41] Feruglio C., Maiolino R., Piconcelli E., Menci N., Aussel H., Lamastra A., Fiore F. 2010, A&A, 518, L155
- [42] Gall C., Andersen A.C., Hjorth J., 2011, A&A, 528, 14
- [43] Gallerani S., Ferrara A., Fan X., Choudhury T.R., 2008, MNRAS, 385, 359
- [44] Gallerani S., Maiolino R., Juarez Y., Nagao T., Marconi A., Bianchi S., Schneider R., Mannucci F., et al., 2010, A&A, 523, 85
- [45] Gomez H.L., Krause O., Barlow M.J., Swinyard B.M., Owen P.J., Clark C.J.R., Matsuura M., Gomez E., et al. 2012, ApJ, 760, 96
- [46] Haehnelt M., Natarajan P., Rees M.J., 1998, MNRAS, 300, 817
- [47] Haimann Z., Loeb A., 1998, ApJ, 503, 505
- [48] Hayward C.C., Keres D., Jonsson P., Narayanan D., Cox T.J., Hernquist L., 2011, ApJ, 743, 159
- [49] Hayward C.C., Jonsson P., keres D., Magnelli B., Hernquist L., Cox T.J., 2012, MNRAS, 424, 95
- [50] Hayward C.C., Narayanan D., Keres D., Jonsson P., Hopkins P.F., Cox T.J., Hernquist L., 2013, MNRAS, 428, 2529
- [51] Hirashita H., Ferrara A., 2002, MNRAS, 337, 921
- [52] Hjort J., Vreeswijk P.M., Gall C., Watson D., 2013, ApJ, 768, 173
- [53] Hopkins P.F., Hernquist L., Cox T. J., Di Matteo T., Robertson B., Springel V. 2006, ApJS, 163, 1
- [54] Hopkins P.F., Quataert E., Murray N., 2011, MNRAS, 417, 950
- [55] Ivison R.J., Papadopoulos P.P., Smail I., Greve T.R., Thomson A.P., Xilouris E.M., Chapman S.C., 2011, ApJ, 734, L12
- [56] Jappsen A. K., Mac Low M. M., Glover S. C. O., Klessen R. S., Kitsionas S., 2009, ApJ, 694, 1161
- [57] Jiang L., Fan X., Vestergaard M., Jurk J.D., Walter F., Kelly B.C., Strauss M.A., 2007, AJ, 134, 1150
- [58] Jones A.P., Tielens A.G.G.M., Hollenbach D.J., McKee C.F., 1996, ApJ, 496, 740
- [59] Jones A.P., Nuth J.A., 2011, A&A, 530, 44
- [60] Jones A.P., 2012, A&A, 542, A98
- [61] Jones A.P., Fanciullo L., Koler M., Vestraete L., Guillet V., Bocchio M., Ysard N., 2013, A&A, 558, A62
- [62] Juarez Y., Maiolino R., Mujica R., Pedani M., Marinoni S., Nagao T., Marconi A., Olive E., 2009, A&A, 494, 25
- [63] Khandai N., Feng Y., DeGraf C., Di Matteo T., Crof R.A.C., 2012, MNRAS, 423, 2397
- [64] Kennicutt, R. 1998, ApJ, 498, 541
- [65] Klessen R. S., Spaans M., Jappsen A. K. 2007, MNRAS, 374, L29
- [66] Kormendy J.H., Ho L.C., 2013, ARA&A, 51, 511
- [67] Lacey C., Cole S., 1994, MNRAS, 271, 676
- [68] Lamastra A., Menci N., Maiolino R., Fiore F., Merloni A., 2010 MNRAS, 405, 29
- [69] Lauer T.D., Tremaine S., Richstone D., Faber S.M., 2007, ApJ, 670, 249
- [70] Leipski C., Meisenheimer K., Walter F., Besel M.A., Dannerbauer H., Fan X., Haas M., Klaas U., Krause O., Rix H.W., 2013, ApJ, 772, 103
- [71] Li Y., Hernquist L., Robertson B., Cox T.J., Hopkins P.F., Springel V., Gao L., Di Matteo T. et al., 2007, ApJ, 665, 187
- [72] Li Y., Hopkins P.F., Hernquist L., Finkbeiner D.P., Cox T.J., Springel V., Jiang, L., Fan X., Yoshida N., 2008, ApJ, 678, 41
- [73] Magdis G.E., Daddi E., Elbaz D., Sargent M., Dickinson M., Dannerbauer H., Aussel H., Walter F., et al., 2011, ApJ, 740, L15
- [74] Magnelli B., Lutz D., Berta S., Altieri B., Andreani P., Aussel H., Castaneda H., Cava A., 2010, A&A, 518, L28
- [75] Magnelli B., Lutz D., Santini P., Saintonge A., Berta S., Albrecht M., Altieri B., Andreani P., 2012, A&A, 539, 155
- [76] Maiolino R., Neri R., Beelen A., Bertoldi F., Carilli C.L., Caselli P., Cox P., Menten K.M., et al., 2007, A&A 472, L33
- [77] Maiolino R., 2008, NewAR, 52, 339
- [78] Maiolino R., Gallerani S., Neri R., Cicone C., Ferrara A., Genzel R., Lutz D., Sturm E., 2012, MNRAS, 425, L66
- [79] Martini P., 2004, in Carnagie Observatories Astrophysics Series Coevolution of Black Holes and Galaxies, ed. L.C. Ho (Cambridge University Press), 1, 170
- [80] Matsuoka K., Nagao T., Maiolino R., Marconi A., Taniguchi Y., 2009, A&A, 503, 721
- [81] Matsuura M., Dwek E., Meixner M., Otsuka M., Babler B., Barlow M.J., Roman-Duval J., Engelbracht C., et al. 2011, Science, 333, 1258
- [82] Mattsson L., 2011, MNRAS, 414, 781
- [83] Menci N., Fiore F., Puccetti S., cavaliere A., 2008, ApJ, 686, 219
- [84] Merloni A., Bongiorno A., Bolzonella M., Brusa M., Civano F., Comastri A., Elvis M., Fiore F., et al. 2010, ApJ, 708, 137
- [85] Michalowski M.J., Murphy E.J., Hjorth J., Watson D., Gall C., Dunlop J.S., 2010, A&A, 522, 15
- [86] Michalowski M.J., Dunlop J.S., Cirasuolo M., Hjort J., Hayward C.C, Watson D., 2012, A&A, 541, 85
- [87] Morgan H.L., Edmunds M.G. 2003, MNRAS, 343, 427
- [88] Mortlock D.J., Warren S.J., Venemans B.P., Patel M., Hewett P.C., McMahon R.G., Simpson C., Theuns T., et al. 2011, Nature, 474, 616
- [89] Nagao T., Marconi A., Maiolino R., 2006 A&A, 447, 157
- [90] Nagao T., Maiolino R., De Breuck C., Caselli P., Hatsukade B., Saigo K., 2012, A&A, 542, L34
- [91] Narayanan D., Cox T.J., Hayward C.C., Younger J.D., Hernquist L., 2009, 400, 1919
- [92] Neri R., genzel R., Ivison R.J., Bertoldi F., Blain A.W., Chapman S.C., Cox P., Greve T.R., Omont A., Frayer D.T., 2003, ApJ, 597, L113
- [93] Nesvadba N.P.H., Polletta M., Lehnert M.D., Bergeron J., De Breuck C., Lagache G., Omont A. 2011, MNRAS, 415, 2359
- [94] Nesvadba N.P.H., Boulanger F., Salomé P., Guillard P., Lehnert M.D., Ogle P., et al., Appleton P., Falgarone E., Pineau Des Forets, G., 2010, A&A, 521, 65
- [95] Nozawa T., Kozasa T., Habe A., Dwek E., Umeda H., Tominaga N., Maeda K., Nomoto K. 2007, ApJ, 666, 955
- [96] Nozawa T., Kozasa T., Tominaga N., Maeda K., Umeda H., Nomoto K., Krause O., 2010, ApJ, 713, 356
- [97] Omukai K., Schneider R., Haiman Z., 2008, ApJ, 686, 801
- [98] Peng C.Y., Impey C.D., Ho L.C., Barton E.J., Rix H.W., 2006, ApJ, 640, 114
- [99] Pipino A., Fan, X.L., Matteucci F., Calura F., Silva L., Granato G., Maiolino R., 2011, A&A, 525, 61
- [100] Podio L., Bacciotti F., Nisini B., Eisloffel J., Massi F., Giannini T., Ray T.P., 2006, A&A, 456, 189
- [101] Priddey R. S., Isaac K.G., McMahon R.G., Richard G., Robson E.I., Pearson C.P., 2003, MNRAS, 334, L74
- [102] Riechers D.A., Walter F., Brewer B.J., Carilli C.L., Lewis G.F., Bertoldi F., Cox P., 2008, ApJ, 686, L9
- [103] Riechers D.A., Walter F., Carilli C.L., & Lewis G.F., 2009, ApJ, 690, 463
- [104] Riechers D.A., 2011, ApJ,730,108
- [105] Riechers D.A., Bradford C.M., Clements D.L., Dowell C.D., Perez-Fournon I., Ivison R.J., Bridge C., Conley A., et al. 2013, Nature, 496, 329
- [106] Robson I., Priddey R.S., Isaak K.G., McMahon R.G. 2004 MNRAS, 351, L29
- [107] Rowlands K., et al., 2014, in The Life Cycle of Dust in the Universe: Observations, Theory and Laboratory Experiments, conference proc., in prep.
- [108] Salpeter E.E., 1955, ApJ, 121, 161
- [109] Salvadori S., Schneider R., Ferrara A., 2007, MNRAS, 381, 647
- [110] Salvadori S., Ferrara A., Schneider R. 2008, MNRAS, 386, 348
- [111] Sani E., Marconi A., Hunt L.K., Risaliti G., MNRAS, 2011, 413, 1479
- [112] Santini P., Maiolino R., Magnelli B., Silva L., Grazian A., Altieri B., Andreani P., Aussel H., 2010, A&A, 518, L154
- [113] Schneider R. & Omukai K. 2010, MNRAS, 402, 429
- [114] Schneider R., Valiante R., Ventura P., dellÁgli F., Hirashita H., MNRAS, 2014a, in press. (arXiv:1404.7132)
- [115] Schneider R., Bianchi S., Valiante R., Risaliti G., Salvadori S., 2014b, submitted, (arXiv:1402.2279)
- [116] Slavin J.D., 2009, SSRv, 143, 311
- [117] Smith B. D., Turk M. J., Sigurdsson S., O’Shea B. W., Norman M. L. 2009, ApJ, 691, 441
- [118] Smolcic V., Aravena M., Navarrete F., Schinnerer E., Riechers D.A., Bertoldi F., Feruglio C., Finoguenov A., 2012, A&A, 548, 4
- [119] Sijacki D., Springel V., di Matteo T., Hernquist L., 2007, MNRAS, 380, 877
- [120] Sijacki D., Springel V., Haehnelt M.G., 2009, MNRAS, 400, 100
- [121] Solomon P.M., Vanden Bout P.A., 2005, ARA&A, 43, 677
- [122] Solomon P.M., Downes D., Radford S.J.E., Barrett J.W., 1997, ApJ, 478, 144
- [123] Somerville R.S., Lemson G., Kolatt T.S., Dekel A., 2000, MNRAS, 316, 479
- [124] Somerville R.S., Hopkins P.F., Cox T.J., Robertson B.E., Hernquist L. 2008, MNRAS, 391, 481
- [125] Springel V., Di Matteo T., Hernquist L., 2005, MNRAS, 361, 776
- [126] Stratta G., Gallerani S., Maiolino R., 2011, A&A, 532, 45
- [127] Tacconi L.J., Genzel R., Smail I., Neri R., Chapman S.C., Ivison R.J., Blain A., Cox P., et al., 2008, ApJ, 680, 246
- [128] Valiante R., Schneider R., Bianchi S., Andersen A. C. 2009, MNRAS, 397, 1661
- [129] Valiante R., Schneider R., Salvadori S., Bianchi S., 2011, MNRAS, 416, 1916
- [130] Valiante R., Schneider R., Maiolino R., Salvadori S., Bianchi S., 2012, MNRAS, 427 L60
- [131] Valiante R., Schneider R., 2014, in The Life Cycle of Dust in the Universe: Observations, Theory and Laboratory Experiments, conference proc., in press
- [132] Volonteri M., Haardt F., Madau P., 2003, ApJ, 582, 559
- [133] Volonteri M. & Rees M.J. 2006, ApJ, 650, 669
- [134] Volonteri M., Stark D.P., 2011, MNRAS, 417, 2085
- [135] Volonteri M., & Bellovary G., 2012, RPPh, 75, 12
- [136] Walter F., Carilli C., Bertoldi F., Menten K., Cox P., Lo K.Y., Fan X., Strauss M.A., 2004, ApJ, 615, L17
- [137] Wang R., Carilli C.L., Wagg J., Bertoldi F., Walter F., Menten K.M., Omont A., Cox P., Strauss M.A., Fan X., et al. 2008, ApJ, 687, 848
- [138] Wang R., Carilli C.L., Neri R., Riechers D. A., Wagg J., Walter F., Bertoldi F., Menten K.M., Omont A., Cox P., Fan X., 2010, ApJ, 714, 699
- [139] Wang R., Wagg J., Carilli C.L., Walter F., Lentati L., Fan X., Riechers D.A., Bertoldi F., et al. 2013, ApJ, 773, 44
- [140] Welty D.E., Jenkins E.B., Raymond J.C., Mallouris C., York D.G., 2002, ApJ, 579, 304
- [141] Willott C.J., McLure R.J., Jarvis M.J., 2003, ApJ, 587, L15
- [142] Willott C.J., Delorme P., Omont A., Bergeron J., Delfosse X., Forveille T., 2007, AJ, 134, 2435
- [143] Yun M.S., Scott K.S., Guo Y., Aretxaga I., Giavalisco M., Austermann J.E., Capak P., Chen Y., 2012, MNRAS, 420, 957
- [144] Zafar T., Watsson D., 2013, A&A, 560, 26
- [145] Zhukovska S., Gail H.P., Trieloff M. 2008, A&A, 479, 453
- [146] Zhukovska S., Henning T., 2013, A&A, 555, 99