Measurement of magic wavelengths for the 40Ca+ clock transition
Abstract
We demonstrate experimentally the existence of magic wavelengths near 396 nm and determine the ratio of the oscillator strengths for a single trapped ion. For the first time, two magic wavelengths for the 40Ca+ clock transition are measured simultaneously with high precision. By tuning a laser to an intermediate wavelength between two transitions and in 40Ca+, the sensitivity of the clock transition Stark shift to the oscillator strengths for the resonance transition is greatly enhanced. With the measured magic wavelengths, we further determine the ratio of the oscillator strengths with the deviation less than 0.5%. Our experimental method may be applied to measure magic wavelengths for other ion clock transitions, which may pave the way for building all-optical trapped ion clocks.
pacs:
31.15.ac, 31.15.ap, 34.20.CfThe magic wavelength for an atomic transition is a wavelength for which the differential ac Stark shift vanishes Takamoto et al. (2005); Ye et al. (2008); Barber et al. (2008); Yi et al. (2011); Mitroy et al. (2010). The existence of magic wavelength enables independent control of internal hyperfine-spin and external center-of-mass motions of atoms (including neutral atoms and atomic ions). Precision measurements of magic wavelengths in atoms are very important in studies of atomic structure. For example, a measurement of the line strength ratio can bring a new perspective for determining accurate transition matrix elements, that are important in testing the atomic structure theories, as well as the reliability of a model used in interpreting atomic parity nonconservation studies Derevianko (2000); Sahoo et al. (2006); Porsev et al. (2009). The oscillator strength, which is directly related to the line strength, can be derived from the magic wavelength measurements. Furthermore, it is an important topic in atomic physics, which can be critical in astrophysical data analysis Kurucz (2011). Knowledge of important oscillator strengths, and polarizabilities for the two states associated with a clock transition in an atom or ion is essential to correct the black-body radiation shift. A similar concept is the tune-out wavelength LeBlanc and Thywissen (2007), at which the dynamic polarizability of the concerned atomic state is zero. Recently, by measuring the tune-out wavelengths, the line strength ratios have been derived for neutral potassium and rubidium Herold et al. (2012); Holmgren et al. (2012).
In addition, magic wavelengths provide extensive applications in quantum state engineering and precision frequency metrology Ye et al. (2008). Magic wavelengths in neutral atomic systems have been measured in several experiments Yi et al. (2011); Brusch et al. (2006); Takamoto et al. (2009); Lemke et al. (2009); Ludlow et al. (2008). The optical dipole trap at the magic wavelength can eliminate the first-order Stark shift so that the systematic uncertainties can be reduced. Atomic clocks based on neutral atoms trapped in the magic wavelength optical lattices are new trend of development for optical clocks Takamoto et al. (2005); Bloom et al. (2014); Margolis (2009); Hinkley et al. (2013). Recently, all-optical trapping of ions has been demonstrated Krasnov and Kamenshchikov (2014); Enderlein et al. (2012) and it is thus meaningful to explore the possibility of trapping ions using magic wavelength optical lattices. With the all-optical trapping technique, an ion clock can be built with better performance. Therefore, the demonstration of magic wavelengths for ion clock transitions is a milestone for establishing all-optical trapped ion clocks.
In this Letter, for the first time, two magic wavelengths for the 40Ca+ clock-transition are reported and a novel application of magic wavelengths in determining oscillator strength ratio is shown. As the 40Ca+ optical clock is a typical ion optical clock, our method for measuring magic wavelengths can be applied to other similar systems, such as Sr+, In+, Hg+, Al+, and Ba+, which have been chosen as candidates for building optical clocks Dubé et al. (2014); Barwood et al. (2014); Hayasaka (2012); Wang et al. (2007); Rosenband et al. (2008); Kleczewski et al. (2012).
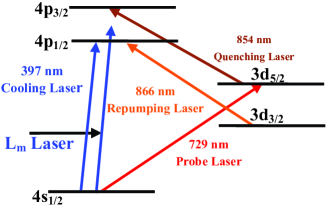
In Fig. 1, we show the involved energy levels of 40Ca+. The experiment introduced here uses a laser to apply an ac Stark shift to the 40Ca+ ion clock transition for the and magnetic sub-level of the 3 state. Measurements of the ac Stark shifts at different frequencies allow the determination of the magic wavelengths near 396 nm. There are two magic wavelengths and corresponding to the magnetic sub-states of level. The magic wavelength is the average of and , similarly to . The measured magic wavelengths near 396 nm (Lm) lie between the resonant and transitions, as shown in Fig. 1. Theoretical calculations indicated that these magic wavelengths were very sensitive to the ratio of the to oscillator strengths Tang et al. (2013). The 40Ca+ resonant oscillator strength cannot be determined with a single measurement since the states can decay to either the ground state or the excited states. Besides the lifetimes, one also needs the branching ratio for transitions to the and states Gallagher (1967); Gosselin et al. (1988); Jin and Church (1993); Gerritsma et al. (2008) since the transitions make a contribution of about 6% to the lifetimes Tang et al. (2013); Gerritsma et al. (2008); Safronova and Safronova (2011). One of the advantages of the magic wavelength approach is that the contribution to the polarizability from the transitions at the magic wavelength is three orders of magnitude larger than the contribution from other transitions.
For an ion in a single mode laser field, the energy shift of a given atomic state can be written as Takamoto et al. (2009)
| (1) |
where and are the dynamic dipole polarizability and hyperpolarizability, respectively. Here, is the power density of the laser, and represents the remaining high-order Stark shift.For the 40Ca+ optical clock, one of major experimental concerns is the frequency shift of the clock transition caused by electromagnetic radiation, which can be written as
| (2) |
where and are the differential dipole-polarizability and hyperpolarizability, respectively. At the magic wavelength ( where c is the speed of light in vacuum), . is generally nonzero. Under the weak intensity limit, the contributions from the hyperpolarizability and the remaining higher-order terms are several orders of magnitude smaller than and can be ignored. Using ion optical clock techniques, the differential light shift can be measured accurately and therefore the magic wavelength can be determined with high precision.
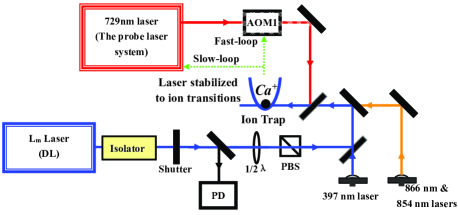
A sketch of the experimental setup for the measurement of magic wavelengths is shown in Fig. 2. The whole system is composed of two main parts, one is the optical clock based on single trapped 40Ca+, and another one is the Lm system for measuring the light shift of the clock transition.
The detail of the optical clock has been described in previous work Huang et al. (2011, 2012). A 729 nm probe laser was locked to an ultra-stable, high finesse cavity mounted on a vibration isolation platform (TS-140) by the Pound-Drever-Hall method, and an acousto-optic modulator is used to cancel the slow linear drift of the reference cavity.
The Lm laser used in the experiment is frequency stabilized using a transfer cavity referenced to the 729 nm probe laser, and the long-term drift is reduced to less than 10 MHz within 4 hours. An unpolarized beam splitter (BS) is used to split a part of light for monitoring the laser power, which is 700 W with a jitter of 3 W. The power meter used in the experiment is a commercial power meter (S120VC, Thorlabs Inc.). The powers of the incident and output beams of the Lm laser are monitored simultaneously. And they agree with each other very well on the jitter of laser power. The power of the Lm laser into the trap is 731(4) W and the waist radius of the beam is 203(5) m during the measurement. A polarized beam splitter is placed in the light path before the ion-light interaction maintains the linear polarization of the Lm laser. In this way, the linear polarization purity can reach 99.9%, which can be derived by analyzing the polarization of the incident light and the transmission light of the Lm laser.
In our work, a single 40Ca+ ion is trapped in a miniature Paul trap and laser cooled to a few mK. The single ion’s excess micromotion is minimized by adjusting the voltages of two compensation electrodes and two end-cap electrodes with the RF-photon correlation technique Berkeland et al. (1998) before performing any measurements. The clock transition splits symmetrically into ten Zeeman components around the zero-field line center Huang et al. (2012). Then the probe laser is further referenced to the 40Ca+ ion clock transitions by feeding back to the frequency of the acousto-optic modulator (AOM1) to compensate for changes of the magnetic field and probe the individual Zeeman transitions. In the experiment, the pulse sequences of 397 nm, 866 nm, 854 nm, and 729 nm lasers are similar to that used in the 40Ca+ ion optical frequency standard Huang et al. (2012). The pulse sequence of the Lm laser is introduced to measure the light shift. The Lm laser is off during the Doppler cooling period, and is on and off alternately during the probing stage to measure the light shift. The frequency values of AOM1 are recorded automatically every cycle by PC and the light shift caused by the Lm laser beam can be measured by calculating the difference of two cycles with the Lm laser on and off.
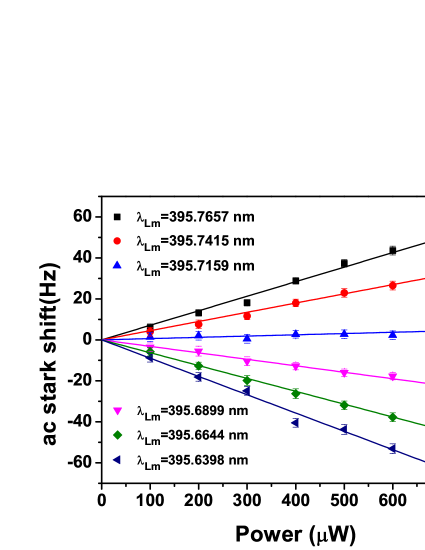
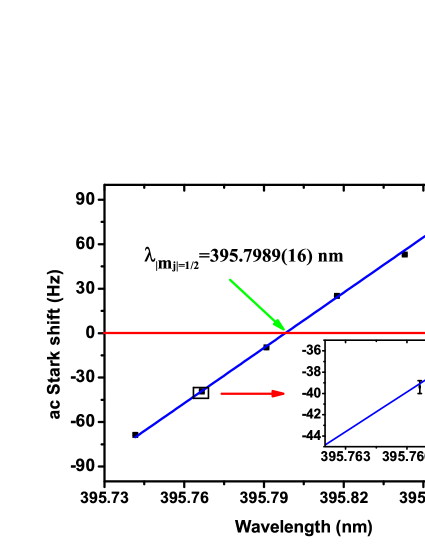
The ac Stark shifts within 0.2 nm around the magic wavelength was investigated. Six fixed wavelengths of the Lm laser were chosen and the ac Stark shifts were measured at each wavelength by switching the Lm laser on/off . In order to study the relation between the incident power of the Lm laser and the ac Stark shift, we measured the ac Stark shift of the 40Ca+ ion clock transition for the magnetic sublevel of the state at different powers. The results are shown in Fig. 3. One can find a linear dependence on the power, which indicates that the quadratic and higher-order terms of Eq. (2) can be neglected in our experiment. The incident power of the Lm laser on the ion probably changes when tuning the wavelength, since the laser beam direction may change slightly. Therefore the power was calibrated to ensure that it is identical within 4% at all six wavelengths. The measured six points are fitted linearly and the magic wavelength is obtained. Fig. 4 shows one measurement of .
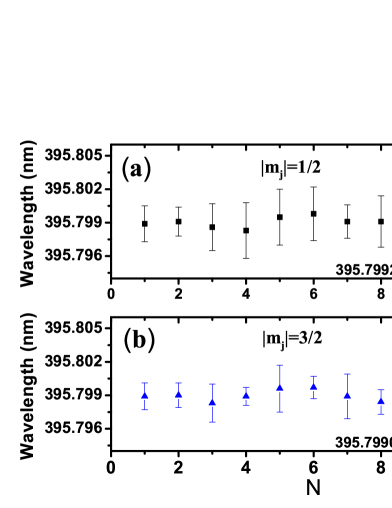
Due to the influence of the uncertainties from wave-meter measurement, the broadband spectral component and the power jitter of the Lm laser, it is difficult to obtain the frequency difference by separate measurements of and . Here a new measurement protocol was adopted. In the experiment, for each of the six wavelengths of the Lm laser, we measured the ac Stark shifts for and of the 3 state respectively. This procedure was repeated until all the six Lm laser wavelengths had been considered. The Lm laser’s wavelength was tuned from 395.7 nm to 395.9 nm, then from 395.9 nm to 395.7 nm. Fig. 5 shows ten measurements for and respectively and the corresponding weighted means, resulting in nm and nm. The difference in value between and is 0.0002(6) nm, which agrees with the theoretical calculation Tang et al. (2013).
To finalize the magic wavelength measurement of the Lm laser, systematic shifts must be considered and the corresponding corrections must be applied to the above averaged frequencies. These shifts are due to the broad spectral component, the light polarization, the second order Doppler shift, the calibration of the wavemeter, . The error budget is given in Table 1.
| Source of uncertainty | Shift (pm) | Uncertainty (pm) |
|---|---|---|
| Broadband light | 0 | 0.60 |
| Light polarization | 0 | 0.01 |
| Second order Doppler shift and Stark shift | 0.01 | 0.01 |
| Laser wavelength | 0 | 0.06 |
| Statistical uncertainty | - | 0.20 |
| Total | 0.01 | 0.7 |
One of the major errors of the magic wavelength measurement comes from the broad spectral component of Lm. To evaluate the broad spectral component, a grating spectrometer (IHR550, HORIBA) was used to analyze the laser spectrum. We found that more than 99% of the laser power was within the wavelength range of 0.03 nm and only less than 1% laser power was out of that range, corresponding to a less than 0.0005 nm contribution to the uncertainty in and Holmgren et al. (2012). Next, the spectral component in the range of 0.03 nm around the carrier was analyzed by observing the beatnote of the Lm lasers with another similar laser using a spectrum analyzer. The spectrum mainly contained three components from which the ac Stark shift could be estimated based on their relative weights and only an uncertainty of less than 0.0001 nm was obtained. Lights with different polarizations can result in different ac Stark shifts. Elliptical polarization will have scalar, vector and tensor light shifts for atoms with Deutsch and Jessen (2010), which will change the value of the magic wavelength. In our experiment, a polarized beam splitter (PBS) was used to create a pure linear polarization, and the ellipticity component was reduced to less than 0.1% by analyzing the light beam before and after the vacuum chamber. To evaluate the contribution due to the non-linearly polarized component, the uncertainty with circularly polarized light was measured and the wavelength difference with linearly and circularly polarized light was less than 0.01 nm, thus there would only be less than 0.0001 nm of uncertainty with less than 0.1% ellipticity.
The Lm laser could heat the ion or affect the efficiency of the laser cooling, introducing a second order Doppler shift and a Stark shift due to the increase of the energy of the ion thermal motion or micromotion. To estimate the second-order Doppler shift, the ion temperature was measured by monitoring the intensity of secular sidebands, together with the measurements of the micromotion using rf-photon correlation method Berkeland et al. (1998) with and without the Lm laser, resulting in an uncertainty of 0.00001 nm. The Lm laser wavelength after frequency stabilization was monitored by a wavemeter (High Finesse WS-7) with an absolute accuracy of 60 MHz after the calibration using the clock laser. Thus the uncertainty from the calibration of the wavemeter is within 0.00006 nm. Our final determined magic wavelengths are 395.7992(7) nm and 395.7990(7) nm, located in the spin-orbit energy gap of the 4p state.
The dynamic Stark shift is strongly dominated by the large and opposite polarizability contributions from the 4 and 4 states Tang et al. (2013); Herold et al. (2012); Arora et al. (2007). The contributions of the 3 polarizabilities are typically small in magnitude at this wavelength. The dynamic Stark shift can be written as
where is the transition energy, is the oscillator strength, and consists of the remaining terms in the 4 polarizability, as well as the smaller 3 polarizabilities that are estimated to be 2.95 a for the 3 state and 0.31 a for the 3 state. The value of was determined theoretically by us to be 0.3171.
Using the energies of the , , and states from NIST Database nistasd500 and the present measured magic wavelength , we can obtain the oscillator strength ratio according to Eq. (LABEL:eq)
| (4) |
and the line strength ratio is
| (5) |
A change in by 2.0 a will result in a change in the derived by 0.001. Changes in the oscillator strengths of the background transitions of more than 5% would be needed to change by 2.0 a and the uncertainty estimates in and allows for this. The previously estimated line strength ratios of 2.001 Safronova and Safronova (2011) and 2.0014 Tang et al. (2013) were based onthe relativistic all-order many-body perturbation theory and the relativistic semi-empricial potential, respectively. Since the results for and are very close to each other, the final ratios of and include both the experimental and theoretical uncertainties.
In summary, two magic wavelengths of nm and nm of the 40Ca+ clock transition have been measured with the accuracy of 2 ppm. Our experiment is the first demonstration of finding magic wavelengths in an ion optical clock system. The oscillator-strength ratio and the line-strength ratio for the transitions have been determined to be 2.027(5) and 2.009(5). At present, the broadband spectrum of the Lm laser and statistical error were the largest contributors to the total systematic uncertainty. These errors can be reduced by introducing a cavity for mode selection to the Lm laser and by improving the power stabilization, respectively. An order of magnitude improvement over the currently determined magic wavelengths is therefore achievable in future work.
Acknowledgements.
We thank Ting-Yun Shi and Li-Yan Tang for valuable suggestion. Thank Z. - C. Yan (UNB), J. Ye (JILA), H. Klein (NPL), C. Lee (SYSU), X. Guan, and J. Chen (IAPCM) for fruitful discussions. And thank X. Huang, H. Shu, H. Fan, B. Guo, Q. Liu, W. Qu, J. Cao, and B. Ou for the early experiments. This work is supported by the National Basic Research Program of China (2012CB821301), the National Natural Science Foundation of China (11474318, 91336211 and 11034009) and Chinese Academy of Sciences.References
- Takamoto et al. (2005) M. Takamoto, F.-L. Hong, R. Higashi, and H. Katori, Nature 435, 321 (2005).
- Ye et al. (2008) J. Ye, H. J. Kimble, and H. Katori, Science 320, 1734 (2008).
- Barber et al. (2008) Z. W. Barber, J. E. Stalnaker, N. D. Lemke, N. Poli, C. W. Oates, T. M. Fortier, S. A. Diddams, L. Hollberg, C. W. Hoyt, A. V. Taichenachev, et al., Phys. Rev. Lett. 100, 103002 (2008).
- Yi et al. (2011) L. Yi, S. Mejri, J. J. McFerran, Y. Le Coq, and S. Bize, Phys. Rev. Lett. 106, 073005 (2011).
- Mitroy et al. (2010) J. Mitroy, M. S. Safronova, and C. W. Clark, J. Phys. B 43, 202001 (2010).
- Derevianko (2000) A. Derevianko, Phys. Rev. Lett. 85, 1618 (2000).
- Sahoo et al. (2006) B. K. Sahoo, R. K. Chaudhuri, B. P. Das, and D. Mukherjee, Phys. Rev. Lett. 96, 163003 (2006).
- Porsev et al. (2009) S. G. Porsev, K. Beloy , and A. Derevianko, Phys. Rev. Lett. 102, 181601 (2009).
- Kurucz (2011) R. L. Kurucz, Can. J. Phys. 89, 417 (2011).
- LeBlanc and Thywissen (2007) L. J. LeBlanc and J. H. Thywissen, Phys. Rev. A 75, 053612 (2007).
- Herold et al. (2012) C. D. Herold, V. D. Vaidya, X. Li, S. L. Rolston, J. V. Porto, and M. S. Safronova, Phys. Rev. Lett. 109, 243003 (2012).
- Holmgren et al. (2012) W. F. Holmgren, R. Trubko, I. Hromada, and A. D. Cronin, Phys. Rev. Lett. 109, 243004 (2012).
- Brusch et al. (2006) A. Brusch, R. Le Targat, X. Baillard, M. Fouché, and P. Lemonde, Phys. Rev. Lett. 96, 103003 (2006).
- Takamoto et al. (2009) M. Takamoto, H. Katori, S. I. Marmo, V. D. Ovsiannikov, and V. G. Pal’chikov, Phys. Rev. Lett. 102, 063002 (2009).
- Lemke et al. (2009) N. D. Lemke, A. D. Ludlow, Z. W. Barber, T. M. Fortier, S. A. Diddams, Y. Jiang, S. R. Jefferts, T. P. Heavner, T. E. Parker, and C. W. Oates, Phys. Rev. Lett. 103, 063001 (2009).
- Ludlow et al. (2008) A. D. Ludlow, T. Zelevinsky, G. K. Campbell, S. Blatt, M. M. Boyd, M. H. G. de Miranda, M. J. Martin, J. W. Thomsen, S. M. Foreman, J. Ye, et al., Science 319, 1805 (2008).
- Bloom et al. (2014) B. J. Bloom, T. L. Nicholson, J. R. Williams, S. L. Campbell, M. Bishof, X. Zhang, W. Zhang, S. L. Bromley, and J. Ye, Nature 506, 71 (2014).
- Margolis (2009) H. S. Margolis, J. Phys. B 42, 154017 (2009).
- Hinkley et al. (2013) N. Hinkley, J. A. Sherman, N. B. Phillips, M. Schioppo, N. D. Lemke, K. Beloy, M. Pizzocaro, C. W. Oates, and A. D. Ludlow, Science 341, 1215 (2013).
- Krasnov and Kamenshchikov (2014) I. V. Krasnov and L. P. Kamenshchikov, Optics Commun. 312, 192 (2014).
- Enderlein et al. (2012) M. Enderlein, T. Huber, C. Schneider, and T. Schaetz, Phys. Rev. Lett. 109, 233004 (2012).
- Dubé et al. (2014) P. Dubé, A. A. Madej, M. Tibbo, and J. E. Bernard, Phys. Rev. Lett. 112, 173002 (2014).
- Barwood et al. (2014) G. P. Barwood, G. Huang, H. A. Klein, L. A. M. Johnson, S. A. King, H. S. Margolis, K. Szymaniec, and P. Gill, Phys. Rev. A 89, 050501(R) (2014).
- Hayasaka (2012) K. Hayasaka, Appl. Phys. B 107, 965 (2012).
- Wang et al. (2007) H. Wang, Y, R. Dumke, T. Liu, A. Stejskal, N. Zhao, Y, J. Zhang, H. Lu, Z, J. Wang, L, T. Becker, and H. Walther, Optics Commun. 273, 526 (2007).
- Rosenband et al. (2008) T. Rosenband, D. B. Hume, P. O. Schmidt, C. W. Chou, A. Brusch, L. Lorini, W. H. Oskay, R. E. Drullinger, T. M. Fortier, J. E. Stalnaker, et al., Science 319, 1808 (2008).
- Kleczewski et al. (2012) A. Kleczewski, R. Hoffman, M, A. Sherman, J, E. Magnuson, B. Blinov, B, and N. Fortson, E, Phys. Rev. A 85, 043418 (2012).
- Tang et al. (2013) Y.-B. Tang, H.-X. Qiao, T.-Y. Shi, and J. Mitroy, Phys. Rev. A 87, 042517 (2013).
- Gallagher (1967) A. Gallagher, Phys. Rev. 157, 24 (1967).
- Gosselin et al. (1988) R. N. Gosselin, E. H. Pinnington, and W. Ansbacher, Phys. Rev. A 38, 4887 (1988).
- Jin and Church (1993) J. Jin and D. A. Church, Phys. Rev. Lett. 70, 3213 (1993).
- Gerritsma et al. (2008) R. Gerritsma, G. Kirchmair, F. Zähringer, J. Benhelm, R. Blatt, and C. F. Roos, Eur. Phys. J. D 50, 13 (2008).
- Safronova and Safronova (2011) M. S. Safronova and U. I. Safronova, Phys. Rev. A 83, 012503 (2011).
- Huang et al. (2011) Y. Huang, Q. Liu, J. Cao, B. Ou, P. Liu, H. Guan, X. Huang, and K. Gao, Phys. Rev. A 84, 053841 (2011).
- Huang et al. (2012) Y. Huang, J. Cao, P. Liu, K. Liang, B. Ou, H. Guan, X. Huang, T. Li, and K. Gao, Phys. Rev. A 85, 030503 (2012).
- Berkeland et al. (1998) D. J. Berkeland, J. D. Miller, J. C. Bergquist, W. M. Itano, and D. J. Wineland, J. Appl. Phys. 83, 5025 (1998).
- Deutsch and Jessen (2010) I. H. Deutsch and P. S. Jessen, Optics Commun. 283, 681 (2010).
- Arora et al. (2007) B. Arora, M. S. Safronova, and C. W. Clark, Phys. Rev. A 76, 052509 (2007).