The host-galaxy of the gamma-ray Narrow-line Seyfert 1 galaxy 1H 0323+342
Abstract
We present optical and near infrared (NIR) imaging data of the radio-loud Narrow-line Seyfert 1 galaxy 1H 0323+342, which shows intense and variable gamma-ray activity discovered by the Fermi satellite with the Large Area Telescope. NIR and optical images are used to investigate the structural properties of the host galaxy of 1H 0323+342; this together with optical spectroscopy allowed us to examine its black hole mass. Based on the 2D multiwavelength surface brightness modeling, we find that, statistically, the best model fit is a combination of a nuclear component and a Sérsic profile (). However, the presence of a disc component (with a small bulge ) remains also a possibility and cannot be ruled out with the present data. Although at first glance a spiral-arm like structure is revealed in our images, a 2D Fourier analysis of the imagery suggests that such structure corresponds to an asymmetric ring, likely associated to a recent violent dynamical interaction. We discuss our results on the context of relativistic jets production and galaxy evolution.
1. Introduction
The Large Area Telescope (LAT) onboard of the space mission Fermi has detected emission from a wide variety of astrophysical objects, from supernovae to active galactic nuclei (AGN). Of all the Fermi/LAT sources, more than 60% are strongly beamed AGN (Ackermann et al., 2011), leading to the remark that the most common type of sources in the -ray sky are AGN whose relativistic jet points towards the Earth (i.e. blazars). Two types of blazars are known, Flat-spectrum radio quasars and BL Lacs. Despite the possible difference in their nuclear environment that makes them look different (i.e. the absence of broad-emission lines), both blazar types share two common features: (i) the presence of a prominent relativistic jet responsible for the violent variability across the electromagnetic spectrum (e.g. León-Tavares et al., 2011b, 2012), and (ii) their host-galaxies have a strong morphological similarity, they are giant elliptical galaxies (e.g. Kotilainen et al., 1998b, a; Scarpa et al., 2000; Nilsson et al., 2003; León-Tavares et al., 2011a). The latter has served as observational ground for the paradigm that powerful relativistic jets can almost exclusively be launched from massive elliptical galaxies, which in turn links the presence of prominent relativistic jets to the latest stages of galaxy evolution (e.g. Toft et al., 2014).
However, the detection of bright and variable -ray emission from narrow-line Seyfert type 1 galaxies (NLSy1s) by Fermi (Abdo et al., 2009b), casts doubts on the exclusive relation between powerful jets and early-type galaxies. Unlike -ray blazars, NLSy1s have always been found to be hosted by late-type galaxies where the prevalence of pseudo-bulges has been suggested (Orban de Xivry et al., 2011; Mathur et al., 2012). The small black hole masses inferred from their Balmer emission lines (FWHMHβ 2000 km s-1), their voracious appetite indicated by the high accretion rates close to the Eddington limit, together with their demography detected so far in the local universe (, Zhou et al., 2006) and their compact radio structures (Doi et al., 2007, 2011), have served as arguments to believe that NLSy1s might be AGN in an early phase of evolution (see Komossa, 2008, for a review). The NLSy1s detected at -rays appear to be exclusively radio-loud NLSy1s, a class that conforms only 7% of the overall NLSy1s population (Komossa, 2008). Although blazar-like properties in radio-loud NLSy1s were previously reported (Yuan et al., 2008), being -ray emitters was never anticipated due to their small black hole masses and their host-galaxy type, namely, spirals with high incidence of bars and ongoing star formation (Deo et al., 2006; Ohta et al., 2007; Sani et al., 2010; Caccianiga et al., 2014).
Since the discovery of -rays from radio-loud NLSy1s galaxies (Abdo et al., 2009b), most of the attention has been paid to the study of their blazar-like emission (Abdo et al., 2009a; Liu et al., 2010; Foschini et al., 2011; Calderone et al., 2011; D’Ammando et al., 2012; Foschini et al., 2012; Jiang et al., 2012; Paliya et al., 2013, 2014), while their relevance for the host galaxy jet paradigm has been scarcely studied. Studies aimed to characterize the host-galaxies of NLSy1s are very scarce due to the lack of deep imagery. So far, 1H 0323+342 (; 1.177 kpc arcsec-1 projected distance) is the unique NLSy1s for which a host galaxy imaging has been obtained (Zhou et al., 2007; Antón et al., 2008). As can be seen from Figure 1, at first glance the morphology of the host galaxy of 1H 0323+342 is irregular and shows a low-surface brightness morphological peculiarity that could be associated to a ring-like structure product of a recent merger event (Antón et al., 2008) or rather to a one-armed spiral structure (Zhou et al., 2007).
Despite previous imaging studies of 1H 0323+342, no structural modeling of its host galaxy has yet been conducted to investigate whether (or not) the host-galaxy properties of -ray NLSy1s resemble those of their radio-quiet counterparts – spirals with pseudo-bulges. Therefore, it is essential to investigate whether or not this new class of -ray sources are likely to be evolutionarily young objects (i.e. small black hole masses), as has been claimed for the overall population of NLSy1s. If this picture holds, it would imply that a young AGN – with its black hole is still growing under accretion rates approaching to the Eddington limit – might be able to launch (and collimate) fully developed relativistic outflows at an early evolutionary stage. This in turn would become an essential input to theoretical models for the formation of relativistic jets, AGN feedback and galaxy evolution (e.g. Di Matteo et al., 2005; Hopkins et al., 2005; Debuhr et al., 2010)
Motivated by the possibility that 1H 0323+342 could be an outstanding case where a prominent relativistic jet – powerful enough to accelerate particles up to the highest energies– uses a spiral galaxy as a launch pad, we take advantage of multi-filter imagery (, , , and ) to perform a systematic structural modeling of the 1H 0323+342 host galaxy. We also undertook a contemporaneous spectroscopy to obtain a virial estimate of its black hole mass, thus allowing for a comparison between black hole masses obtained by different scaling relations in order to assess the suspected youth of the central black hole of 1H 0323+342.
The observational data is presented in §2, along with the reduction processes and modeling. In §3 we present the structural analyses of the host galaxy and these results are discussed in section §4 in the context of AGN activity and black hole mass. Our results are summarized in §5. Throughout the manuscript we adopt cosmological parameters of , and a Hubble constant of Mpc-1 km s-1.
2. Observations
2.1. Imaging
The near-IR images of 1H 0323+342 were obtained in J and Ks bands at the 2.5m Nordic Optical Telescope (Roque de Los Muchachos, Spain) using the NOTCam. The NOTcam detector has a size of 1024 x 1024 pixels, and the pixel scale of the wide field camera used for the observations (0.234 arcsec pixel-1) gives it a total field of view of arcmin2. The observations were done on the nights of 23 and 25 of January 2013, with a seeing of 1.0 arcsec on both occasions. A dithering pattern was used for the observations to allow accurate sky subtraction. The dithering step used was 40 arcsec, with the observation split into 50 second exposures. 1H 0323+342 was observed for 15 minutes in J and Ks bands on both nights, for a total exposure time of 30 minutes per filter.
Data reductions were performed using the NOTCam quicklook package in IRAF111 IRAF is distributed by the National Optical Astronomy Observatories, which are operated by the Association of Universities for Research in Astronomy, Inc., under cooperative agreement with the National Science Foundation. Bad pixels were masked using a mask file available in the NOTCam bad pixel mask archive. There was no need for dark subtraction to be performed, because, the utility of differential sky flats and sky-subtraction, will automatically subtract out the dark component in the image frames. For each day, two pairs of sky flats were observed for better estimation of normalized median combined master flat. Furthermore, they were interpolated over bad pixels, using bad pixel mask and corrected for the dc-gradient in differential images. For sky subtraction, a scaled sky template was produced from a list of dithered frames provided along with a master flat, and then the sky was subtracted from it. Ultimately, using the field stars as reference points, the images were aligned to sub-pixel accuracy and combined to obtain a final reduced coadded image. Any cross-talk or horizontal strips were removed from these images without affecting the flux of the source. For zero point calibration, a cross-matching was performed between the photometry of field stars with the 2MASS database in the same filter. Fully reduced NOT and images are displayed in panels c and d of Figure 1.
2.2. Spectroscopy
Within the framework of a spectrophotometric monitoring program of bright -ray sources (Patiño-Álvarez et al., 2013), we undertook spectroscopic observations of 1H 0323+342 using the Boller & Chivens long slit spectrograph on the 2.1m Guillermo Haro Astrophysical Observatory (GHAO) in Sonora, México. The spectra were obtained under photometric weather conditions (17 September 2012, 09 January 2013, 07 and 11 February 2013) using a slit width of 2.5 arcsec. The spectral resolution was R=15 Å and R=7 Å (FWHM) for the low resolution and the intermediate resolution spectra, respectively. The wavelength range for the three low resolution spectra is 3800-7100 Å, while for one intermediate resolution spectrum the wavelength range is 4300-5900 Å. The S/N ratio was 40 in the continuum near H. To enable a wavelength calibration, HeAr lamp spectra were taken after each object exposure. Spectrophotometric standard stars were observed every night (at least two per night) to enable flux calibration.
The spectrophotometric data reduction was carried out with the IRAF package. The image reduction process included bias and flat-field corrections, cosmic ray removal, 2D wavelength calibration, sky spectrum subtraction, and flux calibration. The 1D spectra was subtracted taking an aperture of 6 arcsec around the peak of the spectrum profile. The spectra was also transformed to rest frame wavelength, applying a K-correction in the process as multiplying by a factor , using the IRAF Task DOPCOR and the redshift obtained from measuring the peak of the H emission line. Top panel in Figure 3 displays a fully reduced optical spectrum of 1H 0323+342, from which it can be identified the narrow H and H profiles in addition to the FeII bumps – all features that allow us to classify 1H 0323+342 as a genuine NLSy1.

3. The Host galaxy
3.1. Photometric decomposition
For the time being, 1H 0323+342 is the unique -ray NLSy1s for which a host galaxy imaging has been obtained (Zhou et al., 2007; Antón et al., 2008). A peculiar structure in the host galaxy of 1H 0323+342 has drawn attention, and is being associated to either a spiral arm or a ring structure. In order to get a physical insight into the host galaxy of 1H 0323+342 and to determine its evolution stage, we use deep NIR imaging aiming to perform a multi wavelength surface brightness host galaxy decomposition analysis.
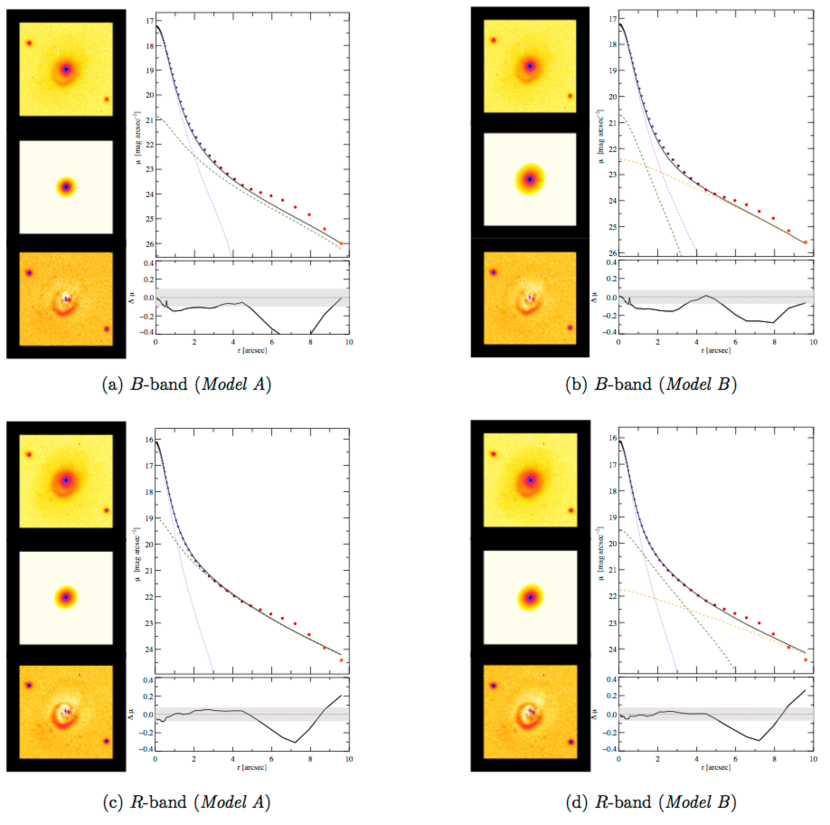
In addition to our NIR imagery presented in Section 2.1, we analyze archival and deep host galaxy images of 1H 0323+342 taken also with the NOT (Antón et al., 2008). To study the structure of the 1H 0323+342 host galaxy quantitatively, we use the two dimensional surface brightness model fitting code GALFIT (Peng et al., 2002). We considered two models to fit the surface brightness of the host galaxy. Model A: single bulge component characterized with a Sérsic profile; and Model B: bulge + disk component, where the disk is represented by an exponential disk. Both models include a PSF to fit the unresolved nuclear component associated to the AGN contribution (likely dominated by the non-thermal emission of the relativistic jets). The Sérsic function (Sersic, 1968) is described as
| (1) |
where is the surface brightness at the radius , is the surface brightness at effective radius , which is defined as the radius where the galaxy contains half of the light. The Sérsic index defines the shape of the surface brightness function, while is a parameter coupled to in such way that is the surface brightness at the effective radius. When , the Sérsic function becomes the de Vaucouleurs model (de Vaucouleurs, 1948).
The exponential function (Freeman, 1970) is defined as
| (2) |
where is the central surface brightness, and is the scale length of the disk. The exponential function is a special case of the Sérsic function when . Since the images lack of high signal-to-noise-ratio (SNR) stars, we create a point spread function (PSF) model for each filter by using a Moffat profile (Moffat, 1969; Peng et al., 2002). To do this, nearby stars were selected and fitted with GALFIT. Then, we created the PSF from the fitted parameters. The success of the PSF model by using a Moffat profile is revealed by the small amplitude, non-systematic variations in the residual image. In addition, Figure 1 shows that our PSF fits properly in the central region of the galaxy.
To remove unwanted objects from the fitting, we use Sextractor (Bertin & Arnouts, 1996) to create a mask image for the fit. We took the “segmentation” image, and removed the mask area that covers 1H 0323+342. We use the same mask image for both models: the Sérsic (Model A) and Sérsic exponential (Model B). We need to provide GALFIT with initial parameters which were were taken as initial guesses from a Sextractor run. Magnitude, effective radius, and axis ratio were taken from the MAG_BEST, FLUX_RADIUS and ELLIPTICITY Sextractor parameters, respectively. The value of PSF magnitude was chosen slightly dimmer than the Sérsic magnitude. Sérsic index was set initially to . Then, all parameters in the Sérsic profiles and the exponential disk were allowed to vary. It should be noticed that setting (or fixing) the initial guess of the S érsic index to (typical value for blazar host galaxies) or unmasking the spiral arm region, did not yield to better results. Table 1 shows the best fit parameters for the two galaxy models. Magnitudes listed in Table 1 have been corrected for atmospheric and galactic extinction (Schlafly & Finkbeiner, 2011), and included the corresponding K-correction based on 1H 0323+342 host-galaxy color (Chilingarian et al., 2010; Chilingarian & Zolotukhin, 2012).
From Table 1, it can be gleaned that for both models – at each filter – the obtained values are similar, and thus an evaluation of the fit goodness merely based on these values is not applicable to assess and compare models. Moreover from an inspection of the smoothness of residuals, it can be noticed that the residual peak-to-peak fluctuations percentage is similar for both models at each band. Since both models are equally adequate in describing the profile of 1H 0323+342 within all four bandpasses, statistically speaking, we are encouraged to adopt the less complex model (fewer parameters): Model A. While one cannot completely exclude the possibility of a disk component, after a visual inspection of the residual image and surface brightness profiles (see Figure 1), there is no obvious presence of a “missing component”. Despite the single spiral arm structure left in the residual image, the residuals are dominated by randomness.
3.2. 2D Fourier analysis
In order the get further insight into the structure we observe in the images of 1H 0323+342, we performed a 2D Fourier analysis based on logarithmic spirals. This technique was originally proposed by Kalnajs (1975) and was largely used for morphological analysis (Considere & Athanassoula, 1982, 1988; Puerari & Dottori, 1992; Block & Puerari, 1999; Puerari et al., 2000, among others). Basically, the Fourier amplitude of a deprojected image of a given disk galaxy is calculated by
where , is the intensity of the image at (, ), , and are the polar coordinates, and and are the radial limits in the direction. and are the frequencies related to and , respectively. The azimuthal frequency represents the number of arms, and is related to the pitch angle by . We must note that different signs of represent spiral structures with opposite windings. e.g., for structures, represents spirals with a “Z” shape, while represents “S” shaped spirals.

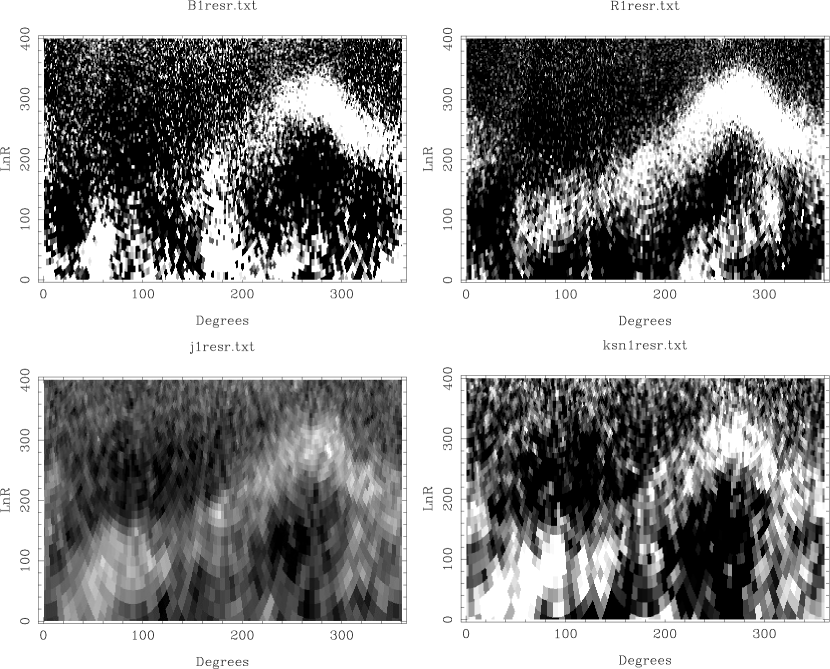
One can easily note that in a plane, a logarithmic spiral will be represented as inclined straight lines (positive or negative inclination depending on the sign of ). For a single armed structure, the 2D Fourier power spectra will show a single peak for this component (see for example, the spectra for M 31 in Kalnajs (1975); Considere & Athanassoula (1982); Puerari & Dottori (1992). As we will see later, 1H 0323+342 has an spectrum showing 2 peaks, one at and other at , more representative of an elliptical structure, probably a ring.
We developed a 2D Fourier software and applied it to the deprojected , , and images of 1H 0323+342. Before doing the Fourier calculation, we have subtracted the axisymmetric component. This does not change any power in different than . In Figure 4 we show a mosaic of the four filter images. We can easily notice a curved structure which appears as a broken ring or an spiral arm. The -image shows a strong structure just below and closer to the center, which is hardly visible in the other filters. The circles in these images represent the radii and . In Figure 5 we present a similar mosaic, now in the () plane. The saw-tooth shape we can notice in these plots are more representative of a ringed structure.
Recently, Savchenko & Reshetnikov (2013) have measured the spiral arms pitch angle variation (in radius) for a sample of 50 non-barred (or weakly barred) grand-design spirals. They found that most of the spiral arms cannot be described by a single value of the pitch angle. Instead, the galaxies show decreasing pitch angle values for increasing radii (more tightly wound spirals in the external part of the disk). For 1H 0323+342 the situation is quite different. The two structures seen in each panel of Figure 4 are represented by spirals with pitch angles that differs in sign, i.e., one structure has pitch angle around , while the other one shows . In the Savchenko & Reshetnikov (2013) study, 2/3 of their sample shows pitch angle variations exceeding 20%, but the arms they analyzed never changed the sign of the pitch angle value.
It should be noticed that a number of disk galaxies present resonant rings or pseudo rings – see Buta (2011) for an intensive discussion about ring and pseudo ring morphology. These rings are generally placed at some resonant radius, they are nearly circular, with the galaxy nucleus placed at the ring center, and sometimes, a bar. Therefore, the observed lopsidedness of the structure in 1H 0323+342 is difficult to explain with a resonant ring.
Two scenarios of interactions can be suggested. We could be witnessing the process of a small companion spiraling to the center of a massive galaxy. The particular geometry and the actual time of the orbit could be showing us that lopsided structure. From the high resolution (residual) image presented in Zhou et al. (2007, their Figure 2), the structure does look like a spiral as it connects to and appears to originate from the nucleus. The structure shows an asymmetric brightness distribution, being broken in some azimuthal position. The abrupt decrease of the pitch angle is also a striking characteristic. Furthermore, some minor mergers could trigger the activity in galaxies (e.g. Hernquist & Mihos, 1995).
Other alternative is that the structure results from a passage/collision as those forming ring galaxies like the Cartwheel (Struck-Marcell & Higdon, 1993; Athanassoula et al., 1997; Curir, 2006; Fiacconi et al., 2012). The Cartwheel is shown to be an example of central, almost perpendicular passage of a spherical companion through a disk. Other encounters, with a companion passing through the disk in a off-center and/or a non perpendicular orbit, result in rings which are not so symmetric as Cartwheel. Indeed, very high simulations by Fiacconi et al. (2012) (see their Figure 2) show a variety of morphologies resulting from different interaction geometry. However, we note that the size of the bulge derived from Model A is larger than the ring, so the ring has to be enshrouded by the bulge. Such a geometric configuration, if real, would present an interesting case as it is rarely seen.

Finally, in Figure 6 we show the Fourier spectrum we have calculated. As expected, they represent a ringed structure. We can note the peak, representing a “(” shape, and the peak, representing a “)”structure. For the filter, the strong structure we see just below the center probably affects the spectrum for at , erasing the “valley” we see between the peaks in the other filters.
The ringed structure detected via 2D Fourier transform on the basis of logarithmic spirals does not necessarily mean that the real structure is indeed a ring on the disc plane. As discussed above, for a given geometry, some interaction in which the companion is disrupted when orbiting the disk can generate debris which could be detected as a projected ringed structure. The essential ingredient to solve the problem will be to get kinematical data from the ringed structure to decide if it is indeed an off centered ring or a disrupted intruder.
4. Discussion
4.1. The black hole mass
In this section we examine the black hole mass in order to investigate whether (or not) 1H 0323+342 is an evolutionarily young object as suspected for the overall population of NLSy1s. Since a black hole accelerates nearby matter, its mass can be estimated by modeling the kinematics of either nearby gas (within the BLR; e.g. Kaspi et al., 2000) or stars in its vicinity (inside the bulge of its host galaxy; e.g. Magorrian et al., 1998; Tremaine et al., 2002). However, recent results have shown that in radio-loud AGN, the gas of the BLR can be accelerated and ionized by the non-thermal emission from the jet (León-Tavares et al., 2010, 2013; Arshakian et al., 2010), which in turn might introduce uncertainties in the black hole mass estimated by assuming that the BLR clouds follow a virialized motion. Bearing this in mind, we consider two indirect methods to estimate the mass of the black hole of 1H 0323+342: (i) via the width of its broad emission lines, and (ii) via the luminosity of its bulge.
Despite several studies on the emission line properties of NLSy1s, there is no consensus yet on how the profiles of the emission lines in NLSy1s should be properly characterized. Because of the cusped peaks and broad wings of H and H emission lines, some works have suggested that NLSy1s emission lines have Lorentzian profiles (e.g. Veron et al., 1980, 1981a, 1981b; Moran et al., 1996; Gonçalves et al., 1999; Véron-Cetty et al., 2001). Nevertheless, more recent studies (e.g. Rodríguez-Ardila et al., 2000; Dietrich et al., 2005) found no evidence of Lorentzian profiles and instead suggest that the profiles of NLSy1s can be well represented by using two (or three) Gaussian components. Building on the above studies, we follow two different approaches to characterize the H emission line in 1H 0323+342: (a) single Lorentzian fitting, and (b) three Gaussian decomposition.
The fitting is performed using the task SPECFIT (Kriss, 1994) from the IRAF package. The steps we followed for identification, de-blending, and line measurements in each spectra are: The continuum – We adopted a single power-law fit to describe a local continuum using the continuum windows around 4200 and 5400 Å. Fe II emission – We adopt the template of the NLSy1 prototype I Zw 1 (Marziani et al., 2003) to characterize the Fe II emission in the optical band. H emission line – Case (a) – The entire H profile was fitted with a single Lorentzian, as well as the He II 4686 emission line; the [O III] 4959,5007 emission lines have the same FWHM and are fitted with a single Gaussian each. Case (b) – We assume that a single value of FWHM is adequate to fit the narrow components of the H and [O III] lines ([O III] 5007 FWHM was adopted); while the broad component of H was fitted using two independent Gaussians; the He II 4686 emission line was fitted with a single Gaussian. Final Fitting– A simultaneous fitting of all the components is performed by Chi-square minimization using a Marquardt algorithm. Example of the fits obtained for the intermediate resolution spectrum (2013 Feb 11) using these two approaches can be seen in the bottom panels of Figure 3.
We make use of the relations presented in Vestergaard & Peterson (2006) to estimate the black hole mass of 1H 0323+342 via the continuum (5100 Å) and H luminosities. We consider the later scaling relation because it is very likely that, during an outburst episode, the optical continuum emission of 1H 0323+342 could be dominated by the non-thermal radiation from its relativistic jet – responsible for the production of gamma-ray photons. The relations to estimate black hole mass using the H and 5100 Å continuum luminosities are expressed below,
| (3) |
| (4) |
and the corresponding black hole mass estimates are shown in columns (5) and (6) of Table 2, respectively.
We also make use of the relation between the black hole mass and the bulge luminosity (MBH-Mbulge) to compare and test the consistency of our black hole mass estimates. Since we have performed the photometric decomposition of the host galaxy of 1H 0323+342 in four different filters, we can make use of at least two MBH-Mbulge relations calibrated for two different filters, namely and and (Graham, 2007). The expression we used to estimate the black hole mass of 1H 0323+342 via the magnitude of its bulge are listed next,
| (5) |
| (6) |
and the associated intrinsic scatters are about 0.3 dex. The black hole mass estimates for 1H 0323+342 using the above expressions and the bulge magnitudes from Model A (listed in Table 1) are log M and log M; hereafter we shall considered a mean value of log M . The later values are consistent with black hole mass estimates obtained by other derived expressions in the NIR (Vika et al., 2012). On the other hand, if we consider the bulge properties derived for Model B, we obtain log M and log M, which yields a mean value of 8.2. Model B yields a smaller mass than Model A, as expected for a smaller bulge.
As can be seen from Table 2, the black hole mass estimates of 1H 0323+342 obtained by using the single-epoch spectra scaling relations (Vestergaard & Peterson, 2006) are significantly lower (by about one order of magnitude) than those estimated via the bulge magnitude (found in both Model A and Model B) . This apparent disagreement has been previously noticed in several studies on NLSy1s (e.g. Mathur et al., 2001; Grupe & Mathur, 2004; Komossa & Xu, 2007; Ryan et al., 2007) and has been taken as an observational evidence for the intrinsic youth of NLSy1s. It has been suggested that NLSy1s do not follow the MBH - relation (e.g. Mathur et al., 2001), probably because they are still accreting material and therefore their bulges have not had enough time to virialize after a possible galaxy encounter. It should be noticed that independent evidence for small black hole masses in NLSy1 has been suggested from X-ray variability analysis (Nikołajuk et al., 2009; Ai et al., 2011; Ponti et al., 2012), albeit only for radio-quiet sources.
An alternative explanation for such a disparity in black hole mass estimates (and the narrow H profiles in NLSy1s) assumes the presence of a flat (i.e. disc-like) broad-line region (Osterbrock & Pogge, 1985; Collin & Kawaguchi, 2004; Decarli et al., 2008, 2011). In this scenario, the H profile depends sensitively on the inclination of the BLR. If the viewing angle between the line of sight and the jet axis is large (e.g. ; an edge-on disk), then emission lines arising from a flat BLR will appear broad, even double-peaked (e.g. Shapovalova et al., 2010a, b). The red and blue wings in the profile are associated to the receding and approaching regions of the rotating disk, respectively. As the viewing angle reduces, the two wings of the emission line get closer together until they merge into a very narrow profile for a disk seen face-on (). Following the methodology presented in Decarli et al. (2008) and assuming a viewing angle typical of gamma-ray emitters (), we obtain an estimate for the black hole mass of log M . This value is in fair agreement with the black hole mass estimated via the bulge luminosity and is also consistent with black hole masses estimated in a sample of radio-loud NLSy1s via modeling of the optical and UV data with an accretion disc model (Calderone et al., 2013).
4.2. The active nucleus
What type of AGN is 1H 0323+342? The measurements of its nuclear optical spectra features – km s-1, R, R , allow us to classify it as a NLSy1 222R4570 and R5007 measurements have been taken from Zhou et al. (2007). We will explore variability of these spectral features in a forthcoming article. . At the same time, its non-thermal emission signatures – presence of a core-jet structure (Antón et al., 2008; Wajima et al., 2014) and detection of intense and variable high energy photons in the Fermi energy bands (Abdo et al., 2009b), strongly suggest that a blazar nucleus might be at work. Previous works found an anti correlation between radio-loudness and Eddington ratio (Lbol/LEdd) 333The Eddington ratio is defined as the ratio between the bolometric and Eddington luminosities, and is often used as a dimensionless proxy for the accretion rate. in a sample of Seyfert 1 and NLSy1 galaxies, (Ho, 2002; Greene et al., 2006). The trend of increasing radio-loudness with decreasing Eddington ratio suggests that NLSy1 sources – accreting close or above the Eddington limit (i.e. =1), should be radio-quiet (). Interestingly, 1H 0323+342 does not follow this trend at all, with an extreme radio-loudness (; Doi et al., 2012), and its Eddington ratio 444 We estimate bolometric and Eddington luminosities as L and L, respectively. The mean estimated black hole masses (see section 4.1) are and . Eddington ratios for 1H 0323+342 range from Lbol/L to Lbol/L. is significantly higher to the value predicted by the above mentioned relation ( = -4.3). Yuan et al. (2008) already noticed that radio-loud NLSy1 do not follow the inverse relation between Lbol/LEdd and radio-loudness. This, might suggest that radio-loud NLSy1 depart from the population of Seyfert and radio-quiet NLSy1 galaxies. Although there is evidence of radio-loud sources having high Eddington rates (Sikora et al., 2007), those are classified as quasars and might be intrinsically different from Seyferts. Therefore, any comparison between 1H 0323+342 (an extreme radio-loud NLSy1) in the context of the Seyfert and radio-quiet NLSy1 galaxy population should be handled with caution.
If we were to favor the disk-like BLR and the pole-on geometry in 1H 0323+342, then we would be implicitly assuming the bulge magnitude as the most reliable proxy for the black hole mass (, consequently Lbol/L). In this scenario, 1H 0323+342 would represent a gamma-ray emitter which black hole mass, luminosity and Lbol/LEdd are average among extragalactic high-energy sources. Thus, there is no need of invoking Lbol/LEdd close (or above) to the Eddington limit. However, at this point the discerning reader might ask: Could 1H 0323+342, along with the afore mentioned Lbol/LEdd and black hole mass within the blazar range, produce the intense Fe II emission observed?
Before trying to address the above question, we should bear in mind the following issues: (i) Although Fe II emission is prominent and a casting signature in NLSy1s (Véron-Cetty et al., 2001), this feature it is not exclusive to NLSy1s and can be found in radio-loud AGN as well (e.g. Jackson & Browne, 1991; Miller et al., 1993; Torrealba et al., 2012), albeit with lower intensity; (ii) Since the Fe II emission is complex, with a large number of lines blending with each other and with adjacent emission lines, the main physical driver(s) behind the production of such lines remains under debate. A principal- component analysis of quasar spectra suggested a tight connection between Lbol/LEdd and Fe II emission (Boroson & Green, 1992; Marziani et al., 2001). However, details on this connection are not yet fully understood. The Fe II emission is believed to be a major coolant of the BLR (e.g. Garcia-Rissmann et al., 2012), and different gas heating mechanisms have been suggested in the past. It has been proposed that Fe II emission could be generated via photoionization mechanisms and arise from a flatter distribution (i.e. a disk) (e.g. Marziani et al., 2001).
Alternatively, the model by Joly (1991), based on the scheme presented in Norman & Miley (1984), proposes that Fe II emission could be produced when the jet interacts with its environment. Nevertheless, both models assume that Fe II emission is anisotropic and thus orientation dependent. In the case where the Fe II originates in a disk, the Fe II emission would be increased when such disk would be seen face-on (or the galaxy seen pole-on). On the other hand, in the jet model, emission could be boosted due to the orientation angle of the jet. Then, the excess of Fe II seen in the optical spectra of 1H 0323+342 could be a consequence of the anisotropic emission. León-Tavares et al. (2013) found that the Fe II in the optical spectra of the bright gamma-ray source 3C 454.3, responds to the variation of the non-thermal optical continuum emission. This in turn could be considered suggestive that in sources with prominent relativistic jets, as in 1H 0323+342, the degree of anisotropy in the Fe II emission might be significant, and that the ionizing non-thermal continuum emission from the jet can play a major role in the production of Fe II emission.
4.3. Host-galaxy and environment
In the current NLSy1s paradigm, the relative youth associated to these sources is accountable for the following observational properties: (i) late-type host galaxy, (ii) under massive black holes and (iii) high accretion rates approaching to the Eddington limit. However, as previously discussed (see sections 4.1, 4.2), properties ii and iii are prone to uncertainties in the methods used to estimate the mass of the central black hole. Therefore, the characterization of the host-galaxy arises as the most unbiased method to verify the intrinsic youth of NLSy1s.
However, given the limited spatial resolution and depth of our imagery, we cannot rule out completely the presence of a disc component in the host-galaxy of 1H 0323+342. Moreover, the disc structural parameters derived for model B are within the range of disc parameters reported in a sample of radio-quiet NLSy1 galaxies found to be hosted by pseudo-bulges (Mathur et al., 2012). The presence of pseudo-bulges in NLSy1s has been previously proposed (e.g. Orban de Xivry et al., 2011; Mathur et al., 2012), in this context, the morphological parameters (i.e. ) derived for model B (see Table 1) might suggest the presence of a pseudo bulge in 1H 0323+342. The 2D Fourier analysis and brightness asymmetry of the spiral-arm like structure identified throughout our multi-filter imagery hints to a gravitational interaction origin. Conversely, Fisher & Drory (2008) did not find conclusive evidence for a link between secular evolution and dynamical interaction.
If we assume the bulge magnitude as the most reliable proxy for the black hole mass, then 1H 0323+342 would represent a gamma-ray emitter which black hole mass and luminosity are average among extragalactic high-energy sources. Prominent relativistic jets – powerful enough to accelerate particles up to the highest energies– have been always found to be launched from old red giant elliptical galaxies, thus linking the presence of relativistic jets to the latest stages of evolution.
However, the peculiar structure in the host galaxy of 1H 0323+342, in this work identified as a ring, hints to a recent violent dynamical interaction and might be taken as a suggestive evidence of a galaxy encounter as responsible for the triggering of the AGN activity and the initiation of a relativistic jet (see Ramos Almeida et al., 2012) responsible of the production of high-energy photons Interestingly, while previous works have identified prominent radio jets being launched from disk-like galaxies (e.g. van Breugel et al., 1984; Heckman et al., 1982; Emonts et al., 2008), several of those galaxies show a disturbed morphology likely associated to a violent recent interaction, which comes in line with the interpretation of the 1H 0323+342 host galaxy structure as a ring.
This scenario is supported by the timescales of galaxy interaction and radio structures derived in Antón et al. (2008). Therefore, it is likely that the gamma-ray nuclei of 1H 0323+342 is hosted by a galaxy that may have experienced an interaction in the recent past, as suggested by the presence of the ring structure identified in this work. If this picture holds, it would imply that a recently triggered AGN, might be able to launch (and collimate) fully developed relativistic outflows at an early evolutionary stage. This in turn would become an essential input to theoretical models for the formation of relativistic jets, AGN feedback and galaxy evolution (e.g. Silk & Rees, 1998; Di Matteo et al., 2005; Hopkins et al., 2005; Debuhr et al., 2010).
We summarize this presentation by emphasizing two observational circumstances regarding the host galaxy and nuclear activity of the gamma-ray NLSy1 1H 0323+342: () The present multi-filter images do not allow us to judge on the presence or absence of a disc component in the host galaxy of 1H 0323+342. However, the good representation of the surface brightness of the 1H 0323+342 host galaxy by model A, combination of a bulge and an unresolved nuclear component, presently does not argue for its presence. Nevertheless, deeper and high resolution observations are clearly needed to confirm the presence (or absence) of a disc component in 1H 0323+342. () The discrepancy between black hole mass estimates (via BLR radius and bulge magnitude) can either suggest the presence of a flat distribution of the BLR or perhaps a bulge that is still under a growing phase. The pole-on view of 1H 0323+342 is supported by the one-sided jet structure observed and the detection of high energy photons. In the other hand, we note that the resultant structural properties of the bulge obtained in model A (e.g. ) depart from the general properties of bulges launching prominent relativistic jets – best fitted by a de Vaucouleurs profile (i.e. ). Moreover, the extended structure in the host galaxy of 1H 0323+342, identified in this work as a ring, suggest a recent merger activity. Unlike the general population of extragalactic gamma-ray sources (i.e. blazars), the host-galaxy of 1H 0323+342 does not seem to be passively evolving. The AGN activity in 1H 0323+342 could have been triggered by inflows of gas provided by a recent galaxy interaction. Therefore, 1H 0323+342 might reveal itself as an outstanding case where an AGN with a growing black hole might be able to launch (and collimate) fully developed relativistic jets at an early evolutionary stage.
5. Summary
Knowledge of the variability of the -ray NLSy1s across the electromagnetic spectrum has increased substantially following recent detection of outburst episodes (e.g. Abdo et al., 2009b, a; Liu et al., 2010; Donato & Perkins, 2011; Foschini et al., 2011; Calderone et al., 2011; D’Ammando et al., 2012; Foschini et al., 2012; Jiang et al., 2012; Carpenter & Ojha, 2013; Paliya et al., 2013; D’Ammando et al., 2013b, a; Itoh et al., 2013; Tibolla et al., 2013; Wajima et al., 2014). But the nature of the underlying galaxy that host the -ray NLSy1s nuclei has remained rather unexplored. Since NLSy1s are commonly hosted by spiral galaxies with high incidence of bars and ongoing star formation (Deo et al., 2006; Ohta et al., 2007; Sani et al., 2010), the detection of high-energy photons from NLSy1s casts doubts on the exclusive relation between giant elliptical galaxies and relativistic jets (e.g. Kotilainen et al., 1998b, a).
In this context, it is crucial to determine what type of host galaxies tend to harbor -ray NLSy1s. Hence, we have used multi filter imagery and contemporaneous optical spectroscopy to get a physical insight into the host galaxy, and to estimate the black hole mass, of the closest -ray NLSy1s (1H 0323+342 at ) so far detected by the Fermi Gamma-ray Space Observatory. We summarize our results as follows:
-
1.
Our NIR ( and ) images of 1H 0323+342 confirm the irregular morphology previously identified in optical images. The surface brightness profiles of 1H 0323+342, have been decomposed into a sum of an AGN unresolved component (PSF), Sérsic bulge and an exponential disk. We have used two models to perform the surface brightness profile decomposition with GALFIT: (model A) AGN+Sérsic and (model B) AGN+Sérsic+Disk. The two models are almost identical in terms of reduced values (see Table 1) and smoothness of the residual images. Since both models are equally adequate in describing the profile of 1H 0323+342 within all four bandpasses, on statistical grounds, we may adopt the simplest model (with less free parameters): model A.
-
2.
The peculiar low surface brightness feature observed in the multi band images of 1H 0323+342, has been classified as a one-armed-spiral or a ring structure by Zhou et al. (2007) and Antón et al. (2008), respectively. In order to shed some light on this apparent disagreement, we have performed a 2D Fourier analysis aiming to characterize the dynamical structure of the galaxy. The Fourier spectrum obtained from our analysis indicates that the feature seen in the images of 1H 0323+342, can be best represented by a ringed structure. We interpret this as suggestive evidence for a recent violent dynamical interaction in 1H 0323+342, likely related to the triggering of the AGN activity. If model A is correct, the ring has to be located inside the bulge, presenting a rare and interesting case.
-
3.
The mass of the central black hole in 1H 0323+342, estimated by using the FWHM of the H emission lines measured from contemporary spectroscopy, is predicted to be about (R. As a complementary approach, avoiding possible non-virial motions (León-Tavares et al., 2013) and geometrical effects in the BLR (Decarli et al., 2008), we use the scaling relations between the mass of the black hole and the luminosity of the spheroid; (M and (M for model A and model B, respectively. The black hole masses estimated by two different scaling relations, differ from each other by about one order of magnitude, which is more than can be explained with the measurement uncertainties and intrinsic scatter of the relations used. The black hole mass estimated via the bulge luminosity is within a range of values typical of -ray blazars, (e.g. Falomo et al., 2002, 2003; Barth et al., 2003; León-Tavares et al., 2011a).
Nevertheless, further integral-field unit (IFU) observations, as well as high spatial resolution, deep imaging observations will allow us to confirm the host galaxy type of 1H 0323+342 and to properly authenticate the nature of such a peculiar structure as a ring – remanent of a recent dynamical interaction. Based on the results presented in this work, it becomes evident that the attempt to characterize the host galaxy in other gamma-ray NLSy1s is essential to understand the nature and evolutionary stage of this new class of gamma-ray emitters.
We acknowledge the anonymous referee for a very careful reading of the manuscript and comments that significantly improved this manuscript. This work was supported by CONACyT research grant 151494 (México). V. P. A. and A. O. I. acknowledge support from the CONACyT program for PhD studies. This paper is based on observations made with the Nordic Optical Telescope, operated on the island of La Palma jointly by Denmark, Finland, Iceland, Norway and Sweden, in the Spanish Observatorio del Roque de los Muchachos of the Instituto de Astrofísica de Canarias.
References
- Abdo et al. (2009a) Abdo, A. A., Ackermann, M., Ajello, M., et al. 2009a, ApJ, 707, 727
- Abdo et al. (2009b) —. 2009b, ApJ, 707, L142
- Ackermann et al. (2011) Ackermann, M., Ajello, M., Allafort, A., et al. 2011, ApJ, 743, 171
- Ai et al. (2011) Ai, Y. L., Yuan, W., Zhou, H. Y., Wang, T. G., & Zhang, S. H. 2011, ApJ, 727, 31
- Antón et al. (2008) Antón, S., Browne, I. W. A., & Marchã, M. J. 2008, A&A, 490, 583
- Arshakian et al. (2010) Arshakian, T. G., León-Tavares, J., Lobanov, A. P., et al. 2010, MNRAS, 401, 1231
- Athanassoula et al. (1997) Athanassoula, E., Puerari, I., & Bosma, A. 1997, MNRAS, 286, 284
- Barth et al. (2003) Barth, A. J., Ho, L. C., & Sargent, W. L. W. 2003, ApJ, 583, 134
- Bertin & Arnouts (1996) Bertin, E., & Arnouts, S. 1996, A&AS, 117, 393
- Block & Puerari (1999) Block, D. L., & Puerari, I. 1999, A&A, 342, 627
- Boroson & Green (1992) Boroson, T. A., & Green, R. F. 1992, ApJS, 80, 109
- Buta (2011) Buta, R. J. 2011, ArXiv e-prints
- Caccianiga et al. (2014) Caccianiga, A., Antón, S., Ballo, L., et al. 2014, MNRAS, 441, 172
- Calderone et al. (2011) Calderone, G., Foschini, L., Ghisellini, G., et al. 2011, MNRAS, 413, 2365
- Calderone et al. (2013) Calderone, G., Ghisellini, G., Colpi, M., & Dotti, M. 2013, MNRAS, 431, 210
- Carpenter & Ojha (2013) Carpenter, B., & Ojha, R. 2013, The Astronomer’s Telegram, 5344, 1
- Chilingarian et al. (2010) Chilingarian, I. V., Melchior, A.-L., & Zolotukhin, I. Y. 2010, MNRAS, 405, 1409
- Chilingarian & Zolotukhin (2012) Chilingarian, I. V., & Zolotukhin, I. Y. 2012, MNRAS, 419, 1727
- Collin & Kawaguchi (2004) Collin, S., & Kawaguchi, T. 2004, A&A, 426, 797
- Considere & Athanassoula (1982) Considere, S., & Athanassoula, E. 1982, A&A, 111, 28
- Considere & Athanassoula (1988) —. 1988, A&AS, 76, 365
- Curir (2006) Curir, A. 2006, Ap&SS, 306, 99
- D’Ammando et al. (2012) D’Ammando, F., Orienti, M., Finke, J., et al. 2012, MNRAS, 426, 317
- D’Ammando et al. (2013a) —. 2013a, MNRAS
- D’Ammando et al. (2013b) D’Ammando, F., Orienti, M., Doi, A., et al. 2013b, MNRAS, 433, 952
- de Vaucouleurs (1948) de Vaucouleurs, G. 1948, Annales d’Astrophysique, 11, 247
- Debuhr et al. (2010) Debuhr, J., Quataert, E., Ma, C.-P., & Hopkins, P. 2010, MNRAS, 406, L55
- Decarli et al. (2008) Decarli, R., Dotti, M., Fontana, M., & Haardt, F. 2008, MNRAS, 386, L15
- Decarli et al. (2011) Decarli, R., Dotti, M., & Treves, A. 2011, MNRAS, 413, 39
- Deo et al. (2006) Deo, R. P., Crenshaw, D. M., & Kraemer, S. B. 2006, AJ, 132, 321
- Di Matteo et al. (2005) Di Matteo, T., Springel, V., & Hernquist, L. 2005, Nature, 433, 604
- Dietrich et al. (2005) Dietrich, M., Crenshaw, D. M., & Kraemer, S. B. 2005, ApJ, 623, 700
- Doi et al. (2011) Doi, A., Asada, K., & Nagai, H. 2011, ApJ, 738, 126
- Doi et al. (2012) Doi, A., Nagira, H., Kawakatu, N., et al. 2012, ApJ, 760, 41
- Doi et al. (2007) Doi, A., Fujisawa, K., Inoue, M., et al. 2007, PASJ, 59, 703
- Donato & Perkins (2011) Donato, D., & Perkins, J. S. 2011, The Astronomer’s Telegram, 3452, 1
- Emonts et al. (2008) Emonts, B. H. C., Morganti, R., Oosterloo, T. A., et al. 2008, MNRAS, 387, 197
- Falomo et al. (2003) Falomo, R., Kotilainen, J. K., Carangelo, N., & Treves, A. 2003, ApJ, 595, 624
- Falomo et al. (2002) Falomo, R., Kotilainen, J. K., & Treves, A. 2002, ApJ, 569, L35
- Fiacconi et al. (2012) Fiacconi, D., Mapelli, M., Ripamonti, E., & Colpi, M. 2012, MNRAS, 425, 2255
- Fisher & Drory (2008) Fisher, D. B., & Drory, N. 2008, AJ, 136, 773
- Foschini et al. (2011) Foschini, L., Ghisellini, G., Kovalev, Y. Y., et al. 2011, MNRAS, 413, 1671
- Foschini et al. (2012) Foschini, L., Angelakis, E., Fuhrmann, L., et al. 2012, A&A, 548, A106
- Freeman (1970) Freeman, K. C. 1970, ApJ, 160, 811
- Garcia-Rissmann et al. (2012) Garcia-Rissmann, A., Rodríguez-Ardila, A., Sigut, T. A. A., & Pradhan, A. K. 2012, ApJ, 751, 7
- Gonçalves et al. (1999) Gonçalves, A. C., Véron-Cetty, M.-P., & Véron, P. 1999, A&AS, 135, 437
- Graham (2007) Graham, A. W. 2007, MNRAS, 379, 711
- Greene et al. (2006) Greene, J. E., Ho, L. C., & Ulvestad, J. S. 2006, ApJ, 636, 56
- Grupe & Mathur (2004) Grupe, D., & Mathur, S. 2004, ApJ, 606, L41
- Heckman et al. (1982) Heckman, T. M., Miley, G. K., Balick, B., van Breugel, W. J. M., & Butcher, H. R. 1982, ApJ, 262, 529
- Hernquist & Mihos (1995) Hernquist, L., & Mihos, J. C. 1995, ApJ, 448, 41
- Ho (2002) Ho, L. C. 2002, ApJ, 564, 120
- Hopkins et al. (2005) Hopkins, P. F., Hernquist, L., Cox, T. J., et al. 2005, ApJ, 630, 705
- Itoh et al. (2013) Itoh, R., Tanaka, Y. T., Fukazawa, Y., et al. 2013, ApJ, 775, L26
- Jackson & Browne (1991) Jackson, N., & Browne, I. W. A. 1991, MNRAS, 250, 414
- Jiang et al. (2012) Jiang, N., Zhou, H.-Y., Ho, L. C., et al. 2012, ApJ, 759, L31
- Joly (1991) Joly, M. 1991, A&A, 242, 49
- Kalnajs (1975) Kalnajs, A. J. 1975, in La Dynamique des galaxies spirales, ed. L. Weliachew, 103
- Kaspi et al. (2000) Kaspi, S., Smith, P. S., Netzer, H., et al. 2000, ApJ, 533, 631
- Komossa (2008) Komossa, S. 2008, in Revista Mexicana de Astronomia y Astrofisica Conference Series, Vol. 32, Revista Mexicana de Astronomia y Astrofisica Conference Series, 86–92
- Komossa & Xu (2007) Komossa, S., & Xu, D. 2007, ApJ, 667, L33
- Kotilainen et al. (1998a) Kotilainen, J. K., Falomo, R., & Scarpa, R. 1998a, A&A, 332, 503
- Kotilainen et al. (1998b) —. 1998b, A&A, 336, 479
- Kriss (1994) Kriss, G. 1994, Astronomical Data Analysis Software and Systems, 3, 437
- León-Tavares et al. (2010) León-Tavares, J., Lobanov, A. P., Chavushyan, V. H., et al. 2010, ApJ, 715, 355
- León-Tavares et al. (2011a) León-Tavares, J., Valtaoja, E., Chavushyan, V. H., et al. 2011a, MNRAS, 411, 1127
- León-Tavares et al. (2012) León-Tavares, J., Valtaoja, E., Giommi, P., et al. 2012, ApJ, 754, 23
- León-Tavares et al. (2011b) León-Tavares, J., Valtaoja, E., Tornikoski, M., Lähteenmäki, A., & Nieppola, E. 2011b, A&A, 532, A146
- León-Tavares et al. (2013) León-Tavares, J., Chavushyan, V., Patiño-Álvarez, V., et al. 2013, ApJ, 763, L36
- Liu et al. (2010) Liu, H., Wang, J., Mao, Y., & Wei, J. 2010, ApJ, 715, L113
- Magorrian et al. (1998) Magorrian, J., Tremaine, S., Richstone, D., et al. 1998, AJ, 115, 2285
- Marziani et al. (2003) Marziani, P., Sulentic, J. W., Zamanov, R., et al. 2003, ApJS, 145, 199
- Marziani et al. (2001) Marziani, P., Sulentic, J. W., Zwitter, T., Dultzin-Hacyan, D., & Calvani, M. 2001, ApJ, 558, 553
- Mathur et al. (2012) Mathur, S., Fields, D., Peterson, B. M., & Grupe, D. 2012, ApJ, 754, 146
- Mathur et al. (2001) Mathur, S., Kuraszkiewicz, J., & Czerny, B. 2001, New A, 6, 321
- Miller et al. (1993) Miller, P., Rawlings, S., & Saunders, R. 1993, MNRAS, 263, 425
- Moffat (1969) Moffat, A. F. J. 1969, A&A, 3, 455
- Moran et al. (1996) Moran, E. C., Halpern, J. P., & Helfand, D. J. 1996, ApJS, 106, 341
- Nikołajuk et al. (2009) Nikołajuk, M., Czerny, B., & Gurynowicz, P. 2009, MNRAS, 394, 2141
- Nilsson et al. (2003) Nilsson, K., Pursimo, T., Heidt, J., et al. 2003, A&A, 400, 95
- Norman & Miley (1984) Norman, C., & Miley, G. 1984, A&A, 141, 85
- Ohta et al. (2007) Ohta, K., Aoki, K., Kawaguchi, T., & Kiuchi, G. 2007, ApJS, 169, 1
- Orban de Xivry et al. (2011) Orban de Xivry, G., Davies, R., Schartmann, M., et al. 2011, MNRAS, 417, 2721
- Osterbrock & Pogge (1985) Osterbrock, D. E., & Pogge, R. W. 1985, ApJ, 297, 166
- Paliya et al. (2014) Paliya, V. S., Sahayanathan, S., Parker, M. L., et al. 2014, ApJ, 789, 143
- Paliya et al. (2013) Paliya, V. S., Stalin, C. S., Kumar, B., et al. 2013, MNRAS, 428, 2450
- Patiño-Álvarez et al. (2013) Patiño-Álvarez, V., Chavushyan, V., León-Tavares, J., et al. 2013, arXiv:1303.1893, Fermi Symposium 2013
- Peng et al. (2002) Peng, C. Y., Ho, L. C., Impey, C. D., & Rix, H.-W. 2002, AJ, 124, 266
- Ponti et al. (2012) Ponti, G., Papadakis, I., Bianchi, S., et al. 2012, A&A, 542, A83
- Puerari et al. (2000) Puerari, I., Block, D. L., Elmegreen, B. G., Frogel, J. A., & Eskridge, P. B. 2000, A&A, 359, 932
- Puerari & Dottori (1992) Puerari, I., & Dottori, H. A. 1992, A&AS, 93, 469
- Ramos Almeida et al. (2012) Ramos Almeida, C., Bessiere, P. S., Tadhunter, C. N., et al. 2012, MNRAS, 419, 687
- Rodríguez-Ardila et al. (2000) Rodríguez-Ardila, A., Binette, L., Pastoriza, M. G., & Donzelli, C. J. 2000, ApJ, 538, 581
- Ryan et al. (2007) Ryan, C. J., De Robertis, M. M., Virani, S., Laor, A., & Dawson, P. C. 2007, ApJ, 654, 799
- Sani et al. (2010) Sani, E., Lutz, D., Risaliti, G., et al. 2010, MNRAS, 403, 1246
- Savchenko & Reshetnikov (2013) Savchenko, S. S., & Reshetnikov, V. P. 2013, MNRAS, 436, 1074
- Scarpa et al. (2000) Scarpa, R., Urry, C. M., Padovani, P., Calzetti, D., & O’Dowd, M. 2000, ApJ, 544, 258
- Schlafly & Finkbeiner (2011) Schlafly, E. F., & Finkbeiner, D. P. 2011, ApJ, 737, 103
- Sersic (1968) Sersic, J. L. 1968, Atlas de galaxias australes (ESO)
- Shapovalova et al. (2010a) Shapovalova, A. I., Popović, L. Č., Burenkov, A. N., et al. 2010a, A&A, 509, A106
- Shapovalova et al. (2010b) —. 2010b, A&A, 517, A42
- Sikora et al. (2007) Sikora, M., Stawarz, Ł., & Lasota, J.-P. 2007, ApJ, 658, 815
- Silk & Rees (1998) Silk, J., & Rees, M. J. 1998, A&A, 331, L1
- Struck-Marcell & Higdon (1993) Struck-Marcell, C., & Higdon, J. L. 1993, ApJ, 411, 108
- Tibolla et al. (2013) Tibolla, O., Kaufmann, S., Foschini, L., et al. 2013, ArXiv e-prints
- Toft et al. (2014) Toft, S., Smolcic, V., Magnelli, B., et al. 2014, ArXiv e-prints
- Torrealba et al. (2012) Torrealba, J., Chavushyan, V., Cruz-González, I., et al. 2012, Rev. Mexicana Astron. Astrofis., 48, 9
- Tremaine et al. (2002) Tremaine, S., Gebhardt, K., Bender, R., et al. 2002, ApJ, 574, 740
- van Breugel et al. (1984) van Breugel, W., Heckman, T., Butcher, H., & Miley, G. 1984, ApJ, 277, 82
- Veron et al. (1980) Veron, P., Lindblad, P. O., Zuiderwijk, E. J., Veron, M. P., & Adam, G. 1980, A&A, 87, 245
- Veron et al. (1981a) Veron, P., Veron, M. P., Bergeron, J., & Zuiderwijk, E. J. 1981a, A&A, 97, 71
- Veron et al. (1981b) Veron, P., Veron, M. P., & Zuiderwijk, E. J. 1981b, A&A, 102, 116
- Véron-Cetty et al. (2001) Véron-Cetty, M.-P., Véron, P., & Gonçalves, A. C. 2001, A&A, 372, 730
- Vestergaard & Peterson (2006) Vestergaard, M., & Peterson, B. M. 2006, ApJ, 641, 689
- Vika et al. (2012) Vika, M., Driver, S. P., Cameron, E., Kelvin, L., & Robotham, A. 2012, MNRAS, 419, 2264
- Wajima et al. (2014) Wajima, K., Fujisawa, K., Hayashida, M., et al. 2014, ApJ, 781, 75
- Yuan et al. (2008) Yuan, W., Zhou, H. Y., Komossa, S., et al. 2008, ApJ, 685, 801
- Zhou et al. (2006) Zhou, H., Wang, T., Yuan, W., et al. 2006, ApJS, 166, 128
- Zhou et al. (2007) —. 2007, ApJ, 658, L13
| Psf | Bulge | Disk | |||||||||||
|---|---|---|---|---|---|---|---|---|---|---|---|---|---|
| mag | mag | Re | mag | Rs | axis ratio | ||||||||
| [arcsec / kpc] | [mag arcsec-2] | [arcsec/kpc] | |||||||||||
| Model A | |||||||||||||
| (PSF+Bulge) | |||||||||||||
| 15.71 0.01 | 15.920.01 | 2.95 0.13 | 6.060.02 / 7.130.02 | 21.570.01 | 1.190.02 | ||||||||
| 15.78 0.01 | 15.130.01 | 2.650.07 | 4.660.03 / 5.480.03 | 20.210.01 | 1.230.03 | ||||||||
| 14.25 0.01 | 13.190.01 | 2.720.01 | 3.620.01 / 4.260.01 | 17.720.01 | 1.310.02 | ||||||||
| 12.48 0.04 | 12.000.01 | 2.870.01 | 2.700.01 / 3.180.01 | 15.900.01 | 1.290.01 | ||||||||
| Model B | |||||||||||||
| (PSF+Bulge+Disk) | |||||||||||||
| 15.710.01 | 18.020.02 | 1.280.14 | 0.810.02/0.950.02 | 19.290.04 | 16.380.02 | 3.220.02/3.790.02 | 0.890.01 | 1.200.01 | |||||
| 15.720.01 | 16.230.01 | 1.350.05 | 2.060.03/2.430.04 | 19.540.03 | 15.800.02 | 4.530.04/5.330.05 | 0.820.01 | 1.22 0.03 | |||||
| 14.180.01 | 14.650.01 | 0.880.01 | 1.250.01/1.480.01 | 16.890.01 | 13.690.01 | 2.860.01/3.360.01 | 0.940.01 | 1.300.02 | |||||
| 12.440.01 | 13.030.01 | 1.240.01 | 1.190.01/1.400.01 | 15.140.01 | 12.690.01 | 2.670.01/3.150.01 | 0.960.01 | 1.280.01 | |||||
Note. — We adopt Mpc-1 km s-1, and cosmology, which at z=0.061 of 1H 0323+342 yield a scale of 1.177 kpc arcsec. We compute errors for both models in an empirical way. The best fit parameters are taken as initial guesses and we repeat the fitting procedure 10 times, using different masks for each run. The masks vary in size and cover different objects and regions of the ringed arm structure. Then, we compute the mean and standard deviation for every parameter and those are shown above. The error associated to the values is the standard deviation uncertainty of the values obtained through the fitting procedure.
| M) | |||||
|---|---|---|---|---|---|
| Model | FWHM(H) | (5100 Å) | F(H) | (5100 Å) | L(H) |
| (km s-1) | (10-17 erg s-1 cm-2 Å-1) | (10-15 erg s-1 cm-2) | (log M⊙) | (log M⊙) | |
| (1) | (2) | (3) | (4) | (5) | (6) |
| a (1 Lorentzian) | 1301160 | 113.18.1 | 161.810.1 | 6.9 | 7.1 |
| b (3 Gaussians) | 1660190 | 91.05.8 | 163.310.3 | 7.1 | 7.3 |
Note. — The reported FWHM are corrected by instrumental broadening, as calculated by measuring the width of an emission line near H in the HeAr spectra. The FWHM reported for the 3 Gaussian model, is the one measured from the sum of the two Gaussians that represent the broad component. The uncertainty of the black hole mass estimates is dex.