A Parallax Distance to the Microquasar GRS 1915+105 and a Revised Estimate of its Black Hole Mass
Abstract
Using the Very Long Baseline Array, we have measured a trigonometric parallax for the microquasar GRS 1915+105, which contains a black hole and a K-giant companion. This yields a direct distance estimate of kpc and a revised estimate for the mass of the black hole of M⊙. GRS 1915+105 is at about the same distance as some H II regions and water masers associated with high-mass star formation in the Sagittarius spiral arm of the Galaxy. The absolute proper motion of GRS 1915+105 is mas y-1 and mas y-1 toward the east and north, respectively, which corresponds to a modest peculiar speed of km s-1 at the parallax distance, suggesting that the binary did not receive a large velocity kick when the black hole formed. On one observational epoch, GRS 1915+105 displayed superluminal motion along the direction of its approaching jet. Considering previous observations of jet motions, the jet in GRS 1915+105 can be modeled with a jet inclination to the line of sight of and a variable flow speed between and , which possibly indicates deceleration of the jet at distances from the black hole AU. Finally, using our measurements of distance and estimates of black hole mass and inclination, we provisionally confirm our earlier result that the black hole is spinning very rapidly.
1 Introduction
The Galactic microquasar, GRS 1915+105, is a low-mass X-ray binary containing a black hole and a K III companion (Greiner et al., 2001) with a 34-day orbital period. The companion overflows its Roche lobe and the system exhibits episodic superluminal radio jets (Mirabel & Rodríguez, 1994). The estimated nature of the companion (e.g., mass, luminosity, size) and the mass and spin of the black hole depend on the distance to the system, which is highly uncertain. A luminosity distance based on the spectral identification of the companion is hindered by the large extinction, mag (Chapuis & Corbel, 2004), and the uncertainties in stellar radius and surface brightness of the tidally-distorted secondary. Alternatively, a kinematic distance estimate would rely on the line-of-sight velocity of the system, assuming that the binary executes a circular orbit in the Galaxy. This is a weak assumption for a system that may be a Gyr old and whose velocity could have been significantly affected by mass ejection during the formation of the black hole.
Fender et al. (1999) determined an upper limit on distance of 12.5 kpc (95% confidence, based on the quoted limit of kpc) by observing approaching and receding jet motions and requiring that the bulk flow speed in the jet not exceed the speed of light. Absorption of the GRS 1915+105 continuum emission by interstellar hydrogen at 21-cm wavelength indicates significant opacity over km s-1(Mirabel & Rodríguez, 1994). This is consistent with GRS 1915+105 being more distant than the Galactic tangent point of 5.9 kpc at its Galactic longitude of , where peaks at 70 km s-1 for kpc and km s-1 (Reid et al., 2014). Thus, these two limits only constrain the distance of GRS 1915+105 to between 5.9 and 12.5 kpc. In order to obtain a solid distance measurement for GRS 1915+105, we undertook a series of observations with the National Radio Astronomy Observatory’s111The National Radio Astronomy Observatory is a facility of the National Science Foundation operated under cooperative agreement by Associated Universities, Inc. Very Long Baseline Array (VLBA) to measure a trigonometric parallax.
Unlike the black hole binaries V404 Cyg (Miller-Jones et al., 2009) and Cyg X-1 (Reid et al., 2011), for which measurements of trigonometric parallax were relatively straightforward, GRS 1915+105 is a difficult target for several reasons. Firstly, compact radio emission from the base of the jets, associated with the X-ray hard state, occurs only about 25% of the time. Secondly, when in the hard state, the source is typically weak, mJy at cm-wavelengths, and often falls below astrometrically useful flux densities of mJy. Owing to these difficulties, a long series of observations were required, as documented in Section 2. Thirdly, on some occasions, bright knots of radio emission propagate down the jets, leading to outlying data points when fitting for parallax and proper motion. Such behavior was clearly observed on one epoch, as described in Section 2.1. These data are interesting for studies of the jet, but cannot be used for parallax fitting. Finally, the apparent core position exhibits some “jitter” along the jet axis, probably owing to the production of low-level jet emission within our angular resolution of mas. This led us to fit for the parallax shifts with the data rotated parallel and perpendicular to the jet axis, instead of the standard right ascension and declination directions, in order to apply optimal weighting.
The parallax distance measurement of GRS 1915+105 is described in Section 2.2 and was accomplished in two steps: 1) measuring a relative parallax distance with respect to a Galactic water maser projected within 05 of GRS 1915+105 on the sky, and 2) measuring an absolute parallax distance for the water maser with respect to background quasars. In Section 3, we discuss the astrophysical implications of our astrometric results, while providing revised estimates of the jet parameters and the black hole’s mass and spin.
2 Observations & Results
In total, we observed GRS 1915+105 on 43 epochs at 22.235 GHz under VLBA programs BM257 and BR145. The source was detected ( mJy/beam) on 18 epochs. Seventeen detections are reported in Table 1 and analyzed for parallax and proper motion in Section 2.2. The remaining observation displayed a rapidly moving component and is discussed in Section 2.1
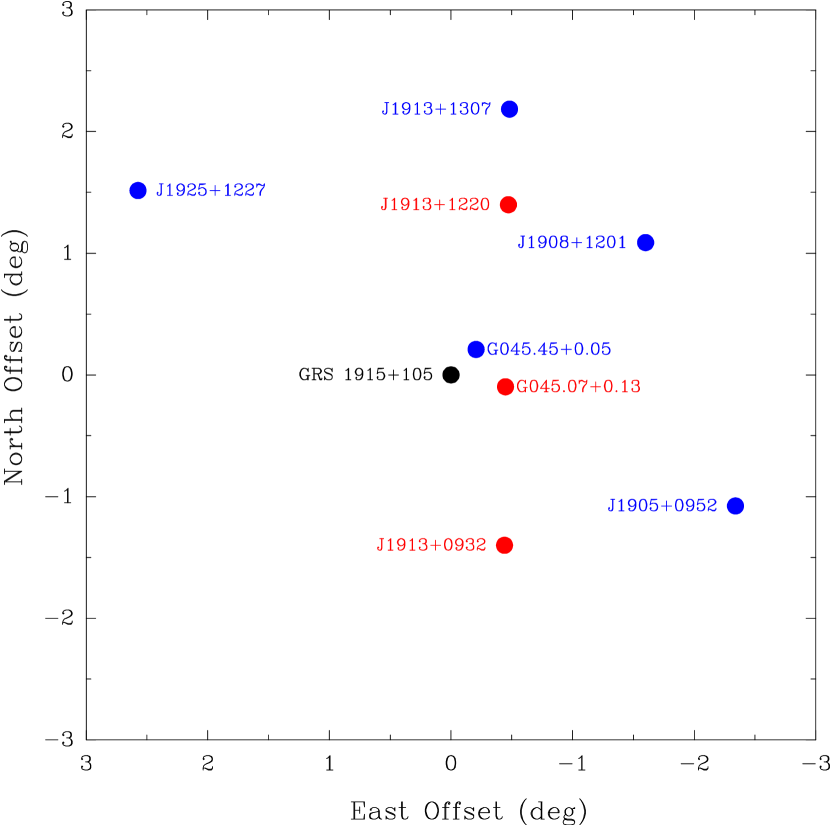
A Galactic water maser associated with a star forming region in the Sagittarius spiral arm of the Galaxy was used as the interferometer phase-reference (Wu et al., 2014). A typical observation sequence was G045.07+0.13, GRS 1915+105, G045.07+0.13, J1913+0932, G045.07+0.13, J1913+1220, switching sources every 20-30 seconds and repeating this sequence for a period of 12 minutes. The relative locations of these sources, as well as another water maser, G045.45+0.05, and the four quasars used to measure its parallax are shown in Fig. 1.
We recorded data at a rate of 512 Mbits per second with four intermediate frequency bands of 16 MHz in right and left circular polarizations, with the G045.07+0.13 maser centered in the second band. In order to improve astrometric accuracy, we inserted 3 or 4 half-hour long “geodetic blocks” designed to measure clock drifts and residual tropospheric delays not removed in the correlation process. Corrections for these residual delays were done in post-correlation calibration. Details of the calibration of astrometric VLBA data are given in Reid et al. (2009).
| Epoch | East Offset | North Offset | Brightness |
|---|---|---|---|
| (yr) | (mas) | (mas) | (mJy/beam) |
| 2008.333 | 35.2 | ||
| 2008.335 | 33.4 | ||
| 2009.220 | 4.6 | ||
| 2009.229 | 3.1 | ||
| 2009.733 | 3.3 | ||
| 2009.835 | 2.4 | ||
| 2009.843 | 1.1 | ||
| 2010.197 | 12.1 | ||
| 2010.329 | 10.1 | ||
| 2010.698 | 5.0 | ||
| 2010.810 | 3.2 | ||
| 2010.873 | 3.1 | ||
| 2011.862 | 20.6 | ||
| 2011.871 | 12.0 | ||
| 2013.019 | 3.7 | ||
| 2013.153 | 14.7 | ||
| 2013.255 | 3.7 |
Note. — Epochs of observation when GRS 1915+105 was detectable ( mJy), along with measured position offsets of GRS 1915+105 with respect to a G045.07+0.13 km s-1 maser spot (with J2000 positions for GRS 1915+105 of () and G045.07+0.13 of () used in the VLBA correlator) and the observed peak brightness of GRS 1915+105. Position errors are formal fitting uncertainties. Position offsets from epochs 2010.698 and 2010.873 were outliers and not used in the parallax fitting (see Section 2.2).
We used the maser emission at km s-1 as the interferometer phase reference. Power in this spectral channel of width 0.42 km s-1 came from two maser spots separated by about 6 mas. Over the course of the observations, one spot weakened and the other strengthened. This shifted the phase reference position over time. We imaged both spots and were able to measure the position of the originally brightest spot at all epochs. This served as the position reference for the parallax data. Calibrated VLBA data were imaged with the Astronomical Image Processing System (AIPS) task IMAGR. The brightness and position offsets of GRS 1915+105 (relative to the maser), measured by fitting elliptical Gaussian brightness distributions with the task JMFIT, are listed in Table 1.
2.1 Jet Motions in GRS 1915+105
On 2013 May 24, GRS 1915+105 was strongly variable and an image showed very complex structure extended over about 5 mas in the NW–SE direction. This orientation is similar to that of the jet seen on scales with interferometric imaging by Mirabel & Rodríguez (1994) using the VLA, on 250 mas scales by Fender et al. (1999) using the MERLIN array, and on 5–50 mas scales by Dhawan, Mirabel & Rodríquez (2000) using the VLBA, when GRS 1915+105 exhibited superluminal expansion. Since jet motion is expected to be of order a synthesized beam size per hour, we re-imaged the data from individual 20-min spans. We used the 8 continental antennas of the VLBA (excluding the very long baselines to the Mauna Kea antenna and the St. Croix antenna, which generally suffers from high water vapor opacity) to produce images. Owing to the limited interferometer (u,v)-coverage afforded by these “snap shot” images, we could only reliably measure the position of the peak emission, which we restricted to be within mas of the expected core position based on the parallax and proper motion fitting results (see Section 2.2). The position offsets, relative to the expected position of the core of GRS 1915+105, are shown in Fig. 2.
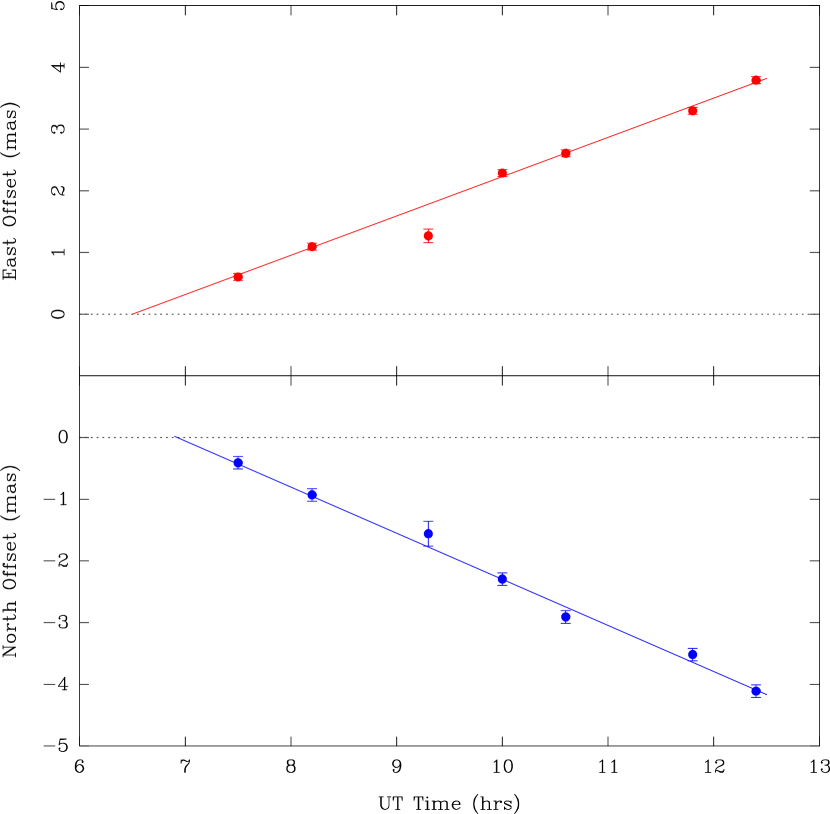
Both the eastward and northward offsets of the peak emission versus time display linear motion, with one apparent outlier at UT=9.3 hr. Removing the outlier and fitting a constant motion to these data yields mas d-1 toward east of north. Since, these positions were registered relative to the expected position of the core (black hole) of GRS 1915+105, the zero crossings should indicate the time of the expulsion of the radiating plasma. This occurs near UT 6.5 hr and 6.9 hr for the easterly and northerly measurements, respectively, suggesting expulsion at UT hr.
2.2 Parallax Distance of GRS 1915+105
Parallax measurements at centimeter wavelengths with very long baseline interferometry involve rapid switching between the target source and one or more background quasars. This serves two purposes: extending the coherence time of the interferometer by removing short term (minute) fluctuations of propagation delay through the troposphere (usually caused by variable water vapor) and providing a stationary position reference for the parallax fitting (Reid & Honma, 2014). While the background quasar can serve both purposes, one can use a different source to extend coherence times. For GRS 1915+105 we used an unusually stable Galactic water maser, G045.07+0.13, which was fortuitously close on the sky, projected within . Switching between these two sources provided excellent phase calibration and relative parallax data.
Preliminary fitting for a relative parallax and proper motion to the eastward and northward offsets revealed two significant ( in each coordinate) outliers at epochs 2010.698 and 2010.873. For each case, compared to the previous epoch’s position, these points were offset along a position angle of east of north, suggesting that low-level jet activity was affecting the apparent core position. This was dramatically confirmed on 2013 May 24 when a superluminal jet component moving along position angle dominated the emission (see Section 2.1).
Generally for VLBI measurements, formal position precision does not fully represent astrometric accuracy. Typically, slowly varying (hours) uncompensated differences in tropospheric propagation delays among antennas and sometimes structural changes in the radio sources among epochs lead to degraded position accuracy (Reid & Honma, 2014). In order to account for these effects, one generally adds “error floors” in quadrature with the formal measurement uncertainties in both coordinates when fitting for parallax. For the GRS 1915+105 data, owing to the likelihood of increased “jitter” in the apparent position of the core 222Note that that the expected “jitter” in the position of the black hole owing to its 33.8 day orbit about the center of mass of the binary is expected to be very small: mas along the jet axis at some epochs, we rotated the east and north offset data by counter-clockwise on the sky, orienting the approaching jet toward the negative y-axis. The rotation angle represents an average jet direction for our observations, based on the measured motion in Section 2.1, and those of Mirabel & Rodríguez (1994) and Fender et al. (1999).
Rotating the data allows us to fit for parallax and proper motion with data perpendicular and parallel to the jet. We can then add error-floor values in quadrature with the formal measurement uncertainties and adjust their values to achieve component chi-squares per degree of freedom () near unity in each coordinate. In this way, the more jittery data parallel to the jet receives a larger total uncertainty and is appropriately down-weighted compared to the more stable data perpendicular to the jet. After removing the two outliers discussed above, we achieved for each component of the data with error floors of 0.09 and 0.19 mas for the position residuals perpendicular and parallel to the jet, respectively. Given the (expected) larger uncertainties in the parallel compared to the perpendicular data, and the shape of the parallax ellipse which has a smaller amplitude in the parallel compared to the perpendicular direction, the parallax for GRS 1915+105 is nearly totally constrained by the perpendicular-to-the-jet data.
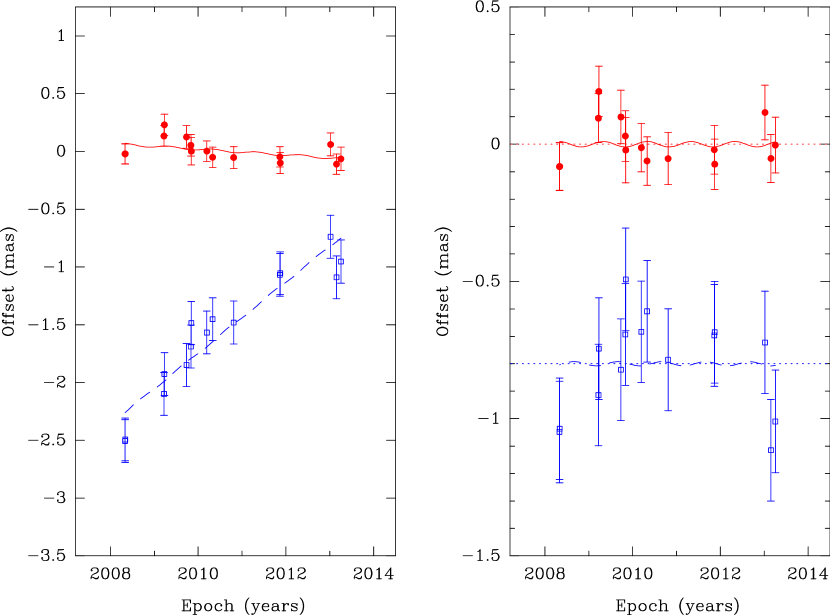
Fitting for the parallax of GRS 1915+105 relative to the Galactic water maser source G045.07+0.13, with no prior constraints on distance, gives mas, which places both sources at nearly the same distance. Also, the small relative proper motion of 0.3 mas y-1 is consistent with a similar distance. Fig. 3 displays the relative parallax and proper motion for both the data and the model. Changing the position angle rotation of the data by changes the relative parallax by about mas. Thus, the relative parallax is not very sensitive to the adopted orientation of the jet axis.
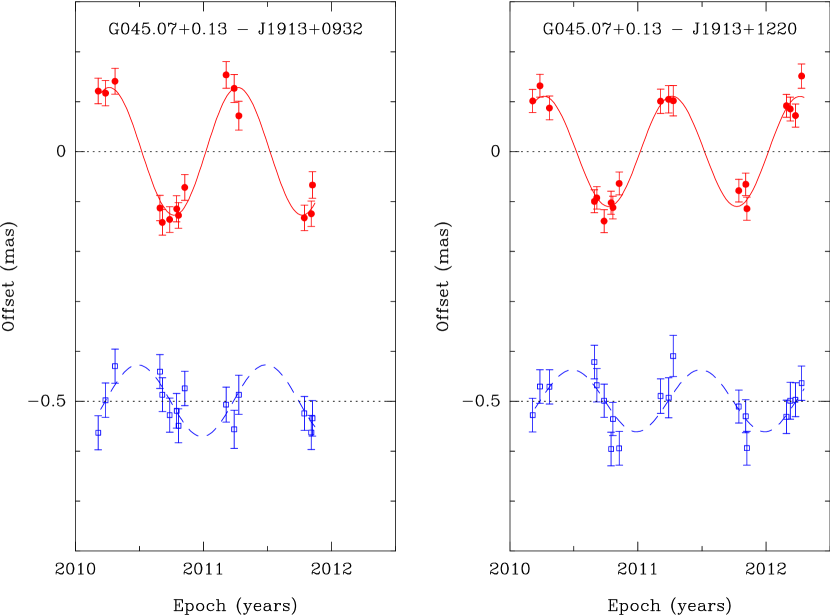
In order to obtain an absolute parallax, we also switched between the water maser G045.07+0.13 and two quasars, J1913+0932 and J1913+1220, during the same observations as for GRS 1915+105. These data were originally presented by Wu et al. (2014), who reported a parallax for G045.07+0.13 of mas measured relative to J1913+0932. The parallax fitting for G045.07+0.13 relative to J1913+1220 revealed small systematic deviations from the model parallax and proper motion. These deviations could be removed by adding position acceleration parameters ( mas y-2) and gave a parallax estimate of mas. We reproduce the parallax fit results of Wu et al. in Fig. 4. Wu et al. chose to discard this alternative parallax estimate. Since the two quasars symmetrically straddle G045.07+0.13 on the sky (see Fig. 1), and hence would well cancel most sources of systematic error, we instead adopt the unweighted average of the two results. This yields a parallax for the water maser of mas.
As shown in Fig. 1, there is a second Galactic water maser, G045.45+0.05, projected within ( pc) on the sky of G045.07+0.13. G045.45+0.05 has a similar LSR velocity as G045.07+0.13, and both masers can be confidently associated with the Sagittarius spiral arm of the Milky Way, based on identification of the masers with a continuous arc of CO emission on Galactic longitude-velocity plots (Wu et al., 2014). Thus, both masers are likely associated with the same giant molecular cloud (or adjacent clouds in the same spiral arm) and are very likely within about 100 pc of each other. The parallax of G045.45+0.05 is mas, measured with respect to the four quasars shown in Fig. 1, which then provides an independent check on the distance to G045.07+0.13. As such, we confidently adopt the parallax of G045.07+0.13 of mas, corresponding to a distance of kpc to this water maser.
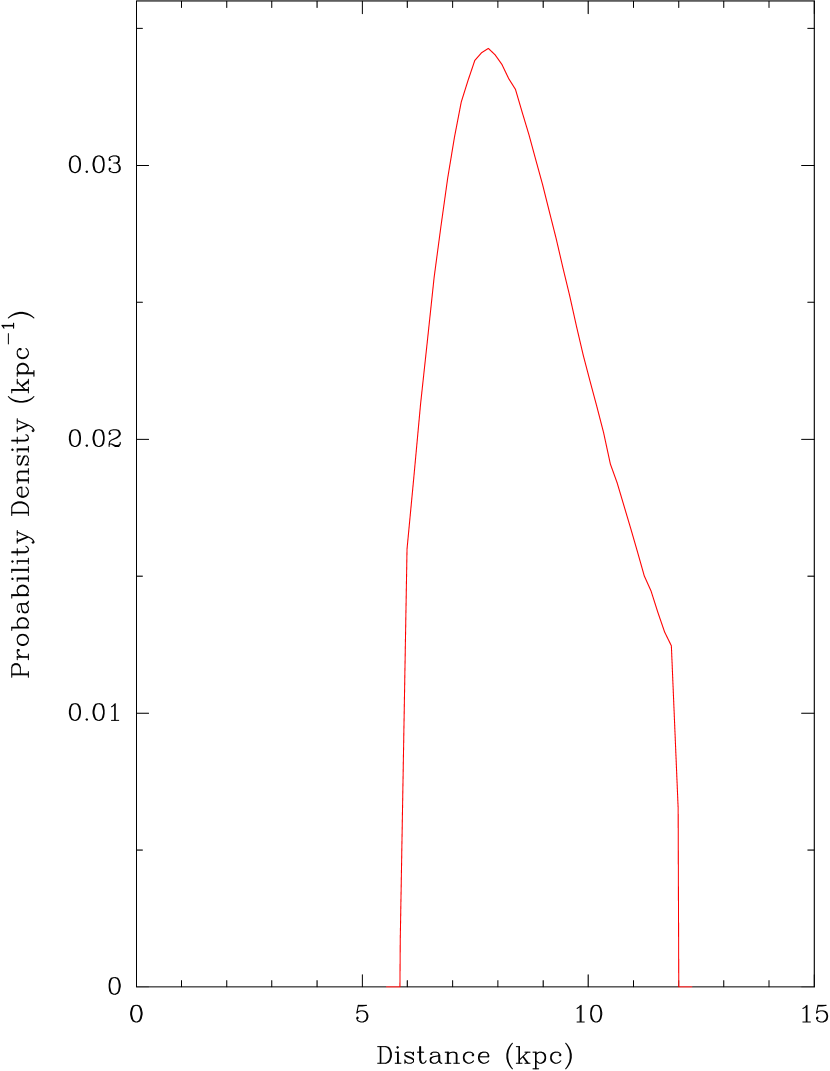
For our final estimate of the distance to GRS 1915+105, we fit the data with a Bayesian Markov chain Monte Carlo (MCMC) approach using the Metropolis-Hastings algorithm to accept or reject trials. We adopted as prior information two constraints on distance (): 1) greater than the Galactic tangent point distance of 5.9 kpc, as discussed in Section 1; and 2) less than 12.0 kpc, where the observed jet motions would require bulk plasma flow speeds exceeding that of light. Rather than use the inclination-dependent constraint of Fender et al. (1999) of 12.5 kpc (95% confidence), here we adopt the slightly stronger and more direct (inclination independent) limit given by , where is the speed of light and and are the apparent angular speeds of jet components in the approaching and receding directions. Thus, we adopt kpc with uniform probability as prior information when fitting the data.
Traditionally, when fitting relative position as a function of time, one parameterizes the model with a parallax parameter (and proper motion terms). Owing to the inverse relation between distance and parallax, , a flat distance prior transforms to a quadratic parallax prior: (where for kpc and zero elsewhere). Then after fitting, the posteriori probability density function (PDF) for parallax should be transformed to the desired distance PDF, rescaling by (in order to account for the non-linear stretching of with decreasing ). This latter scaling is important only if the parallax uncertainty is a significant fraction (e.g., %) of the parallax. Alternatively, one can fit the data with a model parameterized with distance instead of parallax. This is more convenient when applying prior information on distance and gives the desired distance PDF directly without rescaling. Of course, both approaches are equivalent.
We adopted the distance parameterization for our final fits and obtain the posteriori PDF for the distance of GRS 1915+105 shown in Fig. 5. The peak of the PDF is at 7.8 kpc, and the expectation value for distance is 8.6 kpc, reflecting the asymmetric tail of the PDF toward larger distances. The minimum-width 68% confidence interval is 7.0 to 10.6 kpc, which includes the small contribution from the distance uncertainty of the maser G045.07+0.13. Adopting the expectation value as the best estimate of distance, we therefore find GRS 1915+105 at a distance of kpc.
2.3 Proper Motion of GRS 1915+105
After removing the effects of the parallax of GRS 1915+105, we fit the position offsets of GRS 1915+105 with respect to J1913+0932 (without rotating them to align with the jet axis) to estimate the proper motion of GRS 1915+105 in the easterly and northerly directions to be mas y-1 and mas y-1. This compares reasonably with the measurement of mas y-1 and mas y-1 from 10 years of monitoring with the VLBA by Dhawan et al. (2007).
We revisited the systemic velocity of the system whose accuracy, as reported in Steeghs et al. (2013), is limited by the published radial velocity values of the template stars used. We retrieved several archival spectra of one of our templates, HD 176354, which was observed with the high-resolution HARPS spectrograph at ESO. Four observations that span four years show a very stable velocity for this template of km s-1. This translates into a refined heliocentric systemic velocity for GRS 1915+105 of km s-1. Adopting this heliocentric velocity of the GRS 1915+105 binary completes the 3-dimensional velocity information.
Using the Galactic and Solar Motion parameters from Reid et al. (2014) ( kpc, km s-1, km s-1), we calculate the peculiar motion of GRS 1915+105 with respect to a circular Galactic orbit. We find (,,) = (,,) km s-1, where is toward the Galactic center at the location of GRS 1915+105, is in the direction of Galactic rotation, and is toward the north Galactic pole. This translates to a non-circular (peculiar) speed of km s-1 and a 95% confidence upper limit of 61 km s-1.
3 Discussion
3.1 Jet Parameters
The Lorentz factors of ballistic jets from black hole microquasars are generally assumed to be in the vicinity (Fender et al., 2004; Fender, 2006), although there is a dearth of strong constraints. Specifically, the bulk of observational data provide only lower limits on the Lorentz factor, when derived directly from kinematic measurements and flux ratios. Generally, these lower limits fall near (Steiner & McClintock, 2012a; Steiner, McClintock & Reid, 2012b; Fender et al., 2004). As pointed out by Fender (2003), proper motion data are frequently unable to place significant upper bounds on . This is due to the strong, nonlinear degeneracy between and distance, particularly when is large and the distance estimate approaches the maximum limit, , at which . Only when is relatively modest and the distance is well-constrained below can the Lorenz factor be reliably bounded from above via kinematic data.
Although direct measurements provide only limited upper bounds for , there are indirect arguments which suggest that Lorentz factors are modest, usually , e.g., based on observations of radio-X-ray coupling (Fender, 2006) and of the deceleration of jets at late times as they expand (Miller-Jones, Fender & Nakar, 2006). Alternatively, it has been argued that microquasar jets may have , based on observations of very narrow jet opening angles and the assumption that the jet plasma expands freely at nearly the speed of light (Miller-Jones, Fender & Nakar, 2006; Miller-Jones et al., 2007). However, large values of may not be required to explain narrow jets if they are confined externally; indeed, Miller-Jones et al. have provided evidence for such confinement in some systems.
During one observation (see Section 2.1), we observed a motion of mas d-1 along a position angle of , consistent with the approaching jet in GRS 1915+105. At the parallax distance of 8.6 kpc, this corresponds to , where is the speed of light, making this source just marginally superluminal. The magnitude of the motion we measured agrees (exactly) with that measured by Fender et al. (1999) for the approaching jet of mas d-1, but our position angle differs significantly from their value of , estimated from the orientation on the sky of multiple jet components separated by mas in 1997 November. Our measured motion also agrees with the average of those of Dhawan, Mirabel & Rodríquez (2000) of mas d-1, but differs from their average position angle of However, the magnitude of our measured motion is greater than the average of mas d-1 toward for the approaching jet observed from components separated by mas by Mirabel & Rodríguez (1994) and Rodríguez & Mirabel (1999) in 1994/1995. These jet parameters are summarized in Table 2.
| Date | Angular Scale | P.A. | Reference | |
|---|---|---|---|---|
| (mas) | (deg) | (mas d-1) | ||
| 1994/1995 | 1000 | Rodríguez & Mirabel (1999) | ||
| 1997 November | 300 | Fender et al. (1999) | ||
| 1997 October | 50 | Dhawan, Mirabel & Rodríquez (2000) | ||
| 1998 May | 50 | Dhawan, Mirabel & Rodríquez (2000) | ||
| 2013 May | 5 | this paper |
Note. — Column 1 gives the approximate date of the observations; column 2 indicates the characteristic angular scale of the observed jet; columns 3 and 4 give the position angle (east of north) and the apparent proper motion of the approaching jet components. Values from Rodríguez & Mirabel (1999) are variance weighted means of 5 measurements listed in their Table 2. The uncertainty in the P.A. of the jet for the Fender et al. (1999) observation is our estimate. Values from Dhawan, Mirabel & Rodríquez (2000) are for observations where moving ejecta are seen.
Combining the measurements of the motion of the approaching and receding jet components with the source distance allows one to calculate the inclination angle of the jet from the line of sight, , and the bulk flow speed in the jet, , in units of the speed of light (Fender et al., 1999). Using the parallax distance of kpc (Section 2.2) and the apparent speeds of the approaching ( mas y-1) and receding ( mas y-1) jet components from Fender et al. , we find degrees and . This constrains the Lorentz factor to have values between 1.6 and 1.9.
There are now measurements of jet orientation and bulk flow speed over a wide range of angular scales for GRS 1915+105 (Table 2). Clearly the jet appears to bend through a position angle of 20∘ on the sky between scales of 5 mas (40 AU) and 10 (0.04 pc) from the black hole. The apparent speed of the approaching jet was the same for our observations and that of Fender et al. (1999). However, Rodríguez & Mirabel (1999) measured lower apparent speeds for both the approaching and receding jets compared to Fender et al. (see Table 2). While both jet orientation and internal flow speed can affect apparent motion, the ratio of approaching to receding motions measured by Rodríguez & Mirabel and Fender et al. are similar and most readily explained with a nearly constant inclination of , but with different internal flow speeds of and , respectively. Therefore, we conclude that either the jet bends and decelerates between radii of 0.01 to 0.04 pc, and/or plasma is ejected with different speeds at different times.
3.2 Black Hole Mass
Our parallax distance of kpc is lower than the value of 11 kpc often adopted for GRS 1915+105. However, it is consistent with the estimate of kpc of Zdziarski (2014), which is based on a relation between jet power and luminosity. Distance directly impacts estimates of the black hole mass , based on orbital period and companion radial velocity measurements, which constrain . Since the inclination of the system (), as inferred from the apparent speeds of the approaching () and receding () radio jets, is distance dependent (via ), a lower distance leads to a smaller binary inclination and a higher mass.
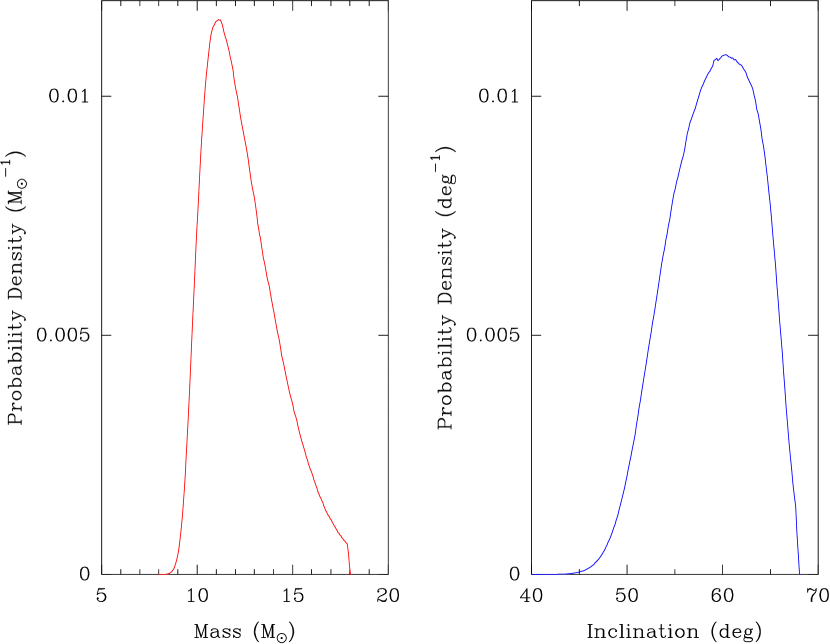
Steeghs et al. (2013) assumed a uniform distance prior of kpc (and a direct relation between distance and inclination, which did not incorporate uncertainty in the apparent jet motions), leading to an estimate of M⊙. In order to quantify the impact of our distance on the estimate of black hole mass, we revisited the Monte-Carlo simulations of Steeghs et al. and used our parallax distance PDF (see Fig. 5) as prior information. Each trial distance was combined with a trial for the observed jet velocity, based on the values and uncertainties of Fender et al. (1999), to calculate the implied inclination. This inclination was then combined with the spectroscopic parameters to calculate a black hole mass, contributing to the posteriori mass distribution. The resulting mass and inclination distribution functions are shown in Fig. 6. Both PDFs are significantly asymmetric, with extended tails towards higher mass and lower inclination. The peak of the inclination PDF is at 60∘ with an expectation value of 59∘ and a minimum-width 68% confidence interval of 55∘to 64∘. The peak of the mass PDF is at 11.2 M⊙ with an expectation value of 12.4 M⊙ and a minimum-width 68% confidence interval of 10.5 to 14.3 M⊙, suggesting a slightly higher mass than quoted in Steeghs et al.
Concerning X-ray luminosity, we note that our 8.6 kpc distance estimate deflates claims for extreme values (e.g., for an assumed distance of kpc by Done, Wardziński & Gierliński, 2004) and indicates that the maximum luminosity of GRS 1915+105 is at or near the Eddington limit.
3.3 Black Hole Spin
McClintock et al. (2006) estimated the dimensionless spin parameter 333Spin is usually expressed in terms of the dimensionless spin parameter , where and are the angular momentum and mass of the black hole, respectively, and , , for the black hole in GRS 1915+105 using the continuum-fitting method (McClintock et al., 2013) and a sample of seven selected spectra. In applying this method, one fits a thermal continuum spectrum to the thin disk model of Novikov & Thorne (1973); the key parameter is the radius of the inner edge of the accretion disk, assumed to be the innermost stable circular orbit for a black hole, which is directly related to and . The continuum-fitting method relies upon having independent and accurate estimates of distance, the black hole mass, and the inclination of its spin axis to the line of sight. McClintock et al. (2006) assumed a distance of 11 kpc and adopted M⊙ and , which yielded an extreme value for the spin parameter of .
Using our improved constraints on , and , we present a preliminary analysis for the spin of GRS 1915+105 (details will appear in a forthcoming paper). We have analyzed a large sample of RXTE spectra obtained with the PCU-2 detector, for which the quality of the data calibration has been significantly enhanced using the tool pcacorr (Garcia et al., 2014). We modeled the spectra using the relativistic disk model kerrbb2 (McClintock et al., 2006; Li et al., 2005; Davis & Hubeny, 2006) and a cutoff Compton power-law component simplcut, a variant of simpl (Steiner et al., 2009b). For a given set of values of , and , a subset of the data is selected that meets standard criteria (e.g., Steiner et al. 2011): goodness of fit (), low-to-moderate luminosity (), and a dominant thermal component with scattering fraction % (Steiner et al., 2009a). The size of the data sample, selected over the broad grid of values of , and , ranges from 8 to 167 spectra. (The luminosity criterion, based on the values of , and , determines the number of selected spectra.) For each set of parameters, a weighted mean value of spin is computed. Our preliminary estimate is , where the uncertainty is statistical only. Our result is consistent with the original estimate of McClintock et al. (2006), but it is now based firmly on a parallax measurement of distance and a much improved estimate of the black hole’s mass. Including sources of systematic uncertainty (Steiner et al., 2011), we estimate at confidence.
3.4 Galactic Environment and Peculiar Motion
Rodríguez & Mirabel (1998) and Chaty et al. (2001) mapped a field of centered near GRS 1915+105 at cm-wavelengths and found two H II regions (IRAS 19132+1035 and IRAS 19124+1106) symmetrically offset by about GRS 1915+105 along a position angle of about (our measurement from their published figures). They also found a nonthermal “trail” of emission near IRAS 19132+1035 along a position angle of about , which points back toward GRS 1915+105. However, since the H II regions have (far) kinematic distances between about 6 and 8 kpc, and they assumed a distance of 12.5 kpc for GRS 1915+105, Rodríguez & Mirabel reluctantly concluded that these sources were only a chance projection. However, our near-zero parallax of GRS 1915+105 relative to G045.07+0.13, and the likely association of the H II regions (IRAS 19132+1035 and IRAS 19124+1106) and the water masers (G045.07+0.13 and G045.45+0.05) with massive star formation in the Sagittarius spiral arm of the Galaxy (Wu et al., 2014), now suggests that most or all of these sources are spatially related. In this case, the nonthermal trail of emission from IRAS 19132+1035 pointing toward GRS 1915+105 could indeed be related to its jet emission, as modeled by Kaiser et al. (2004).
The peculiar velocity components for GRS 1915+105 estimated in Section 2.3 are relatively modest and consistent with an old stellar system that has orbited the Galaxy many times, having responded to random gravitational perturbations from encounters with spiral arms and giant molecular clouds, and acquired a peculiar velocity of 20-30 km s-1 as observed. This suggests that the GRS 1915+105 binary system did not receive a large velocity “kick,” owing to mass loss from the primary as it evolved and became a black hole.
JFS was supported by NASA Hubble Fellowship grant HST-HF-51315.01, and the work of JEM was supported in part by NASA grant NNX11AD08G.
Facilities: VLBA
References
- Chapuis & Corbel (2004) Chapuis, C. & Corbel, S. 2004, A&A, 414, 659
- Chaty et al. (2001) Chaty, S., Rodrǵuez, L. F., Mirabel, I. F. et al. 2001, A&A, 366, 1035
- Davis & Hubeny (2006) Davis, S. W. & Hubeny, I. 2006, ApJS, 164, 530
- Dhawan, Mirabel & Rodríquez (2000) Dhawan, V., Mirabel, I. F. & Rodríguez, L. F. 2000, ApJ, 543, 373
- Dhawan et al. (2007) Dhawan, V., Mirabel, I. F., Ribó, M. & Rodrigues, I. 2007, ApJ, 668, 430
- Done, Wardziński & Gierliński (2004) Done, C., Wardziński, G. & Gierliński, M. 2004, MNRAS, 349, 393
- Garcia et al. (2014) Garcia, J., McClintock, J. E., Steiner, J. F., Remillard, R. A., & Grinberg, V. 2014, to appear in ApJ (arXiv:1408:3607 [astro-ph.HE])
- Greiner et al. (2001) Greiner, J., Cuby, J. G., McCaughrean, M. J., Castro-Tirado, A. J. & Mennickent, R. E. 2001, A&A, 373, L37
- Fender et al. (1999) Fender, R. P., Garrington, S. T., McKay, D. J. et al. 1999, MNRAS,304, 865
- Fender (2003) Fender, R. P. 2003, MNRAS, 340, 1353
- Fender et al. (2004) Fender, R. P., Belloni, T. M., & Gallo, E. 2004, MNRAS, 355, 1105
- Fender (2006) Fender, R. P. 2006, in “Compact stellar X-ray sources”, Edited by Walter Lewin & Michiel van der Klis. Cambridge Astrophysics Series, No. 39. Cambridge, UK: Cambridge University Press, p381
- Kaiser et al. (2004) Kaiser, C. R., Gunn, K. f., Brocksopp, C. & Sokoloski, J. L. 2004, ApJ, 612, 332
- Li et al. (2005) Li, L.-X., Zimmerman, E. R., Narayan, R. & McClintock, J. E. 2005, ApJS, 157, 335
- McClintock et al. (2006) McClintock, J. E., Shafee, R., Narayan, R., Remillard, R. A., Davis, S. W., & Li, L.-X. 2006, ApJ, 652, 518
- McClintock et al. (2013) McClintock, J. E., Narayan, R., & Steiner, J. F. 2013, Space Sci. Rev., 73
- Miller-Jones, Fender & Nakar (2006) Miller-Jones, J. C. A., Fender, R. P., & Nakar, E. 2006, MNRAS, 367, 1432
- Miller-Jones et al. (2007) Miller-Jones, J. C. A., Rupen, M. P., Fender, R. P., et al. 2007, MNRAS, 375, 1087
- Miller-Jones et al. (2009) Miller-Jones, J. C. A., Jonker, P. G., Dhawan, V., et al. 2009, ApJ, 706, L230
- Mirabel & Rodríguez (1994) Mirabel, I. F. & Rodríguez, L. F. 1994, Nature, 371, 46
- Novikov & Thorne (1973) Novikov, I. D., & Thorne, K. S. 1973, Black Holes (Les Astres Occlus), 343
- Reid et al. (2009) Reid, M. J., Menten, K. M., Brunthaler, A., Zheng, X. W., Moscadelli, L. & Xu, Y. 2009, ApJ, 693, 397
- Reid et al. (2011) Reid, M. J., McClintock, J. E., Narayan, R., Gou, L., Remillard, R. A. & Orosz, J. A. 2011, ApJ, 742, 83
- Reid & Honma (2014) Reid, M. J. & Honma, M. 2014, to appear in ARA&A (arXiv1312.2871)
- Reid et al. (2014) Reid, M. J., Menten, K. M., Brunthaler, A., et al. 2014, ApJ, 783, 130
- Rodríguez & Mirabel (1998) Rodríguez, L. F. & Mirabel, I. F. 1998, A&A, 340, L47
- Rodríguez & Mirabel (1999) Rodríguez, L. F. & Mirabel, I. F. 1999, ApJ, 511, 398
- Steeghs et al. (2013) Steeghs, D., McClintock, J. E., Parson, S. G., Reid, M. J., Littlefair, S. & Dhillon, V. S. 2013, ApJ, 768, 185
- Steiner et al. (2009a) Steiner, J. F., McClintock, J. E., Remillard, R. A., Narayan, R., & Gou , L. J. 2009a, ApJ, 701, L83
- Steiner et al. (2009b) Steiner, J. F., Narayan, R., McClintock, J. E., & Ebisawa, K. 2009b, PASP, 121, 1279
- Steiner et al. (2011) Steiner, J. F., Reis, R. C., McClintock, J. E., Narayan, R., Remillard , R. A., Orosz , J. A., Gou, L., Fabian, A. C., & Torres, M. A. P. 2011, MNRAS, 416, 941
- Steiner & McClintock (2012a) Steiner, J. F., & McClintock, J. E. 2012, ApJ, 745, 136
- Steiner, McClintock & Reid (2012b) Steiner, J. F., McClintock, J. E. & Reid, M. J. 2012, ApJ, 745, L7
- Wu et al. (2014) Wu, Y., Sato, M., Reid, M. J., et al. 2014, A&A, 566, 17
- Zdziarski (2014) Zdziarski, A. A. 2014, MNRAS, 444, 1113