Asteroseismology of OB stars with hundreds of single snapshot
spectra
(and a few time-series of selected targets)
Abstract
Imagine we could do asteroseismology of large samples of OB-type stars by using just one spectrum per target. That would be great! But this is probably a crazy and stupid idea. Or maybe not. Maybe we have the possibility to open a new window to investigate stellar oscillations in massive stars that has been in front of us for many years, but has not attracted very much our attention: the characterization and understanding of the so-called macroturbulent broadening in OB-type stars.
keywords:
stars: early-type, stars: oscillations (including pulsations), line: profiles, techniques: spectroscopic1 Introduction
1.1 From macroturbulent broadening to pulsations (a bit of context)
First references to macroturbulent broadening in O-type stars and early-B supergiants can be found in Struve (1952), Slettebak (1956), Conti & Ebbets (1977), Penny (1996), and Howarth et al. (1997). Based on the lack of this type of stars with sharp absorption lines, these authors proposed that rotation was not the only broadening mechanism shaping their line-profiles. This hypothesis was definitely confirmed with the advent of high-quality spectroscopic observations and its analysis by means of adequate techniques (e.g., Ryans et al. 2002; Simón-Díaz & Herrero 2007, 2014).
Modern measurements of the non-rotational broadening component soon allowed to discard that it was produced by any type of large scale turbulent motion (Simón-Díaz et al. 2010). In this context, Aerts et al. (2009) revived an alternative scenario to explain its physical origin: the pulsational hypothesis.
1.2 The pulsational view of macroturbulent broadening (and vice versa)
The basic idea proposed by Aerts et al. (also previously indicated by Lucy 1976, and Howarth 2004) is that the collective pulsational velocity broadening due to gravity modes could be a viable physical explanation for macroturbulence in massive stars. The presence of an important (variable) pulsational broadening component is firmly established in B dwarfs and giants located in the -Cep and SPB instability domains (e.g., Aerts et al. 2014, and references therein); however, the macroturbulent-pulsational broadening connection in O-type stars and B supergiants (B Sgs), located in a region of the HR diagram which to-date is (by far) less explored and understood from an asteroseismic point of view, required further (observational) confirmation.
As discussed by Simón-Díaz et al. (2012), this hypothesis might also open the possibility to use macroturbulent broadening as a spectroscopic indicator of the occurrence of a certain type of stellar oscillations in massive stars. Obviously, this alternative strategy will never be able to compete with a detailed asteroseismic study; however, if at some point the macroturbulent – pulsational broadening connection is confirmed, this spectroscopic feature could become a cheap, single-snapshot way to detect and investigate pulsations in massive stars from a complementary perspective. Reward may be juicy, worth a shot!
1.3 The macro-pulsa project
Motivated by the characterization of the macroturbulent broadening in the whole O and B-type star domain, and the investigation of its postulated pulsational origin, we have compiled during the last 6 years a large high-resolution spectroscopic dataset comprising more than 3500 spectra of about 500 Galactic O4-B9 stars (including all luminosity classes). In this talk I highlight the most important results obtained to-date in this context from the exploitation of this unique spectroscopic dataset.
2 Line-broadening in OB stars: a single-snapshot overview
2.1 Observations, methods, and some results
The spectroscopic observations are drawn from the IACOB spectroscopic database of Northern Galactic OB star. Last described in Simón-Díaz & Herrero (2014, SDH14), the database now also include new111The IACOB database initially comprised FIES@NOT spectra of bright O- and early B-type stars. Given the similar capabilities and performance of HERMES@MERCATOR, we have decided to join together the IACOB spectra with those gathered as part of the IACOB-sweG (P.I. Negueruela) and macro-pulsa projects (P.I. Simón-Díaz), mainly using HERMES. HERMES spectra of bright B2 – B9 stars. We have discarded from the initial sample all stars detected as SBx (x2) and applied the methodology described in SDH14 to disentangle the rotational ( sin ) and macroturbulent (, using a radial-tangential prescription) broadening components from the O iii5592, Si iii4552, Mg ii4481 or C ii4267 line-profiles. A first estimation of the effective temperature (Teff) and gravity (log ) in the O- and B-star samples was obtained by means of updated versions of the grid-based automatized tools described in Simón-Díaz et al. (2011) and Castro et al. (2012), respectively.
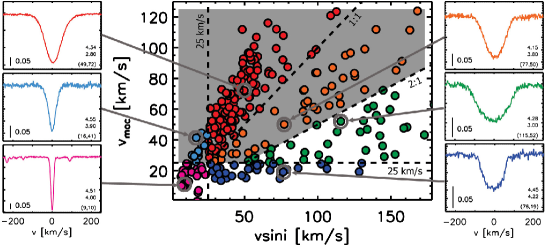
Fig. 1 summarizes the results of the line-broadening analysis of our final sample in the sin – diagram. Stars with sin 180 km s-1 are excluded from this discussion (see SDH14). We differentiate six regions in the diagram depending of the relative contribution of the rotational and macroturbulent broadenings to the line-profile. The most important result are (1) the strong correlation found in stars with sin , and (2) that stars with similar ( sin ,) combinations present almost identical profiles independently of their spectral type and luminosity class.
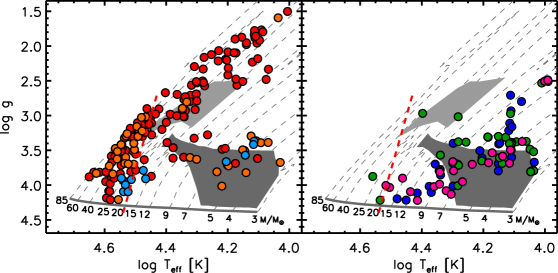
Stars with and without a clear macroturbulent broadening component (the former grouped in the shadowed gray region in Fig. 1) are located separately in the log Teff – log diagram in Fig. 2. The two diagrams are complemented with state-of-the-art evolutionary tracks and computations of high-order g-mode instability domains. Interestingly, there is a clear separation between the regions in the HR diagram where the stars with/without an important contribution of the macroturbulent broadening are located. However, there does not seem to be any clear correlation between these regions and the predicted instability domains for high order g-modes. Especially challenging for the pulsational hypothesis (in terms of g-modes) are the O-stars and the late-B Sgs.
3 Macroturbulent broadening and line-profile variability
3.1 Observations, methods, and some results
During the last 6 years we have been compiling spectroscopic time-series (with both FIES and HERMES) of a selected a subsample of 10 O stars and 11 B Sgs. All targets (except three: one O-dwarf, one B-dwarf, and one late-B Sg) were selected as having a dominant macroturbulent broadening component. For a few of them we already have more than 150 spectra, for the rest we count on a few dozens of spectra. The main bulk of the observations are characterized by a cadence of 4-8 spectra per night separated by 0.5-1.5 h. The typical exposure time is between a few seconds and 15 min. The length of each separated run is typically a few nights (being 10 nights the longest one). We are investigating line-profile variability (LPV) using the moment method (Aerts et al. 1992), and line-broadening variability using the iacob-broad tool (SDH14).

![[Uncaptioned image]](/html/1409.2416/assets/x4.png)
.
Figure 4. Observational correlation found between the size of the macroturbulent broadening and the amplitude of variation of the skewness of the line-profile. Horizontal lines indicate the range of variability of . Close-by red and blue symbols correspond to the same stars but quantities computed covering different temporal scales (a few days and years, respectively).
The frequency analysis of our spectroscopic time-series (prior to any mode identification) is a complicated task due to the non-optimal observational cadence and the complexity of the line-profile variability detected in this type of stars (C. Aerts, these proceedings). However, we can already highlight some first observational results which must be taken into account by any attempt to explain the physical origin of the macroturbulent broadening:
-
•
Line-profiles of all the studied stars show LPVs (with similar characteristics as those illustrated in Fig. 3). Despite the variability, the global characteristic V-shape of the profiles remains roughly constant. Indeed, a similar shape can be found in very short ( a few seconds) and much longer (e.g. co-adding all the spectra obtained during 6 years) exposures.
-
•
The typical peak-to-peak amplitude of variability of the first moment (, centroid) is a few km s-1. We also find small variability (10%) in the sin and measurements provided by iacob-broad.
-
•
We find strong correlations between and the amplitude of variability of the third moment (, skewness); this was shown for the first time in Simón-Díaz et al. (2010) and is now confirmed with a larger sample and a longer time-span (see Fig. 4).
-
•
Although the precise identification of the frequencies of line-profile variability is difficult, we find some systematic hits of all stars showing multi-periodic variability in the high-order g-mode frequency domain ( a few hours to several days). However, the possibility of non-strictly-periodic variability cannot be discarded.
4 Concluding remarks
The presence of macroturbulent broadening in the whole O-type star domain, where instability domain computations predict no excitation of high-order gravity mode, seems to be a strong empirical challenge to the pulsational hypothesis (at least in reference to this type of stellar oscillations). The same occurs for the late-B Sgs. However, the detected line-profile variability in all studied stars with macroturbulent broadening, and the empirical correlations found between and () points towards to existence of a connection between the physical origin of this spectroscopic feature and stellar variability phenomena occurring in the photosphere of stars with masses above 15 M⊙.
The understanding of the macroturbulent broadening is still an open issue, but the new
observational material and the strategy proposed here will certainly
help us to find the solution of a long-standing question in the field of massive stars. Even
if the pulsational hypothesis may be rejected at some point, any other proposed scenario must fulfill the
empirical (single snapshot and time-dependent) constraints described in Sects. 2 and 3.
In this context, it is important to have also present other related studies proving complementary
empirical constraints (e.g., Sundqvist et al. 2013; Markova et al. 2014), or alternative scenarios to the origin of the macroturbulent
broadening (e.g., Cantiello et al. 2009), and maintain the initiated synergies between this research
line and Asteroseismology. A new window on massive stars is now fully open.
Acknowledgements
Although they are not included in the co-author list of this proceeding, I would like to thank many colleagues for interesting discussions during the development of this project. In particular to A. Herrero, C. Aerts, P. Degroote, J. Puls, M. Godart, N. Markova, and E. Moravveji. Special thanks to N. Castro for providing me with the stellar parameters of the B star sample, and to a long list of observing colleagues who are making the compilation of the observational data needed for this project more manageable: I. Negueruela, R. Dorda, I. Camacho, K. Rübke, P. de Cat, S. Triana, C. González, A. González, E. Niemczura, D. Drobek. Last, but not least, the NOT and MERCATOR staff for their high competence and always useful assistance. This work has been funded by the Spanish Ministry of Economy and Competitiveness under the grants AYA2010-21697-C05-04, and Severo Ochoa SEV-2011-0187, and by the Canary Islands Government under grant PID2010119.
References
- Aerts et al. (1992) Aerts, C., de Pauw, M., & Waelkens, C. 1992, A&A 266, 294
- Aerts et al. (2009) Aerts, C., Puls, J., Godart, M., & Dupret, M.-A. 2009, A&A 508, 409
- Aerts et al. (2014) Aerts, C., Simon-Diaz, S., Groot, P. J., & Degroote, P. 2014, ArXiv e-prints
- Cantiello et al. (2009) Cantiello, M., Langer, N., Brott, I., et al. 2009, A&A 499, 279
- Castro et al. (2012) Castro, N., Urbaneja, M. A., Herrero, A., et al. 2012, A&A 542, A79
- Conti & Ebbets (1977) Conti, P. S. & Ebbets, D. 1977, ApJ 213, 438
- Ekström et al. (2012) Ekström, S., Georgy, C., Eggenberger, P., et al. 2012, A&A 537, A146
- Godart (2011) Godart, M. 2011, Ph.D. thesis, University of Liege, Belgium
- Howarth (2004) Howarth, I. D. 2004, in A. Maeder & P. Eenens (eds.), Stellar Rotation, Vol. 215 of IAU Symposium, p. 33
- Howarth et al. (1997) Howarth, I. D., Siebert, K. W., Hussain, G. A. J., & Prinja, R. K. 1997, MNRAS 284, 265
- Lucy (1976) Lucy, L. B. 1976, ApJ 206, 499
- Markova et al. (2014) Markova, N., Puls, J., Simón-Díaz, S., et al. 2014, A&A 562, A37
- Miglio et al. (2007) Miglio, A., Montalbán, J., & Dupret, M.-A. 2007, Communications in Asteroseismology 151, 48
- Penny (1996) Penny, L. R. 1996, ApJ 463, 737
- Ryans et al. (2002) Ryans, R. S. I., Dufton, P. L., Rolleston, W. R. J., et al. 2002, MNRAS 336, 577
- Simón-Díaz et al. (2012) Simón-Díaz, S., Castro, N., Herrero, A., et al. 2012, in L. Drissen, C. Rubert, N. St-Louis, & A. F. J. Moffat (eds.), Proceedings of a Scientific Meeting in Honor of Anthony F. J. Moffat, Vol. 465 of Astronomical Society of the Pacific Conference Series, p. 19
- Simón-Díaz et al. (2011) Simón-Díaz, S., Castro, N., Herrero, A., et al. 2011, Journal of Physics Conference Series 328(1), 012021
- Simón-Díaz & Herrero (2007) Simón-Díaz, S. & Herrero, A. 2007, A&A 468, 1063
- Simón-Díaz & Herrero (2014) Simón-Díaz, S. & Herrero, A. 2014, A&A 562, A135
- Simón-Díaz et al. (2010) Simón-Díaz, S., Herrero, A., Uytterhoeven, K., et al. 2010, ApJ 720, L174
- Slettebak (1956) Slettebak, A. 1956, ApJ 124, 173
- Struve (1952) Struve, O. 1952, PASP 64, 117
- Sundqvist et al. (2013) Sundqvist, J. O., Petit, V., Owocki, S. P., et al. 2013, MNRAS 433, 2497