LIneA – Laboratório Interdepartamental de e-Astronomia, Rua José Cristino, Rio de Janeiro, Brazil 33institutetext: M. Barbieri, P. Marigo 44institutetext: Dipartimento di Fisica e Astronomia, Università di Padova, Italy 55institutetext: A. Miglio, D. Bossini 66institutetext: University of Birmingham, UK 77institutetext: A. Bressan 88institutetext: SISSA, Via Bonomea 265, I-34136 Trieste, Italy
The expected stellar populations in the Kepler and CoRoT fields
Abstract
Using the stellar population synthesis tool TRILEGAL, we discuss the expected stellar populations in the Kepler and CoRoT fields.
1 Inroduction
Kepler and CoRoT asteroseismic observations are providing us with precious information about the properties and structure of stars displaced widely across the Galaxy. Observations of these fields will not be repeated any time soon with instrumentation of comparable precision and efficiency. Since both missions were primarily driven by the goal of “finding the most planets”, they applied complex target selection criteria which are not ideal for the stellar populations and Galaxy archeology applications which were devised later. Therefore, what can be extracted from this data depends on a good understanding of the data selection, and of our ability to model the entire samples with population synthesis tools. This contribution will concentrate on the latter aspect.
2 Population synthesis of the Milky Way
Population synthesis models of the Milky Way are the successors of the “star counts” models introduced in the 80’s (e.g. Bahcall & Soneira, 1980; Bahcall, 1986) to model the luminosity and color distribution of stars across the sky. The main novelty introduced by the population synthesis approach is the use of extended databases of stellar models to describe the intrinsic luminosity distribution of stars in given pass-bands, , instead of recurring to empirical data. More exactly, are derived from grids of stellar evolutionary tracks suitable converted into isochrones, which are then “colored” by using synthetic photometry applied to extended grids of model spectra, and later weighted by assuming some star formation and chemical enrichment history (SFH), and the initial mass function (IMF). The all process is detailed in (e.g. Girardi et al., 2002, 2005). The advantages of the theoretical over the empirically-derived are evident: there are almost no limits to the kind of stellar populations to be tested; moreover very different databases (e.g. comprising many passbands) can be modeled in a consistent way, and the models can be more reliably extrapolated to larger photometric depths. On the other hand, the population synthesis approach introduces many additional parameters and functions, like those describing the SFH and IMF for each Galactic component, that apparently complicate the problem. Moreover, using the population synthesis approach implies trusting on the predictive capability of the underlying stellar models.
But the necessity of the population synthesis approach becomes dramatically more evident when we consider the present asteroseismic data: empirical data simply cannot replace the stellar models in this case, simply because there is not enough empirical information to build the asteroseismic versions of starting from star clusters of from stars with parallaxes. In this case, the asteroseismic data is helping to test the stellar models in a very detailed way, star by star, and helping to test the galactic models at the same time.
2.1 TRILEGAL
TRILEGAL is a population synthesis code started with the initial goal of simulating deep and wide multi-band photometric data (Groenewegen et al., 2002; Girardi et al., 2005; Vanhollebeke et al., 2009). More recently, the code has become a fundamental tool to test stellar evolutionary tracks from the Padova-Trieste group (e.g. Girardi et al., 2009, 2010; Bianchi et al., 2011; Rosenfield & al., 2014). With the recent/ongoing addition of new quantities in the code, like the surface chemical composition and asteroseismic parameters, it is ready to be applied in the simulation and interpretation of large databases like those provided by CoRoT and Kepler.
2.2 Expectations for CoRoT
Miglio et al. (2013a, b) provide a detailed description of the model expectations in CoRoT fields. CoRoT eyes are directed towards very different lines-of sight, probing a large range of both galactocentric radii and heights above/below the Galactic Plane. The main result in Miglio et al. (2013b) was the detection of a significant difference in the mass distribution of stars towards the CoRoT fields LRc01 and LRa01, which was interpreted as being mainly due to the different stellar ages being sampled at two different heights below the Galactic Plane. Similar differences are expected for all other CoRoT lines-of-sight, but are of harder interpretation given their more complex target selection.
2.3 Expectations for Kepler
t]
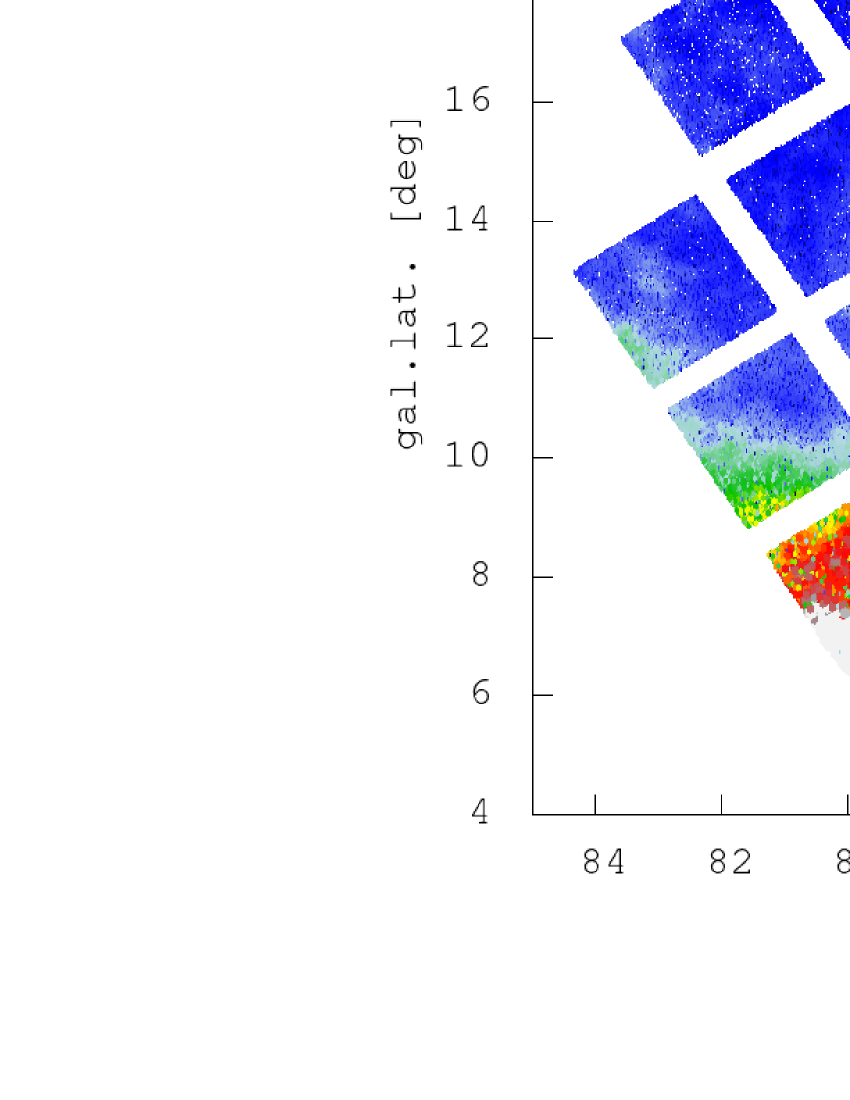
Figure 1 is extracted from a large simulation of the Kepler field (Barbieri et al. in prep), including many of the filter systems of interest. The simulation scales down the Schlegel et al. (1998) extinction values down to the distance of each simulated star, distributing it along the line-of-sight by assuming an exponential dust layer with pc. A correction for the Local Bubble is also made.
One of the main novelties in the simulation are the more complex way the binaries are simulated: their mass ratio, orbital period and eccentricity, inclination etc., are derived for the system at birth following a series of reasonable assumptions. The binary evolution is then followed with the BSE code (Hurley et al., 2002), which considers mass transfer and accretion, common-envelope evolution, collisions, supernova kicks, angular momentum loss mechanisms, circularization and synchronization of orbits by tidal interactions. Of course there are many tunable parameters involved in these models, like the strength of tidal damping in radiative, convective and degenerate regions, the Reimers (1975) mass-loss coefficient, the binary enhanced mass loss, the common envelope efficiency.
Any simulation of the Kepler field will be of limited use if not including a simulation of the Kepler target selection criteria. The best study of these criteria so far has been by Farmer et al. (2013), who built a software that tries to mimic all the steps involved in building the Kepler input catalogue and prioritization (Brown et al., 2011; Batalha et al., 2010). For asteroseismic studies, we should also consider the addition of targets not coming from the original planet-detection plan, and estimate the probability of actually measuring the asteroseismic parameters and their errors (e.g. Chaplin et al., 2011, for dwarfs).
t]
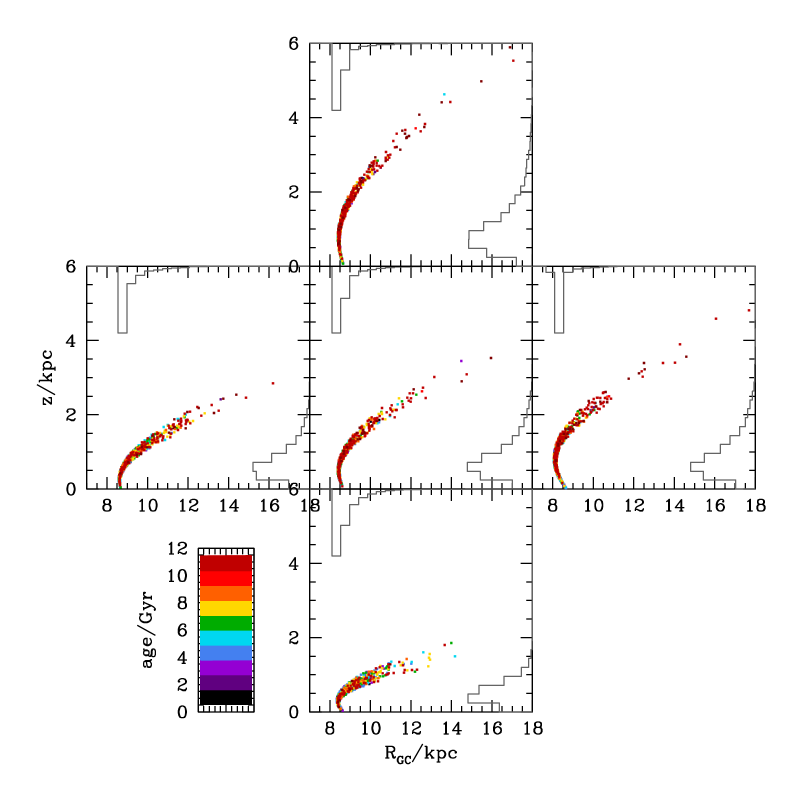
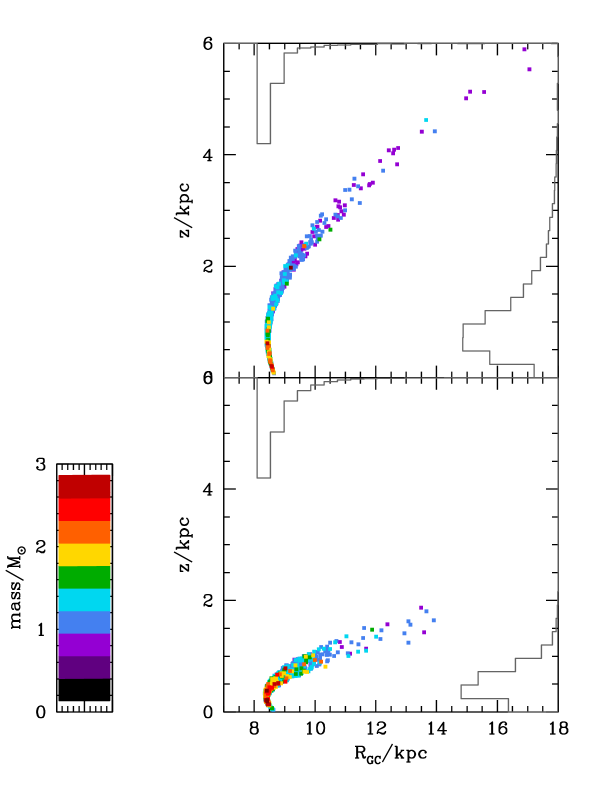
Figures 2 provides some basic information about the expected distribution of these stars across the Galaxy, in particular evincing the modest coverage in , and the large range in . Since younger stars are concentrated at smaller heights, the model predicts strong differences between the distributions stellar masses observed at the latitude extremes of this field, as evidenced in 3. These differences are large enough to be easily measurable in the Kepler data, although their interpretation is somewhat complicated by the patchy extinction in the low-latitude fields. Work is ongoing to transform these distributions of stellar mass in clear constraints to the increase of scale-height with stellar age, hence complementing the earlier suggestions derived from CoRoT data.
t]
t]
It is hoped that Kepler data will help to solve the dramatic problem pointed out by Reylé & Robin (2001), that is: when attempting to fit star counts only, there is a strong degeneracy between scale heigth and surface density of thick disk, with models favoring either high scale height and small local density (for example, the pc and 2% of disk density favoured by Reid & Majewski 1993, against the 910 pc and 5.9% from Buser et al. 1999). Although the problem can be relieved with more photometric data, a clearcut distinction between thick and from old thin disk (if any exists, e.g. Bovy et al. (2012)) would help. That is where Kepler data can be critical.
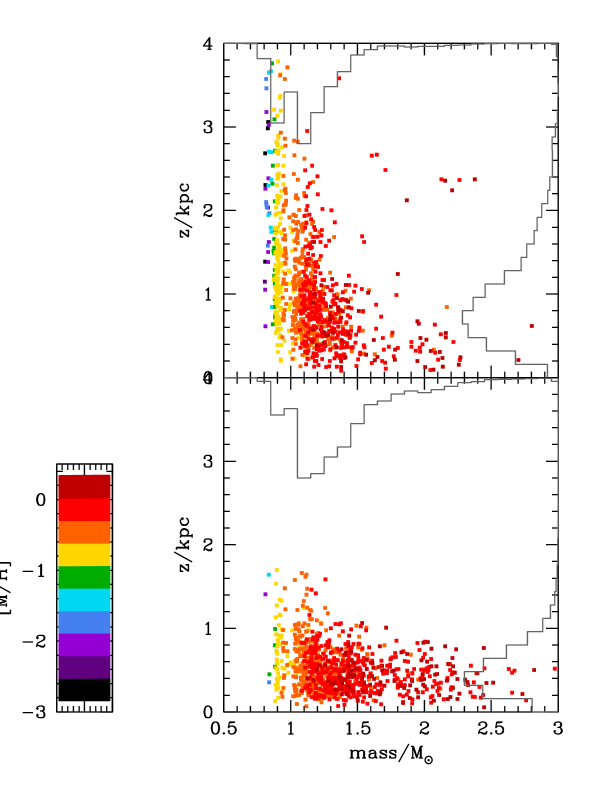
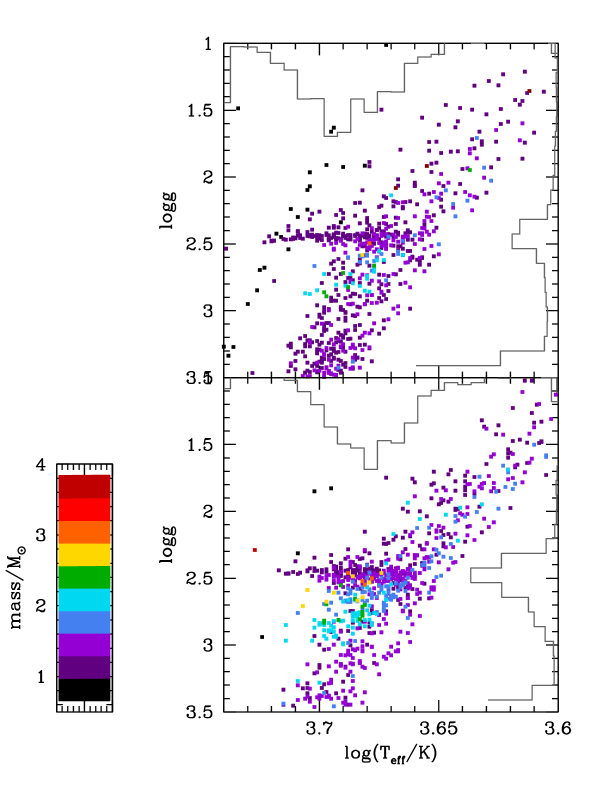
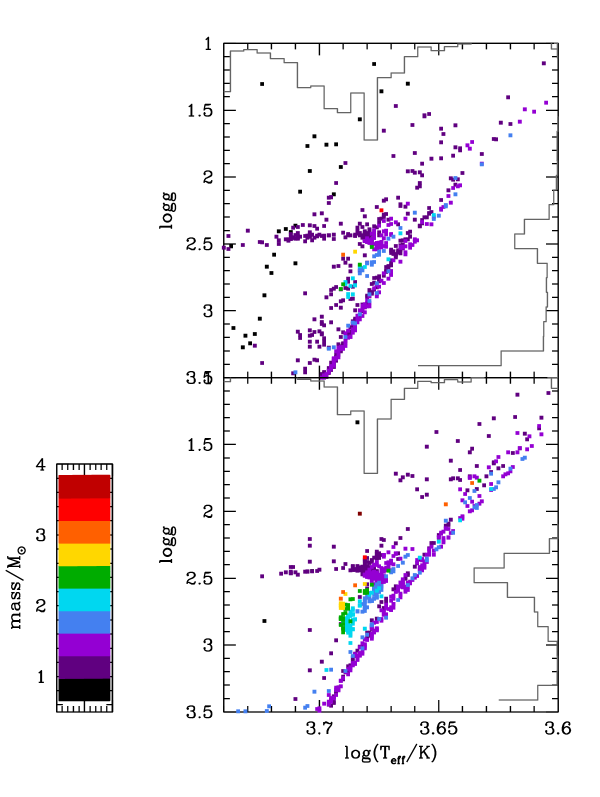
Additional information is store in Kepler data in the form of chemical abundances and kinematics of stars of different masses and ages. The secondary red clump (Girardi, 1999), for instance, contains a pure population of 1 Gyr stars and which is easily identifiable in a versus plot (Fig. 4), especially when additional information from mixed modes (period spacing) is available. Stellar metallicities for these stars, as measured e.g. by APOKASC (Pinsonneault & al., 2014) can provide a direct probe of the intrinsic metallicity spread, and a solid point along the age–metallicity relation, across the Galaxy.
3 Concluding remarks
The population synthesis approach has revealed to be a powerful technique, very useful for the interpretation of wide-area surveys in terms of the MW structure and evolution. Present applications to CoRoT and Kepler asteroseismic samples are still limited, but with their direct measurements of ages and evolutionary stages, they provide excellent hopes for imposing tight constrains in the models.
While dwarfs in Kepler fields seem to have their radii well reproduced by models, there is a discrepancy for masses, still to be clarified (Chaplin et al., 2011). Giants in Kepler represent the ideal sample for testing the variation of stellar properties with , and hopefully will provide long-awaited constraints to disk-heating and accretion scenarios, and complement the kinematical information either already available (e.g. from proper motions, GCS) or being collected by APOKASC. The expected variation of mean mass (age) with is detected in the CoRoT giants (Miglio et al., 2013b), but those results may be affected by the large range of galactocentric radii probed by CoRoT. Of course, it is expected that once the vertical structure is revealed by the Kepler sample, CoRoT results will have to be reevaluated.
Acknowledgements.
We thank all participants in the Sexten meeting for the stimulating discussions, and the Kepler and CoRoT teams for providing such wonderful and promising databases.References
- Bahcall (1986) Bahcall, J. N. 1986, ARA&A , 24, 577
- Bahcall & Soneira (1980) Bahcall, J. N. & Soneira, R. M. 1980, ApJS , 44, 73
- Batalha et al. (2010) Batalha, N. M., Borucki, W. J., Koch, D. G., et al. 2010, ApJ , 713, L109
- Bianchi et al. (2011) Bianchi, L., Efremova, B., Herald, J., et al. 2011, MNRAS , 411, 2770
- Bovy et al. (2012) Bovy, J., Rix, H.-W., & Hogg, D. W. 2012, ApJ , 751, 131
- Brown et al. (2011) Brown, T. M., Latham, D. W., Everett, M. E., & Esquerdo, G. A. 2011, AJ , 142, 112
- Buser et al. (1999) Buser, R., Rong, J., & Karaali, S. 1999, A&A , 348, 98
- Chaplin et al. (2011) Chaplin, W. J., Kjeldsen, H., Christensen-Dalsgaard, J., et al. 2011, Science, 332, 213
- Farmer et al. (2013) Farmer, R., Kolb, U., & Norton, A. J. 2013, MNRAS , 433, 1133
- Girardi (1999) Girardi, L. 1999, MNRAS , 308, 818
- Girardi et al. (2002) Girardi, L., Bertelli, G., Bressan, A., et al. 2002, A&A , 391, 195
- Girardi et al. (2005) Girardi, L., Groenewegen, M. A. T., Hatziminaoglou, E., & da Costa, L. 2005, A&A , 436, 895
- Girardi et al. (2009) Girardi, L., Rubele, S., & Kerber, L. 2009, MNRAS , 394, L74
- Girardi et al. (2010) Girardi, L., Williams, B. F., Gilbert, K. M., et al. 2010, ApJ , 724, 1030
- Groenewegen et al. (2002) Groenewegen, M. A. T., Girardi, L., Hatziminaoglou, E., et al. 2002, A&A , 392, 741
- Hurley et al. (2002) Hurley, J. R., Tout, C. A., & Pols, O. R. 2002, MNRAS , 329, 897
- Miglio et al. (2013a) Miglio, A., Chiappini, C., Morel, T., et al. 2013a, in European Physical Journal Web of Conferences, Vol. 43, European Physical Journal Web of Conferences, 3004
- Miglio et al. (2013b) Miglio, A., Chiappini, C., Morel, T., et al. 2013b, MNRAS , 429, 423
- Pinsonneault & al. (2014) Pinsonneault, M. & al., e. 2014, ApJS , submitted
- Reid & Majewski (1993) Reid, N. & Majewski, S. R. 1993, ApJ , 409, 635
- Reimers (1975) Reimers, D. 1975, Memoires of the Societe Royale des Sciences de Liege, 8, 369
- Reylé & Robin (2001) Reylé, C. & Robin, A. C. 2001, A&A , 373, 886
- Rosenfield & al. (2014) Rosenfield, P. & al., e. 2014, ApJ , submitted
- Schlegel et al. (1998) Schlegel, D. J., Finkbeiner, D. P., & Davis, M. 1998, ApJ , 500, 525
- Vanhollebeke et al. (2009) Vanhollebeke, E., Groenewegen, M. A. T., & Girardi, L. 2009, A&A , 498, 95