CARMA observations of massive Planck-discovered cluster candidates at associated with WISE overdensities: strategy, observations and validation
Abstract
We present ′ spatial resolution CARMA-8 31-GHz observations towards 19 unconfirmed Planck cluster candidates, selected to have significant galaxy overdensities from the WISE early data release and thought to be at from the WISE colors of the putative brightest cluster galaxy (BCG). We find a Sunyaev-Zeldovich (SZ) detection in the CARMA-8 data towards 9 candidate clusters, where one detection is considered tentative. For each cluster candidate we present CARMA-8 maps, a study of their radio-source environment and we assess the reliability of the SZ detection. The CARMA SZ detections appear to be SZ-bright, with the mean, primary-beam-corrected peak flux density of the decrement being mJy/beam with a standard deviation of 0.8, and are typically offset from the Planck position by . Using archival imaging data in the vicinity of the CARMA SZ centroids, we present evidence that one cluster matches Abell 586—a known cluster; four candidate clusters are likely to have ; and, for the remaining 4, the redshift information is inconclusive. We also argue that the sensitivity limits resulting from the cross-correlation between Planck and WISE makes it challenging to use our selection criterion to identify clusters at .
1 Introduction
Galaxy clusters form over a Hubble time from rare, high-density peaks in the primordial density field on scales of a few Mpc. Their assembly via the hierarchical merging of smaller haloes from straddles the period of dark energy domination and, on the largest scales, is driven primarily by gravitational physics with little effect from e.g., complex gas dynamics, feedback and stellar mass (see e.g., Bond et al. 1996 and Allen et al. 2011 for a review). As a result, cluster abundance—the number of clusters per comoving volume per solid angle above a certain mass—as a function of redshift depends solely on the expansion history of the Universe and the growth of the initial fluctuations (Bardeen et al. 1986, Bond & Myers 1996). In principle, measuring the evolution of the cluster mass function with redshift provides an independent probe for placing strong constraints on cosmological parameters (e.g., Bahcall & Fan 1998, Viana & Liddle 1996 and Voit 2005). However, the ability to extract precision cosmology from cluster surveys relies on the selection function being well understood and the precise characterization of how a cluster observable translates to a cluster mass.
Lying on the exponential tail of the mass function, the most massive clusters are of particular interest, especially those at high redshifts, , as they yield the largest differences between cosmologies. But, identifying such systems has been challenging, since they are inherently rare and since historically clusters have been detected via their optical flux or from the X-ray emission of the hot intracluster medium (ICM; observational methods that suffer from cosmological dimming). In recent years, significant progress in this quest has been made through Sunyaev-Zel’dovich (SZ) surveys like ACT (Marriage et al., 2011), SPT (Williamson et al., 2011) and Planck (Planck Collaboration et al., 2011 VIII). When cosmic microwave background (CMB) photons traveling towards us traverse the hot ICM, many are inverse-Compton scattered by the hot electrons in the plasma producing a shift in the blackbody spectrum of the CMB known as the SZ effect (Sunyaev & Zel’dovich 1972; see Carlstrom et al. 2002 for a review). The total, or integrated SZ signal, , has been shown to correlate tightly with mass, it is only weakly dependent on redshift at and has a weak bias to gas concentration (e.g, Motl et al. 2005, Bonaldi et al. 2007 and Kay et al. 2012).
The ACT and SPT SZ cluster surveys cover relatively small areas of sky ( sq degs;Hasselfield et al. (2013) and sq degs;Williamson et al. (2011), respectively) at arcminute resolution with the benefit of probing the low-to-medium mass end of the mass function. These surveys are complementary to the Planck mission (Tauber et al. 2010 & Planck Collaboration et al. 2011 I), which is designed to detect the most massive clusters over the entire sky. The latest Planck results based on 15.5 months of data contain measurements towards 1227 systems; 683 of these entries match a known cluster and, out of the 544 newly-discovered objects, 178 have been confirmed to be clusters through follow-up observations (Planck Collaboration et al. 2013 XXIX). One of the major drawbacks of Planck is its spatial resolution, which is between 5 and at the relevant frequencies, and contributes to the errors on cluster parameters (Planck Collaboration et al. 2013 II). Thus, to fully exploit the characteristics of Planck clusters to constrain cosmology, high resolution follow-up of the catalogued clusters is necessary.
For this project we have used the 8-element subarray of the Combined Array for Research in Millimeter-wave Astronomy, CARMA-8, to follow up 19 unconfirmed Planck-discovered cluster candidates which we believed to be at from their WISE colors. Previous high resolution SZ follow up of Planck-detected clusters and candidate clusters has been undertaken by Muchovej et al. (2010), AMI Consortium: Hurley-Walker et al. (2011), Sayers et al. (2012), Planck Collaboration et al. (2013 II) and Perrott (2014).
This work is divided into two articles. The first one, presented here, focuses on validating the sample candidate clusters. The second (Rodríguez-Gonzálvez et al., 2014) aims to constrain cluster parameters by fitting models to the data in a Bayesian Monte-Carlo Markov Chain (MCMC) framework. The current article is organized as follows: details on the instruments and target selection are provided in Section 2. The CARMA data, including processing and main results, are presented in Section 3. Validation work using ancillary datasets is described in Section 4. In Section 5 we discuss whether any of the cluster candidates without a CARMA-8 SZ detection are likely to be real. In Section 6, we (1) explore which of the selection criteria correlate best with detectability and (2) make use of WISE and SDSS to estimate or place constraints on the cluster redshift. The conclusions drawn from this study are provided in Section 7.
Throughout this work we present images where North is up and East is to the left. We use J2000 coordinates, as well as a CDM cosmology with , , , , , and . is taken as 70 km s-1 Mpc-1.
| Cluster | Union Name | RA | Dec | Short Baselines (0-2k) | Long Baselines (2-8 k) | ||||
|---|---|---|---|---|---|---|---|---|---|
| Beam | Position | Beam | Position | ||||||
| ID | Angle | Angle | |||||||
| hh mm ss | dd mm ss | (∘) | ) | ||||||
| PSZ1G014.13+38.38 | 16 03 21.62 | 03 19 12.00 | 91.4 102.2 | 83.0 | 0.309 | 15.719.5 | 44.9 | 0.324 | |
| P028 | PSZ1G028.66+50.16 | 15 40 10.15 | 17 54 25.14 | 123.8 129.9 | -37.4 | 0.433 | 17.424.0 | 64.4 | 0.451 |
| P031 | - | 15 27 37.83 | 20 40 44.28 | 92.6 234.9 | -84.5 | 0.727 | 16.528.9 | 48.0 | 0.633 |
| P049 | - | 14 44 21.61 | 31 14 59.88 | 108.0 158.0 | -52.9 | 0.557 | 17.525.0 | 85.1 | 0.572 |
| P052 | - | 21 19 02.42 | 00 33 00.00 | 87.4 107.5 | 53.1 | 0.368 | 14.721.0 | 38.2 | 0.386 |
| P057 | PSZ1G057.71+51.56 | 15 48 34.13 | 36 07 53.86 | 119.7 133.9 | -41.8 | 0.451 | 16.725.9 | 88.0 | 0.482 |
| PSZ1G086.93+53.18 | 15 13 53.36 | 52 46 41.56 | 124.0 143.7 | 70.4 | 0.622 | 18.224.4 | 54.0 | 0.599 | |
| P090 | PSZ1G090.82+44.13 | 16 03 43.65 | 59 11 59.61 | 118.2 147.7 | -65.0 | 0.389 | 19.524.4 | 42.7 | 0.427 |
| - | 14 55 13.99 | 58 51 42.44 | 115.3 169.4 | -84.2 | 0.653 | 21.025.0 | 48.4 | 0.660 | |
| PSZ1G109.88+27.94 | 18 23 00.19 | 78 21 52.19 | 112.3 185.0 | -86.4 | 0.562 | 23.325.6 | -39.1 | 0.517 | |
| P121 | PSZ1G121.15+49.64 | 13 03 26.20 | 67 25 46.70 | 82.2 193.1 | 85.4 | 0.824 | 21.523.4 | 89.9 | 0.681 |
| P134 | PSZ1G134.59+53.41 | 11 51 21.62 | 62 21 00.18 | 106.5 164.3 | 80.0 | 0.590 | 20.125.7 | -86.2 | 0.592 |
| P138 | PSZ1G138.11+42.03 | 10 27 59.07 | 70 35 19.51 | 51.1 246.7 | 68.2 | 2.170 | 20.626.1 | 75.0 | 0.982 |
| PSZ1G171.01+39.44 | 08 51 05.10 | 48 30 18.14 | 119.0 126.8 | -18.3 | 0.422 | 16.724.5 | 68.2 | 0.469 | |
| PSZ1G187.53+21.92 | 07 32 18.01 | 31 38 39.03 | 104.0 145.3 | -60.9 | 0.411 | 16.723.7 | 63.0 | 0.412 | |
| PSZ1G190.68+66.46 | 11 06 04.09 | 33 33 45.23 | 109.0 180.1 | -48.7 | 0.450 | 17.126.3 | -86.6 | 0.356 | |
| PSZ1G205.85+73.77 | 11 38 13.47 | 27 55 05.62 | 117.8 130.1 | -35.9 | 0.385 | 16.923.9 | 65.2 | 0.431 | |
| P264 | - | 10 44 48.19 | -17 31 53.90 | 102.9 124.9 | -12.3 | 0.476 | 16.824.8 | 7.1 | 0.513 |
| - | 15 04 04.90 | -6 07 15.25 | 96.5 109.6 | -39.9 | 0.355 | 17.219.7 | 11.6 | 0.392 | |
-
•
() Since the cluster selection criteria, as well as the data for the cluster extraction, are different to those for the PSZ catalog, not all the clusters in this work have an official Planck ID.
-
•
(a) Synthesized beam Full Width Half Maximum (FWHM) (in arcsec) and position angle measured from North through East.
-
•
(b) Achieved rms noise in corresponding maps.

2 Cluster sample
2.1 Instruments: CARMA and Planck
The CARMA-8 telescope, previously known as the Sunyaev Zel’dovich Array (SZA), is an interferometer operating at 31 GHz comprising eight antennas of 3.5 m in diameter. Six of the antennas are arranged in a compact configuration (with baselines between m or k) to be sensitive to large-scale structure at arcminute-resolution and the two outliers, with baselines of m or k, provide the high resolution data () to enable contaminating radio-point sources to be detected and removed accurately. It has a bandwidth of 8 GHz divided into sixteen 500 MHz channels, a 10.5 FWHM primary beam and typical system temperatures of 40-50 K. Further details on the instrument can be found in Muchovej et al. (2007). Henceforth, we shall refer to the short-baseline data from the compact subarray ( k) as SB data and to the long-baseline data ( k) as LB data.
The Planck satellite (Tauber et al. 2010 & Planck Collaboration et al. 2011 I) is a third generation space-based mission to study the CMB and foregrounds to the CMB. It has mapped the entire sky at nine frequency bands from 30 to 857 GHz, with angular resolution of to 5′, respectively. The bands where the SZ decrement is strongest, 100 and 143 GHz, have resolutions of 10′ and 7′ respectively.
2.2 Sample selection
The nineteen clusters comprising our sample are all candidate clusters detected in the Planck all-sky maps; they are listed in Table 1. They were selected by cross-correlating WISE early data release111At the time when our sample of targets was selected the WISE early data release was the most up to date publicly available WISE data product. and Planck catalogs of SZ candidate clusters. The Planck SZ catalog used for the primary selection was an intermediate Planck data product known internally as DX7222Planck data are collected and reduced in blocks of time. The DX7 all sky maps used in this analysis correspond to the reduction of Planck data collected from 12th August 2009 to the 28th of November 2010, which is the equivalent to 3 full all-sky surveys, using the v4.1 processing pipeline. The DX7 maps used in this work are part of an internal release amongst the Planck Collaboration members and, thus, is not a publicly available data product. The Planck Union catalog (PSZ) is based on more recent and refined processing of the data, including improved pointing and calibration.. Candidate clusters were identified in the maps using a matched-filter component separation algorithm, MMF3333Three algorithms: MMF1 (Herranz et al., 2002), MMF3 (Melin, Bartlett, & Delabrouille, 2006) and PwS (Carvalho, Rocha, & Hobson 2009 & Carvalho et al. 2012) have been used to identify cluster candidates from the Planck data (see Planck Collaboration et al. 2013 XXIX). (Melin, Bartlett, & Delabrouille 2006). Henceforth, results derived from the MMF3 analysis of Planck DX7 data will be referred to as Planck results. We initially searched the WISE early data release (Wright et al., 2010) at the location of the cluster candidates and estimated a value for the overdensity of WISE objects. The average density of WISE galaxies detected at 3.4 and 4.6 was first calculated within of the Planck position and, secondly, within an annulus with a inner radius and a outer radius444The choice of 4.75′as the inner radius is based on the Planck beam ( at 100 GHz). Although the typical separations between Planck and X-ray cluster centroids from the early Planck SZ cluster catalog (Planck Collaboration et al. 2011 VIII) were found to typically be , we chose a larger radius to avoid introducing selection biases that could arise from picking systems with smaller offsets, which might be in a more relaxed dynamical state. However, from the CARMA-8 results, we find that we only detect systems within from the Planck position.. The difference between these two density measurements yields a value for the overdensity of WISE objects in the vicinity of each Planck cluster candidate (see Figure 1).
Coarse photometric redshifts were calculated from the [3.4]-[4.6] WISE colors of the brightest red object within 555For some of the clusters in our sample the brightest red object in WISE used to obtain a photometric redshift estimate is ′from the Planck position since earlier versions of the algorithm used to select the cluster sample did not impose such a tight constraint on the radial search. of the Planck position fainter than 15.8 Vega mags at 3.4 microns (which corresponds to a 10 galaxy at 666WISE is sensitive to a galaxy mass of at . ). The purpose of the magnitude cut for our sample selection is to exclude contaminating foreground sources, while that of the distance cut is to maximize the likelihood of the red object being associated with the WISE overdensity (and, hence, the Planck candidate cluster).
| Cluster | RA | Dec | PB-corrected Peak SZ | Distance from | SNR | SNR | SNR | 100-micron Emission |
|---|---|---|---|---|---|---|---|---|
| Flux Density | Map Center | CARMA-8 | Planck | UNION | ||||
| ID | hh mm ss.s | ∘ ′″ | mJy/beam | ″ | MJy/sr | |||
| P014 | 16 03 26.16 | +03 16 48.00 | -1.5 | 159 | 4.2 | 5.4 | 4.5 | |
| P028 | - | - | - | - | - | 5.2 | 5.1 | |
| P031 | - | - | - | - | 4.1 | - | ||
| P049 | - | - | - | - | - | 4.3 | - | |
| P052 | - | - | - | - | - | 5.1 | - | |
| P057 | - | - | - | - | - | 5.3 | 4.6 | |
| P086 | 15 14 00.42 | +52 47 49.55 | -3.4 | 94 | 5.1 | 5.1 | 4.6 | |
| P090 | - | - | - | - | - | 5.5 | 5.4 | |
| P097 | 14 55 23.79 | +58 52 18.42 | -3.0 | 84 | 4.4 | 4.8 | - | |
| P109 | 18 23 08.14 | +78 23 04.18 | -4.2 | 76 | 7.3 | 5.6 | 5.3 | |
| P121 | - | - | - | - | - | 5.0 | 5.6 | |
| P134 | - | - | - | - | - | 4.6 | 5.0 | |
| P138 | - | - | - | - | - | 4.6 | 5.1 | |
| P170 | 08 51 00.67 | +48 30 30.13 | -3.1 | 45 | 7.3 | 5.8 | 6.7 | |
| P187 | 07 32 21.15 | +31 38 11.02 | -2.4 | 49 | 5.8 | 6.0 | 6.1 | |
| P190 | 11 06 08.09 | +33 34 00.22 | -3.6 | 52 | 7.8 | 4.1 | 4.6 | |
| P205 | 11 38 07.82 | +27 54 30.61 | -2.6 | 83 | 5.7 | 5.9 | 5.7 | |
| P264 | - | - | - | - | - | 4.2 | - | |
| P351 | 15 03 59.21 | -06 06 30.25 | -2.1 | 96 | 5.6 | 3.8 | - |
-
•
() To correct the measured peak flux density for the effects of primary-beam attenuation, we divide it by , where is the distance from the map center to the pixel with the peak flux density of the radio source and
| Cluster | RA | Dec | Distance from | 31-GHz Peak | 1.4-GHz Peak | ||
|---|---|---|---|---|---|---|---|
| Map Centre | Flux Density | Flux Density | |||||
| ID | hh mm ss.s | ∘ ′″ | ″ | mJy | mJy | 1.4/31 GHz | |
| P014 | 16 03 18.90 | +03 16 44.00 | 152 | 6.3 | 120.8 | 0.95 | |
| P014 | 16 03 30.20 | +03 26 32.00 | 458 | 9.4 | 96.8 | 0.75 | |
| P028 | 15 40 13.24 | +17 56 33.14 | 134 | 3.7 | 21.9 | 0.57 | |
| P028 | 15 40 21.92 | +17 52 45.12 | 196 | 3.2 | 77.7 | 1.02 | |
| P031 | 15 27 30.42 | +20 41 32.27 | 113 | 3.4 | - | - | |
| P049 | 14 44 27.84 | +31 13 15.87 | 133 | 10.0 | 62.6 | 0.59 | |
| P052 | 21 18 49.08 | +00 33 28.00 | 202 | 5.6 | 129.4 | 1.01 | |
| P052 | 21 19 05.08 | +00 32 40.00 | 44 | 2.5 | 56.3 | 1.00 | |
| P057 | 15 48 49.32 | +36 10 29.80 | 240 | 3.4 | 68.6 | 0.97 | |
| P057 | 15 48 41.06 | +36 09 33.85 | 130 | 3.2 | 7.6 | 0.28 | |
| P109 | 18 22 52.25 | +78 23 04.18 | 76 | 2.6 | - | - | |
| P121 | 13 02 40.94 | +67 28 42.30 | 311 | 23.2 | 317.1 | 0.84 | |
| P138 | 10 26 37.40 | +70 32 50.37 | 432 | 150.3 | 135.1 | -0.03 | |
| P170 | 08 51 14.78 | +48 37 06.11 | 421 | 10.8 | 119.9 | 0.78 | |
| P187 | 07 32 20.21 | +31 41 19.03 | 161 | 3.1 | 12.7 | 0.46 | |
| P351 | 15 04 18.65 | -06 05 15.24 | 237 | 3.3 | 51.7 | 0.89 |
| Cluster ID | RA | Dec | Distance | Predicted, Primary-beam-attenuated | SNR |
|---|---|---|---|---|---|
| 31-GHz Peak Flux Density | |||||
| hh mm ss.s | deg min sec | ″ | mJy | ||
| P052 | 21 18 48.31 | 0 37 46.3 | 356 | 2.4 | 6.1 |
| P052 | 21 19 25.44 | 0 31 42.1 | 354 | 3.3 | 8.6 |
| P109 | 18 22 40.96 | 78 22 20.2 | 64.6 | 4.0 | 7.7 |
| P190 | 11 05 53.78 | 33 40 53.3 | 447 | 2.4 | 6.9 |
We note that there is some scatter in the mid-infrared (MIR) color relation and some spread in the range of possible evolutionary tracks. Such that, in principle, lower redshift objects mimicking the WISE colors could lie within our sample. Though we do not expect to have targeted many objects as it is likely that they would have been detected by other instruments and surveys, and a large fraction of our cluster candidates do not lie in close proximity to a confirmed cluster of sufficient mass (see Table 10). Our goal is to eventually use spectroscopic data to obtain accurate redshift estimates. Objects are considered red if their flux in WISE channel 1 (3.4 microns) minus channel 2 (4.6 microns) in AB mags (0.5 in Vega); a method for preferentially identifying objects (Papovich 2008). This MIR color criterion has been used by e.g., Galametz et al. (2012) and Brodwin et al. (2012), who have also followed-up galaxy overdensities at with CARMA-8.
Upon identifying WISE galaxy overdensities at Planck candidate-cluster locations, we discarded systems with high ISM contamination, as measured in the IRAS 100 m-intensity band, as they are more likely to be spurious detections, and those at in order to ensure sufficient -coverage of the CARMA-8 data. We assigned a figure of merit to the remaining cluster candidates based on several parameters: distance of the WISE brightest red object within 2.5′ from the Planck candidate-cluster position, the SNR in Planck, and the magnitude of the WISE overdensity, and drew our final sample from the highest priority objects.
3 CARMA-8 observations
3.1 Data processing
CARMA-8 observations were obtained towards 19 Planck-selected cluster candidates. Initially, data were collected for each cluster candidate for hours; if a clear or tentative SZ decrement appeared in the maps, more data were gathered on that object to improve the SNR of the detection; otherwise, no more observations were queued for that particular system. This was an observing strategy designed to maximize the number of detections in the limited CARMA-8 time at our disposal ( hrs) and, as a result, there is significant spread in the rms of our final visibilities. The noise levels are provided in Table 1, together with pointing centers, shorthand cluster IDs—which will be used throughout this work—and information on the beam, which is a measure of resolution.
Each cluster observation was interleaved every 15 minutes with data towards a bright, unresolved source to correct for variations in the instrumental gain. Absolute calibration was undertaken with observations of Mars. The raw data were exported in MIRIAD form and converted into a MATLAB format in order to be processed by the CARMA in-house data reduction software, which removes bad data points (e.g. visibilities that are shadowed, obtained during periods of sharp rises in system temperature or when the instrumental response changes unexpectedly or without calibrator data) and corrects for instrumental phase and amplitude variations; for further details see Muchovej et al. (2007). The output file from the pipeline contains calibrated visibilities ()—the response of the interferometer for a single baseline or the Fourier transform of the sky brightness distribution times the primary beam—which, for small FoVs like that of the CARMA-8 pointed observations, can be approximated by :
| (1) |
where is the normalized antenna beam pattern, is the sky intensity distribution, and are the baseline lengths projected on to the plane of the sky, and and are the direction cosines measured with respect to the axes. The interferometer only measures some visibility values in the -plane. Hence, the array returns a sampled visibility function , where is a function known as the synthesized beam that equals one for sampled visibilities and zero otherwise. By applying an inverse Fourier transform to the sampled visibilities measured by the array, the sky image (or dirty map) can be recovered. In order to reconstruct the sky brightness distribution from an incomplete visibility map, we use a deconvolution algorithm: CLEAN (Högbom et al., 1974).
3.2 Radio Source Contamination
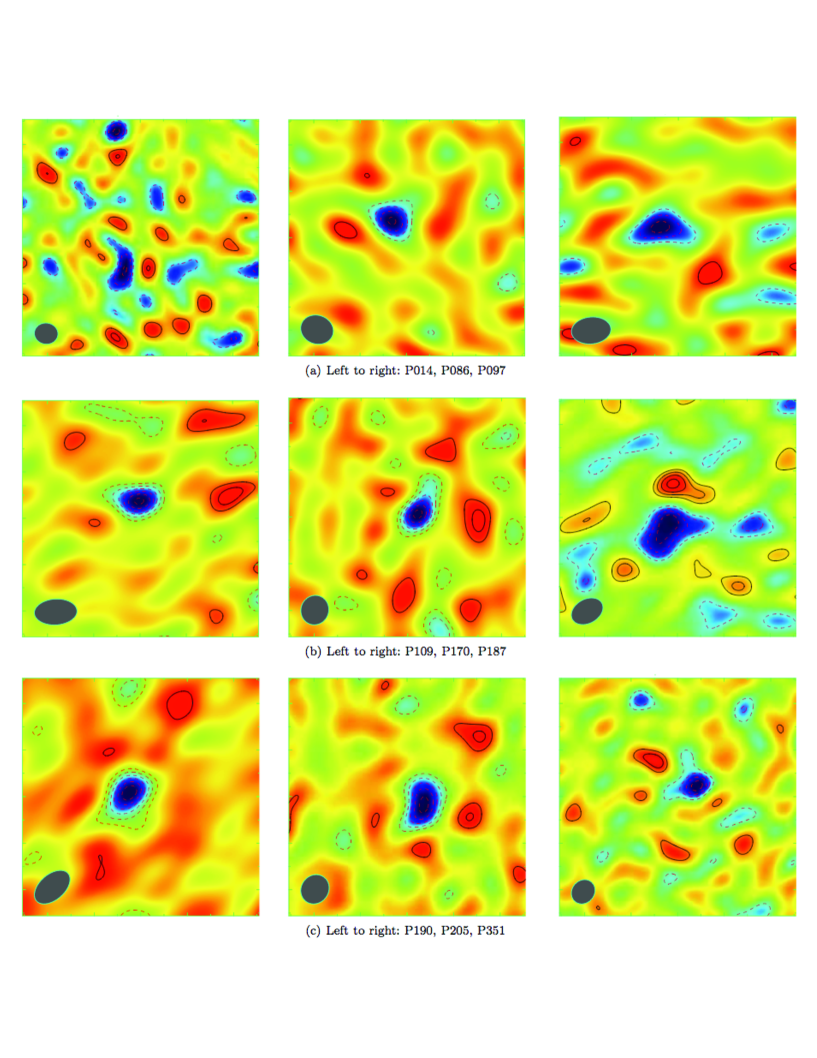
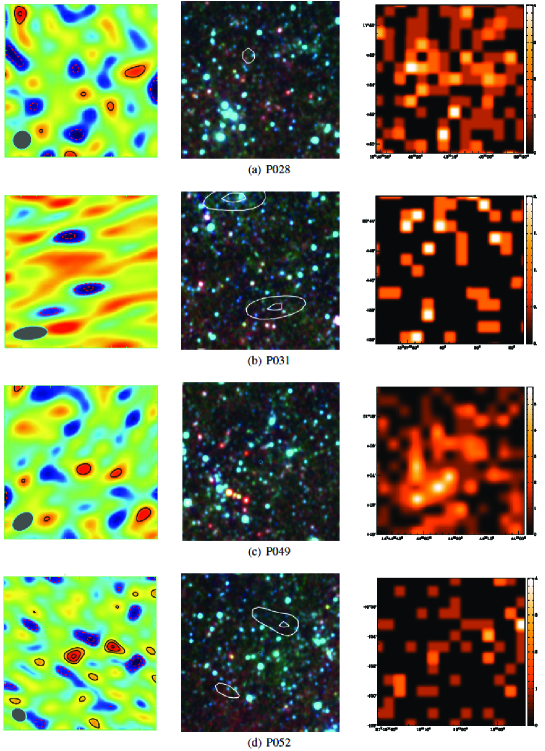
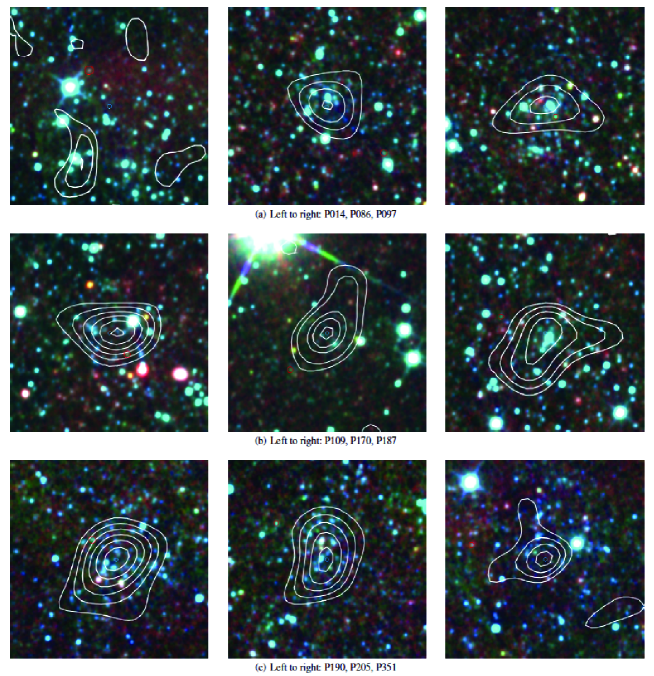
In order to remove contaminating radio sources from the SB data, the LB CARMA-8 data were used to identify the location of the compact radio sources and provide an initial estimate of their peak flux density. This initial set of source parameters was fit directly to the LB visibility data and the best-fit parameters were determined using the Difmap task Modelfit (Shepherd 1997). Using these best-fit parameters, the contribution to the SB data from detected LB radio sources was removed. Radio source-subtracted, CLEANed777CLEANing was undertaken with a tight box around the cluster signal, where present, otherwise no box was used. maps were produced, see Figure 2 for CARMA-8 SZ-detected clusters, and Figure 6 for candidate clusters without a CARMA-8 detection. Details on the SZ signal detected by CARMA and Planck are given in Table 2. For those CARMA-8 data that required the contribution from LB-detected radio sources to be removed, the reader should note that the source-subtracted SB images represent the map with the most-likely source parameters and, thus, uncertainties in the source parameters are not reflected in the final map. Given that the cluster and source parameters can be degenerate, a quantitative analysis should fit for the cluster and radio-source contributions jointly. This analysis is undertaken in paper II of this work (Rodríguez-Gonzálvez et al. in prep).
Compact radio sources were detected in the LB CARMA-8 towards 12 cluster candidates; information on their properties is provided in Table 3. The LB-inferred radio-source environment towards candidate clusters with a CARMA-8 detection is, for the most part, benign, such that it has little or no effect on the SZ signal in the source-subtracted SB data. We find that this is not the case for a large fraction of the candidate clusters without a CARMA-8 detection, particularly for P031, P049, P052, P057, P121 and P138.
Noise levels in our LB data (on average Jy/beam) are comparable to typical noise levels in NVSS ( Jy/beam) but, since radio sources tend to be brighter at lower frequencies, NVSS often provides a more complete image of radio-emitting sources. Hence, we predict the 31-GHz radio-source environment by extrapolating NVSS (‘fitted’) peak flux densities for radio sources located within 10′of our map centre assuming a value for the spectral index, . Our choice of is based on the average 1.4-to-31 GHz spectral index derived from matching sources in NVSS and our LB CARMA-8 data (Table 3). In Table 4 we present the position of those NVSS sources that, given our assumptions, we would expect to find at a significance of 4 or greater in the LB CARMA-8 data but, instead, remained undetected. A total of 4 radio sources satisfy these criteria. All but one of these sources (in the FoV of P109) are at ′from the map center, with a predicted, attenuated 31-GHz peak flux density of mJy and, hence, should have a negligible impact on the recovered SZ signal. Undetected sources in P109 have the potential to have the most impact on the recovered SZ signal, with a source expected to have an attenuated 31-GHz peak flux density of 4.0 mJy an arcminute away from the map centre. However, some of these sources could be varying, or could have flatter or inverted spectra, implying they could be brighter at 31 GHz than our predictions in Table 3. To estimate the contribution from radio sources below our detection threshold ( mJy/Beam), we use a study by Murphy & Chary (2014, in prep.), which stacks 30-GHz Planck data at the position of NVSS-detected radio sources of similar flux density. We expect to suffer from of contamination from confused radio sources, which would account for of the peak SZ decrement of our clusters (Table 2).
3.3 CARMA SZ Detections
Eight of the targeted 19 cluster candidates were detected with a peak beam-corrected SZ-flux-density with an SNR (Table 2)888The SNR for the CARMA SZ detections was calculated as the ratio of the peak decrement, after correcting for beam attenuation, and the rms of the SB data.. We also found one tentative detection with an SNR of 4.2, which we deem tentative due to uncertainties in the data (see Appendix B). Clusters have been classified as detections based on the inspection of the SB and LB CARMA-8 maps, taking into consideration ancillary data, which will be presented in detail in Section 4.1. For each cluster candidate we describe in Appendix B the CARMA-8 data, including the SZ signal and the radio-source environment.
The primary-beam-corrected peak flux density of the SZ decrements in the CARMA-8 data (after source subtraction, where necessary) ranges between -1.5 and -4.2 mJy/beam, where P014—a marginal detection—has the smallest decrement. The SNR of the SZ signals in the CARMA data ranges between 4.4 (for P097) to 7.8 (P190). The peak of the CARMA-8 SZ signals is within 2′of the Planck position for all systems but for P014, which is away (see Table 2).
3.4 Potential Reasons for CARMA-8 Non-detections of the Remaining Candidate Clusters
The data towards 10 cluster candidates did not show a significant decrement; though this does not provide conclusive evidence, in all cases, that the Planck cluster candidate is a spurious detection. A combination of factors could be responsible for the lack of an SZ signal in the CARMA-8 data (see Section 5.1 for comments on each of the undetected targets). These factors include, high noise levels in the SB data, confused radio sources (most relevant for observations with high rms in the LB data), poor subtraction of LB-detected radio sources and the cluster being significantly offset from the map centre, which results in strong beam attenuation. For example, a cluster with a relatively low peak-flux density of mJy/beam, at 3′(at 4′) from the map centre would have a flux density on the CARMA SB map of -1.2 mJy/beam (-1.0 mJy/beam). Given that the typical range of rms values in the CARMA-8 SB data range between and 600 Jy/beam, such a signal would have, at best, an SNR () and, hence, would not be registered as a solid detection. This highlights one of the challenges of high-resolution interferometric follow-up of clusters detected by a large beam experiment such as Planck. Radio sources are often the dominant contaminant to the CARMA-8 observations. If they are not subtracted properly or they are not detected above the background noise—and, therefore, are not accounted for—they can fill and/or distort the SZ decrement.
| Cluster ID | CARMA-8 | Planck | ROSAT | Real? | ||
|---|---|---|---|---|---|---|
| Radio Contamination | SB Data | SNR | ISMc | |||
| P028 | ✗ | ( mJy/beam)a | 5.1 | ✓ | ✗ | Unlikely |
| P031 | ✓ | ( mJy/beam)b | 4.1(I) | ✓✓ | ✗ | Unlikely |
| P049 | ✓✓ | ( mJy/beam) | 4.3 (I) | ✗ | ✓ | Likely |
| P052 | ✓ | ( mJy/beam) | 5.1 (I) | ✓✓ | ✗ | Unlikely |
| P057 | ✓✓ | ( mJy/beam) | 4.6 | ✗ | ✗ | Unknown |
| P090 | ✗ | ( mJy/beam) | 5.4 | ✗ | ✓ | Likely |
| P121 | ✓✓ | ( mJy/beam) | 5.6 | ✗ | ✗ | Unknown |
| P134 | ✗ | ( mJy/beam) | 5.0 | ✗ | ✗ | Unknown |
| P138 | ✓✓ | NAd | 5.1 | ✓ | ✓ | Likely |
| P264 | ✗ | ( mJy/beam)b | 4.2 (I) | ✓ | ✗ | Unlikely |
-
•
(a) The map contains several other negative features of similar SNR.
-
•
(b) The negative features coincide with features from interference or sidelobe patterns.
-
•
(c) One (two) tick marks refer to 100 micron emission greater than 1 MJy/sr (3 MJy/sr).
-
•
(d) This information is not meaningful for P138 given the poor coverage and high rms of the CARMA-8 SB data towards this system.
4 Validation
We discuss the reliability of the cluster candidates in our sample by (1) searching for evidence for the presence of a cluster in catalogs in the literature and as excess emission in the ROSAT X-ray data and (2) by considering the effects of ISM contamination to the Planck data.
4.1 Confirming the Presence of a Cluster in the CARMA-8 Data through Ancillary Datasets
Cluster Catalogs in the Literature:
In Table 10 we provide details on known clusters found in the SIMBAD database (Wenger et al., 2000) and in the Wen et al. (2012) SDSS-based catalog within 4′of the map center of our observations. At least one such match was found for thirteen of our clusters candidates. The CARMA-8 SZ signal for four of the systems in our sample—P170, P187, P190 and P205—coincides with the location of a registered overdensity of galaxies from Wen et al., with redshift estimates ranging from to ; though only P187 has spectroscopic confirmation.
Seven of our cluster candidates without a CARMA-8 SZ signal were found to have a known cluster (or cluster candidate) within 4′of the map center. In most cases, the lack of a CARMA-8 SZ signal towards these systems can be attributed to a combination of one or more of the following: challenging radio-source environment, high rms of the SB visibility data, primary-beam attenuation and insufficient ICM cluster mass (deduced from the X-ray data or estimated from the richness value). For further details on each CARMA-detected system see Appendix B, and Section 5.1 for the remaining systems .
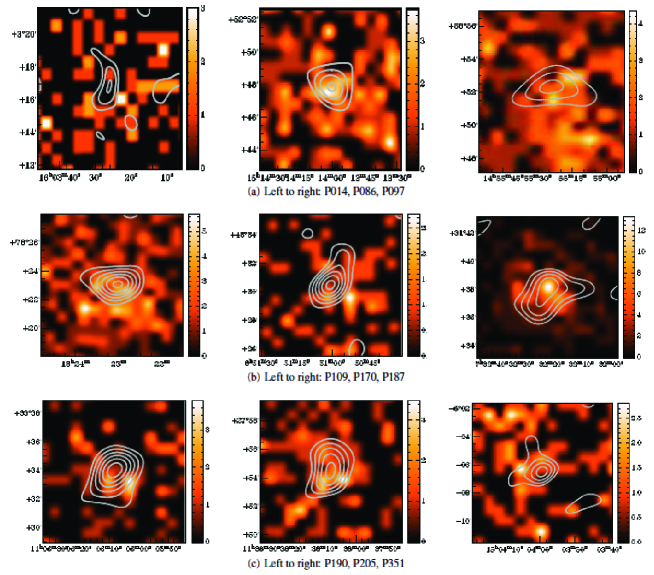
ROSAT X-ray data:
ROSAT X-ray images for each of our cluster candidates without (and with) a CARMA-8 SZ detection are provided in Appendix A (and Appendix E). For the eight candidate clusters with a clear CARMA-8 detection, there is compelling evidence for X-ray cluster emission within a few arcminutes towards all of them, though the peak of the X-ray emission lies outside the CARMA SZ contours for two systems, P109 and P170. For P014—the candidate cluster with the tentative CARMA detection—there is no support for the presence of a cluster from the ROSAT image. Regarding the cluster candidates without a CARMA SZ detection, three seem to have evidence for extended X-ray emission in the ROSAT data: P049, P090 and P138.
4.2 Investigating 100-micron ISM contamination in the Planck data
Planck uses a multifrequency matched filter to detect both the SZ increment and the SZ decrement from a cluster. Due to strong ISM contamination in the upper frequencies (353, 545, 857 GHz), the SZ increment may be biased high, resulting in a spurious detection, especially if the ISM emission falls on top of a CMB cold spot. In Table 2 the 100-micron emission within from the pointing centers of the CARMA-8 cluster observations is provided. The mean 100-micron emission is MJy/sr towards clusters without a CARMA-8 detection and MJy/sr for those with a clear detection. Hence, the presence of this foreground does not correlate strongly with detectability, at least for cluster candidates in our sample. The candidate cluster suffering from the highest ISM contamination is P014 with MJy/sr. This system also shows the largest positional offset between the Planck and CARMA-8 data but the ISM contamination is not sufficient, in this case, to account alone for such a large discrepancy.
5 Discussion
5.1 Are any of the Candidate Clusters without a CARMA-8 Detection likely to be real?
We investigate the likelihood of the candidate clusters without a CARMA-8 detection being real clusters by considering all the relevant data available to us. That is, we consider the
ensemble of the CARMA-8 data (Table 1), the NVSS catalog of radio sources (Table 4), the Planck data (Table 2), contamination in the Planck data from the 100-micron emission (Table 2), ancillary data (Section 4.1) including the ROSAT images (Appendix A and E) and evidence in the literature for the presence of other clusters within 4′of the map center of the CARMA images (Table 10). A summary of these results is given in Table 5.
P028: radio-source contamination in the CARMA-8 data is low. In the SB data there is a 2 negative feature away from the pointing centre but this is not an isolated 2 feature in the map. The SNR in Planck is quite high, 5.1, but could be affected by ISM emission ( MJy/sr). No X-ray emission is seen in the ROSAT image. It seems unlikely that there is a single massive cluster associated with P028. But, since there are three low-mass (candidate) clusters cataloged in the literature within 3′ of the CARMA-8 observations, with , it could be that Planck picks up a combined SZ signal due to its large beam size.
P031: has no decrement in the CARMA-8 data that could reliably be attributed to a low-SNR SZ signature, since the ones present in the map are likely to be a product of the inadequate subtraction of an extended radio source. The Planck data yields a low SNR cluster signal and suffers from high ISM contribution. There is no cluster detection in the ROSAT image. Thus, we conclude that, most likely, this is a spurious Planck cluster candidate.
P049: the challenging radio-source environment could be responsible for the lack of a CARMA-8 detection towards P049. The SNR in Planck is moderate, but contamination from ISM emission is low, which reduces uncertainties in the SNR value. The ROSAT image shows extended X-ray emission, with three point sources—a strong indication that there is a cluster towards P049.
P052: a ( mJy/beam) feature is detected in the radio source-subtracted SB data within 2′ of the pointing centre. The high level of radio-source contamination could be filling in partly an SZ decrement. This system appears in the Planck data with an SNR of 5.1, but these data suffer from high ISM emission. No X-ray cluster emission is seen in the ROSAT data. Overall, P052 does not seem a robust cluster candidate.
P057: radio-source contamination in the CARMA data is substantial. The SNR in Planck is moderate and no cluster signal is seen in the ROSAT image.
P090: there is a clear cluster detection in the ROSAT data. The x-ray counts in these data are higher over a similar area than for another cluster P187 (Abell 586), which has an estimated mass within —the radius at which the mean gas density is 200 times the critical density—of (AMI Consortium: Rodríguez-Gonzálvez et al. 2012), according to SZ measurements by the Arcminute Microkelvin Imager (Zwart et al. 2008). P090 has an SNR of 5.6 in the Planck data, which have negligible ISM contamination. Given all of this, it is surprising that, despite the seemingly benign radio-source environment and the low rms in the SB data, there is no clear SZ detection in the CARMA-8 data.
P121: has a moderate SNR in the Planck Union catalog with low contamination from ISM emission. The CARMA-8 data is strongly affected by radio-source foregrounds and there is no sign of cluster-like X-ray emission in the ROSAT data.
P134: has a Planck SNR of 5.0, which should not be greatly affected by ISM emission. There is no indication of the presence of a cluster in the ROSAT data. Regarding the CARMA results, radio contamination is negligible and, while the rms is high, Jy/beam, we would expect to detect a massive ( mJy/beam) cluster at and yet not even a 2 negative feature is seen within 3′of the map center.
P138: has an SNR of 5.1 in the Planck Union catalog, with little impact from ISM emission. This, together with the detection of extended X-ray emission in ROSAT, deem P138 a robust cluster candidate. The lack of a CARMA-8 detection is not surprising given the complications with radio-source foreground removal and the exceedingly high rms and poor coverage due to the limited amount of data available towards this system.
P264: is most likely a spurious cluster candidate. The Planck data suffer from significant ISM contamination and yield a low SNR for P264. The ROSAT image shows no evidence of a cluster nor do the CARMA-8 data, despite the reasonable rms and benign radio-source environment.
6 Redshift Estimation
The higher resolution CARMA-8 data showed that the putative BCG, on whose photometric redshift we relied on to select our cluster candidates, did not lie within the CARMA-8 SZ contours for all but three of the systems: P097, P109 and P190, see Appendix D. We now explore their plausible redshifts derived from photometric criterion. This is an independent approach, parallel to the XMM follow-up of Planck clusters, which has yielded redshifts of many Planck-selected clusters (Planck Collaboration et al., 2013 XXIX). We note that this analysis would be challenging to undertake without the CARMA-8 data since the location of the cluster would not be precisely known and, thereby, the galaxy counterparts might be difficult to identify.
6.1 The WISE Color Criterion
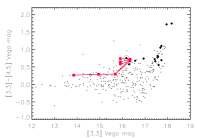
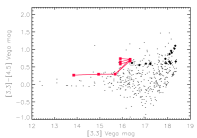
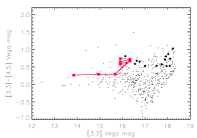
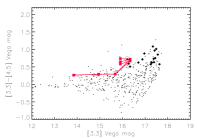
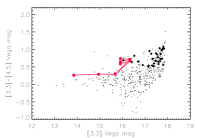
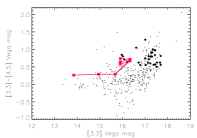
In Figure 9 (and 10) we explore the color-magnitude distribution of WISE sources towards candidate clusters with (without) a CARMA detection within 2′of the CARMA (Planck) centroid. There does not appear to be any apparent difference in the number of red WISE galaxies for the CARMA detected and undetected clusters (Table 9). We overlay the tracks for a passively evolving starburst of mass 10, and an e-folding timescale of star formation of 100 Myr using three formation redshifts for the burst. WISE objects satisfying the MIR color criterion are shown as solid diamonds. The position of the brightest red object fainter than 15.8 mags at 3.4 microns is circled. The colors of this red object had suggested that P014, P170, P187, P190 and P205 would be at using the AB mag criterion. However, this object was found to lie outside the CARMA-8 SZ contours in all but three of the detected systems. With the CARMA-8 data in hand, we searched the WISE catalog for the brightest red object within 2.5 of the CARMA-8 SZ centroid; however, that only served to add P109 to the list of candidate clusters.
6.1.1 Reliability of WISE colors to identify Clusters?
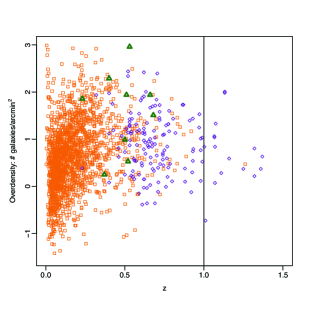
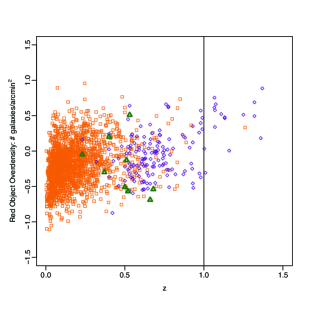
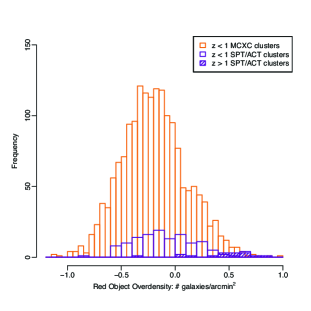
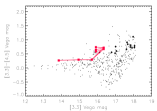
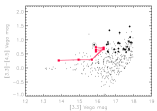
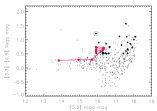
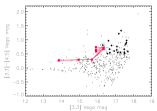
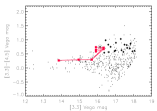
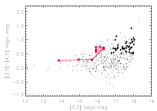
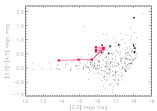
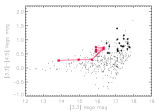
Selection of high redshift () objects based on WISE or Spitzer colors has been discussed extensively in e.g., Papovich (2008), Gettings et al. (2012), Muzzin et al. (2013) and Rettura et al. (2014). We explore further the reliability of the WISE mid-IR color criterion in Figure 3 by looking at the relation between redshift and overdensity of WISE objects for a sample of clusters spanning a wide redshift range, . We use two overdensity measurements - one which considers all WISE objects (left panel) and another which only considers the red WISE objects i.e., those that satisfy AB mag (middle panel). The orange squares represent the 345 X-ray-detected clusters from the MCXC catalog (Piffaretti et al. 2011). Clusters discovered by SPT and ACT (Williamson et al. 2011, Marriage et al. 2011, Reichardt et al. 2013 and Hasselfield et al. 2013) with (where some of these redshifts are photometric), are displayed in purple diamonds. Planck cluster candidates selected in this study with a CARMA-8 detection are represented by green triangles. For our cluster candidates, we use the SDSS-derived redshifts from Table 7. The overdensities have been calculated as the average density of WISE sources within a radius of from the MCXC, SPT/ACT and CARMA centroids (as appropriate) minus the average density of sources in an annulus with inner and outer radii of and . The mean WISE-all (and red-only) object overdensity for the MCXC clusters is 0.7 (-0.2) galaxies/ arcmin2, with a standard deviation of 0.8 (0.3); for the CARMA-8 detections it is 1.6 (-0.23) galaxies/ arcmin2, with a standard deviation of 0.9 (0.4) and for the SPT/ACT clusters it is 0.9 (-0.1) galaxies/ arcmin2, with a standard deviation of 0.6 (0.3) for systems at and 0.73 (0.4), with a standard deviation of 0.7 (0.3) for those at . Although we do not know if all the WISE objects are associated with the clusters, in a statistical sense, the average WISE-object overdensities for the different cluster sets suggests that our CARMA-8-detected clusters are likely to be massive systems. A strong correlation between WISE all object overdensity with redshift is not expected, though some selection effects could be manifesting themselves in the plot e.g., the highest redshift, X-ray-selected clusters are likely to be particularly massive, if they were serendipitous X-ray detections, and confusion in the WISE data is likely to have the highest impact at higher redshifts. The red object criterion should be preferentially selecting objects and, hence, we should expect a significant rise in the WISE red-object overdensity for systems at . While we do indeed see a rise in Figure 3, middle panel, the histograms in the rightmost panel indicate that contamination levels are high. These contamination levels estimated from the positive-inversion of the negative side of the red-object overdensity histograms for systems suggest that relying exclusively on red-object WISE overdensities for selecting clusters can be risky. We also find that there are some low redshift () clusters that have large red-object overdensities. Again, this could be due to contamination. Otherwise, there may be an additional cluster within our 2′radius. There are also cases where background, unassociated objects could be producing an overdensity of red sources, in particular if a massive cluster is acting as gravitational lens, since such an effect would promote the detection of higher galaxies located behind the cluster that would otherwise remain undetected. It is also known that the (AB mag) color selection of objects can sometimes misidentify low-redshift systems. Possible scenarios where an object might be falsely identified as red include, when the presence of an AGN leads to a rise in the galaxy SED at microns or when the 3.3-micron polycyclic aromatic hydrocarbon (PAH) emission line in star-forming galaxies at a range of below 1 falls in the 4.6-WISE band (see e.g., Stern et al. 2012 and Assef et al. 2013 for methods on how to identify AGN in WISE data). A targeted spectroscopic campaign in these cluster fields will be able to distinguish between these possibilities.
6.2 The SDSS Criterion
6.2.1 Calibrating the SDSS photometric Redshift using a Subset of MCXC Clusters
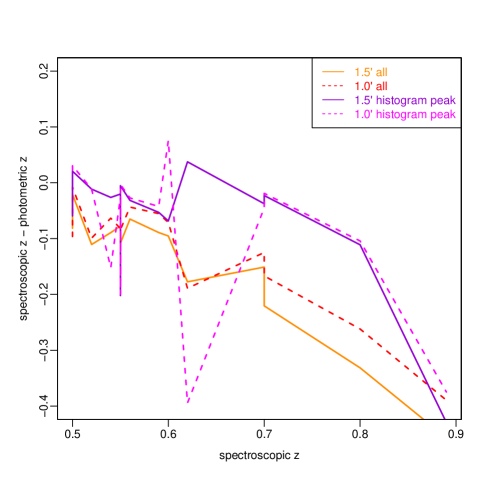
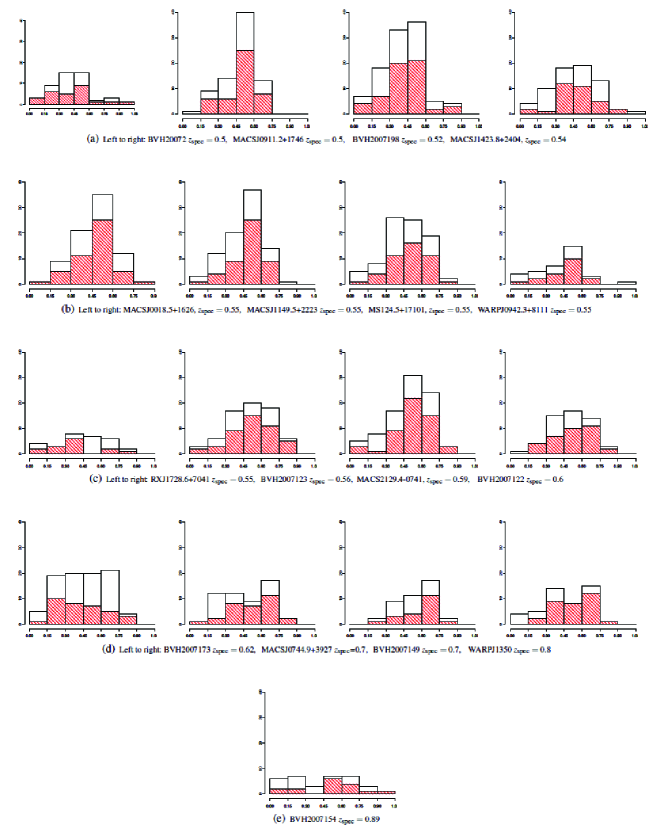
We investigated the validity of using SDSS photometric redshifts, henceforth , of galaxies in the vicinity of known clusters to estimate the cluster redshift. To do this, first we selected clusters in the MCXC catalog (Piffaretti et al., 2011) with and spectroscopic redshift , in order to produce a cluster sample with similar properties to those expected for the Planck-discovered candidate clusters in this work. Secondly, we obtained s from SDSS for all the galaxies within 1.5′ and 1′ of the MCXC cluster centroid. Histograms for the distribution of s within these two radii for each of the selected MCXC clusters are shown in Figure 11.
We used two methods to estimate a value for the cluster and applied each method to the 1.5′and 1′ results; the results for each method together with the spectroscopic cluster redshift are provided in Table 6. For the first method (‘All’), we took the mean of all the measurements; for the second method (‘histogram peak’), we took the mean of the s for objects lying in the histogram bin with the highest counts (Figure 11). The difference between the cluster and the -estimate for each of the methods is plotted in Figure 4 as a function of for the MCXC clusters in Table 6. Uncertainties are not included in this plot for clarity but typical errors in the galaxy s in SDSS are .
From Figure 4, it can be deduced that, regardless of the method employed, beyond , the photometric estimates do not provide a good match to the spectroscopic redshift, likely due to the poor sensitivity of SDSS in this redshift regime, although this is based on two data points only. This figure also shows that typically the SDSS estimates are larger than the spectroscopic values. Closer inspection of the distribution from Figure 11 shows that, for the systems, the histograms flatten out over a large portion of the redshift range. On other hand, until the (mean, absolute) differences between the photometric and spectroscopic redshifts is reasonably small, , and the histograms tend to have narrow peaks (with typical widths of ). The exception being RXJ1728.6+7041. We find that the second method, when searching within a radius of 1.5′, provides the photometric redshifts closest to the spectroscopic value throughout most of the sampled redshift range; with the mean, absolute difference for the whole redshift range sampled being 0.08 and 0.06 for . However, as appealing as this result might be, the number of clusters in this study are scarce and thus it cannot provide conclusive evidence as to whether the sole use of SDSS photometric redshifts can be used in a widespread fashion to estimate redshifts for clusters in the intermediate-to-high regime.
| MCXC | SDSS-DR9 | SDSS-DR6 | ||||
|---|---|---|---|---|---|---|
| Name | All | Histogram Peak | (Wen et al. 2012) | |||
| (1.5′) | (1′) | (1.5′) | (1′) | |||
| BVH20072 | 0.50 | 0.42 | 0.40 | 0.36 | 0.52 | NA |
| MACSJ0911.2+1746 | 0.50 | 0.48 | 0.49 | 0.52 | 0.53 | NA |
| BVH2007198 | 0.52 | 0.41 | 0.42 | 0.51 | 0.51 | 0.4960 |
| MACSJ1423.8+2404 | 0.54 | 0.45 | 0.48 | 0.51 | 0.39 | 0.5197 |
| MACSJ0018.5+1626 | 0.55 | 0.47 | 0.47 | 0.53 | 0.52 | 0.5602 |
| MACSJ1149.5+2223 | 0.55 | 0.46 | 0.49 | 0.53 | 0.52 | 0.5603 |
| MS1241.5+1710 | 0.55 | 0.47 | 0.49 | 0.39 | 0.52 | 0.5572 |
| RXCJ1728.6+7041 | 0.55 | 0.44 | 0.37 | 0.35 | 0.35 | NA |
| WARPJ0942.3+8111 | 0.55 | 0.44 | 0.47 | 0.54 | 0.55 | NA |
| BVH2007123 | 0.56 | 0.49 | 0.52 | 0.53 | 0.53 | 0.5839 |
| MACSJ2129.4-0741 | 0.59 | 0.50 | 0.52 | 0.54 | 0.55 | 0.6324 |
| BVH2007122 | 0.60 | 0.50 | 0.53 | 0.53 | 0.68 | 0.6055 |
| BVH2007173 | 0.62 | 0.44 | 0.43 | 0.66 | 0.23 | 0.5470 |
| BVH2007149 | 0.70 | 0.55 | 0.58 | 0.66 | 0.65 | NA |
| MACSJ0744.9+3927 | 0.70 | 0.48 | 0.49 | 0.68 | 0.68 | NA |
| WARPJ1350.8+6007 | 0.80 | 0.47 | 0.54 | 0.69 | 0.70 | NA |
| BVH2007154 | 0.89 | 0.43 | 0.50 | 0.46 | 0.52 | NA |
-
•
(a) When calculating the photometric redshift estimate using method 2 (i.e.. from the histogram peak) for histograms with multiple peaks, we took the mean value for all the objects in all those bins.
6.2.2 Application of the SDSS photometric Redshifts to the CARMA-detected Clusters Candidates
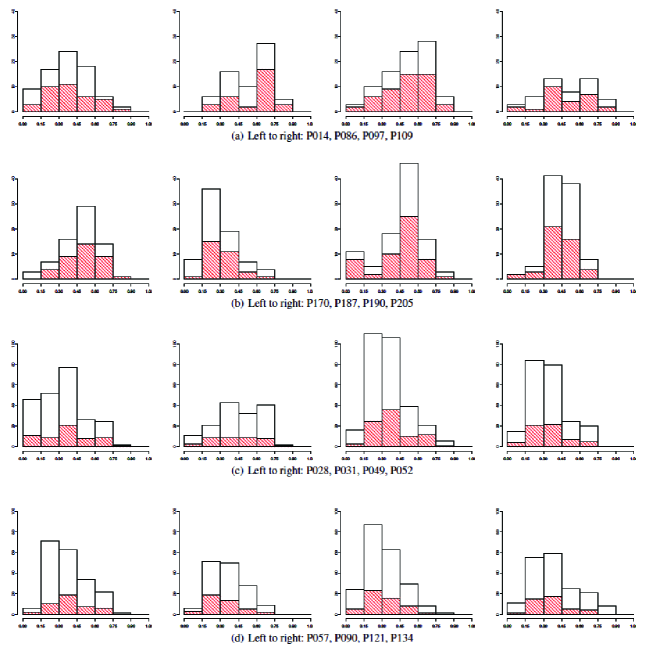
Histograms for the distribution of SDSS galaxy s within 1 and 1.5′of the CARMA cluster centroids are given in Figure 12. Comparing the number of SDSS objects found in the peak bin of the histograms for our CARMA-detected clusters and the selected MCXC clusters, shows that the former are very likely to be very massive systems since mass is expected to be correlated with optical richness. For four clusters, P170, P187, P190 and P205, the histograms shows a distinctive narrow peak; for two clusters, P014 and P097, such a feature is not as prominent; and for P086 the distribution is bimodal while for P109 it is almost uniform out to . The mean estimates for the three methods outlined in the previous section are provided in Table 7. The mean for all CARMA-detected systems from our sample using method three with a radial search of 1.5′—the preferred method from results in Section 6.2.1—is ; results from this method are highlighted in Table 7.
We expect the histograms in Figures 11 and 12 to be biased towards low-redshift objects, since the sensitivity of SDSS drops as a function of redshift and the catalog is not expected to be very complete at (e.g., Montero-Dorta & Prada 2009). Hence, for clusters like P014 and P187 with the distribution leaning towards , it is hard to rule out completely the possibility of a chance superposition of a low and a high redshift cluster without deep spectroscopic data. Though the lack of significant peaks in the distribution at higher redshifts,—-where ‘significance’ is measured in terms of total number of galaxies in the ‘peak’ bin and relative to the other bins—is a strong indication that that is the likely, approximate redshift of the cluster.
To investigate the possibility of a higher-redshift cluster being associated with our cluster candidates, we found out how many of the SDSS objects towards each system had a matching WISE object within 3″(FWHM of the WISE short channels ″). If there was a high redshift cluster that was not seen in the relatively shallow SDSS data, there should be an overdensity of WISE red objects without an SDSS counterpart999WISE objects with two or more blended components or flagged as extended were removed. (see Table 8; note that for this overdensity calculation, unlike for earlier ones, no background galaxy contribution has been applied, since SDSS objects have been removed on the basis that they are likely to be low- interlopers). P170 has the largest overdensity of WISE, red, unmatched objects and P187 the lowest, which provides further evidence that this cluster is indeed Abell 586 at . It is surprising that P109, a cluster that displayed an unconstrained SDSS galaxy- distribution compared to P187 (Figure 12), has an overdensity of these objects as low as 0.29 arcmin-2. One possibility is that the cluster is between ; then it might not have many objects that satisfy the MIR color criterion nor that are detected in SDSS. Alternately, most of the galaxies of this cluster may be below the WISE detection threshold, or confused by foreground sources within the large beams of the short-wavelength channels, which is more likely to happen in systems. Thus, based on our analysis of SDSS photometric redshifts, the WISE MIR color criterion that we initially adopted appears to overestimate the redshifts of our detected clusters; however spectroscopic confirmation that we have undertaken, is required for a definitive confirmation.
| Cluster | ||||
|---|---|---|---|---|
| ID | All | Histogram peak | ||
| (1.5′) | (1′) | (1.5′) | (1′) | |
| P014 | 0.38 | 0.39 | 0.37 | 0.36 |
| P086 | 0.54 | 0.55 | 0.66 | 0.65 |
| P097 | 0.52 | 0.51 | 0.68 | 0.68 |
| P109 | 0.48 | 0.48 | 0.52 | 0.38 |
| P170 | 0.48 | 0.50 | 0.53 | 0.53 |
| P187 | 0.30 | 0.31 | 0.23 | 0.24 |
| P190 | 0.46 | 0.45 | 0.51 | 0.51 |
| P205 | 0.46 | 0.44 | 0.40 | 0.39 |
| Cluster | WISE | SDSS | WISE | Red WISE |
| ID | Objects | Objects | Objects with no | Objects with no |
| SDSS Match | SDSS Match | |||
| (overdensity /′2) | ||||
| P014 | 34 | 76 | 16 | 8 (1.13) |
| P086 | 61 | 64 | 26 | 3 (0.42) |
| P097 | 62 | 87 | 26 | 9 (1.27) |
| P109 | 50 | 48 | 26 | 2 (0.28) |
| P170 | 56 | 70 | 26 | 13 (1.84) |
| P187 | 43 | 74 | 23 | 1 (0.14) |
| P190 | 55 | 99 | 15 | 8 (1.13) |
| P205 | 58 | 94 | 9 | 7 (0.99) |
| P351 | 44 | NA | 44 | 10(NA) |
6.3 Photometric Redshift Summary
-
•
P014: the redshift estimate for P014 is unclear. The histogram of SDSS is one of the least strongly peaked from our sample, peaking at , and the overdensity of red WISE objects without an SDSS counterpart is the third largest in our sample (). It does not have an associated known cluster.
-
•
P086: The distribution of SDSS s has a peak redshift bin around that contains almost 30 galaxies while the next highest-count redshift bin is at a much lower , between 0.3 and 0.45 with galaxies less. The overdensity of red WISE objects with no matching SDSS source is very small galaxies/arcmin2. No known cluster is associated with P086. It is therefore likely that the redshift for P086 is around .
-
•
P097: The majority of the SDSS s lie in two bins ranging from 0.45 and 0.75, which amount to a large number of objects (56). The overdensity of red WISE objects without an SDSS counterpart is the second highest in the sample with galaxies/arcmin2. No known cluster lies within the CARMA SZ contours. The significant number of SDSS sources at intermediate redshifts, suggests that this cluster has a redshift of . We now have spectroscopic data on this cluster which is being processed.
-
•
P109: The redshift estimate for P109 is unclear. The SDSS histogram for this cluster is almost uniformly distributed, with few counts per bin, always below 12. Yet the number of unmatched red objects in WISE is quite small, only galaxies/arcmin2 as is the overdensity of red objects in WISE. This system does not have an associated known cluster.
-
•
P170: The distribution of SDSS s has a distinct, strong peak around , which is in good agreement with the measured photometric redshift of an SDSS-identified cluster candidate system, WHLJ085058.7+483003, at (Wen et al., 2012) lying within the CARMA SZ contours. Though this is the most likely redshift for P170, it does have the largest overdensity of red WISE objects without a match in SDSS ( galaxies/arcmin2) and the largest red-object overdensity in WISE of the entire sample, which suggests its at .
-
•
P187: The SDSS distribution of s has a sharp peak at . The centroid for the known cluster Abell 586 (at ) is only away from the CARMA SZ peak. We found only two red WISE objects without an SDSS counterpart. Hence, P187 is most definitely Abell 586 and there is no evidence for a line-of-sight cluster at a higher .
-
•
P190: This system has a clear peak in the histogram of SDSS s, peaking at . The counts in this ‘peak’ bin () are the largest for all our of CARMA-detected clusters. The location of our SZ contours coincide with the position of an identified SDSS cluster candidate with a (WHLJ11608.5+333340; Wen et al. 2012). The overdensity of red WISE galaxies with no SDSS match is of galaxies/arcmin2. Hence, we expect the redshift of P190 to be .
-
•
P205: The majority of the SDSS s lie in two bins ranging from 0.3 and 0.6, which amount to a large number of objects (). A known SDSS cluster candidate with (WHLJ113808.9+275431; Wen et al. 2012) is located within the CARMA SZ contours. However, from the relation between the cluster mass and the r-band SDSS luminosity within from Wen et al. (2012), the cluster is expected to have . Such a low-mass cluster would not detectable in our CARMA data. The overdensity of red WISE galaxies with no SDSS match is of galaxy/arcmin2. Hence, without much evidence for a higher redshift galaxy overdensity, we expect the redshift of P205 to be .
-
•
P351: We do not estimate a redshift for P351 as there is no SDSS coverage towards this system.
6.4 Improvements to the selection strategy for detecting high redshift, Planck-discovered cluster candidates with CARMA
Our primary goal of this project was to attempt to identify the highest redshift, massive cluster by cross-correlating the Planck SZ-cluster catalogs and WISE galaxy catalogs.
The two main drivers in the selection of our clusters, which were found to have a large overdensity of sources in the WISE early data release, as well as a bright red object satisfying the MIR color criterion, were:
-
•
(1) the size of the WISE overdensity
-
•
(2) the SNR in the Planck data.
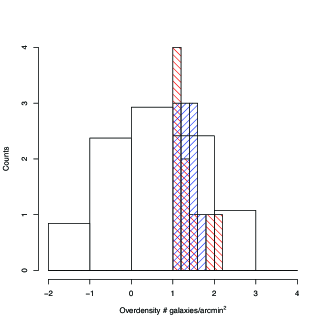
In Figure 5 we investigate if any of these two quantities correlate well with clusters with an SZ detection in the CARMA-8 data. In the left panel we show the histogram for the distribution of WISE-object overdensities for all Planck cluster candidates, which has a mean value and standard deviation (s.d.) of 0.54 and 0.59. Overlaid are histograms of the WISE overdensities for cluster candidates in our follow-up sample with and without CARMA SZ detections. The average overdensity (and s.d.) towards CARMA-8-detected systems is 0.95 (0.59), and 0.83 (0.43) for those that were not detected. Hence, the WISE-object overdensity centered at the Planck position, within a large (4.75′radius, see Section 2), appears to only be a marginal way of selecting Planck candidates that are likely to be detected in a short ( hr) CARMA-8 observation. Since the overdensity was initially calculated within a very large radius, due to the size of the Planck beam, but all but one of our CARMA detections were within 2′, we re-calculated the WISE overdensity within 2′, see Table 9. Narrowing the overdensity radius changed the over density values to 1.31 and 1.01.1 for the detected and undetected clusters. Applying the red color cut corresponding to the previously discussed MIR criterion to the WISE galaxies does not preferentially result in detectability (Table 9). It therefore appears that the density of WISE galaxies cannot be used as a metric to preferentially detect Planck cluster candidates in ground-based SZ follow-up observations.
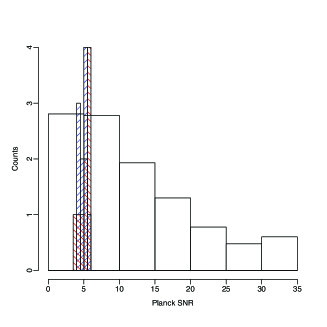
In the right panel of Figure 5 the Planck SNR has been plotted for all Planck cluster-candidates and, overlaid, are the Planck SNRs for clusters with a CARMA-8 detection and without. Clusters that have been detected in the CARMA-8 data tend to have the highest Planck SNRs, as would be expected, showing that Planck SNR does correlate well with detectability in our CARMA observations. Out of the clusters in our sample, 6 do not have a match in the Union catalog: P031, P049, P052, P264, P097, P351. These 6 clusters have Planck SNRs ranging from 3.8 to 5.1. There are also 6 clusters: P028, P057, P090, P121, P134 and P138, that appear in the Union catalog with SNRs between 4.6 and 5.6 but were not detected in the CARMA-8 data. The next Planck SZ-catalog scheduled for released later in the year and based on the full mission data, will provide a more comprehensive picture of reliability as a function of SNR in the Planck catalogs.
7 Conclusions
CARMA 31 GHz-data were collected towards 19 candidate clusters identified in Planck data, which were selected to have a significant ( galaxies/ arcmin2) overdensity of objects in the WISE early data release and a bright (but fainter than 15.8 mags at 3.4 microns), red ( - AB mag) object—the putative BCG—within from the Planck position. After removal of foreground radio sources identified in the long baseline CARMA-8 data, we detect eight clear () SZ signals—most of which are associated with substantial extended X-ray emission in ROSAT—and one tentative signal in the short-baseline CARMA-8 data. The 8 clear SZ decrements are, on average, offset from the map center (and Planck position) by and have peak primary-beam-corrected flux densities ranging from -2.1 to -4.2 mJy; the tentative detection towards P014 is offset by and has a peak flux density of mJy.
Out of the 10 Planck cluster-candidates without a CARMA SZ signal, the likely causes for the lack of a robust detection towards 7 are contamination from radio sources and/or a high rms in the CARMA data. For one, P028, while the radio-source environment appears to be benign at 31 GHz, at 1.4 GHz it does not; given the rms of the high resolution CARMA-8 data towards this system, undetected radio sources could be filling a possible decrement. The CARMA-8 and NVSS data suggest that P090 and P264 should have been detected. We also explore the level of 100-micron ISM contamination to the Planck data. Based on this, together with results from CARMA and ROSAT, we conclude that, out of the cluster candidates without a CARMA detection, four are likely to be spurious and three are likely to be real, one of which is P090, as it has compelling, extended X-ray emission in ROSAT, comparable to that of Abell 586 (P187), which has a measured SZ mass of (AMI Consortium: Rodríguez-Gonzálvez et al. 2012) .
We find that, for our sample of objects, a CARMA-8 SZ detection is most likely to be obtained for candidate clusters with a higher SNR in Planck but not necessarily for those with a higher value of our estimate of WISE-object overdensity.
The high-resolution CARMA-8 data showed that, out of the SZ-detected systems, only three had the putative red BCG lying within the SZ contours. To shed light onto the possible photometric redshift of these systems, we produced histograms of the SDSS photometric redshifts of galaxies located within 1.5′of the CARMA SZ peak. We find that the histograms display a distinctive narrow peak for 4 systems and a less prominent peak for two more, while one system exhibited an almost uniform distribution and another a bi-modal distribution (SDSS data was missing for the remaining system). The average SDSS photometric redshift for cluster candidates detected in CARMA was . To test our methodology, we selected the 17 MCXC clusters with SDSS data, as well as and (properties that we expect our sample of cluster candidates to share). We find that, out to , the difference in spectroscopic and photometric redshifts is , for all but one cluster and that the method fails dramatically beyond , though the data are scarce in this regime.
Given that the evidence suggests that most of our cluster candidates are not systems, we investigated the fidelity of the (AB mag) color criterion for selecting such systems. We calculated the overdensity of red objects in WISE within 2′towards MCXC clusters and towards a selection of ACT and SPT-discovered systems at . We found that, as expected, on average the clusters had smaller red-object overdensities than those at . However, we also found that the contamination is high, such that using WISE red-object overdensities alone for the selection of clusters will likely result in the selection of many systems.
acknowledgements
We thank the staff of the Owens Valley Radio observatory and CARMA for their outstanding support; in particular, we would like to thank John Carpenter. Support for CARMA construction was derived from the Gordon and Betty Moore Foundation, the Kenneth T. and Eileen L. Norris Foundation, the James S. McDonnell Foundation, the Associates of the California Institute of Technology, the University of Chicago, the states of California, Illinois, and Maryland, and the National Science Foundation. Ongoing CARMA development and operations are supported by the National Science Foundation under a cooperative agreement, and by the CARMA partner universities. The Planck results used in this study are based on observations obtained with the Planck satellite (http://www.esa.int/Planck), an ESA science mission with instruments and contributions directly funded by ESA Member States, NASA, and Canada. This publication makes use of data products from the Wide-field Infrared Survey Explorer, which is a joint project of the University of California, Los Angeles, and the Jet Propulsion Laboratory/California Institute of Technology, funded by the National Aeronautics and Space Administration. We acknowledge the use of NASA’s SkyView facility (http://skyview.gsfc.nasa.gov) located at NASA Goddard Space Flight Center. We also wish to thank the referee for comments on this manuscript and Pedro Carvalho for useful discussions.
| Cluster | ( objects/ arcmin2) | ( objects/ arcmin2) | ||||
|---|---|---|---|---|---|---|
| ID | At Planck | At CARMA | At Planck | At CARMA | ||
| P014 | -0.30 | 0.89 | 0.25 | -0.01 | 0.44 | -0.30 |
| P086 | 0.24 | 0.25 | 1.94 | -0.45 | -0.83 | -0.69 |
| P097 | 0.87 | 1.58 | 1.51 | -0.11 | -0.54 | -0.54 |
| P109 | 0.99 | 0.97 | 0.53 | 0.05 | -0.99 | -0.57 |
| P170 | 0.25 | 3.59 | 2.96 | -0.10 | 0.83 | 0.51 |
| P187 | 0.95 | 1.30 | 1.86 | -0.02 | 0.08 | -0.05 |
| P190 | 1.63 | 2.32 | 1.94 | 0.13 | -0.11 | -0.13 |
| P205 | 1.22 | 1.87 | 2.29 | 0.08 | 0.70 | 0.20 |
| P351 | 1.07 | 0.71 | 0.99 | 0.15 | 0.18 | -0.51 |
| P028 | 0.29 | 0.35 | -0.37 | -0.01 | ||
| P031 | 0.89 | 2.43 | 0.20 | 0.21 | ||
| P049 | 1.24 | 1.47 | -0.33 | 1.05 | ||
| P052 | 0.74 | 0.30 | -0.02 | 0.38 | ||
| P057 | 1.67 | 0.74 | 0.01 | 0.43 | ||
| P090 | 1.44 | 0.12 | 0.04 | -0.62 | ||
| P121 | 0.41 | 1.31 | 0.10 | 0.22 | ||
| P134 | 0.68 | -0.75 | -0.04 | 0.74 | ||
| P138 | 0.77 | 2.33 | -0.40 | -0.55 | ||
| P264 | 0.95 | 2.63 | 0.02 | 0.39 | ||
Appendix A CARMA-8 SB MAPS, WISE Multi-Color Images and ROSAT Maps for Planck Cluster-Candidates from our Sample without a CARMA SZ Detection
![[Uncaptioned image]](/html/1409.1978/assets/x10.png)
Appendix B Notes on Individual CARMA-8-detected Planck Cluster Candidates
P014:
Two radio sources were detected in the LB data, both of which coincide with an NVSS source. There are four more NVSS sources but they are unlikely to contaminate an SZ signal, given their location and 1.4 GHz fitted flux densities. Despite one of the LB-detected radio sources lying away from the map centre with a peak, PB-corrected flux density of mJy, the source subtracted LB map is consistent with noise fluctuations, indicating that the removal of these two sources worked well. The SB map after source subtraction has a negative feature from the map center. This is the most significant negative feature on the map and is likely to be a low-SNR SZ detection. This cluster does, however, have the least negative, primary-beam corrected flux density, mJy/Beam, which could be due to the 6.3 mJy source located away partially filling the decrement. The decrement is elongated in the N-S direction with respect to the synthesized beam. In the Planck Union catalog it has an SNR of 4.5. On the other hand, there is no X-ray cluster signal in ROSAT towards this system, which would suggest that this is indeed a high redshift object or, rather, a spurious detection.
P086:
No radio sources were detected in the LB data and only two sources were identified in NVSS at mJy at ′. The cluster decrement is clearly detected at the level. In the inner, high SNR regions, the projected SZ signal towards this cluster appears to be close to circular. This system has an SNR of 4.6 in the Planck Union catalog, a peak decrement of -3.4ṁJy/beam and has substantial X-ray emission, as seen in the ROSAT image, Appendix E, whose peak lies within the CARMA-8 SZ contours.
P097:
No radio sources were detected in the LB data. Six sources were identified in NVSS, none of which coincide with likely low SNR radio sources in the LB data. The brightest NVSS sources have peak flux densities of mJy and are at least 9′from the map center, thus, we do not expect them to contaminate the CARMA SZ detection. The detected SZ signal has a highly non-circular, extended shape with a peak flux density of -3.0 mJy/beam. The ROSAT image shows X-ray emission within the CARMA-8 SZ contours with two peaks of counts each. A tentative filament of X-ray emission extends South with a peak of 4 counts. P097 is not included in the Union catalog but has an SNR of 4.8 in our analysis of the Planck data.
P109:
One radio source with a peak flux density of 2.6 mJy was detected in the LB data, but it does not correspond to any of the six sources in the NVSS catalog. The LB-detected radio source is coincident with the SZ signal and could be affecting the 7.3 detection, whose peak SZ flux density is -4.2 mJy/beam. From the maps, the cluster appears to be extended in the NE and S directions. The ROSAT image reveals the presence of X-ray emission, at the level of 3 to 4 counts, that could be associated with the CARMA-8 SZ signal. This X-ray emission extends South for , where it peaks with 5 counts. P109 is included in the Union catalog with an SNR of 5.3.
P170:
There are four identified NVSS radio sources, one of which is located at the position of an LB-detected source. After removing the radio source, the LB map looks noise-like and a clear
SZ decrement with a peak flux density of -3.1 mJy/beam is seen in the SB map. The cluster decrement is elongated with respect to the synthesized beam in the NW direction. In the ROSAT images not much X-ray emission can be seen, with a peak of 2 counts lying just outside the edge of the 2 sigma CARMA SZ contour. With a Union SNR of 6.7, this is the cluster in our sample with the highest SNR in the Union catalog.
P187:
There is a high density of sources in NVSS towards this cluster candidate with 10 cataloged sources. One of these sources is located next to an LB-detected source that appears to be slightly extended in the LB data. Despite this, the source is removed well from the LB data, which are consistent with noise. A clear SZ detection is revealed in the CLEANed SB maps. The decrement is one of the largest in our sample extending over 4′and branches out in several directions, primarily towards the SE, suggestive of a dynamically disturbed system. A known cluster, Abell 586, at lies away from the map center. The peak of the X-ray emission towards Abell 586 is offset from the SZ peak in our observations by , to the SW. The X-ray image of Abell 586 is circular and compact ( in radius) such that there is only a small overlap between the CARMA and X-ray signals. Abell 586 has been observed at arcminute resolution, at 16 GHz with AMI (AMI Consortium: Rodríguez-Gonzálvez et al. 2012), where it had a peak flux of -1.3 mJy/beam coincident with the X-ray position and was clearly extended, with signal over . The AMI SZ signal is fairly circular around a radius of from the SZ/X-ray peaks, where it is barely resolved, but is distinctly elongated in the SW direction at larger radii. The synthesized beam is approximately circular with a radius of .
The higher-resolution CARMA data overlaps with the AMI signal to the East of the AMI SZ peak. The AMI signal does not show the same SE elongation in the signal in this region as the CARMA data but this difference is likely to be instrumental rather than astrophysical, due to the poorer AMI resolution and the tilt in the CARMA beam. What is interesting is that the SZ signal in the CARMA data shows no extension in the SW direction, where a large fraction of the AMI SZ flux lies. This ‘missing’ signal from the CARMA data has a measured signal of almost -1 mJy/beam in the AMI data; since the SZ flux is stronger at 31 GHz than it is at 16 GHz, we would expect to see this signal in the CARMA data at . The AMI and CARMA SZ peaks are almost equidistant from the map centre, just in a different direction, and, hence, the lack of signal in the SW region should not be due to a sensitivity issue. Most likely, the CARMA-8 data has resolved out part of the signal AMI detects on the larger scales. In the ROSAT image there is a distinctive excess of X-ray emission whose peak coincides with the CARMA SZ peak. The X-ray emission drops fast towards the SW, except for a lobe stretching out , but remains significant towards the SW with 5 counts even beyond the 2 CARMA SZ contour. P187 has an SNR of 6.1 in the Planck Union catalog.
P190:
There are 6 NVSS radio sources within 10′of the map center, one ″away from the map center with a flux of 9.8 mJy and another offset by 447″with a flux of 80.8 mJy. No sources are seen in the LB data and, thus, no source subtraction was undertaken. A strong SZ decrement is seen in the SB data at almost , with a peak flux density of -3.6 mJy/beam. The ROSAT image shows some concentrated X-ray emission peaking at counts towards the edge of the CARMA-8 SZ contours. P190 has an SNR of 4.6 in the Planck Union catalog.
P205:
The SZ decrement is clearly detected towards P205 at significance in the CLEANed SB maps. The radio-source environment is not expected to pose a problem to the measured SZ signal: no sources were detected in the LB data and the 10 NVSS sources are not very bright mJy and mostly away from the map center. The SZ signal is extended in the NS direction. X-ray counts at the 2 photon level can be seen in the ROSAT image covering the CARMA-8 SZ contours with a peak of 3 counts towards the edge of the SZ contours. In the Planck Union catalog this system has an SNR of 5.7.
P351:
One radio source was detected in the LB data away from the map center with a flux of mJy and thus should not be affecting the cluster decrement. The subtraction of this source worked well leaving a noise-like LB map. The LB-detected source was associated with a 51.7 mJy NVSS source. The remaining 7 NVSS sources do not lie on significant positive-flux features in the LB data. The brightest of these sources had a flux of 127.9 mJy and was located 10′away from the map center. The LB peak flux density at this location was of mJy. The peak flux density for this SZ signal was one of the smaller ones for the sample mJy/beam but the detection is significant at . Some weak X-ray emission coincident with the CARMA SZ signal is seen in the ROSAT image; the X-ray peak, at counts, lies at the edge of the 2 SZ contour. P351 is not included in the Union catalog and has a low SNR (3.8) in the Planck data.
Appendix C Cataloged Clusters and Galaxy Overdensities in the Vicinity of our Observations
| Cluster ID | Known Cluster | Distance | Comments | |||
|---|---|---|---|---|---|---|
| (″) | ||||||
| P028 | Abell 2108(a) | 105 | 0.09 | 1.919 | Low mass and —some SZ flux could be resolved out | |
| P028 | NSC J154002+175240(b) | 150 | 0.0789 | 49.2 | Low counts—likely to be a low-mass system | |
| Low —some SZ flux could be resolved out | ||||||
| P028 | WHLJ154000.1+175609(c) | 177 | 0.39 (phot) | 52 | Low counts—likely to be a low-mass system | |
| P049 | A1961(a) | 132 | 0.23 | 3.532 | Ought to be seen yet there is | |
| WHLJ144431.8+311336(c) | 155 | 0.23 (phot) | 103 | no associated decrement in the C8 data | ||
| P049 | NSC J144432+311149(b) | 237 | 0.2334 | 66.5 | Substantial primary-beam attenutation | |
| P052 | WHLJ211849.1+003337(c) | 204 | 0.28 (phot) | 76 | ||
| P057 | Abell 2131(a) | 240 | 69 | Substantial primary-beam attenutation. | ||
| Likely to be low mass system | ||||||
| and no X-ray detection. | ||||||
| P057 | WHLJ154833.7+360536(c) | 138 | 0.24 (phot) | 79 | ||
| P121 | WHLJ130331.7+672638(c) | 60 | 0.21 (phot) | 86 | ||
| P134 | WHLJ115049.1+621948(c) | 237 | 0.35 (phot) | 73 | Substantial primary-beam attenutation | |
| P014 | WHLJ160319.0+031645(c) | 153 | 0.22 (phot) | 114 | Not associated with a CARMA decrement. | |
| Detected CARMA SZ signal 107.448″away. | ||||||
| P086 | WHLJ151351.9+524960(c) | 199 | 0.68 (phot) | 11 | Not coincident with the CARMA SZ decrement (152″away). | |
| likely to be low mass | ||||||
| P097 | WHLJ145526.9+585030(c) | 124 | 0.33 (phot) | 22 | Not coincident with the CARMA SZ decrement (111″away). | |
| likely to be low mass | ||||||
| P170 | WHLJ085058.7+483003(c) | 66 | 0.51 (phot) | 33 | Coincident with the CARMA SZ detection (34″away) | |
| P187 | Abell 586(a) | 50 | 0.171 | 5.197 | Coincident with CARMA SZ detection (15″away) | |
| WHLJJ073220.3+313801(c) | 48 | 0.18 (phot) | 145 | |||
| P190 | WHLJ110608.5+333340(c) | 55 | 0.49 (phot) | 73 | Coincident with the SZ CARMA detection (21″away ) | |
| P205 | WHLJ113808.9+275431(c) | 69 | 0.34 (phot) | 12 | Coincident with the SZ CARMA detection (15″away) |
Appendix D WISE multi-color plots
Appendix E ROSAT X-ray images
Appendix F Wise Color-magnitude Plots


Appendix G SDSS photometric redshifts
References
- Abell, Corwin, & Olowin (1989) Abell G. O., Corwin H. G., Jr., Olowin R. P., 1989, ApJS, 70, 1
- Allen et al. (2011) Allen, S. W., Evrard, A. E., & Mantz, A. B. 2011, AR&A, 49, 409
- AMI Consortium: Hurley-Walker et al. (2011) AMI Consortium, Hurley-Walker, N., Brown, M. L., et al. 2011, MNRAS, 414, L75
- AMI Consortium: Rodríguez-Gonzálvez et al. (2012) AMI Consortium: Rodríguez-Gonzálvez et al., 2012, MNRAS, 425, 162
- Assef et al. (2013) Assef, R. J., Stern, D., Kochanek, C. S., et al. 2013, ApJ, 772, 26
- Bahcall & Fan (1998) Bahcall N. A., Fan X., 1998, ApJ, 504, 1
- Bardeen et al. (1986) Bardeen, J. M., Bond, J. R., Kaiser, N., & Szalay, A. S. 1986, ApJ, 304, 15
- Bonaldi et al. (2007) Bonaldi, A., Tormen, G., Dolag, K., & Moscardini, L. 2007, MNRAS, 378, 1248
- Bond et al. (1996) Bond, J. R., Kofman, L., & Pogosyan, D. 1996, Nature, 380, 603
- Bond & Myers (1996) Bond, J. R., & Myers, S. T. 1996, ApJS, 103, 1
- Brodwin et al. (2012) Brodwin M., et al., 2012, ApJ, 753, 162
- Carlstrom et al. (2002) Carlstrom, J. E., Holder, G. P., & Reese, E. D. 2002, AR&A, 40, 643
- Carvalho, Rocha, & Hobson (2009) Carvalho P., Rocha G., Hobson M. P., 2009, MNRAS, 393, 681
- Carvalho et al. (2012) Carvalho P., Rocha G., Hobson M. P., Lasenby A., 2012, MNRAS, 427, 1384
- Gal et al. (2003) Gal, R. R., de Carvalho, R. R., Lopes, P. A. A., et al. 2003, AJ, 125, 2064
- Galametz et al. (2012) Galametz A., et al., 2012, ApJ, 749, 169
- Gettings et al. (2012) Gettings, D. P., Gonzalez, A. H., Stanford, S. A., et al. 2012, ApJL, 759, L23
- Hasselfield et al. (2013) Hasselfield M., et al., 2013, JCAP, 7, 8
- Herranz et al. (2002) Herranz D., Sanz J. L., Hobson M. P., Barreiro R. B., Diego J. M., Martínez-González E., Lasenby A. N., 2002, MNRAS, 336, 1057
- Högbom et al. (1974) Högbom J. A., 1974, Astron. Astrophys. Suppl, 197
- Kay et al. (2012) Kay, S. T., Peel, M. W., Short, C. J., et al. 2012, MNRAS, 422, 1999
- Marriage et al. (2011) Marriage T. A., et al., 2011, ApJ, 737, 61
- McGlynn, Scollick, & White (1998) McGlynn T., Scollick K., White N., 1998, IAUS, 179, 465
- Melin, Bartlett, & Delabrouille (2006) Melin J.-B., Bartlett J. G., Delabrouille J., 2006, A&A, 459, 341
- Montero-Dorta & Prada (2009) Montero-Dorta A. D., Prada F., 2009, MNRAS, 399, 1106
- Motl et al. (2005) Motl, P. M., Hallman, E. J., Burns, J. O., & Norman, M. L. 2005, ApJL, 623, L63
- Muchovej et al. (2007) Muchovej, S., Mroczkowski, T., Carlstrom, J. E., et al. 2007, ApJ, 663, 708
- Muchovej et al. (2010) Muchovej S., et al., 2010, ApJ, 716, 521
- Muzzin et al. (2013) Muzzin, A., Wilson, G., Demarco, R., et al. 2013, ApJ, 767, 39
- Papovich (2008) Papovich C., 2008, ApJ, 676, 206
- Perrott (2014) Perrott, Y. C., Olamaie, M., Rumsey, C., et al. 2014, arXiv:1405.5013
- Piffaretti et al. (2011) Piffaretti R., Arnaud M., Pratt G. W., Pointecouteau E., Melin J.-B., 2011, A&A, 534, A109
- Planck Collaboration et al. (2011 I) Planck Collaboration I, et al., 2011, A&A, 536, A1
- Planck Collaboration et al. (2011 VIII) Collaboration VIII, 2011, A&A, 536, A8
- Planck Collaboration et al. (2013 II) Collaboration, Intermediate Results II, 2013, A&A, 550, A128
- Planck Collaboration et al. (2013 XXIX) Collaboration, et al., 2013 XXIX, arXiv, arXiv:1303.5089
- Planck Collaboration et al. (2013) Planck Collaboration, et al. 2013 XX, arXiv:1303.5080
- Reichardt et al. (2013) Reichardt C. L., et al., 2013, ApJ, 763, 127
- Rettura et al. (2014) Rettura, A., Martinez-Manso, J., Stern, D., et al. 2014, arXiv:1404.0023
- Rodríguez-Gonzálvez et al. (2014) Rodríguez-Gonzálvez et al., in prep
- Sayers et al. (2012) Sayers, J., Czakon, N. G., Bridge, C., et al. 2012, ApJL, 749, L15
- Shepherd (1997) Shepherd M. C., 1997, ASPC, 125, 77
- Stern et al. (2012) Stern, D., Assef, R. J., Benford, D. J., et al. 2012, ApJ, 753, 30
- Sunyaev & Zel’dovich (1972) Sunyaev R. A., Zel’dovich Y. B., 1972, CoASP, 4, 173
- Tauber et al. (2010) Tauber J. A., et al., 2010, A&A, 520, A1
- Wen et al. (2012) Wen, Z. L., Han, J. L., & Liu, F. S. 2012, ApJS, 199, 34
- Wenger et al. (2000) Wenger M., et al., 2000, A&AS, 143, 9
- Williamson et al. (2011) Williamson R., et al., 2011, ApJ, 738, 139
- Wright et al. (2010) Wright, E. L., Eisenhardt, P. R. M., Mainzer, A. K., et al. 2010, AJ, 140, 1868
- Viana & Liddle (1996) Viana P. T. P., Liddle A. R., 1996, MNRAS, 281, 323
- Voit (2005) Voit, G. M. 2005, Reviews of Modern Physics, 77, 207
- Zwart et al. (2008) Zwart J. T. L., et al., 2008, MNRAS, 391, 1545