Multiwavelength observations of the black hole transient Swift J174526 during the outburst decay
Abstract
We characterized the broad-band X-ray spectra of Swift J174526 during the decay of the 2013 outburst using INTEGRAL ISGRI, JEM-X and Swift XRT. The X-ray evolution is compared to the evolution in optical and radio. We fit the X-ray spectra with phenomenological and Comptonization models. We discuss possible scenarios for the physical origin of a 50 day flare observed both in optical and X-rays 170 days after the peak of the outburst. We conclude that it is a result of enhanced mass accretion in response to an earlier heating event. We characterized the evolution in the hard X-ray band and showed that for the joint ISGRI-XRT fits, the e-folding energy decreased from 350 keV to 130 keV, while the energy where the exponential cut-off starts increased from 75 keV to 112 keV as the decay progressed. We investigated the claim that high energy cut-offs disappear with the compact jet turning on during outburst decays, and showed that spectra taken with HEXTE on RXTE provide insufficient quality to characterize cut-offs during the decay for typical hard X-ray fluxes. Long INTEGRAL monitoring observations are required to understand the relation between the compact jet formation and hard X-ray behavior. We found that for the entire decay (including the flare), the X-ray spectra are consistent with thermal Comptonization, but a jet synchrotron origin cannot be ruled out.
keywords:
X-rays: accretion, binaries - X-rays: binaries: close - Stars: individual: Swift J174526, Swift J174510.826241 Introduction
Galactic black hole transients (GBHT) are excellent laboratories to study the complex relation between the jet and the accretion environment in X-ray binaries as the outbursts evolve on timescales of months, allowing detailed investigation of the properties of accretion states (traced by X-ray spectral and timing properties) together with the properties of jets traced by the radio, and optical/infrared (OIR) emission.
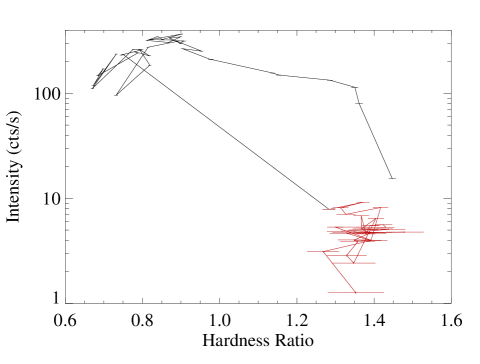
The evolution of accretion states throughout an outburst is best described by the hardness intensity diagram (HID, Homan et al. 2001; Belloni 2010). The HID of Swift J174526 is given in Figure 1. At the start of a typical outburst, the GBHT is in the hard state (HS), the lower right side of the HID. In this state, the X-ray spectrum is dominated by a hard, power-law like component, historically associated with Compton scattering of soft photons by a hot electron corona. Weak emission from a cool, optically thick, geometrically thin disk (modeled by a multi-temperature blackbody, Makishima et al. 1986) may also be observed. The variability is strong (typically 20% fractional rms amplitude). As the X-ray flux increases, the GBHT usually makes a transition to the soft state (upper-left side of the HID) in which the X-ray spectrum is dominated by the optically thick accretion disk. At the end of outbursts, sources go back to the hard state as the X-ray flux decreases. There are also intermediate states occurring during transitions between the soft and the hard states (see McClintock & Remillard 2006 and Belloni 2010 for details of spectral states of GBHTs).
In some cases, the evolution of spectral states during an outburst does not follow the usual pattern in the HID. The source can stay in the HS throughout the outburst or make a transition to a hard intermediate state while never fully entering the soft state. These are called ”failed outbursts” (Brocksopp, Bandyopadhyay & Fender, 2004; Soleri et al., 2013; Russell et al., 2013b). The HID of Swift J174526 given in Figure 1 is a typical HID for a failed outburst (see Capitanio et al., 2009; Ferrigno et al., 2012; Soleri et al., 2013, for other examples of failed outburst HIDs).
Contemporaneous multi-wavelength observations of GBHTs in optical, near infrared (OIR) and radio show that the behaviour of the jets are closely related to X-ray spectral states. Steady, compact jets are observed in the HS (Corbel et al., 2000; Fender, 2001, 2010; Fender & Gallo, 2014). The typical SEDs in the HS show a flat or inverted power-law at radio frequencies that breaks, at near- to mid-infrared wavelengths, to a second power-law with negative spectral index. Such an emission profile is consistent with emission from a compact, conical jet (Blandford & Konigl, 1979; Hjellming & Johnston, 1988). On the other hand, the radio emission from the jet is quenched in the soft state (Corbel & Fender, 2002; Russell et al., 2011). During the transition to the soft state in the outburst rise, bright relativistic flares with optically thin radio spectra are sometimes observed (see Fender & Gallo, 2014, and references therein).
Two important aspects of the relation between X-ray spectral and timing properties and the jets are understanding the conditions in the accretion environment for the formation of compact jets (Kalemci et al., 2013, and references therein), and whether jets affect the X-ray spectral and timing properties by altering the accretion environment. One way of achieving these objectives is characterizing the X-ray spectral evolution along with the OIR and radio evolution during outburst decays because the jet emission that is quenched during the soft state turns back on as the source makes a transition to the hard state.
Such multiwavelength characterization during the outburst decays reveal OIR flares (also called ”secondary maxima”) when the source is back in the hard state with the X-ray spectrum close to its hardest level (Buxton & Bailyn, 2004; Kalemci et al., 2005; Coriat et al., 2009; Russell et al., 2010; Dinçer et al., 2012; Buxton et al., 2012; Kalemci et al., 2013). In the 2011 decay of GX 3394, simultaneous radio and OIR observations show that the OIR flare corresponds to a transition in radio from optically thin to optically thick emission (Corbel et al., 2013b, a). Moreover, the spectral energy distributions (SED) created from data during the OIR flares of 4U 154347 (Buxton & Bailyn, 2004; Kalemci et al., 2005), and XTE J1550564 (Jain et al., 2001; Russell et al., 2010) are consistent with emission from a compact jet. A study by Kalemci et al. (2013) showed that the multi-wavelength behavior of most GBHTs that undergo a soft to hard state transition during the outburst decay are similar, such that a compact, steady jet is formed 6-15 days after the initial changes in timing properties, and the jet manifests itself either as an OIR flare, and/or radio emission with flat to inverted spectrum. Alternative explanations for these OIR flares exist, such as the synchrotron emission from a hot accretion flow (Veledina, Poutanen & Vurm, 2013; Poutanen & Veledina, 2013), and irradiation induced secondary mass accretion which could explain the secondary OIR flares with simultaneous X-ray flares (Kalemci et al., 2013).
To understand the effects of the jet on the X-ray spectral properties, we started a program with the INTEGRAL observatory to characterize the GBHTs at high energies when compact jets are present (or while they form). Thermal Comptonization models that are often invoked to explain the high energy behavior of GBHTs predict a cut-off in the X-ray spectrum at a few hundred keVs (Gilfanov, 2010). While such cut-offs are observed commonly in many GBHTs, in some cases these cut-offs disappear after the jets turn on (such as in 4U 154347, Kalemci et al. 2005), or are not present at all while the jets are present (H1743322 during 2003 decay, Kalemci et al. 2006a; GX 3394during the 2005 outburst, Kalemci et al. 2006b; XTE J1720318, Cadolle Bel et al. 2004; GRO J165540 during the 2005 decay, Caballero García et al. 2007, but also see Joinet, Kalemci & Senziani 2008). This disappearance could be interpreted as the jet changing the electron energy distribution and hardening the X-ray spectrum.
Synchrotron emission from compact jets may also be contributing to hard X-rays (Markoff, Falcke & Fender, 2001; Markoff, Nowak & Wilms, 2005; Maitra et al., 2009; Russell et al., 2010), and both Comptonization and jet models can fit the spectra equally well (Nowak et al., 2011). According to Pe’er & Markoff (2012), a distinct feature of synchrotron radiation at hard X-rays would be a photon index of around 1.5 before a gradual break in the spectrum at 10 keV caused by rapid cooling of electrons. Characterizing properties of spectral breaks at hard X-rays therefore is important to test predictions of jet models, especially when these models incorporate detailed electron acceleration mechanisms
Using HEXTE on RXTE, Miyakawa et al. (2008) investigated the relation between the cut-off energy (from the fits with cut-off power-law) and several other spectral parameters from all hard state observations of GX 3394, and found an inverse correlation between the cut-off energy and luminosity for the bright hard state observations. The statistics were not good enough to constrain the evolution of the cut-off parameters for the fainter observations. Motta, Belloni & Homan (2009) utilized INTEGRAL ISGRI and HEXTE together and investigated the evolution of the cut-off energy from the hard state to the hard intermediate state in the rising phase of the outburst of GX 3394 during the 2006/2007 outburst. Similar to findings of Miyakawa et al. (2008), the cut-off energy decreased with increasing flux, but it reversed the trend and increased again with the softening in the hard-intermediate state. While the cause of this behavior is not clear, obtaining the evolution of spectral breaks during the outburst decay, and comparing with the outburst rise could help us to uncover the reason. Since the hard X-ray fluxes during the outburst decays are lower, dedicated observing programs with INTEGRAL are required for such investigation.
Within our INTEGRAL program, we first observed XTE J1752223 with INTEGRAL, Swift and RXTE during its 2012 outburst decay (Chun et al., 2013). The observation took place a few days before the detection of the compact core with the Very Long Baseline Array (VLBA). To increase the statistics of the X-ray spectra at high energy we combined all available ISGRI data, and the resulting spectrum required a break in the hard X-ray spectrum. As a continuation of our observing program with INTEGRAL, we triggered on Swift J174526 during its decay in 2013. We also obtained data from INTEGRAL revolutions before and after our observation.
| ISGRI Rev111ISGRI Revolution | Dates | Swift ObsID222Swift observation within the given revolution | ISGRI Exposure | Avg. offset333Average offset of ISGRI pointings |
|---|---|---|---|---|
| MJD-56000 | (ks) | |||
| 1261 | 334.0335.0 | 00032700005 | 61.0 | 3.93∘ |
| 1262 | 335.3336.2 | 00032700007 | 48.0 | 5.19∘ |
| 1263 | 339.7340.9 | 000327000010 | 103.7 | 4.18∘ |
| 1264 | 341.3343.4 | 000327000013 | 151.9 | 4.82∘ |
| 1265 | 345.0346.9 | - | 35.0 | 6.18∘ |
| 1266 | 347.3349.8 | - | 20.8 | 5.31∘ |
| 1267 | 351.0352.9 | - | 29.2 | 5.94∘ |
| 1271 | 362.2364.8 | - | 27.3 | 6.05∘ |
| 1274 | 371.2373.2 | - | 22.7 | 6.17∘ |
| 1276 | 377.2379.7 | 00533836047 | 104.0 | 5.27∘ |
| 1277 | 380.2382.7 | - | 184.2 | 6.34∘ |
| 1279 | 388.0388.8 | 00032700017 | 61.8 | 4.85∘ |
| 1280 | 391.1391.8 | 00032700018 | 44.9 | 5.13∘ |
| 1282 | 395.2397.8 | 00533836049 | 129.5 | 8.50∘ |
1.1 Swift J174526
Swift J174526 (Swift J174510.82624) was discovered by the BAT instrument on board the Swift satellite on September 16 2012 (MJD 56186.39, Cummings et al. 2012). It was subsequently detected by the Swift XRT (Sbarufatti et al., 2012), and INTEGRAL (Vovk et al., 2012). The infrared counterpart was identified by Rau et al. (2012). Based on the X-ray spectral and timing properties, Swift J174526 is reported to be a Galactic black hole transient (Belloni et al., 2012; Tomsick, Del Santo & Belloni, 2012). Further evidence for the nature of the source comes from optical observations that reveal a broad, double peaked emission line whose properties resemble those typically seen in other black hole sources in outburst (de Ugarte Postigo et al., 2012; Muñoz-Darias et al., 2013).
Swift J174526 is also detected in radio both with the Karl G. Jansky Very Large Array (VLA, Miller-Jones & Sivakoff 2012) and at the Australia Telescope Compact Array (ATCA, Corbel et al. 2012). The spectral index of radio observations during the initial hard state is consistent with optically-thick synchrotron emission from a partially self-absorbed compact jet (Corbel et al., 2012). Curran et al. (2014) present detailed analysis of radio data from ATCA, VLA and Karoo Array Telescope (KAT-7) monitoring observations of Swift J174526 until MJD56380. After the initial hard state rise, the source stayed in the hard intermediate state until MJD 56270 based on X-ray spectral and timing properties (Belloni et al., 2012; Grebenev & Sunyaev, 2012) and also radio emission properties (Curran et al., 2014). Detailed Swift and INTEGRAL analysis of the outburst rise is in preparation (Del Santo et al.).
Due to the proximity of the source to the Sun, the source could not be observed between MJD 56270 and MJD 56288 with Swift BAT, and the first pointed observation of the source with Swift XRT after the gap was on MJD 56334. As shown in Figure 1 of Curran et al. (2014), the system was in the hard intermediate state at MJD 56250 as indicated by the inverted spectrum radio emission. The BAT flux shows an increasing trend after this date, indicating that the spectrum remained hard until the start of the Sun gap on MJD 56270. After a gap of 18 days, the BAT light curve before the break smoothly connects to the light curve after the break. The radio spectrum taken on MJD 56304 and the X-ray spectra on MJD 56334 (Sbarufatti et al., 2013) show that the source is in the hard state after the break. This can also be seen in the hardness-intensity diagram given in Figure 1, where the red data points represent observations analyzed in this work. While we cannot rule out the possibility that the source entered the soft state between MJD 56270 and MJD 56304, the trends in the Swift BAT light curve and the radio evolution indicate a ”failed” outburst. We note that, while the properties of the source are consistent with the definition of failed outbursts, the outburst certainly did not fail in terms of brightness, and had reached close to a Crab during the initial rise (Sbarufatti et al., 2012).
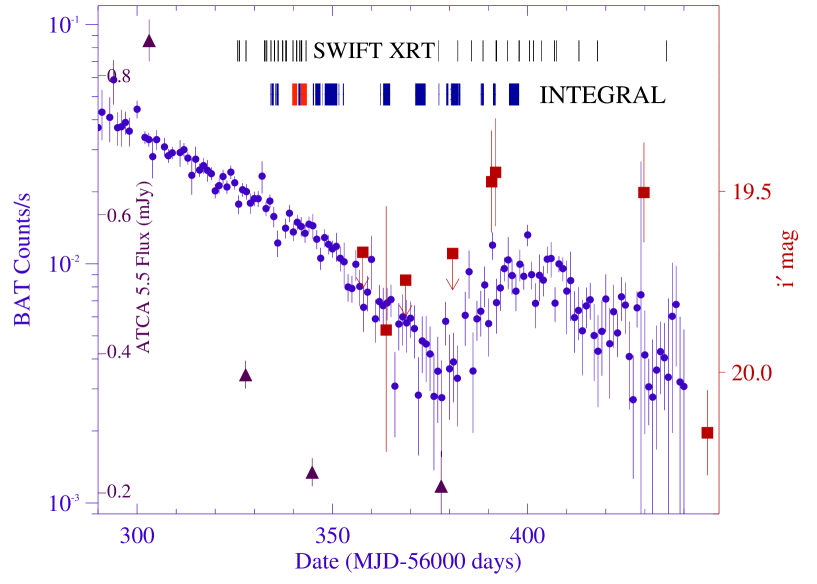
Finally, the source exhibited a secondary flare after MJD 56380 in optical and X-rays (Russell et al., 2013a). Thanks to the large field of view of INTEGRAL and the position of the source in the Galactic Bulge, we were able to analyse INTEGRAL data from several revolutions to characterise the high energy behaviour of the source over 70 days during its decay. In this article, we first present the X-ray evolution of the source using both INTEGRAL, and Swift. Then we discuss the secondary flare observed in both optical and X-ray and compare this flare with the secondary OIR flares observed in GBHTs.
2 Observations and Analysis
2.1 X-ray observations
A summary plot of all multi-wavelength observations during the decay can be found in Figure 2. The source has been covered very well with Swift and INTEGRAL. Our analysis includes Swift data between MJD 56334.23 and MJD 56435.59, and INTEGRAL data between MJD 56334.0 and MJD 56397.8. The details of the INTEGRAL revolutions we utilized and simultaneous Swift ObsIDs are given in Table 1.
2.2 Spectral extraction with Swift XRT, INTEGRAL ISGRI and JEM-X
The Swift XRT observations used in this study are shown in Table 2. All data were processed following the standard procedures and using the xrtpipeline v.0.12.8. Since the source flux varies significantly, the whole sample of pointings contain both Windowed Timing (WT) mode and Photon Counting (PC) mode data. In order to minimise the affects of photon pile-up we followed the method outlined in Reynolds & Miller (2013) and created source selection regions based on the observed count rate. The background region was selected from an annulus with an inner and outer radius of 70 and 100, respectively, from the source centroid. Events were selected with grades 0-2 and 0-12 for WT and PC mode data, respectively. The appropriate response matrix files, swxwt0to2s6_20010101v014.rmf for the WT mode and swxpc0to12s6_20010101v013.rmf for the PC mode, were obtained from HEASARC CALDB. The auxiliary response matrix files were created using the HEASOFT tool xrtmkarf and the exposure map created by the xrtexpomap. Finally we grouped all the spectra to have at least 50 counts per spectral bin. After the pile-up mitigating procedure, the PC mode observations resulted in a spectrum with few energy bins and large errors, and therefore are not used in this work.
The INTEGRAL data were reduced and analyzed using the standard Off-line Scientific Analysis (OSA) software package (v.10) released by the ISDC (Courvoisier et al., 2003) for each revolution. The INTEGRAL revolutions last 3 days, and within revolutions sky regions are observed with 30-60 minute individual pointings with a special dither pattern to minimise noise in mosaic images obtained by combining images from individual pointings.
For JEM-X, we combined images in a single mosaic per revolution in order to reach the highest sensitivity for JEM X-1 and JEM X-2 separately. The spectra were extracted from the each combined mosaic image over an energy range of 3-35 keV corresponding to 16 channels. After comparing the quality of spectra, we have decided to use only JEM X-1 data. In the case of IBIS/ISGRI, the standard procedure was used to extract the spectra and rebin the response matrix to 50 bins. Then we used spe_pick tool to obtain average spectrum of the source for each revolution for 18-350 keV energy range.
2.3 X-ray spectral analysis
We first fitted Swift XRT and INTEGRAL ISGRI spectra separately. For the Swift XRT fits, we started with interstellar absorption ( in XSPEC) and a power-law. We used cross sections of Verner et al. (1996) and abundances of Wilms, Allen & McCray (2000) for the interstellar absorption and left as a free parameter initially. We observed significant residuals at energies less than 2 keV. We added a multicolor disk blackbody ( in XSPEC, Makishima et al. 1986) which resulted in fits with acceptable reduced values. The results of the fits are tabulated in Table 2444All errors in the figures and in tables correspond to of 2.706.
For the initial, high flux, high quality spectra between MJD 55633.4 and MJD 55644.3, we realized that fits result in a small scatter of values around an average of atoms cm-2. Lower quality spectra showed large scatter in that correlated with disk fit parameters. Since it is unlikely that varies more than 20% within timescale of days, we fixed its value to atoms cm-2 and performed the fits again. The results show a smooth evolution of X-ray spectral parameters as seen in Figure 3 and in Table 2.

| Swift obsid | Date555MJD-56000 | Fits with free | Fits with fixed | |||||
|---|---|---|---|---|---|---|---|---|
| 666in units of atoms cm-2 | Flux7771-12 keV Flux in units of ergs cm-2 s-1 | Norm888Lower limit of normalization of diskbb component | ||||||
| 00032700005 | 334.2 | 2.120.23 | 1.600.07 | 0.100.02 | 1.620.03 | 0.110.02 | 7.610.10 | 1.07E+06 |
| 00032700007 | 336.1 | 2.080.24 | 1.680.08 | 0.110.02 | 1.720.03 | 0.110.01 | 6.040.09 | 1.64E+06 |
| 00032700008 | 337.2 | 2.140.27 | 1.640.08 | 0.110.03 | 1.650.04 | 0.120.02 | 6.810.08 | 2.41E+05 |
| 00032700009 | 338.0 | 1.880.15 | 1.530.06 | 0.070.03 | 1.610.04 | 0.130.03 | 6.900.08 | 1.15E+05 |
| 00032700010 | 339.9 | 2.080.30 | 1.580.08 | 0.120.03 | 1.610.04 | 0.130.02 | 6.220.09 | 3.00E+05 |
| 00032700011 | 341.6 | 2.440.27 | 1.700.07 | 0.140.01 | 1.640.04 | 0.140.02 | 6.120.07 | 2.52E+05 |
| 00032700012 | 340.8 | 2.410.28 | 1.690.09 | 0.120.01 | 1.620.04 | 0.120.01 | 6.140.09 | 1.27E+06 |
| 00032700013 | 342.0 | 2.260.26 | 1.680.08 | 0.120.02 | 1.660.04 | 0.120.02 | 6.390.09 | 6.83E+05 |
| 00032700014 | 343.2 | 2.220.27 | 1.640.07 | 0.120.02 | 1.630.04 | 0.120.02 | 6.160.06 | 3.52E+05 |
| 00533686047 | 377.2 | 1.640.23 | 1.490.13 | - | 1.590.11 | 0.170.07 | 2.190.07 | 2.10E+04 |
| 00032700017 | 388.6 | 2.760.55 | 1.850.19 | 0.100.02 | 1.680.08 | 0.100.02 | 2.700.09 | 1.59E+06 |
| 00032700018 | 391.9 | 2.290.52 | 1.690.17 | 0.100.04 | 1.670.08 | 0.110.03 | 3.390.11 | 3.14E+05 |
| 00533836048 | 392.1 | 2.360.55 | 1.680.16 | 0.120.03 | 1.640.08 | 0.130.03 | 3.570.09 | 1.18E+05 |
| 00032700019 | 394.8 | 2.210.46 | 1.630.15 | 0.100.03 | 1.630.07 | 0.110.03 | 4.140.10 | 6.08E+05 |
| 00533836049 | 397.8 | 3.280.66 | 1.860.15 | 0.150.02 | 1.630.07 | 0.160.03 | 4.310.12 | 2.10E+04 |
| 00032700020 | 397.9 | 1.920.33 | 1.590.13 | 0.080.06 | 1.670.07 | 0.120.06 | 4.470.12 | 4.50E+05 |
| 00032700021 | 400.5 | 2.660.49 | 1.740.14 | 0.110.02 | 1.620.06 | 0.110.02 | 4.460.10 | 9.16E+05 |
| 00533836050 | 401.5 | 2.740.55 | 1.760.15 | 0.140.03 | 1.630.07 | 0.130.04 | 4.550.11 | 4.06E+05 |
| 00032700022 | 403.6 | 2.370.88 | 1.620.25 | 0.110.07 | 1.580.11 | 0.130.05 | 4.320.19 | 5.39E+05 |
| 00032700023 | 406.9 | 2.840.53 | 1.770.16 | 0.110.02 | 1.600.07 | 0.110.02 | 4.280.12 | 6.76E+05 |
| 00533836051 | 407.4 | 2.350.49 | 1.750.16 | 0.110.02 | 1.700.08 | 0.110.02 | 3.920.11 | 5.14E+05 |
| 00533836052 | 413.1 | 2.230.47 | 1.640.16 | 0.090.04 | 1.640.07 | 0.100.03 | 3.540.09 | 5.00E+05 |
| 00533836053 | 417.4 | 2.200.00 | 1.600.10 | 0.170.04 | 1.600.10 | 0.170.04 | 3.060.10 | 1.43E+05 |
| 00533836057 | 435.6 | 3.141.08 | 2.010.32 | 0.080.06 | 1.790.10 | - | 3.120.13 | - |
For the INTEGRAL observations, we first fitted the ISGRI data from individual revolutions. We started with a power-law, and added a high energy cut off component ( in XSPEC) and test if addition of the cutoff significantly improves the . If an F-test results in chance probability less than 0.001, we used the fit with the cutoff. The fit results are summarized in Table 4 and some of the fit parameters are plotted in Figure 4.
Finally, we applied joint fits to the Swift XRT, INTEGRAL ISGRI and JEM-X for observations with concurrent data (Table 1). We started with a model that consists of power-law and multicolor diskblackbody components with interstellar absorption. Similar to ISGRI-only fits, we add a high energy cut-off and check the improvement in . If an F-test results in chance probability less than 0.001, we used the fit with the cutoff.
We also applied thermal and hybrid Comptonization models to the joint spectra. In the compps model (Poutanen & Svensson, 1996), blackbody photons are Compton up-scattered from a spherical corona with uniform optical depth and electron temperature . In our fits, the blackbody temperature is fixed to the diskbb inner temperature . We kept all other parameters at default values. The fits cannot constrain the reflection fraction.
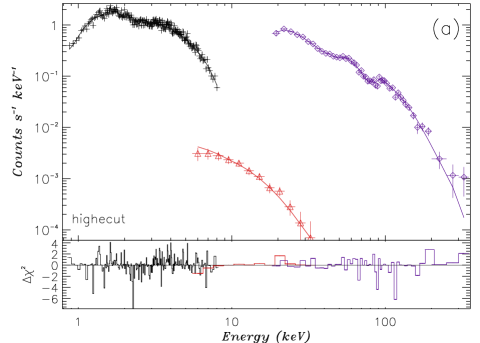
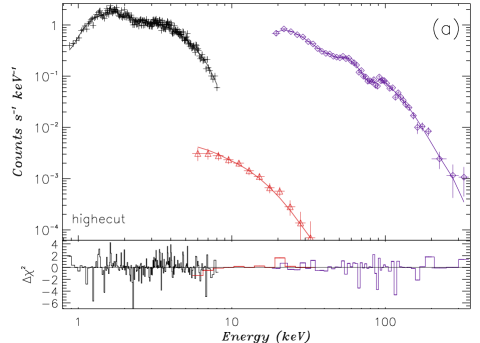
Finally, we tried the eqpair model (Coppi, 1999) to be able to assess the presence of non-thermal electron population. The eqpair model assumes a spherical plasma of electrons, positrons and soft photons. The resulting emission is determined by the compactness parameter , where is power, is the radius of the spherical plasma, and is the Thomson cross section. The model allows hybrid electron plasmas, thermal and non-thermal electron energy distributions together. Following Coppi (1999), we fixed the soft photon compactness to 1, and fit our data with a minimum set of free parameters. The temperature of seed photons are fixed to the inner disk temperature of the diskbb component. The fit results for Comptonization models are summarized in Table 5. An example fit is shown in Figure 5.
| Date | |||
|---|---|---|---|
| 56357.8 | 19.67 | 20.75 | 19.73 |
| 56363.8 | 19.880.34 | 20.920.35 | 21.13 |
| 56368.8 | 19.74 | 20.670.24 | 21.19 |
| 56380.8 | 19.67 | 20.83 | 20.39 |
| 56390.8 | 19.470.14 | 20.720.25 | 20.83 |
| 56391.8 | 19.450.15 | 20.450.21 | 21.580.48 |
| 56429.8 | 19.500.14 | 20.200.13 | 22.940.55 |
| 56441.8 | 18.67 | 20.36 | 21.040.55 |
| 56451.8 | 18.98 | 20.49 | 21.97 |
| 56537.4 | 20.78 | - | 21.26 |
| 56446999From Grebenev, Prosvetov & Burenin (2014) | 20.070.12 | - | - |
2.4 Radio and optical data
During the decay, the source was also monitored in radio and in optical. There were four radio observations with the ATCA, and for all those observations the radio spectra are consistent with being flat to inverted, indicating presence of compact jets (Curran et al., 2014).
Optical observations were acquired using the Faulkes Telescope South (FTS; located at Siding Spring, Australia) as part of a monitoring campaign of LMXBs with the Faulkes Telescopes (Lewis et al., 2008). Three filters were used, Sloan Digital Sky Survey (SDSS) i′, Bessell R and Bessell V. Bias subtraction and flat-fielding were performed via the automatic pipelines. For flux calibration procedures, see Muñoz-Darias et al. (2013). The magnitudes in each band are given in Table 3. We also take one i′ band magnitude measured on MJD 56446 taken at Turkish National Observatory with Russian Turkish Telescope RTT150 reported in Grebenev, Prosvetov & Burenin (2014).
3 Results
3.1 Soft X-ray evolution with Swift XRT
As mentioned earlier, leaving free results in highly scattered, and correlated and diskbb parameters. In some cases the diskbb flux changes by an order of magnitude within a day. After fixing the , a smooth evolution of X-ray spectral fit parameters is observed (Figure 3).
A soft diskbb component is required statistically in the fits, however, its parameters are not very well determined, especially the normalization. The 90% confidence lower limits on the diskbb normalisations are given in Table 2 along with other important fit parameters. The minimum normalizations typically are larger than a few times , and the lowest we measure is . While the quality of the data is not good enough to place strong constraints on the inner disk radius, for typical black hole masses and distances, these minimum normalization values indicate large inner disk radii.
The 1-12 keV X-ray flux decreases from ergs cm-2 s-1 to ergs cm-2 s-1 in 43 days before showing a flare. The flare lasts for approximately 40 days. As seen in Figure 2, the flare occurs in both soft and hard X-rays. The flare causes an increase of flux in both diskbb and power-law flux, and the photon indices remain remarkably constant even though the soft X-ray flux more than doubles during the flare.
| ISGRI Rev | 101010Folding energy in highecut model | 111111Cut-off energy in highecut model | Flux12121213-200 keV Flux in units of ergs cm-2 s-1 | |
|---|---|---|---|---|
| (keV) | (keV) | |||
| 1261 | 1.550.06 | 273.6 94.6 | 68.9 12.6 | 2.820.07 |
| 1262 | 1.450.20 | 110.5 | 178.6 | 2.630.09 |
| 1263 | 1.560.06 | 255.9 82.3 | 65.7 16.7 | 2.370.04 |
| 1264 | 1.600.04 | 220.3 62.0 | 81.2 13.4 | 2.300.03 |
| 1265 | 1.610.07 | 33.0 | 140.8 | 2.030.11 |
| 1266 | 1.700.09 | - | - | 2.080.07 |
| 1267 | 1.740.09 | - | - | 1.650.06 |
| 1271 | 1.620.14 | - | - | 1.110.09 |
| 1274 | 1.720.23 | - | - | 0.740.24 |
| 1276 | 1.740.14 | - | - | 0.710.05 |
| 1277 | 1.840.10 | - | - | 0.760.03 |
| 1279 | 1.720.10 | - | - | 0.970.04 |
| 1280 | 1.780.09 | - | - | 1.220.04 |
| 1282 | 1.640.05 | 131.8 71.5 | 114.2 15.4 | 1.830.05 |
3.2 Hard X-ray evolution and joint fits
The evolution of the hard X-ray flux with BAT is shown in Figure 2, and the evolution of the spectral fit parameters of INTEGRAL ISGRI data only are given in Table 4. We were able to search and detect cut-offs in the ISGRI data for revolutions with high flux (1261 to 1265), and also during the final revolution (1282) for which the source was in the field of view of INTEGRAL. For revolution 1282, the statistical quality of the spectrum is better than for revolutions 1266 to 1280 because of higher exposure as well as higher flux due to the observation occurring near the peak of the X-ray flare.
For INTEGRAL revolutions with simultaneous Swift XRT data we applied joint fits with three models; phenomenological highec*(power+diskbb), and Comptonization models compps+diskbb and eqpair+diskbb. For revolutions 1261, 1263, 1264 and 1282, a cut-off is required in the power-law model fit (see Table 5). The evolution of spectral parameters related to hard X-rays is summarized in Fig. 4. In this figure we used solid circles to represent joint fit results, and used diamonds from ISGRI only fits for which we do not have XRT data.
At first instance, fits from the earliest five revolutions seem to have a harder photon index compared to later revolutions, however this is an artificial result due to the presence of a cut-off in the spectra of earlier revolutions. This evolution indicates that it is likely that the data from revolutions 1266 to 1280 also require a high energy cut-off, however since it is not required by the F-test due to low statistics, the cut-off is not included in the fits and the resulting power-law index is softer.
The evolution of folding and cut-off energies indicate that as the flux decayed initially, the cut-off energies increased and folding energies decreased. The high cut-off, low folding energy behavior was also observed during the peak of the secondary flare during revolution 1282.

For the compps fits, we first let electron temperature, (), and reflection fraction free. For all observations, the reflection fraction is close to zero and could not be constrained by the fits. We then fixed this parameter to zero, and fitted the spectra with electron temperature and as free parameters (see Table 5 for results). We find electron temperatures of 60-100 keV for the revolutions 1261 to 1264. The electron temperature at revolution 1282 is higher, but with large errors. We cannot constrain the with compps fits, within of 2.706, the parameter is pegged to the upper limit of 3.

For the eqpair fits we started with fixing to zero to see if the thermal electron distribution can fit the data. We only had (hard to soft compactness ratio) and free and fixed all the other parameters. After we obtained initial fits, we let reflection fraction vary. Like the compps case, for all revolutions, the fits resulted in reflection fractions close to zero. We fixed it to zero and repeated the fits. The results are given in Table 5.
We then tested whether a hybrid electron energy distribution provides better fit to the data. We made a free parameter and fixed to 2.5. While the fits cannot constrain the parameter well enough to rule out non-thermal plasma, we consistently obtain low values of for all revolutions, except revolution 1262. The 2 limits for this parameter are given in Table 5. Except revolution 1262 values are consistent with zero, and the and parameters for the non-thermal fits are very similar to the thermal fits. Therefore, in Table 5 we only show thermal fit results for these parameters.
| High Energy Cut-off Fits | |||||
| ISGRI Rev | Flux1313131-200 keV Flux in units of ergs cm-2 s-1 | /DOF | |||
| 1261 | 1.610.02 | 345.8113.9 | 74.8 15.7 | 3.690.05 | 407.4/357 |
| 1262 | 1.680.03 | - | - | 3.4220.05 | 310.4/284 |
| 1263 | 1.580.01 | 262.2 83.5 | 68.4 14.5 | 3.100.07 | 235.0/269 |
| 1264 | 1.640.03 | 215.8 70.8 | 91.3 18.4 | 3.000.04 | 295.5/275 |
| 1276 | 1.660.03 | - | - | 0.980.05 | 96.4/ 88 |
| 1279 | 1.700.06 | - | - | 1.260.05 | 89.0/ 94 |
| 1280 | 1.720.06 | - | - | 1.610.04 | 122.0/111 |
| 1282 | 1.610.04 | 129.6 68.2 | 111.6 14.1 | 2.300.05 | 179.7/135 |
| Compps Fits | |||||
| ISGRI Rev | (keV) | /DOF | |||
| 1261 | 73.513.4 | 409.0/358 | |||
| 1262 | 92.923.9 | 317.8/283 | |||
| 1263 | 66.3 8.0 | 239.7/270 | |||
| 1264 | 69.311.8 | 295.7/276 | |||
| 1282 | 119.360.9 | 187.2/136 | |||
| Eqpair Fits141414 is fixed to 1., is fixed to 2.5 and fixed to 0. | |||||
| ISGRI Rev | /DOF151515 of thermal electron energy distribution fits, =0. | 1616162 limits | /DOF171717 of hybrid electron energy distribution fits, is a free parameter | ||
| 1261 | 2.06 0.11 | 12.251.08 | 406.8/357 | 0.48 | 406.6/356 |
| 1262 | 1.23 0.24 | 9.991.12 | 313.1/282 | 0.39 | 306.5/281 |
| 1263 | 2.03 0.31 | 11.511.10 | 240.5/269 | 0.50 | 240.5/268 |
| 1264 | 1.79 0.32 | 10.370.93 | 294.2/275 | 0.78 | 293.5/274 |
| 1282 | 1.32 0.70 | 8.291.18 | 185.4/135 | 0.57 | 188.8/134 |

4 Discussion
4.1 The origin of the flare in X-rays and optical
The secondary flare is clearly visible at hard X-ray and optical wavelengths, starting around MJD and ending by MJD (Figure 2). Flares in optical and infrared are common during the decays of GBHTs. These flares can be attributed to formation of compact jets (Kalemci et al., 2013, and references therein), synchrotron radiation from hot accretion flows (Poutanen & Veledina, 2013, and references therein) and enhanced mass accretion from outer disk or the companion as a response to heating from primary (Augusteijn, Kuulkers & Shaham, 1993; Zurita et al., 2002; Ertan & Alpar, 2002).
Being likely a failed outburst, Swift J174526 did not go through a soft state, and even at the beginning of the decay, the radio emission from the compact jet was present as indicated by the flat to inverted radio spectra from ATCA observations (see Figure 2). While the radio emission is present, whether we could observe infrared emission at the same time depends on the evolution of the break in the jet SED. In MAXI J1836–194, which also performed a failed outburst, the jet never quenched at radio frequencies, but the break in the spectrum between optically thin and partially self-absorbed (flat / inverted) synchrotron emission moved from the mm regime to the infrared regime as the source made a transition back to the hard state. This indicated an increase in the jet power as the source entered the hard state, resulting in a flare in the infrared and optical emission (Russell et al., 2013b, 2014). Similar evolution may be occurring in Swift J174526, whereby the late flare could be a result of break frequency moving towards the infrared. However, the flare in MAXI J1836–194 peaked within a few days of the transition to the hard state, as did the flare of GX 3394 in 2011 (Corbel et al., 2013a). Kalemci et al. (2013) have shown that the infrared flares usually peak about 10-20 days after the source has fully entered the hard state. The late optical and X-ray re-brightening of Swift J174526 occurred about 100 days after the transition to the hard state, which is therefore substantially delayed compared to these synchrotron jet flares. Unfortunately we do not have optical coverage within days of the transition to the hard state, so we do not know if there was an additional optical/infrared flare at that time. The hot accretion flow is also an unlikely explanation for the flare, as throughout the decay that lasts for more than 100 days, there is no significant change in the properties of hard X-rays, and it is difficult to explain why the synchrotron emission suddenly turns on 80 days after the start of the decay.
Independent of the emission mechanism, a late flare could be caused by enhanced mass accretion in response to a previous heating event, which could in principal boost all accretion components at late times (disc emission, hot flow or jet). The event that triggered the enhanced mass accretion for Swift J174526 could be the initial outburst that peaked around MJD 56190, or it could be the increase in the hard X-rays observed between MJD 56260 and MJD 56270 which likely correspond to a transition from an intermediate state to the hard state (Curran et al., 2014). Being observed in both X-rays and optical also support that the origin of this flare is enhanced mass accretion. For such a scenario, one would expect the X-rays to lag the optical flare (Ertan & Alpar, 2002), however, the optical coverage is insufficient to test this prediction.
Such simultaneous X-ray/OIR flares are observed in other sources. XTE J1752223 is such a case in which a late flare occurred 55 days after the transition to the hard state. Russell et al. (2012) measured the SED optical to X-ray spectral index during the flare to be which is consistent with synchrotron emission from a compact jet. A detailed investigation of SMARTS light curves in the and bands show that apart from the large flare with simultaneous enhancement in the OIR and X-rays, there is an earlier, smaller flare observed close to the first detection of the compact core with the VLBA (Chun et al., 2013). Kalemci et al. (2013) interpreted this smaller flare as corresponding to the formation of compact jet, and large simultaneous X-ray/OIR flare as caused by enhanced mass accretion.
Similar behavior is observed during the decay of GX 3394 in its 2007 outburst. The OIR flare that started on MJD 54241 is interpreted as formation of the compact jet in Kalemci et al. (2013). The OIR flare, instead of decaying within a few tens of days as in other outbursts of GX 3394, 4U 154347, and XTE J1550564 (Buxton et al., 2012; Kalemci et al., 2013) lasted for more than 100 days (Dincer et al., 2008). An X-ray flare starts around MJD 52460, that corresponds to a break and a slight increase in the band flux (See Figure 3 of Dincer et al. 2008).
Based on these observations, we claim that there are two types of secondary maxima of OIR emission in GBHTs during outburst decays. During the formation of the compact jets, combination of increase in jet power and/or increase in the frequency of the SED break results in an increase in the OIR emission. These OIR flares are not accompanied by an increase in X-ray flux, and their properties are discussed in detail in Kalemci et al. (2013). The second type of OIR flare is caused by increased mass accretion due to a previous heating event, and these type of flares are accompanied by an increase in X-ray flux. For some sources only one type flare is observed, and for others (like GX 3394 in 2007 and XTE J1752223) both can be observed during the same outburst.
While the underlying mechanism causing the simultaneous secondary X-ray/OIR flares might be the increased mass accretion for these sources, this does not by itself reveal the emission mechanism. Since the source is in the hard state at this time, a mass increase in the disk going towards the black hole may increase the flux of all the accretion components: inner disk, hot flow and the jet. We might obtain some clues about the emission mechanism by investigating the evolution of X-ray spectra as discussed in the next section.
4.2 High energy behavior of the source
Thanks to the wide field of view of the INTEGRAL ISGRI instrument, and pointed observations with Swift XRT, we were able to analyze the broad-band spectral evolution of the source at the beginning of the decay (revolutions 1261-1264), and at the peak of the flare (revolution 1282). We have shown that five revolutions having ISGRI data with good statistical quality require a cut-off in the fit, and we have some evidence (from ) that several of the other probably have a cut-off.
4.2.1 High energy breaks and jets
Both of the sources we observed with our INTEGRAL program, XTE J1752223 and Swift J174526, show presence of a break in the hard X-ray spectrum while the jets are present. This was in contrast to our earlier results from the HEXTE data that indicate disappearance of breaks while the jet turns on. Suspecting that the disappearance of the break is an artifact of the quality of the data, we decided to check the spectra of 4U 154347 and H1743322 during their decays to find which combinations of cut-off and folding energies are statistically acceptable. For both 4U 154347 and H1743322 we found the observations with the best statistics, and multiplied the existing fit with the highecut. As reported earlier in Kalemci et al. (2005) and Kalemci et al. (2006a), the addition of the break into the spectrum is not statistically significant. We then used steppar in XSPEC and varied the cut-off and folding energies and recorded the values. We plotted contours of 5% and 1% levels for which the given folding and cut-off values are acceptable. We show the H1743322 obsid 80137-02-01-01 result as an example in Fig. 6 because it had 6 ks of exposure with RXTE, and had the best statistics for fitting the spectrum. Even at the 5% level, a large parameter space of folding and cut-off energies can fit the data. To illustrate this point further, we placed the cut-off and break energy combinations of Swift J174526 from this work, and all of these combinations would lead to an acceptable fit for the example spectrum of H1743322 that we discuss. For all other observations with RXTE (including observations for 4U 154347), the statistics are even worse than the example given, and basically all combinations of cut-off and folding energies are acceptable, except low cut-off (50 keV) and low folding energy (100 keV) combinations. Therefore, spectra taken with HEXTE on RXTE provide insufficient quality to characterize cut-offs during the decay for typical hard X-ray fluxes. Long INTEGRAL monitoring observations are required to understand the relation between the compact jet formation and hard X-ray behavior.
We can compare the behaviour of the spectral breaks of Swift J174526 with different sources. For 4U 154347, with the formation of the jet, the folding energy and/or the cut-off energy must have increased. For H1743322, no break was necessary in the fit before the presence of compact jets, and this trend continued after the compact jet is observed, so we do not know the evolution, but we can say that even if there is a break, the cut-off and/or folding energies must be high when the compact jet is present. For Swift J174526, we observed an increase in the cut-off energy as the decay progressed during the outburst decay, but we also observed a decrease in the folding energy, resulting in a sharp break in the spectrum. The situation is quite different for XTE J1752223 where we measured a cut-off energy of keV and a folding energy of keV (Chun et al., 2013) indicating a smooth, gradual break at high energies. This observation took place when the compact jet was first observed with the VLBA, but before the large secondary flare. Overall, the behavior of Swift J174526] and XTE J1752223 for which we have high quality INTEGRAL data do not support the argument that the high energy breaks disappear as the jets turn on.
High energy breaks as discussed in this work is a common feature in models invoking both Comptonization and synchrotron as the source of emission. For the model discussed in Pe’er & Markoff (2012), the electrons at the jet base characteristically produce a power law with a photon index of around 1.5 and a break at higher energies. The location of the break is determined by the acceleration mechanism whose details are uncertain. While Pe’er & Markoff (2012) model can roughly reproduce the spectra for both earlier and later revolutions of Swift J174526 (Asaf Peer, personal communication), it cannot place strong constraints on the physical parameters yet.
Recently, based on a broadband observation taken at MJD 56446 at the end of the secondary flare (the last i′ data in Figure 2), Grebenev, Prosvetov & Burenin (2014) claimed that emission at the time may be dominated by jet emission since a single power-law can fit the entire SED from optical to Gamma-rays. They first take the optical and a single Swift BAT flux, and fitted them with a single power-law by modifying the . Then they added Swift XRT spectra taken 10 days earlier (last observation in Table 2), and showed that the single power-law with an of atoms cm-2 found from the optical to BAT fit also fits the XRT data. While this result seems intriguing, we do not think that the quality of the data is sufficient for arriving at strong conclusions about the emission mechanism. We have also analysed the same XRT data using their absorption model, and found that the fit gives atoms cm-2 . Therefore errors on both the power-law index and are quite large, and it is not surprising that a single power-law passes through all XRT data.
4.2.2 Comptonization models
The behavior of hard X-rays can be well explained by Comptonization for Swift J174526. The thermal Comptonization model compps fits provide reduced values close to 1. Finally, all revolutions, except revolution 1262, can be fitted with the eqpair model without requiring a hybrid electron plasma. Therefore, except revolution 1262, the high energy behavior of the source is consistent with thermal Comptonization of disk photons. Fig. 5 show that phenomenological and physical fits all represent the data very well (which is not surprising, see discussion in Coppi 1999).
Even for revolution 1262 a thermal Comptonization model cannot be ruled out given the very small improvement of of the hybrid case to that of the thermal case (see Table 5). The compps still provides an acceptable fit (reduced of 1.123). We added a hard power-law to compps fit (following Joinet et al. 2007) to test the presence of additional components due to non-thermal Comptonization. The fitted power-law index was 1 (not constrained), and the improvement in the was marginal (with an chance probability of 0.008).
While non-thermal electron energy distributions are commonly required in the intermediate and sometimes in the soft states (Del Santo et al., 2008; Gierliński et al., 1999; Malzac et al., 2006), they are rarely required in the hard states, and all claims of non-thermal electron distributions in the hard state are during bright hard states at the outburst rise (Joinet et al., 2007; Droulans et al., 2010; Caballero García et al., 2007; McConnell et al., 2000). Thanks to our INTEGRAL observing program, now we obtained high quality data extending above 300 keV for two sources in the hard state during the decay, XTE J1752223 (Chun et al., 2013) and Swift J174526, and for both sources fits are consistent with thermal Comptonization. Continuing dedicated INTEGRAL observations of GBHTs during outburst decays is very important to establish patterns in the high energy behavior, and to compare these patterns with the behavior during outburst rise.
5 Summary
We characterized the multiwavelength evolution of Swift J174526 during the decay of the 2013 outburst using X-ray data from INTEGRAL ISGRI, JEM-X and Swift XRT, optical observations taken at FTS and TUG and radio observations of ATCA. We fit the X-ray spectra with thermal and hybrid Comptonization models as well as phenomenological models. Our main findings can be summarized as follows:
-
•
We concluded that the physical origin of a flare observed both in optical and X-rays 170 days after the peak of the outburst that lasted for 50 days is enhanced mass accretion in response to an earlier heating event.
-
•
We showed that a high energy break is needed in the spectra, and for the joint ISGRI-XRT fits, the cut-off energy increased from 75 keV to 112 keV while the folding energy decreased from 350 keV to 130 keV as the decay progresses.
-
•
We investigated the claim that high energy cut-offs disappear with the compact jet turning on during outburst decays, and showed that spectra taken with HEXTE on RXTE provide insufficient quality to characterize cut-offs during the decay for typical hard X-ray fluxes. Data taken with INTEGRAL do not support the claim of disappearance of spectral breaks.
-
•
We found that for the entire decay (including the flare) the X-ray spectra are consistent with thermal Comptonization, but jet synchrotron origin cannot be ruled out.
Acknowledgments
E.K and T.D. acknowledge TÜBİTAK 1001 Project 111T222, the EU FP7 Initial Training Network Black Hole Universe, ITN 215212. JAT acknowledges partial support from NASA Astrophysics Data Analysis Program grant NNX11AF84G and Swift Guest Observer grant NNX13AJ81G. The Faulkes Telescope South is maintained and operated by Las Cumbres Observatory Global Telescope Network. DMR acknowledges support from a Marie Curie Intra European Fellowship within the 7th European Community Framework Programme (FP7) under contract no. IEF 274805. TMB acknowledges support from INAF PRIN 2012-6. EK thanks J. Chenevez, C. A. Oxborrow and N. Westergaard of DTU Space for JEM-X analysis tips, and A. Pe’er and S. Markoff for valuable discussions on hard X-ray contribution from jets. T.G. acknowledges support from Bilim Akademisi - The Science Academy, Turkey under the BAGEP program.
References
- Augusteijn, Kuulkers & Shaham (1993) Augusteijn T., Kuulkers E., Shaham J., 1993, A&A, 279, L13
- Belloni et al. (2012) Belloni T. et al., 2012, The Astronomer’s Telegram, 4450
- Belloni (2010) Belloni T. M., 2010, in Lecture Notes in Physics, Berlin Springer Verlag, Vol. 794, Lecture Notes in Physics, Berlin Springer Verlag, T. Belloni, ed., p. 53
- Blandford & Konigl (1979) Blandford R. D., Konigl A., 1979, ApJ, 232, 34
- Brocksopp, Bandyopadhyay & Fender (2004) Brocksopp C., Bandyopadhyay R. M., Fender R. P., 2004, New Astronomy, 9, 249
- Buxton & Bailyn (2004) Buxton M., Bailyn C. D., 2004, ApJ, 615, 880
- Buxton et al. (2012) Buxton M., Bailyn C. D., Capelo H., Chatterjee R., Dincer T., Kalemci E., Tomsick J. A., 2012, AJ, 143, 130
- Caballero García et al. (2007) Caballero García M. D. et al., 2007, ApJ, 669, 534
- Cadolle Bel et al. (2004) Cadolle Bel M. et al., 2004, A&A, 426, 659
- Capitanio et al. (2009) Capitanio F., Belloni T., Del Santo M., Ubertini P., 2009, MNRAS, 398, 1194
- Chun et al. (2013) Chun Y. Y. et al., 2013, ApJ, 770, 10
- Coppi (1999) Coppi P. S., 1999, in ASP Conf. Ser. 161: High Energy Processes in Accreting Black Hole, eds. Poutanen, J. and Svensson, R.
- Corbel et al. (2013a) Corbel S. et al., 2013a, MNRAS, 431, L107
- Corbel et al. (2013b) Corbel S., Coriat M., Brocksopp C., Tzioumis A. K., Fender R. P., Tomsick J. A., Buxton M. M., Bailyn C. D., 2013b, MNRAS, 428, 2500
- Corbel et al. (2012) Corbel S., Edwards P., Tzioumis T., Coriat M., Fender R., Brocksopp C., 2012, The Astronomer’s Telegram, 4410
- Corbel & Fender (2002) Corbel S., Fender R. P., 2002, ApJ, 573, L35
- Corbel et al. (2000) Corbel S., Fender R. P., Tzioumis A. K., Nowak M., McIntyre V., Durouchoux P., Sood R., 2000, A&A, 359, 251
- Coriat et al. (2009) Coriat M., Corbel S., Buxton M. M., Bailyn C. D., Tomsick J. A., Körding E., Kalemci E., 2009, MNRAS, 400, 123
- Courvoisier et al. (2003) Courvoisier T. J.-L. et al., 2003, A&A, 411, L53
- Cummings et al. (2012) Cummings J. R. et al., 2012, GRB Coordinates Network, 13775
- Curran et al. (2014) Curran P. A. et al., 2014, MNRAS, 437, 3265
- de Ugarte Postigo et al. (2012) de Ugarte Postigo A., Sanchez-Ramirez R., Munoz-Darias T., Gorosabel J., Thoene C. C., Cabrera-Lavers A., 2012, The Astronomer’s Telegram, 4388
- Del Santo et al. (2008) Del Santo M., Malzac J., Jourdain E., Belloni T., Ubertini P., 2008, MNRAS, 390, 227
- Dinçer et al. (2012) Dinçer T., Kalemci E., Tomsick J. A., Buxton M., Bailyn C., Corbel S., 2012, ApJ, 753, 55
- Dincer et al. (2008) Dincer T., Kalemci E., Tomsick J. A., Buxton M., 2008, in Proceedings of the VII Microquasar Workshop: Microquasars and Beyond, Kalemci E., ed., (Turkey: Foca, Izmir), pp. 61, http://pos.sissa.it/cgi–bin/reader/conf.cgi?confid=62
- Droulans et al. (2010) Droulans R., Belmont R., Malzac J., Jourdain E., 2010, ApJ, 717, 1022
- Ertan & Alpar (2002) Ertan Ü., Alpar M. A., 2002, A&A, 393, 205
- Fender (2010) Fender R., 2010, in Lecture Notes in Physics, Berlin Springer Verlag, Vol. 794, Lecture Notes in Physics, Berlin Springer Verlag, T. Belloni, ed., p. 115
- Fender (2001) Fender R. P., 2001, MNRAS, 322, 31
- Fender & Gallo (2014) Fender R. P., Gallo E., 2014, accepted for publication in Space Science Reviews; arXiv:1407.3674
- Ferrigno et al. (2012) Ferrigno C., Bozzo, E., Del Santo M., Capitanio, F., 2012, A&A, 537, L7
- Gierliński et al. (1999) Gierliński M., Zdziarski A. A., Poutanen J., Coppi P. S., Ebisawa K., Johnson W. N., 1999, MNRAS, 309, 496
- Gilfanov (2010) Gilfanov M., 2010, in Lecture Notes in Physics, Berlin Springer Verlag, Vol. 794, Lecture Notes in Physics, Berlin Springer Verlag, T. Belloni, ed., p. 17
- Grebenev, Prosvetov & Burenin (2014) Grebenev S. A., Prosvetov A. V., Burenin R. A., 2014, Astronomy Letters, 40, 171
- Grebenev & Sunyaev (2012) Grebenev S. A., Sunyaev R. A., 2012, The Astronomer’s Telegram, 4401
- Homan et al. (2001) Homan, J., Wijnands, R., van der Klis, M., Belloni, T., van Paradijs, J., Klein-Wolt, M., Fender, R., Méndez, M., 2001, ApJS, 132, 377
- Hjellming & Johnston (1988) Hjellming R. M., Johnston K. J., 1988, ApJ, 328, 600
- Jain et al. (2001) Jain R. K., Bailyn C. D., Orosz J. A., McClintock J. E., Remillard R. A., 2001, ApJ, 554, L181
- Joinet et al. (2007) Joinet A., Jourdain E., Malzac J., Roques J. P., Corbel S., Rodriguez J., Kalemci E., 2007, ApJ, 657, 400
- Joinet, Kalemci & Senziani (2008) Joinet A., Kalemci E., Senziani F., 2008, ApJ, 679, 655
- Kalemci et al. (2013) Kalemci E., Dincer T., Tomsick J. A., Buxton M. M., Bailyn C. D., Chun Y. Y., 2013, ApJ, 779, 95
- Kalemci et al. (2005) Kalemci E., Tomsick J. A., Buxton M. M., Rothschild R. E., Pottschmidt K., Corbel S., Brocksopp C., Kaaret P., 2005, ApJ, 622, 508
- Kalemci et al. (2006a) Kalemci E., Tomsick J. A., Rothschild R. E., Pottschmidt K., Corbel S., Kaaret P., 2006a, ApJ, 639, 340
- Kalemci et al. (2006b) Kalemci E., Tomsick J. A., Rothschild R. E., Pottschmidt K., Migliari S., Corbel S., Kaaret P., 2006b, in VI Microquasar Workshop: Microquasars and Beyond
- Lewis et al. (2008) Lewis F., Russell D. M., Fender R. P., Roche P., Clark J. S., 2008, in Microquasars and Beyond, p. 69
- Maitra et al. (2009) Maitra D., Markoff S., Brocksopp C., Noble M., Nowak M., Wilms J., 2009, MNRAS, 398, 1638
- Makishima et al. (1986) Makishima K., Maejima Y., Mitsuda K., Bradt H. V., Remillard R. A., Tuohy I. R., Hoshi R., Nakagawa M., 1986, ApJ, 308, 635
- Malzac et al. (2006) Malzac J. et al., 2006, A&A, 448, 1125
- Markoff, Falcke & Fender (2001) Markoff S., Falcke H., Fender R., 2001, A&A, 372, L25
- Markoff, Nowak & Wilms (2005) Markoff S., Nowak M. A., Wilms J., 2005, ApJ, 635, 1203
- McClintock & Remillard (2006) McClintock J. E., Remillard R. A., 2006, Black hole binaries, Lewin, W. H. G. & van der Klis, M., ed., pp. 157–213
- McConnell et al. (2000) McConnell M. L. et al., 2000, ApJ, 543, 928
- Miller-Jones & Sivakoff (2012) Miller-Jones J. C. A., Sivakoff G. R., 2012, The Astronomer’s Telegram, 4394
- Miyakawa et al. (2008) Miyakawa T., Yamaoka K., Homan J., Saito K., Dotani T., Yoshida A., Inoue H., 2008, PASJ, 60, 637
- Motta, Belloni & Homan (2009) Motta S., Belloni T., Homan J., 2009, MNRAS, 400, 1603
- Muñoz-Darias et al. (2013) Muñoz-Darias T. et al., 2013, MNRAS, 432, 1133
- Nowak et al. (2011) Nowak M. A. et al., 2011, ApJ, 728, 13
- Pe’er & Markoff (2012) Pe’er A., Markoff S., 2012, ApJ, 753, 177
- Poutanen & Svensson (1996) Poutanen J., Svensson R., 1996, ApJ, 470, 249
- Poutanen & Veledina (2013) Poutanen J., Veledina A., 2013, Space Sci.Rev., arxiv/1312.2761
- Rau et al. (2012) Rau A., Knust F., Kann D. A., Greiner J., 2012, The Astronomer’s Telegram, 4380
- Reynolds & Miller (2013) Reynolds M. T., Miller J. M., 2013, ApJ, 769, 16
- Russell et al. (2012) Russell D. M. et al., 2012, MNRAS, 419, 1740
- Russell et al. (2013a) Russell D. M., Lewis F., Munoz-Darias T., Kalemci E., 2013a, The Astronomer’s Telegram, 5084
- Russell et al. (2010) Russell D. M., Maitra D., Dunn R. J. H., Markoff S., 2010, MNRAS, 405, 1759
- Russell et al. (2011) Russell D. M., Miller-Jones J. C. A., Maccarone T. J., Yang Y. J., Fender R. P., Lewis F., 2011, ApJ, 739, L19
- Russell et al. (2013b) Russell D. M. et al., 2013b, ApJ, 768, L35
- Russell et al. (2014) Russell T. D., Soria R., Miller-Jones J. C. A., Curran P. A., Markoff S., Russell D. M., Sivakoff G. R., 2014, MNRAS, 439, 1390
- Sbarufatti et al. (2012) Sbarufatti B. et al., 2012, The Astronomer’s Telegram, 4383
- Sbarufatti et al. (2013) Sbarufatti B., Kennea J. A., Stroh M. C., Burrows D. N., Evans P. A., Beardmore A. P., Krimm H. A., Gehrels N., 2013, The Astronomer’s Telegram, 4782
- Soleri et al. (2013) Soleri P. et al., 2013, MNRAS, 429, 1244
- Tomsick, Del Santo & Belloni (2012) Tomsick J. A., Del Santo M., Belloni T., 2012, The Astronomer’s Telegram, 4393
- Veledina, Poutanen & Vurm (2013) Veledina A., Poutanen J., Vurm I., 2013, MNRAS, 430, 3196
- Verner et al. (1996) Verner D. A., Ferland G. J., Korista K. T., Yakovlev D. G., 1996, ApJ, 465, 487
- Vovk et al. (2012) Vovk I. et al., 2012, The Astronomer’s Telegram, 4381
- Wilms, Allen & McCray (2000) Wilms J., Allen A., McCray R., 2000, ApJ, 542, 914
- Zurita et al. (2002) Zurita C. et al., 2002, MNRAS, 334, 999