Systematic variation of the 12CO / 13CO ratio as a function of star-formation rate surface density
Abstract
We show that the 12CO/13CO intensity ratio in nearby galaxies varies systematically as a function of the star formation rate surface density () and gas surface density. The same effect is observed in different transitions, and in the 12CO/C18O ratio, while the 13CO/C18O ratio appears to remain constant as a function of . We discuss the cause of these variations, considering both changes in the physical state of the gas, and chemical changes that lead to abundance variations. We used the observed correlations with C18O to suggest that abundance variations are unlikely to be causing the systematic trend observed with , and thus that the mean gas temperature and/or velocity dispersion are systematically higher in higher star-formation rate surface density regions. We present the best fitting relations between and the 12CO/13CO and 12CO/C18O ratios, and discuss how this effect can help us predict CO isotope emission from galaxies across the known universe.
keywords:
ISM: molecules – galaxies: ISM – ISM: abundances – galaxies: star formation1 Introduction
Improving our knowledge of the build-up of stellar mass in the universe is crucially linked to better understanding the behaviour of baryons in the gas phase, especially in the cold atomic and molecular phases that are tightly linked to star-formation. The most abundant hydrogen component of atomic gas is directly observable in the local universe, thanks to the 21cm transition of HI. Tracing molecular H2, however, requires the use of proxy molecules (such as carbon monoxide) which have suitable transitions in the millimetre regime, and which are excited even in the cold conditions found in typical molecular clouds.
In the ALMA (Atacama Large Millimeter/submillimeter Array) era observations of molecular species that were previously difficult to observe will become commonplace. Extragalactically this will enable even high-redshift observers to move beyond simple, optically thick molecules like 12CO to observing rarer isotopes (such as 13CO and C18O), and high density gas tracers like HCN and CS (e.g. Spilker et al., 2014).
The rare CO isotopes are especially tempting targets, as they are significantly more optically thin than 12CO, and thus are usually thought to provide more information on the underlying molecular gas column and volume densities (e.g. Pineda et al. 2008; Wilson 2009). In order to obtain this information however, one typically needs information on the abundance of 13CO with respect to 12CO, the optical depth of these molecules, and the CO -factor.
The CO -factor, and its variation with galaxy properties, has been discussed at length in the literature (e.g Leroy et al., 2011; Sandstrom et al., 2013; Bolatto, Wolfire & Leroy, 2013), but the effect of global galaxy properties on these other two quantities has received less attention. Some works have suggested that the 12CO / 13CO ratio is higher in mergers and (ultra-)luminous infrared galaxies (e.g. Casoli, Dupraz & Combes, 1992; Taniguchi & Ohyama, 1998; Taniguchi, Ohyama & Sanders, 1999; Glenn & Hunter, 2001), but if this is a discrete change caused by the extreme conditions in these systems, or a continuous process has not been determined. 12CO / 13CO ratios are also known to vary with galacticentric radius in extragalactic systems and in our own Milky Way (Wilson, 1999; Paglione et al., 2001).
We use existing archival observations of 12CO, 13CO and C18O to show that there are systematic changes in these quantities as a function of the the star-formation rate (SFR) surface density (or equivalently gas surface density; quantities linked through the Kennicutt-Schmidt relation: Kennicutt 1998). In Section 2 we discuss briefly our sample selection, before presenting these results. We consider the cause of this effect in Section 3, and discuss its impact and prospects for the future in Section 4.
Throughout this paper we adopt the abundances of [12C/13C] =70 and [16O/18O] =200. These values will almost certainly change in individual objects, but the adopted values lie in the middle of the range found for extragalactic objects ([12C/13C]40-130; e.g. Henkel & Mauersberger 1993; Mao et al. 2000; Martín et al. 2010 and [16O/18O]150-250; e.g. Sage, Henkel & Mauersberger 1991; Henkel & Mauersberger 1993; Wilson & Rood 1994), and thus these abundances provide a reasonable standard reference. Unless otherwise indicated all molecular line ratios discussed in this paper are intensity ratios.
2 Results
2.1 Sample
2.1.1 Molecular data
We collected data on the gas and star-formation properties of a sample of nearby spiral, starburst and early-type galaxies which have published 13CO detections (see Table 1). We based this search on the compilation of 12CO/13CO intensity ratios in Krips et al. (2010), adding additional galaxies from various other sources to cover a range in star-formation and gas properties. This includes the gas rich early-type galaxies of Krips et al. (2010) and Crocker et al. (2012), but removing the Virgo cluster early-type objects which have a different behaviour, discussed in detail in Alatalo et al., in prep.
We also checked the literature for C18O detections of the sample objects, in particular utilising the catalogue of Tan et al. (2011). In this paper we show mainly correlations with the ground state rotational transitions of the 12CO, 13CO and C18O molecules. Data for the 13CO(2-1) transitions do exist for some objects, and show the same trends. We also include this data in Table 1.
2.1.2 Star formation properties
The star formation rate surface densities (and gas surface densities) we use in this work are mainly taken from Kennicutt (1998) for the spiral and starburst galaxies (derived using H emission in spirals and far infrared emission in galaxies with circum-nuclear starbursts; Kennicutt 1998) and Davis et al. (2014) for early-type galaxies (here we use their star-formation rates derived from 22m and far-ultraviolet emission, corrected for the effect of old stellar populations). These objects cover a wide range of infrared luminosities (from 107-1011 L⊙; Telesco, Harper & Loewenstein 1976; Larsen & Richtler 2000), however they may not be good proxies for very luminous starburst galaxies, especially those studied at high redshift (e.g. Danielson et al., 2013). Table 1 lists the salient properties of the galaxies included in our sample, and the references from which the values are drawn.
Although we use different tracers of star formation in this work, the majority of these objects are well studied nearby spiral/starbursting galaxies, in which various tracers have been observed (and indeed many of these galaxies are used as the basis for SFR calibrations). Overall, using different tracers of star formation in these galaxies results in a scatter of 0.35 dex in the star-formation rates, but with no systematic offset (see e.g. Rosa-González, Terlevich & Terlevich 2002; Calzetti et al. 2007 for a full discussion). We thus expect that using different tracers will not unduly affect the observed relations. As a test we performed our analysis only on the subsample of galaxies where has been estimated from far infrared emission, and found that the results stated in this paper do not change.
2.1.3 Aperture effects
We stress that the values we use here are global, averaged over the entire galaxy disk. However, the 12CO, 13CO and C18O detections are from single dish telescope observations toward galaxy centres. In general these observations had a large beam size (22′′ at 3mm for the majority of these observations that were taken with the IRAM-30m telescope) so that the measured line emission arises from the majority of the galaxies star-forming disk (the inner 10 kpc, depending on distance). The millimetre line ratios and SFR should thus be comparable (as both the star formation and gas in galaxies are centrally concentrated). However, as formally these quantities are not measured in the same apertures this could increase the scatter on correlations determined from these data; for instance if radial gradients are present. We check for such effects in Section 3.3, and do not see strong evidence for any bias. Ideally, however, one would extend this work using resolved maps of star-formation rate densities and gas properties to formally match these quantities, but that is outside the scope of this first paper.
| Name | Tracer | Ref. | 12CO(1-0)/13CO(1-0) | Ref. | 12CO(2-1)/13CO(2-1) | Ref. | 12CO/C18O | Ref | |
|---|---|---|---|---|---|---|---|---|---|
| (1) | (2) | (3) | (4) | (5) | (6) | (7) | (8) | (9) | (10) |
| Circinus | 0.80 | 24m | 11 | 10.1 1.4 | 13 | – | – | 54.4 5.4 | 15 |
| IC0676 | -0.46 | 22m+FUV | 2 | 7.5 1.2 | 13 | 8.3 1.3 | 13 | – | – |
| IC1024 | -0.93 | 22m+FUV | 2 | 15.1 2.8 | 13 | 8.1 1.2 | 13 | – | – |
| IC342 | -0.41 | FIR | 1 | 8.4 0.5 | 13 | – | – | 35.1 3.0 | 15 |
| Maffei2 | -2.36 | FIR | 12 | 8.4 1.0 | 16 | – | – | 31.6 5.4 | 18 |
| NGC0891 | -2.39 | 24m | 6 | 5.0 0.5 | 13 | – | – | – | – |
| NGC1068 | 1.80 | 8m | 20 | 13.5 3.7 | 13 | 16.7 2.8 | 13 | 47.8 12.7 | 16 |
| NGC1222 | 0.55 | 22m+FUV | 2 | 21.1 4.1 | 13 | 20.0 4.1 | 13 | – | – |
| NGC1266 | 1.73 | 22m+FUV | 2 | 30.9 5.3 | 13 | 24.8 3.7 | 13 | – | – |
| NGC1808 | 0.08 | FIR | 1 | 16.7 2.8 | 13 | 14.3 2.0 | 13 | 48.9 3.3 | 15 |
| NGC2146 | 0.84 | FIR | 1 | 12.5 1.6 | 13 | 10.0 1.0 | 13 | 32.7 9.1 | 15 |
| NGC253 | 1.24 | FIR | 1 | 10.0 1.0 | 13 | 12.0 1.2 | 19 | 61.0 6.2 | 15 |
| NGC2764 | -0.82 | 22m+FUV | 2 | 10.8 1.7 | 13 | 11.6 1.8 | 13 | – | – |
| NGC3032 | -1.26 | 22m+FUV | 2 | 9.5 1.5 | 14 | 5.3 0.8 | 14 | – | – |
| NGC3034 | 1.48 | FIR | 1 | 14.3 1.4 | 13 | 10.0 1.0 | 13 | 54.5 13.0 | 15 |
| NGC3079 | 1.63 | FIR | 1 | 16.7 2.8 | 13 | 14.3 2.0 | 13 | – | – |
| NGC3184 | -2.76 | FIR | 10 | 4.9 1.2 | 13 | – | – | – | – |
| NGC3256 | 0.68 | FIR | 1 | 33.3 11.1 | 13 | 10.0 4.0 | 13 | 91.6 28.1 | 15 |
| NGC3556 | -2.38 | Radio. Cont. | 7 | 8.7 1.4 | 13 | – | – | – | – |
| NGC3593 | -0.17 | FIR | 8 | 10.6 2.2 | 13 | – | – | – | – |
| NGC3607 | -2.22 | 22m+FUV | 2 | 5.9 1.0 | 13 | 6.4 1.3 | 13 | – | – |
| NGC3627 | -0.77 | FIR | 1 | 16.7 1.7 | 13 | – | – | – | – |
| NGC3628 | -2.73 | FIR | 10 | 8.3 1.4 | 13 | 10.0 2.0 | 13 | – | – |
| NGC3665 | -2.34 | 22m+FUV | 2 | 3.0 0.5 | 13 | 2.4 0.4 | 13 | – | – |
| NGC3982 | -1.19 | H | 3 | 14.3 2.0 | 13 | – | – | – | – |
| NGC4150 | -1.41 | 22m+FUV | 2 | 13.7 3.2 | 14 | 12.2 2.4 | 14 | – | – |
| NGC4258 | -2.36 | H | 1 | 10.0 1.0 | 13 | – | – | – | – |
| NGC4826 | -2.47 | H | 1 | 8.3 1.4 | 13 | 7.7 1.2 | 13 | 19.0 2.7 | 15 |
| NGC4945 | 1.22 | FIR | 9 | 16.7 2.8 | 13 | 9.1 0.8 | 13 | – | – |
| NGC5033 | -2.64 | H | 1 | 8.3 0.7 | 13 | – | – | – | – |
| NGC5055 | -2.32 | H | 1 | 5.7 0.6 | 13 | – | – | – | – |
| NGC5194 | -1.78 | FIR | 1 | 6.7 0.7 | 13 | 10.0 1.0 | 13 | 29.1 10.3 | 15 |
| NGC5236 | -1.41 | FIR | 1 | 10.0 1.0 | 13 | 10.0 3.0 | 13 | – | – |
| NGC5866 | -0.64 | 22m+FUV | 2 | 6.2 0.9 | 13 | 4.3 0.7 | 13 | – | – |
| NGC6014 | -2.16 | 22m+FUV | 2 | 9.0 2.0 | 13 | 6.7 1.1 | 13 | – | – |
| NGC6946 | -1.88 | FIR | 1 | 13.3 1.3 | 13 | – | – | 21.0 3.0 | 17 |
| NGC7172 | -2.40 | H | 4 | 6.7 0.7 | 13 | – | – | – | – |
| NGC7331 | -2.33 | H | 1 | 7.1 0.7 | 13 | 5.9 1.0 | 13 | – | – |
| NGC7469 | 0.66 | FIR | 5 | 16.7 1.7 | 13 | 20.0 2.0 | 13 | – | – |
| NGC7552 | 0.16 | FIR | 1 | 14.3 2.0 | 13 | 9.1 1.7 | 13 | – | – |
| PGC058114 | -0.16 | 22m+FUV | 2 | 18.9 4.1 | 14 | 14.4 2.8 | 14 | – | – |
Notes: Column 1 contains the names of the galaxies considered in this work. Column 2 contains the base-10 logarithm of their globally integrated surface density of star formation in units of M⊙ yr-1 kpc-2. Column 3 and 4 contain the SFR tracer, and the references, respectively. The 12CO(1-0)/13CO(1-0) flux density ratio is given in Column 5, along with its associated error, while Column 6 lists the reference these were taken from. Columns 7 and 8 similarly show the 12CO(2-1)/13CO(2-1) values and references, while Columns 9 and 10 show the 12CO/C18O ratios with errors, and references. References; 1: Kennicutt (1998), 2: Davis et al. (2014), 3: Zhang, Gu & Wang (2008), 4: Hameed & Devereux (2005), 5: Papadopoulos & Allen (2000), 6: Yim et al. (2011), 7: King & Irwin (1997), 8: García-Burillo et al. (2000), 9: Dahlem et al. (1993), 10: Larsen & Richtler (2000), 11: For, Koribalski & Jarrett (2012), 12: Turner & Ho (1994), 13: Krips et al. (2010), 14: Crocker et al. (2012), 15: Tan et al. (2011), 16: Aladro et al. (2013), 17: Meier & Turner (2004), 18: Meier, Turner & Hurt (2008), 19: Rosenberg et al. (2014). 20:Tsai et al. (2012).
2.2 12CO / 13CO as a function of

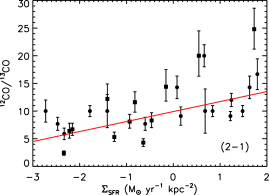
Using the literature data from Table 1, following other authors we do not find a dependance of the 12CO / 13CO intensity ratio with total star formation rate. However, as shown in Figure 1 we report for the first time a strong positive correlation (Spearmans rank correlation coefficient of 0.755 for the ground transition) between the 12CO / 13CO intensity ratio and . We show on Figure 1 the best linear fit to this correlation (plotted as a red line), finding that
| (1) |
and
| (2) |
Thus within errors both transitions follow the same trend. We warn however that these fits were conducted using standard least-squares techniques, with points weighted by the formal error bars shown in the plots. The error bars in the 12CO / 13CO ratios are in reality non-gaussian (when estimated from low signal-to-noise data; see Crocker et al. 2012 for a full discussion). Correcting the literature data used in this paper for this effect is beyond the scope of this work, and thus the exact values of the slope and intercept in these fits should be treated with caution. The effect of non-gaussian errors should be considered in future studies of this phenomenon.
Throughout this work the reported correlations are equally strong when plotted as a function of or gas surface density (as expected due to these parameters being linked in the Schmidt-Kennicutt Relation; e.g. Kennicutt 1998). Which of these parameters drives the effect (or indeed if either parameter does) will be discussed in Section 3.
In Figure 1 the spiral and starburst galaxies are shown with black circles, and the early-type objects with black squares. No significant difference between the two populations is detectable. Nuclear activity also appears to matter little, with Seyfert, starburst and star-forming nuclei (as defined in Krips et al. 2010) all following the same mean trend. Two galaxies do appear to have significantly higher 12CO / 13CO ratios then the mean population. Interestingly these objects (NGC1266 and NGC3256) both have nuclear molecular outflows (Alatalo et al. 2011; Sakamoto et al. 2014). M82 (NGC3034) which has a famous starburst driven outflow is also present in this work, but follows the same mean trend as the normal galaxies. The outflowing gas is at large radii in this object, and this may explain why we do not detect any differences in the 12CO / 13CO ratio within the nuclear region.
2.3 Correlations with C18O
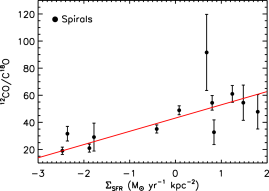
In Table 1 we also tabulate C18O line intensity ratios for objects where this data exists. C18O is a rare molecule, ensuring it is almost always optically thin. It also is produced via different nucleosynthetic pathways than 13CO, giving it substantial power to break degeneracies present in studies of only the 12CO/13CO ratio. In Figure 2 we show that the 12CO/C18O ratio also shows a positive correlation with (once again the outlier is molecular outflow galaxy NGC3256). We again show the best linear fit as a red line, finding that
| (3) |
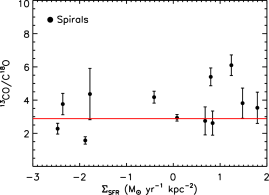
In Figure 3 we show the ratio of 13CO to C18O, plotted against . The line ratio is consistent with being flat over 5 orders of magnitude in , with a fitted intercept of 2.89 (despite the small number of detected objects and large observational errors). The observed line ratios are all consistent with the simple ratio between our adopted abundances of [13CO/C18O] = 200/70 = 2.86. This suggests both that 13CO is not becoming significantly optically thick in these objects, and that the relative fractional abundance of these molecules does not change as a function of .
3 Discussion
In the previous Section we have shown that the 12CO/13CO intensity ratio varies systematically as a function of (Figure 1). The same trend is observed in the 12CO/C18O ratio (Figure 2). Galaxies of different types follow the same trend, and the trend is not found to alter in objects with significant nuclear activity. Galaxies with nuclear molecular outflows, however, do tend to lie above the relation. We below discuss the potential physical drivers of the observed correlations.
Previous studies have shown that the 12CO / 13CO intensity ratio is higher in (ultra-)luminous infrared galaxies (e.g. Casoli, Dupraz & Combes, 1992; Glenn & Hunter, 2001), and that this line ratio appears to correlate with total star-formation rate (or a proxy such a far-infrared luminosity; e.g. Taniguchi & Ohyama, 1998; Taniguchi, Ohyama & Sanders, 1999). We show here for the first time that this effect can be observed in galaxies of all types, down to much lower total star-formation rates, and appears to be linked to rather than the total star-formation rate itself. ULIRGs tend to be very compact star-forming systems at low redshift, and so for them a change in total star-formation rate likely also indicates a change in . The same is not true in spiral and early-type galaxies, and thus a strong correlation does not exist between total SFR and the 12CO / 13CO intensity ratio in our study.
3.1 Cause of the observed variations
In order to produce the changes in the 12CO/13CO ratio we observe:
-
1.
the lines could be excited differently. However, as we are observing low- CO lines, and we see the same relation for both the =1–0 and =2–1 transitions, we consider this unlikely, and do not discuss this possibility further here.
-
2.
there is a change in the fractional abundance of 13CO and C18O with respect to 12CO. The fractional abundance of 13CO and C18O can be affected by selective photodissociation, isotope dependant fractionation and selective nucleosynthesis. We discuss each of these processes in detail below.
-
3.
the optical depth of the gas is changing. In order to reproduce the observed effect either 12CO or 13CO could be becoming more optically thin in high galaxies. One can distinguish between the possibilities using C18O, which has a sufficiently low abundance to be almost always optically thin. As shown in Figure 3 the ratio of 13CO/C18O does not change as a function of , as would be expected if the 13CO optical depth was changing. We therefore here suggest that (if optical depth changes are causing this correlation) this is caused by a change in the optical depth of 12CO. This possibility will be discussed further in Section 3.2.
3.1.1 Selective photodissociation of 13CO and C18O
In a strong starburst OB stars emit large amounts of light in the ultraviolet, generating a strong interstellar radiation field. This emission penetrates some distance into molecular clouds, but is unable to photodissociate substantial amounts of 12CO due to shielding effects (van Dishoeck & Black, 1988). 13CO however is not as protected, and will be preferentially destroyed as the UV radiation field increases in strength. This could naturally lead to the observed correlation, as galaxies with high SFR surface densities will form more OB stars per unit area and thus have a stronger interstellar radiation field. However, C18O is dissociated three times faster than 13CO (due to a combination of lower self shielding and differences in its molecular structure; van Dishoeck & Black 1988), inconsistent with the apparent constant 13CO/C18O intensity ratios in Figure 3. This suggests selective photodissociation is not the dominant effect driving the correlation in Figure 1.
3.1.2 Isotope dependant fractionation
In cold regions (10 K) the rapid exothermic exchange of the 13C+ ion with 12C in 12CO preferentially forms 13CO (e.g. Watson, Anicich & Huntress, 1976; Keene et al., 1998). In regions with higher temperatures, however, rapid ion exchange would negate the effects of this process. The decrease in 12CO abundance would not be noticeable, due to the large optical depth of this transition, but the 12CO/ 13CO intensity ratio would be observed to change, as the additional 13CO would emit more strongly.
If the mean temperature of the clouds in our galaxies increases as a function of (as might be expected, due to the increased contribution of heating from newly formed stars) this could create a correlation that resembles that seen in Figure 1. Whether the cloud temperatures in the disks of our galaxies are really low enough to support large-scale fractionation is difficult to determine. However, this fractionation process would change the 13CO abundance with respect to C18O (which is unaffected by fractionation), inconsistent with the apparent constant 13CO/C18O intensity ratios in Figure 3.
If the does correlate with the mean temperature in the clouds, then it is also possible that local freeze out of CO onto the ices coating dust grains could alter the fractional abundances in a systematic way. However, freeze out is not expected to effect galaxy scale abundances, as the fraction of gas as ice is negligible, even in cold Galactic systems.
3.1.3 Selective nucleosynthesis of 12C
Massive stars that end their lives as supernovae produce 12C, but do not produce significant amounts of 13C, which is instead produced primarily by low mass stars, and injected into the ISM from AGB star winds (e.g. Sage, Henkel & Mauersberger, 1991). Thus one could explain the positive correlation we see between the 12CO/13CO intensity ratio and as a timescale effect, where selective nucleosynthesis of 12C in highly star-forming regions changes the 12C/13C abundance (e.g. Wilson, 1999). However, 18O is primarily produced by massive stars (Sage, Henkel & Mauersberger, 1991; Timmes, Woosley & Weaver, 1995; Meyer et al., 2008; Nomoto, Kobayashi & Tominaga, 2013), and hence selective nucleosynthesis can not explain the positive change in the 12CO/C18O intensity ratio with SFR density (Figure 2), or the lack of a correlation seen in the 13CO/C18O intensity ratio (Figure 3).
3.2 Physical drivers for optical depth changes
As discussed above, we can plausibly eliminate the various physical processes that could result in abundance variations and cause the observed correlation. The most convincing remaining explanation is that the mean optical depth is changing in these galaxies. Assuming that the 13CO line is optically thin, and the 12CO line is optically thick, their ratio is proportional to the optical depth of the 12CO gas, with the proportionality constant being the fractional abundance of 12C with respect to 13C. In Figure 4 we plot the optical depth of 12CO (here denoted ) derived from the 12CO / 13CO intensity ratio (R10), using the formula
| (4) |
Here we assume the standard abundances of [12C/13C], as discussed in Sections 1 and 2.3. The trend line from Figure 1 is also shown in this Figure, after conversion with Equation 4. If a changing optical depth is the correct interpretation, then the mean optical depth of 12CO is up to 2.5 times lower in the most star forming objects (that have high ).

As discussed in Paglione et al. (2001), in local thermodynamic equilibrium the 12CO optical depth () varies as /( ), where is the gas surface density of the cloud, is the gas velocity dispersion and is the gas kinetic temperature (this in the limit where is large compared to the background temperature).
To first order from this equation one would predict increasing optical depth with increasing gas surface density from this equation, the opposite to the effect observed. Thus we suggest that it is the gas velocity dispersion and/or kinetic temperature driving the observed effect. Theoretically, a similar correlation between the mean optical depth of low- CO lines (within resolved GMC’s) and the star-formation rate surface density has been shown by Narayanan & Krumholz (2014, Fig 5). Although the normalisation is somewhat different, that a similar trend exists in chemical models backs up the analysis presented here.
As discussed above, the proposed change in gas velocity dispersion/temperature correlates with both and the gas surface density. Intuitively, one might expect higher density gas to have a lower temperature (as cooling is enhanced at higher densities), and have a lower velocity dispersion (as turbulence is damped more quickly). This is the opposite to the trend observed. However, in regions with higher star-formation surface density a larger number of massive OB stars are packed into the same area. These stars have strong ionising radiation fields, drive powerful stellar winds, and explode as supernovae, all of which could increase the gas velocity dispersion and temperature. Physically, we thus suspect a change in the gas velocity dispersion/temperature could be driven by the action of massive stars (motivating our decision to plot the correlations in this work as a function of ). Determining if it is really the gas velocity dispersion, temperature, or a combination of the two which changes in our objects is, however, beyond the scope of this work.
3.3 Radial gradients
Paglione et al. (2001) and Tan et al. (2011) report changes in the 12CO/13CO intensity ratio as a function of radius within galaxies. Paglione et al. (2001) and Tan et al. (2011) also concluded that radial temperature and/or velocity dispersion changes cause these variations in their sample of spiral galaxies, but did not connect this to the star-formation or gas surface densities. As generally increases towards galaxy centres, the trend reported here could explain these results.
In this work we have plotted integrated star formation properties against millimetre line ratios derived from single dish telescope pointings towards galaxy centres. As these quantities are not derived in matched apertures, we could be systematically biased in nearby objects, especially if strong radial gradients (such as those discussed above) are present. We checked for any strong effect by plotting the residuals of the correlations shown above (e.g. the residuals around Equation 1) against distance. As the majority of these observations were taken with the same telescope (and thus with the same beam size), the distance linearly correlates with the linear size of the region probed. No correlation was found, suggesting that we are not strongly biased by aperture effects. A further, in depth analysis of the resolved effect of on molecular line ratios within galaxies will be conducted in a future work.
4 Conclusions
In this paper we have shown that the 12CO/13CO intensity ratio in galaxies varies systematically as a function of and gas surface density (Figure 1). The same effect is observed in different transitions, and in the 12CO/C18O ratio, while the 13CO/C18O ratio appears to remain constant as a function of .
We discussed the cause of these variations, considering both changes in the physical state of the gas, and chemical changes that lead to abundance variations. We used the observed correlations with C18O to suggest that abundance variations are unlikely to be causing the systematic trend observed with , and thus that the mean gas temperature and/or velocity dispersion may be systematically higher in higher star-formation rate surface density regions. We propose this effect could be caused by the combined action of massive stars heating and/or inducing turbulence in the gas phase.
We present the best fitting relations between and the 12CO/13CO and 12CO/C18O intensity ratios, in the hope they will prove useful to the community. For instance, Casey, Narayanan & Cooray (2014) have shown that XCO also appears to vary with (their Figure 43), leading to the intriguing possibility that these results may be linked. In addition, Narayanan & Krumholz (2014) showed it is possible to estimate the expected CO spectral line energy distributions using . By combining with the relations presented here it is also possible to determine the expected brightness of 13CO and C18O lines for galaxies across the universe.
As telescopes such as ALMA come online we will gain access to CO line ratios in high- sources that are not easily spatially resolved. If this relation were found to hold in such systems, it could be inverted to estimate (and with knowledge of the total star-formation rate, give some idea of the size of the star-forming disk). In addition, we highlight that galaxies with molecular outflows tend to lie above the relations presented here (likely due to enhanced emission from their optically thin outflows). This relation could thus be useful to identify potential outflow candidates for further followup.
Although we showed here that the gas velocity dispersion and/or temperature may change systematically in galaxies with high , determining which of these variables is really responsible will require additional work. For instance, high resolution observations which resolve individual molecular clouds in various CO isotopologues can be used to both estimate the velocity dispersion and temperature of the gas (through non-thermodynamic equilibrium chemical modelling). Comparing to Galactic clouds could also shed light on this effect, and help us predict the expected emission from galaxies across the known universe.
Acknowledgments
TAD acknowledges the support provided by an STFC Ernest Rutherford Fellowship, and thanks Izaskun Jimenez-Serra, Adam Ginsburg, Andreas Schruba and Diederik Kruijssen for useful discussions. The research leading to these results has received funding from the European Community’s Seventh Framework Programme (/FP7/2007-2013/) under grant agreement No 229517.
References
- Aladro et al. (2013) Aladro R. et al., 2013, Astronomy and Astrophysics, 549, 39
- Alatalo et al. (2011) Alatalo K. et al., 2011, The Astrophysical Journal, 735, 88
- Bolatto, Wolfire & Leroy (2013) Bolatto A. D., Wolfire M., Leroy A. K., 2013, Annual Review of Astronomy and Astrophysics, 51, 207
- Calzetti et al. (2007) Calzetti D. et al., 2007, The Astrophysical Journal, 666, 870
- Casey, Narayanan & Cooray (2014) Casey C. M., Narayanan D., Cooray A., 2014, arXiv, 1456
- Casoli, Dupraz & Combes (1992) Casoli F., Dupraz C., Combes F., 1992, Astronomy and Astrophysics (ISSN 0004-6361), 264, 55
- Crocker et al. (2012) Crocker A. et al., 2012, Monthly Notices of the Royal Astronomical Society, 421, 1298
- Dahlem et al. (1993) Dahlem M., Golla G., Whiteoak J. B., Wielebinski R., Huettemeister S., Henkel C., 1993, Astronomy and Astrophysics (ISSN 0004-6361), 270, 29
- Danielson et al. (2013) Danielson A. L. R. et al., 2013, Monthly Notices of the Royal Astronomical Society, 436, 2793
- Davis et al. (2014) Davis T. A. et al., 2014, arXiv, 4850
- For, Koribalski & Jarrett (2012) For B. Q., Koribalski B. S., Jarrett T. H., 2012, Monthly Notices of the Royal Astronomical Society, 425, 1934
- García-Burillo et al. (2000) García-Burillo S., Sempere M. J., Combes F., Hunt L. K., Neri R., 2000, Astronomy and Astrophysics, 363, 869
- Glenn & Hunter (2001) Glenn J., Hunter T. R., 2001, The Astrophysical Journal Supplement Series, 135, 177
- Hameed & Devereux (2005) Hameed S., Devereux N., 2005, The Astronomical Journal, 129, 2597
- Henkel & Mauersberger (1993) Henkel C., Mauersberger R., 1993, Astronomy and Astrophysics, 274, 730
- Keene et al. (1998) Keene J., Schilke P., Kooi J., Lis D. C., Mehringer D. M., Phillips T. G., 1998, Astrophysical Journal Letters v.494, 494, L107
- Kennicutt (1998) Kennicutt R. C., 1998, Astrophysical Journal v.498, 498, 541
- King & Irwin (1997) King D., Irwin J. A., 1997, New Astronomy, 2, 251
- Krips et al. (2010) Krips M., Crocker A. F., Bureau M., Combes F., Young L. M., 2010, Monthly Notices of the Royal Astronomical Society, 407, 2261
- Larsen & Richtler (2000) Larsen S. S., Richtler T., 2000, Astronomy and Astrophysics, 354, 836
- Leroy et al. (2011) Leroy A. K. et al., 2011, The Astrophysical Journal, 737, 12
- Mao et al. (2000) Mao R. Q., Henkel C., Schulz A., Zielinsky M., Mauersberger R., Störzer H., Wilson T. L., Gensheimer P., 2000, Astronomy and Astrophysics, 358, 433
- Martín et al. (2010) Martín S., Aladro R., Martín-Pintado J., Mauersberger R., 2010, Astronomy and Astrophysics, 522, 62
- Meier & Turner (2004) Meier D. S., Turner J. L., 2004, The Astronomical Journal, 127, 2069
- Meier, Turner & Hurt (2008) Meier D. S., Turner J. L., Hurt R. L., 2008, The Astrophysical Journal, 675, 281
- Meyer et al. (2008) Meyer B. S., Nittler L. R., Nguyen A. N., Messenger S., 2008, Reviews in Mineralogy and Geochemistry, 68, 31
- Narayanan & Krumholz (2014) Narayanan D., Krumholz M., 2014, arXiv, 2998
- Nomoto, Kobayashi & Tominaga (2013) Nomoto K., Kobayashi C., Tominaga N., 2013, Annual Review of Astronomy and Astrophysics, 51, 457
- Paglione et al. (2001) Paglione T. A. D. et al., 2001, The Astrophysical Journal Supplement Series, 135, 183
- Papadopoulos & Allen (2000) Papadopoulos P. P., Allen M. L., 2000, The Astrophysical Journal, 537, 631
- Rosa-González, Terlevich & Terlevich (2002) Rosa-González D., Terlevich E., Terlevich R., 2002, Monthly Notices of the Royal Astronomical Society, 332, 283
- Rosenberg et al. (2014) Rosenberg M. J. F., Kazandjian M. V., van der Werf P. P., Israel F. P., Meijerink R., Weiß A., Requena-Torres M. A., Güsten R., 2014, Astronomy & Astrophysics, 564, 126
- Sage, Henkel & Mauersberger (1991) Sage L. J., Henkel C., Mauersberger R., 1991, Astronomy and Astrophysics (ISSN 0004-6361), 249, 31
- Sakamoto et al. (2014) Sakamoto K., Aalto S., Combes F., Evans A., Peck A., 2014, arXiv, 7117
- Sandstrom et al. (2013) Sandstrom K. M. et al., 2013, The Astrophysical Journal, 777, 5
- Spilker et al. (2014) Spilker J. S. et al., 2014, The Astrophysical Journal, 785, 149
- Tan et al. (2011) Tan Q.-H., Gao Y., Zhang Z.-Y., Xia X.-Y., 2011, Research in Astronomy and Astrophysics, 11, 787
- Taniguchi & Ohyama (1998) Taniguchi Y., Ohyama Y., 1998, The Astrophysical Journal, 507, L121
- Taniguchi, Ohyama & Sanders (1999) Taniguchi Y., Ohyama Y., Sanders D. B., 1999, Audio, Transactions of the IRE Professional Group on,
- Telesco, Harper & Loewenstein (1976) Telesco C. M., Harper D. A., Loewenstein R. F., 1976, Astrophysical Journal, 203, L53
- Timmes, Woosley & Weaver (1995) Timmes F. X., Woosley S. E., Weaver T. A., 1995, Astrophysical Journal Supplement Series (ISSN 0067-0049), 98, 617
- Tsai et al. (2012) Tsai M., Hwang C.-Y., Matsushita S., Baker A. J., Espada D., 2012, The Astrophysical Journal, 746, 129
- Turner & Ho (1994) Turner J. L., Ho P. T. P., 1994, Astrophysical Journal, 421, 122
- van Dishoeck & Black (1988) van Dishoeck E. F., Black J. H., 1988, Astrophysical Journal, 334, 771
- Watson, Anicich & Huntress (1976) Watson W. D., Anicich V. G., Huntress W. T. J., 1976, Astrophysical Journal, 205, L165
- Wilson (1999) Wilson T. L., 1999, Reports on Progress in Physics, 62, 143
- Wilson & Rood (1994) Wilson T. L., Rood R., 1994, Annual Review of Astronomy and Astrophysics, 32, 191
- Yim et al. (2011) Yim K., Wong T., Howk J. C., van der Hulst J. M., 2011, The Astronomical Journal, 141, 48
- Zhang, Gu & Wang (2008) Zhang S.-N., Gu Q.-S., Wang Y.-P., 2008, Chinese Journal of Astronomy and Astrophysics, 8, 555