NIR spectroscopy of the HAeBe star HD 100546: III. Further Evidence of an Orbiting Companion?
Abstract
We report high resolution NIR spectroscopy of CO and OH emission from the Herbig Be star HD 100546. We discuss how our results bear striking resemblance to several theoretically predicted signposts of giant planet formation. The properties of the CO and OH emission lines are consistent with our earlier interpretation that these diagnostics provide indirect evidence for a companion that orbits the star close to the disk wall (at 13 AU). The asymmetry of the OH spectral line profiles and their lack of time variability are consistent with emission from gas in an eccentric orbit at the disk wall that is approximately stationary in the inertial frame. The time variable spectroastrometric properties of the CO v=1-0 emission line point to an orbiting source of CO emission with an emitting area similar to that expected for a circumplanetary disk (0.1 AU2) assuming the CO emission is optically thick. We also consider a counterhypothesis to this interpretation, namely that the variable CO emission arises from a bright spot on the disk wall. We conclude with a brief suggestion of further work that can distinguish between these scenarios.
Subject headings:
circumstellar matter — protoplanetary disks — stars: formation — stars: individual (HD 100546) — techniques: spectroscopic1. INTRODUCTION
Planet formation is a complex and poorly understood process (Helled et al., 2013). Yet candidate forming planets have been inferred in several protoplanetary disk systems based on studies of their spectral energy distributions and through direct imaging in the continuum (e.g. Quanz et al. 2013; Kraus & Ireland 2012; Huélamo et al. 2011). A low mass accreting object in a transition disk has also been imaged in H (Close et al., 2014). The Herbig B9e star HD 100546 has attracted recent attention as a system that may have forming low-mass, possibly planetary, companions (e.g. Quanz et al. 2013; Mulders et al. 2013; Brittain et al. 2013; Liskowsky et al. 2012; Panić et al. 2014). Located at a distance of 974 pc van Leeuwen (2007) and with an age of 3-10 Myr (Manoj et al., 2006; van den Ancker et al., 1997), HD 100546 has a spectral energy distribution (SED) with a minimal near infrared (NIR) excess coupled with a substantial mid/far infrared (M/FIR) excess, i.e., it is a transition disk object. Modeling the SED, Bouwman et al. (2003) concluded that HD 100546 has a small disk in the inner few AU and a much more massive disk beyond 10 AU (see also Liu et al. 2003; Grady et al. 2005; Acke & van den Ancker 2006; Benisty et al. 2010; Quanz et al. 2011; Panić et al. 2014). Millimeter observations indicate that the dust mass of the disk is M☉ (Henning et al., 1998). The large optically thin region between the inner disk and the outer disk suggests that the disk structure has evolved, possibly as a result of planet formation.
Stellar accretion is also ongoing in the system. Balmer lines with redshifted absorption components at 220 km s-1, consistent with magnetospheric accretion, have been observed toward HD 100546 (Guimarães et al., 2006). Modeling the Balmer discontinuity of HD 100546, Pogodin et al. (2012) concluded that the accretion rate is . Despite this high accretion rate, the optically thin region of the disk appears to be clear of molecular gas. High resolution infrared spectroscopy of ro-vibrational H2 (Carmona et al., 2011), OH (Liskowsky et al. 2012; Paper I), and thermal-fluorescent CO emission (Brittain et al., 2009; van der Plas et al., 2009) find no molecular gas within 13 AU of the star. Similarly, Habart et al. (2006) find that this inner region is also devoid of PAH emission. Some atomic gas remains in the inner region of the disk, based on [O I] 6300Å spectroscopy (Acke & van den Ancker, 2006), which is not surprising given the continued stellar accretion. Thus SED modeling, interferometry, direct imagery, and spectroscopy of warm molecules are all consistent with HD 100546 being an accreting transitional disk system whose inner 13 AU has been mostly (though not entirely) emptied of material.
Careful analysis of the CO and OH high resolution spectroscopic observations provides possible evidence of an orbiting object near the disk wall at 13 AU. The asymmetric line profiles that we observed in the OH spectrum of HD 100546 are consistent with emission from an annulus with an eccentricity of 0.2 (Paper I). Such a level of eccentricity can be produced by tidal interactions with a high mass planetary companion on a circular orbit (Kley & Dirksen, 2006). Because dynamical models predict that the semi-major axis of the eccentric annulus will precess very slowly (10/1000 orbits; Kley & Dirksen 2006), we noted that if the asymmetric OH emission from HD 100546 arises from an eccentric annulus induced by a planetary companion, the line profile should not vary over timescales of months to years (Paper I).
The presence of an orbiting companion has also been inferred from non-axisymmetric structure in the gaseous CO v=1-0 emission from HD 100546 (Brittain et al. 2013; Paper II). In contrast to the CO hotband emission from HD 100546, which showed no variability from 2003 to 2010, the line profile and spectroastrometric signal in the v=1-0 CO emission from HD 100546 showed significant variability over the same period. We showed that the CO hotband emission could be explained as emission arising from an eccentric inner rim and an (axisymmetric) circumstellar disk beyond 13 AU. The spectroastrometric measurement of these emission lines confirmed the sense of rotation of the disk inferred from the spectroastrometric analysis of the [O I] 6300Å line (Acke & van den Ancker, 2006). The CO v=1-0 emission could be fit as emission from a similar non-time-variable component (an eccentric inner rim and an axisymmetric circumstellar disk beyond 13 AU) plus a compact source of excess emission that varies in position and velocity as it orbits the star. The lower limit on the emitting area (0.1AU2) of the orbiting component is similar to, but smaller than, the size predicted for a circumplanetary disk around a 5 MJup planet at a distance of 13 AU from HD 100546 (Ayliffe & Bate, 2009; Martin & Lubow, 2011a).
Thus, previous work offers evidence for a companion forming near the disk wall of HD 100546 and suggests ready made observational tests of this interpretation. In Paper II we noted that if this interpretation is correct the excess CO v=1-0 emission would become blue-shifted after 2010 while the line profiles of the hot band CO transitions would remain unchanged. Furthermore, the spectroastrometric signal of the blue side of the v=1-0 line would become offset toward the east. In this paper we present results from subsequent high resolution and band spectroscopy of HD 100546 in 2013 which confirm our interpretation of the previous observations of ro-vibrational OH and CO emission from the HD 100546 disk. Observations such as these can potentially help us to understand the impact of forming planets on the circumstellar disk. They may also bear on the existence and nature of circumplanetary disks and the nature of the planetary accretion process.
2. Observations and Data Reduction
Near-infrared spectra of HD 100546 were acquired with CRIRES on the European Southern Observatory Very Large Telescope (VLT) on March 18, 2013. The data were acquired with the 4 pixel (0.4) slit without the use of adaptive optics. This instrumental configuration provides a resolving power of R50,000.
The band observations were taken with the slit at a position angle (PA) of 90 east of north. The band observations were taken with the slit at a PA of 90 and 140 as well as at the corresponding anti-parallel positions. In this paper we restrict our analysis to direct comparison to the previous results during which the slit PA was 90. In a subsequent paper we will present the full analysis and modeling of the full data set.
The full width at half maximum of the point spread function (PSF) of the continuum ranged from 5 - 7 and the airmass of the observations ranged from 1.3-1.6. A summary of observations is presented in Table 1. Observations in the - and -band are dominated by a strong thermal background. Therefore, an ABBA nod pattern between two positions separated by was used to cancel the thermal background to first order. The CO emission can be detected out to 0.7 in each direction (Brittain et al., 2009), thus there is no contamination between the beams.
The data are reduced using a customized set of routines based on algorithms developed for the reduction of data acquired with PHOENIX and NIRSPEC (see Brittain et al. 2007). Each AB pair of observations is combined in the sequence () and then divided by the normalized flat field image. The nod positions were jittered in a 2 box, so the median of the aligned images could be used to identify cosmic rays and bad pixels. The median of the aligned images was then compared to each of the individual frames. Pixels differing by more than from the median were rejected in the average.
The centroid of the PSF was measured by fitting a Gaussian curve to each column. For the band spectra, the centroid measurements of the parallel and anti-parallel beams were averaged to find the spectroastrometric offset of the spectra relative to the continuum. The 1-D spectra are formed by summing the 15 rows (1.3) centered on the PSF. The spectra were then wavelength calibrated by fitting an atmospheric transmittance model generated by the Spectral Synthesis Program (Kunde & Maguire, 1974), which accessed the 2000HITRAN molecular database (Rothman et al., 2003). The 1-D spectrum of HD 100546 was divided by the spectrum of the hot star standard Cru. The telluric standard was observed at a similar airmass and scaled to provide an exact match (Figures 1 and 2). The S/N of the spectra and the fidelity of our centroid measurements are summarized in Table 1.
3. Results
3.1. OH emission
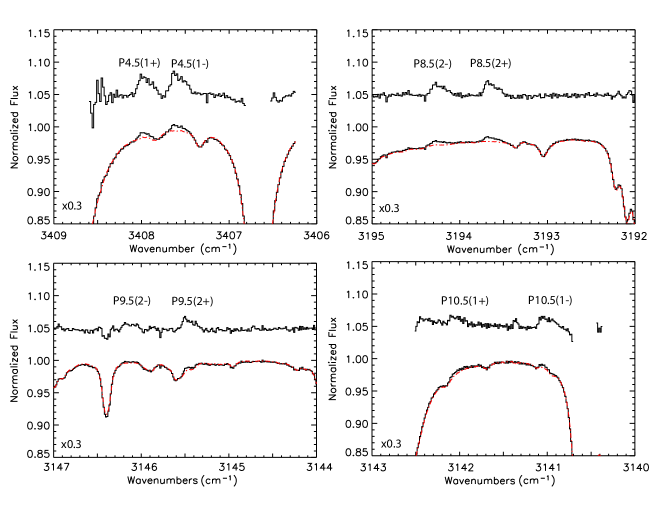
We detect the P4.5 (1), 8.5(2), 9.5(2), and 10.5(1) lines at 1-4% of the continuum (Fig. 1). The equivalent widths of these lines were converted to relative fluxes using a spectrophotometric measurement of HD 100546 taken with the International Space Observatory. While we found that HD 100546 is variable in the NIR (Paper II), we assume for this analysis that the shape of the spectral energy distribution in the band has not varied. The relative flux of each line is presented in Table 2. By performing a linear least square fit to the points in the excitation diagram, we find that the rotational temperature of the OH gas is 106040 K – consistent with the upper limit of 1400K inferred from the previous observation. The equivalent width of the OH emission lines decreased by 50% from December 2010 to March 2013. This can be accounted for by a brightening of about 1magnitude in the band – consistent with the photometric variability of this object in the NIR (Paper II); though we cannot rule out variation in the line fluxes.
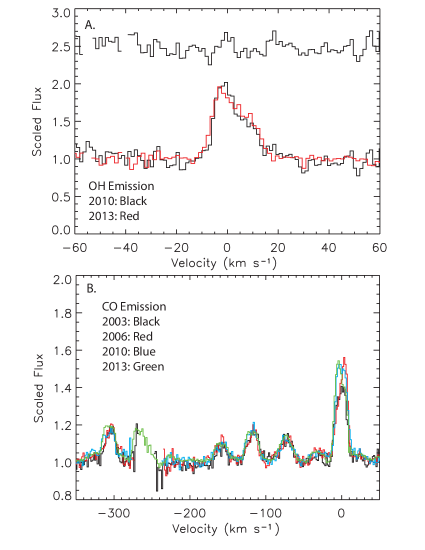
We compare the profiles of the OH observed in 2013 with CRIRES on the VLT and 2010 with PHOENIX on Gemini South (Fig. 3a). In Paper I we showed that the asymmetric line shape could be fit if most of the emission arises from an eccentric annulus near disk wall. Over the span of 28 months, we see no evidence of variation of the line shape111The use of the 0.4” slit is important in this respect. If we had observed the disk with the 0.2” slit with AO, then the observed line shape would depend sensitively on the pointing and the portion of the disk wall sampled(Hein Bertelsen et al., 2013). as predicted in Paper I if the eccentricity inferred from the line profile is induced by a companion.
3.2. CO emission
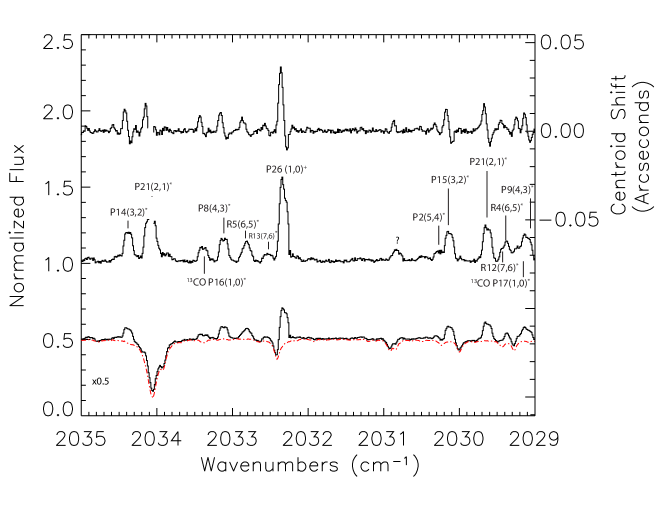
We detect numerous fundamental ro-vibrational CO lines. For this paper we narrow our focus on the transitions overlapping our previous observations near the v=1-0 P26 line (2029 cm-1 to 2035 cm-1; Fig. 2). Comparison of the hot band lines observed in 2013 to the previous epochs shows only subtle variability in the shape of these lines (Fig. 3b). However, like the OH lines, the equivalent widths of the hot band lines have varied. The 2013 equivalent widths are lower than those in 2010 by 30% and are consistent with the values measured in 2003. Despite these variations, the spectroastrometric signal of the hotband lines is similar in all four epochs and is consistent with emission from the circumstellar disk.
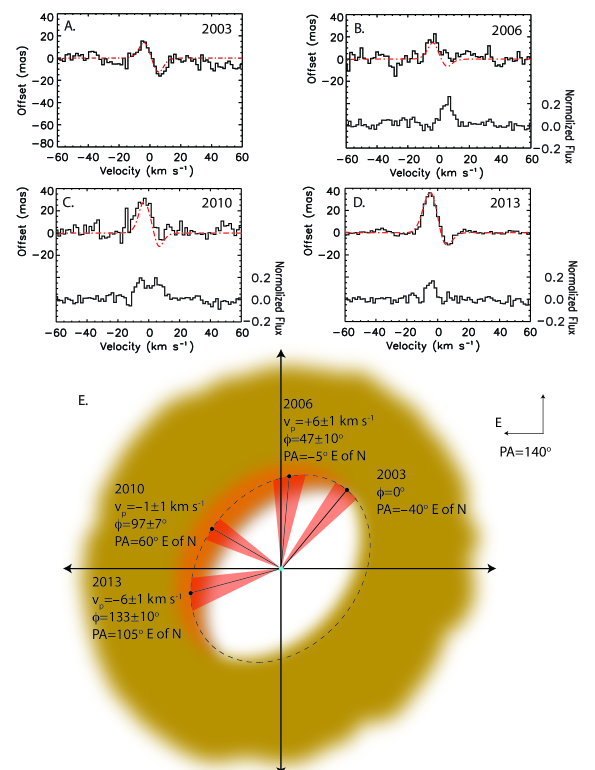
In contrast to the hot band lines, the line profile and spectroastrometric signal of the v=1-0 P26 line have continued to vary relative to previous epochs (Figs. 3b, 4a-4d). We analyze the CO v=1-0 emission using the procedure and rationale outlined in Paper II. We first normalize the spectrum so that the CO hotband lines have the same equivalent width as in the 2003 spectrum. Table 3 shows the scaled EW of the CO v=1-0 emission in the resulting spectrum. We then subtract the 2003 spectrum to obtain the spectrum of the CO v=1-0 excess emission component (Fig. 4). The EW of the excess CO emission component and its velocity centroid and FWHM are shown in Table 3 where they are compared with the values from all earlier epochs.
As described in Paper II and summarized in Table 3, between 2003 and 2006, the red side of the P26 line brightened, the spatial offset of the red side of the line decreased, and the CO excess emission component had a velocity centroid of km s-1 (compare Fig. 4a and Fig. 4b). Similarly, in 2010 the P26 line brightened further, and the excess emission was centered near zero velocity (km s-1). In this part of the line profile, the spatial centroid of the line became offset further to the east (Fig. 4c). In the 2013 epoch reported here, the blue side of the P26 line is again brighter than in 2003 and the excess is now blue shifted (km s-1). The spatial centroid of the red side of the line is comparable to that in 2003 (Table 3), but the blue side of the line is now extended further to the east (Fig. 4d).
4. Discussion
4.1. Orbital Analysis
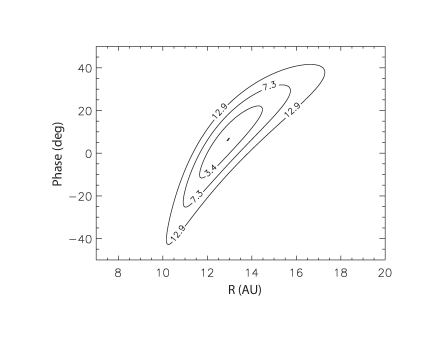
In Paper II, we suggested that the variations in the v=1-0 line emission could be explained by the presence of a spatially concentrated source of CO emission that orbits the star within the disk wall. A schematic of this scenario is shown in Figure 4e. We can obtain a rough constraint on the orbit of the CO excess component given the velocity centroids observed in 2006, 2010, and 2013. Assuming a system inclination of 42 (Ardila et al., 2007; Pineda et al., 2014) and a stellar mass of 2.4 M☉, we fit a circular orbit to the measured velocities with the orbital radius and the orbital phase of the excess in 2003 as free parameters. The result of a fit (Fig. 5) gives AU and an orbital phase of , where corresponds to the NW end of the semimajor axis. If we adopt a higher inclination (e.g. 50; compare for example Quanz et al. 2011 and Panić et al. 2014), our best fit shifts to AU and an orbital phase of
Hence, the velocity centroids at the three measured epochs are consistent with circular motion and locate the excess source in the vicinity of the disk wall. For an orbit with AU, the inferred orbital phase would locate the excess emission behind the disk wall (in projection) in 2003, hiding it from view, consistent with our use of 2003 as the reference epoch in this analysis ( see also Paper II and Mulders et al. 2011). Figure 4e shows the velocities and implied position angles of the excess component.
To demonstrate that our spectroastrometric results are consistent with the above picture, we modeled the spectroastrometric signal that would be produced by the disk plus an extra source of CO emission in a circular orbit, following the method described in Paper II. Briefly, a CO emission component with the observed line profile of the excess emission is placed at the appropriate radius and phase in its orbit and added to our earlier model of CO emission from an eccentric disk wall and an axisymmetric circumstellar disk. Synthetic spectroastrometric signals are then calculated and compared with the observed values (Fig. 4a-4d).
In our model, the 5 continuum arises from a compact source of emission within 1 AU of the star (Panić et al., 2014), thus to a very good approximation the center of the PSF is aligned with the star (within 1 mas). The slit was aligned E-W in all four epochs presented in this paper, so the center of the PSF falls on the N-S line in our schematic (Fig. 4e). For simplicity we adopt R=12.5 AU and phase=0°in 2003 for our calculation. As a result, the spectroastrometric signal of the P26 line at this epoch is consistent with emission arising from an axisymmetric disk (Fig. 4a). As shown in Figure 4b-4d, the observed spectroastrometric signals in the subsequent epochs are well fit by our model of a compact source of emission in a Keplerian orbit near the disk wall, supporting our earlier interpretation (Paper II).
4.2. Comparison with Previous Results
In Papers I & II, we discussed two new lines of evidence for a massive substellar companion within the disk gap of HD 100546. In the first paper, we noted that the ro-vibrational OH emission lines from the disk are asymmetric and that the observed line profile can be explained by a disk with an eccentric inner rim. The OH line profiles can be reproduced if 75% of the OH emission arises from an annulus with an eccentricity of 0.18 while the remainder arises from a circular outer disk. An inner rim with this level of eccentricity can arise from tidal interactions with a high mass companion (M; e.g., Kley & Dirksen 2006). The new observations reported here provide important support for the interpretation presented in Paper I. Dynamical studies that show how a giant planet can induce an eccentric inner rim also predict that the semi-major axis of the eccentric rim will precess very slowly (10/1000 orbits; Kley & Dirksen 2006). Hence, the asymmetric line profile from the rim is expected to be approximately constant in time. The OH line profiles we observe are consistent with this picture (Fig. 3a).
In the second paper, we presented multi-epoch rovibrational CO emission and showed that the spectral shape and spectroastrometric signal of the v=1-0 lines vary while those of the hotband lines do not. We showed that the variability of both the spectral shape and spectroastrometric signal of the v=1-0 lines could be explained if a compact source of v=1-0 emission orbits the star near the inner rim of the outer disk (R13 AU). We further suggested that the source of this orbiting CO emission is a circumplanetary disk. In the new CO observations reported here, both the velocity of the excess CO emission and the spectro-astrometric signal reported here confirm our earlier interpretation of an emission source on a circular Keplerian orbit near the inner wall of the disk.
4.3. Origin of CO emission: Circumplanetary Disk or Companion/Wall Interaction?
As discussed in Paper II, the luminosity of the excess CO emission is consistent with optically thick emission from a region with an emitting area of AU2 for a temperature of 1400 K and a 3 km s-1 intrinsic line width. This emitting area is a fraction of the size of a circumplanetary disk that is expected for a planet located 13 AU from a 2.4 M☉ star. The assumed temperature of 1400 K seems plausible, because it is similar to that found for the inner circumplanetary disk in 3D radiation hydrodynamical simulations (Klahr & Kley, 2006; Gressel et al., 2013). As we also discussed in Paper II, the variability in the line profile and flux of the v=1-0 excess emission component may be due to time variable circumplanetary disk accretion that results from either the predicted azimuthal variation in the accretion rate onto the circumplanetary disk (Kley & Dirksen 2006) and/or non-steady accretion through the circumplanetary disk (Martin & Lubow 2011a).
The interpretation that the excess v=1-0 CO emission arises from a circumplanetary disk raises a couple of questions. One might wonder why the circumplanetary disk does not also produce observable CO hotband and OH emission. The lack of CO hotband emission is readily explained by the small emitting area (0.1 AU2) of the circumplanetary disk. Because the CO hotband emission is produced by UV fluorescence of disk gas, the resulting infrared lines are very optically thin, and the emission must extend over a much larger area to be observable. Our earlier detailed modeling of the hotband emission showed that the flux of the hotband lines could be explained by UV fluorescence of a thin layer of CO at the surface of the disk that extends from the disk wall to AU (Brittain et al., 2009).
The lack of a time variable OH excess component in the circumplanetary disk scenario is a more interesting question. The circumplanetary disk may not produce much OH emission if its atmosphere has a high dust-to-gas ratio. Because an atmosphere with a high dust abundance is well shielded from UV radiation, OH production via water photodissociation is less efficient, leading to a low OH abundance. The outer disk, if it is less well shielded by dust (e.g., as a result of grain growth and settling), could then dominate the OH emission from the system.
If the excess CO emission arises in a circumplanetary disk, observations of the kind presented here may lend insight into the nature of circumplanetary disks, which are thought to have complex dynamics. Hydrodynamical studies find that the accretion flow onto a planet is intrinsically 3-dimensional, with the circumplanetary disk having a large scale height () and sub-Keplerian velocities (e.g., Klahr & Kley 2006; Ayliffe & Bate 2012). Inflow toward the planet is found to occur primarily downward from high latitudes, with material flowing outward in the midplane of the circumplanetary disk through most (e.g.,Tanigawa et al. 2012; Gressel et al. 2013) or only the outer portion (Ayliffe & Bate, 2012) of the disk. These ideas could potentially be explored with observations similar to those presented here. Because of the complex flow pattern, the expected line profile for CO emission from a circumplanetary disk will depend on where warm, dense CO is located, i.e., on the thermal-chemical properties of the region.
The limited constraints on the orbital radius of the CO excess emission component and the position of the disk wall (Section 4.1) allow for the possibility that the excess emission arises not from a discrete source (e.g., a circumplanetary disk), but instead from a localized region of the circumstellar disk, e.g., a CO bright spot on the disk wall. The bright spot could result from a local temperature or density enhancement. If it results from a temperature enhancement, both the CO and OH emission would be increased over that of the surrounding disk unless, e.g., the CO bright spot is also a region of high dust abundance, in which case the OH emission from the region may be suppressed (as discussed above).
Alternatively, because the CO v=1-0 emission from HD 100546 appears to be subthermally excited (Brittain et al. 2009), the CO emission may be particularly sensitive to density enhancements. In contrast, the ro-vibrational OH emission is more likely to be in LTE given its much lower critical density222Atahan & Alexander (2006) find that the collisional deexcitation rate out of OH v=1 at 300 K is , or three orders of magnitude larger than the rate for CO at 300 K (Thi et al., 2013). Given the similarity of the transition probabilities for OH and CO, this implies that the critical density of OH is three orders of magnitude lower than that of CO at this temperature. Modeling of the excitation of OH requires determination of the collisional deexcitation rate at higher temperatures and therefore insensitive to density. Detailed excitation modeling of the CO and OH emission from HD 100546 could be used to explore this and other potential explanations. If either a temperature or density enhancement turns out to be a viable explanation for the bright spot, it would be interesting to understand the physical origin of such a persistent enhancement, as the CO excess emission has now been observed over a 10 year interval. Such enhancements might be induced by an orbiting giant planet (e.g., a local hot spot) or arise in structures associated with the planet (e.g., gap-crossing streams).
Higher angular resolution observations (e.g., with MagAO, GPI, SPHERE) can explore these scenarios by looking for evidence for an orbiting companion, a circumplanetary disk, or an emission bright spot on the disk wall. Observations made before 2017 have the best chance to detect the proposed orbiting structure before it is hidden by the disk wall. If the orbiting companion that we infer from our data is confirmed, along with that observed by Quanz et al. (2013) at larger orbital radii, we may be witnessing an example of multiple (perhaps even related, or sequential) planet formation in a circumstellar disk.
References
- Acke & van den Ancker (2006) Acke, B., & van den Ancker, M. E. 2006, A&A, 449, 267
- Ardila et al. (2007) Ardila, D. R., Golimowski, D. A., Krist, J. E., et al. 2007, ApJ, 665, 512
- Atahan & Alexander (2006) Atahan, S. & Alexander, M. H. 2006, J. Phys. Chem. A, 110, 5436
- Ayliffe & Bate (2009) Ayliffe, B. A., & Bate, M. R. 2009, MNRAS, 397, 657
- Ayliffe & Bate (2012) Ayliffe, B. A., & Bate, M. R. 2012, MNRAS, 427, 2597
- Benisty et al. (2010) Benisty, M., Tatulli, E., Ménard, F., & Swain, M. R. 2010, A&A, 511, A75
- Bouwman et al. (2003) Bouwman, J., de Koter, A., Dominik, C., & Waters, L. B. F. M. 2003, A&A, 401, 577
- Brittain et al. (2007) Brittain, S. D., Simon, T., Najita, J. R., & Rettig, T. W. 2007, ApJ, 659, 685
- Brittain et al. (2009) Brittain, S. D., Najita, J. R., & Carr, J. S. 2009, ApJ, 702, 85
- Brittain et al. (2013) Brittain, S. D., Najita, J. R., Carr, J. S., et al. 2013, ApJ, 767, 159
- Carmona et al. (2011) Carmona, A., van der Plas, G., van den Ancker, M. E., et al. 2011, A&A, 533, A39
- Close et al. (2014) Close, L. M., Follette, K. B., Males, J. R., et al. 2014, ApJ, 781, L30
- Grady et al. (2005) Grady, C. A., Woodgate, B., Heap, S. R., et al. 2005, ApJ, 620, 470
- Gressel et al. (2013) Gressel, O., Nelson, R. P., Turner, N. J., & Ziegler, U. 2013, ApJ, 779, 59
- Guimarães et al. (2006) Guimarães, M. M., Alencar, S. H. P., Corradi, W. J. B., & Vieira, S. L. A. 2006, A&A, 457, 581
- Habart et al. (2006) Habart, E., Natta, A., Testi, L., & Carbillet, M. 2006, A&A, 449, 1067
- Hein Bertelsen et al. (2013) Hein Bertelsen, R. P., Kamp, I., Goto, M., et al. 2013, arXiv:1311.5353
- Helled et al. (2013) Helled, R., Bodenheimer, P., Podolak, M., et al. 2013, arXiv:1311.1142
- Henning et al. (1998) Henning, T., Burkert, A., Launhardt, R., Leinert, C., & Stecklum, B. 1998, A&A, 336, 565
- Huélamo et al. (2011) Huélamo, N., Lacour, S., Tuthill, P., et al. 2011, A&A, 528, L7
- Klahr & Kley (2006) Klahr, H., & Kley, W. 2006, A&A, 445, 747
- Kley & Dirksen (2006) Kley, W., & Dirksen, G. 2006, A&A, 447, 369
- Kraus & Ireland (2012) Kraus, A. L., & Ireland, M. J. 2012, ApJ, 745, 5
- Kunde & Maguire (1974) Kunde, V. R., & Maguire, W. C. 1974, J. Quant. Spec. Radiat. Transf., 14, 803
- Liskowsky et al. (2012) Liskowsky, J. P., Brittain, S. D., Najita, J. R., et al. 2012, ApJ, 760, 153
- Liu et al. (2003) Liu, W. M., Hinz, P. M., Meyer, M. R., et al. 2003, ApJ, 598, L111
- Manoj et al. (2006) Manoj, P., Bhatt, H. C., Maheswar, G., & Muneer, S. 2006, ApJ, 653, 657
- Martin & Lubow (2011a) Martin, R. G., & Lubow, S. H. 2011, ApJ, 740, L6
- Mulders et al. (2011) Mulders, G. D., Waters, L. B. F. M., Dominik, C., et al. 2011, A&A, 531, A93
- Mulders et al. (2013) Mulders, G. D., Paardekooper, S.-J., Panić, O., et al. 2013, A&A, 557, A68
- Panić et al. (2014) Panić, O., Ratzka, T., Mulders, G. D., et al. 2014, A&A, 562, A101
- Pineda et al. (2014) Pineda, J. E., Quanz, S. P., Meru, F., et al. 2014, arXiv:1405.5773
- Pogodin et al. (2012) Pogodin, M. A., Hubrig, S., Yudin, R. V., et al. 2012, Astronomische Nachrichten, 333, 594
- Quanz et al. (2011) Quanz, S. P., Schmid, H. M., Geissler, K., et al. 2011, ApJ, 738, 23
- Quanz et al. (2013) Quanz, S. P., Amara, A., Meyer, M. R., et al. 2013, ApJ, 766, L1
- Rothman et al. (2003) Rothman, L. S., Barbe, A., Benner, D. C., et al. 2003, J. Quant. Spec. Radiat. Transf., 82, 5
- Tanigawa et al. (2012) Tanigawa, T., Ohtsuki, K., & Machida, M. N. 2012, ApJ, 747, 47
- Thi et al. (2013) Thi, W. F., Kamp, I., Woitke, P., et al. 2013, A&A, 551, A49
- van den Ancker et al. (1997) van den Ancker, M. E., The, P. S., Tjin A Djie, H. R. E., et al. 1997, A&A, 324, L33
- van der Plas et al. (2009) van der Plas, G., van den Ancker, M. E., Acke, B., et al. 2009, A&A, 500, 1137
- van Leeuwen (2007) van Leeuwen, F. 2007, A&A, 474, 653
| Setting | Spectral Grasp | Integration | S/N | Seeing | Centroid rms | Airmass |
|---|---|---|---|---|---|---|
| cm-1 | minutes | arcsec | mas | sec(z) | ||
| L1 | 3135-3207 | 24 | 400 | 0.55 | 1.72 | |
| L2 | 3365-3448 | 35 | 230 | 0.73 | 2.08 | |
| M1 | 1998-2053 | 64 | 175 | 0.52 | 0.86 | 1.53 |
| Line | Wavenumber | EqW | Fline |
|---|---|---|---|
| cm-1 | 10-3cm-1 | 10-15 erg/s/cm2 | |
| P4.5(1+) | 3407.99 | 4.56 0.46 | 5.04 0.50 |
| P4.5(1-) | 3407.61 | 5.99 0.60 | 6.62 0.66 |
| P8.5(2-) | 3194.28 | 2.97 0.30 | 3.27 0.33 |
| P8.5(2+) | 3193.69 | 3.10 0.31 | 3.41 0.34 |
| P9.5(2-) | 3146.18 | 1.55 0.15 | 1.70 0.17 |
| P9.5(2+) | 3145.49 | 2.62 0.26 | 2.88 0.29 |
| P10.5(1+) | 3142.06 | 1.81 0.54 | 1.98 0.59 |
| P10.5(1-) | 3141.04 | 2.85 0.57 | 3.13 0.63 |
| Date | Scaled Equivalent Width1 | Excess Equivalent Width | Doppler Shift of Excess | FWHM of Excess | Position Angle of Excess | Orbital Phase of Excess2 | Red Offset | Blue Offset |
|---|---|---|---|---|---|---|---|---|
| 10-2 cm-1 | 10-2 cm-1 | km s-1 | km s-1 | mas | mas | |||
| 2003 January 7 | 4.500.14 | –40° | 12.7 3.3 | 14.0 3.3 | ||||
| 2006 January 14 | 5.690.59 | 1.190.61 | 6 | –5° | 1.6 4.3 | 17.8 4.3 | ||
| 2010 December 23 | 6.390.57 | 1.890.58 | 12 | 60° | 5.7 4.8 | 25.9 4.8 | ||
| 2013 March 18 | 5.890.20 | 1.120.15 | 6 | 105° | 10.9 0.9 | 35.8 0.9 |