Present Address: ]Univ. of Glasgow, Glasgow, G12 8QQ, United KingdomAffiliated with: ]Univ. of Victoria, Victoria, British Columbia.
Present Address: ]JINR, Dubna, Russia.
Present address: ]FNAL, Batavia, Illinois, USA.
Affiliated with: ]Univ. of Victoria, Victoria, British Columbia.
Present address: ]AECL, Mississauga, ON, Canada, L5K 1B2
Affiliated with: ]Univ. of Victoria, Victoria, British Columbia.
Affiliated with: ]Univ. of Saskatchewan, Saskatoon, SK.
TWIST Collaboration
A search for two body muon decay signals
Abstract
Lepton family number violation is tested by searching for decays among the 5.8 positive muon decay events analyzed by the TWIST collaboration. Limits are set on the production of both massless and massive bosons. The large angular acceptance of this experiment allows limits to be placed on anisotropic decays, which can arise from interactions violating both lepton flavor and parity conservation. Branching ratio limits of order are obtained for bosons with masses of 13 - 80 MeV/c2 and with different decay asymmetries. For bosons with masses less than 13 MeV/c2 the asymmetry dependence is much stronger and the 90% limit on the branching ratio varies up to . This is the first study that explicitly evaluates the limits for anisotropic two body muon decays.
I Introduction
The conservation of lepton family number, or flavor, in reactions involving charged leptons is a postulate of the standard model (SM). Positive muon decay () is an excellent low energy system with which to search for charged lepton flavor violating (CLFV) interactions, such as the decay to a positron and an unknown neutral boson , for the same reasons that it is attractive for weak interaction tests: muons can be produced in large quantities and the decay is observed with very low backgrounds.
Early studies of muon decay rejected a two body final state as the normal decay Hincks and Pontecorvo (1948), an unexpected result at the time. When the final state of the CLFV decay products can be detected, very stringent exclusive limits have been placed on the branching ratio of the decay. This is the case for the detection of Adam et al. (2011); Forero et al. (2011); Adam et al. (2013) or Eichler et al. (1986) processes. However, if the neutral boson or its decay products are not detected, only the shape of the positron spectrum is available to set an inclusive limit on the decay process.
Stable, non-interacting bosons have been associated with particles such as axions Wilczek (1982) and Majorons Chikashige et al. (1981); Aulakh and Mohapatra (1982). The boson is massless when there is an associated spontaneously broken global (exact) symmetry Goldstone et al. (1962), and massive when an approximate symmetry is broken Weinberg (1972). Both cases are considered in this paper.
Two body kinematics dictate that the positrons in decay are observable as a narrow peak at a momentum, , determined by the mass of the boson:
| (1) |
where is the mass of the muon, is the mass of the positron, and is the mass of the boson generated by the LFV process.
This signal appears in addition to the three body positive muon decay spectrum which, expressed in our measurement coordinates, is
| (2) |
where is the angle of emission of the positron, is the degree of polarization of the muon ensemble, and is the reduced positron energy Hillairet et al. (2012); Michel (1950); Fetscher et al. (2010). The measurement z-axis points approximately opposite to the polarization direction, so . The muon decay parameters , , , and are bi-linear combinations of the weak coupling constants, which assume values in the SM.
The decay distribution of the positrons from the process has an angular dependence
| (3) |
We study the cases (isotropic) and (maximally anisotropic). With this definition, corresponds to the asymmetry of the normal 3-body decay. Asymmetric two body muon decays are predicted, for example, from Majoron production arising from a spontaneous violation of super-symmetric R-parity Hirsch et al. (2009).
II The TWIST Experiment
The TRIUMF Weak Interaction Symmetry Test (TWIST) has made an order-of-magnitude improvement to the precision of the muon decay parameters , , and Bayes et al. (2011); Hillairet et al. (2012); Bueno et al. (2011, 2012). The data, consisting of 1.1 stopped muon events, is appropriate for a search for the inclusive two body decay. The experiment used highly polarized muons delivered by the TRIUMF M13 beam line into a parallel plane spectrometer immersed in a uniform 2 Tesla magnetic field. The spectrometer consisted of 44 drift chambers (DCs) and 12 proportional chambers (PCs) arranged symmetrically about a high purity metal stopping foil. The stopping targets (75 m Al or 30 m Ag) also served as the central PC cathode. The design and construction of this detector has been described in detail elsewhere Henderson et al. (2005). The spectrometer was oriented so that it had an approximate cylindrical symmetry centered on the muon beam-line axis, which is then defined as the z-axis of the detector coordinate system. It was constructed so that the position of the detector elements, specifically the position of sense wires, is known with a total precision of parts in . The magnetic field was mapped to a similar precision. These factors determine the absolute momentum scale for particle trajectories measured in the detector.
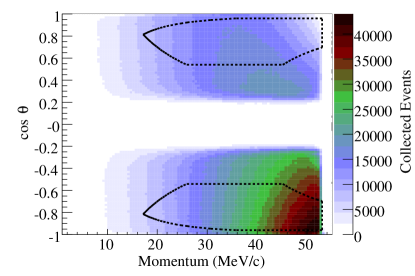
Figure 1 shows our measured distribution of positrons from muon decay binned by their total momentum and . The planar geometry of the spectrometer allows for a large angular acceptance of positrons resulting from decay in the target foil, with a relatively simple momentum calibration. The momentum resolution varies with and ; at 52.8 MeV/c the momentum resolution is (58 keV/c)/ Hillairet et al. (2012).
Almost all of the physics data collected by the TWIST collaboration during the 2006 and 2007 run periods were used for this two body decay search. These data were subject to a sequence of event selection criteria chosen to minimize the bias of comparisons between data and simulation. The event selection differs from the standard TWIST analysis Bayes et al. (2011) only through the extension of the momentum acceptance to include MeV/c. A total of 5.8 muon decay events were identified after the event selection cuts were applied. The kinematic fiducial region has been superimposed on the representative data spectrum shown in Fig. 1.
III Fitting Procedure
The simulation of three body muon decay provides both the background for the measurement and a model for the two body decay signal. The response and acceptance of the detector are modelled using a detailed GEANT 3.21 simulation. A description of the simulation and its use in the TWIST experiment is given in MacDonald et al. (2008); Hillairet et al. (2012). We use the simulation to generate the three body muon decay spectrum , which thus includes geometrical and physical effects, for use in the fit to the data. The periodicities in our plane and wire spacing provide an example of such an effect because tracks at particular momenta and angles may reconstruct with unusually large uncertainties. Simulated muon decay events undergo the same reconstruction as the standard data so these reconstruction inefficiencies are also included in the simulated spectra.
The shape of the two body decay is presumed to be defined by the momentum resolution of the reconstruction. The decay width may only have a contribution if the lifetime of the boson produced in the two body decay is less than s. However, the analysis will veto an event if a second charged particle appears in the detector correlated to the decay at the stopping target. Based on the distance between the stopping target and the nearest DC, the lifetime of an boson allowed by this analysis must be greater than 200 ps assuming that they decay into charged particles. Prompt decays to are more strongly excluded from exclusive searches for such modes.
The fit used to determine the branching ratio of the two body muon decay is conducted through the use of a spectrum expansion originally developed for the muon parameter fits in the standard TWIST analysis Hillairet et al. (2012). An additional term is added to the fit function based on Eq. 2
| (4) |
where is the simulated two body decay positron momentum distribution normalized to have the same integrated area as the three body decay spectrum. Consequently the scale factor is the branching ratio of a two body decay which produces a boson with a mass . Negative values of this scale factor are allowed by the fit as deficits in the spectrum are statistically valid, but they cannot correspond to physical particles. The associated signal occurs at a momentum, , defined in Eq. 1.
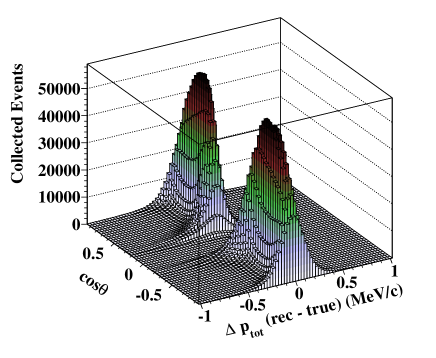
The momentum distribution of positrons from two body decays was derived from the difference of the reconstructed and true momentum, , obtained as a function of angle and momentum from the TWIST high statistics muon decay simulations. Two-body decay distributions, , were generated for each of three cases tested: with the same anisotropy as the three body decay spectrum, the isotropic case, and where the anisotropy is opposite to that of the three body decay spectrum. The momentum response of positrons with momenta between 30 MeV/c and 35 MeV/c, which was used to define the associated isotropic two body decay distribution for this momentum range, is shown in Fig. 2. Two body decay distributions for other momentum ranges are similarly defined from the momentum response defined from those ranges.
To maximize the sensitivity to a narrow peak the data and simulation are binned more finely than is optimum for the determination of the muon decay parameters. The branching ratio and decay parameters are obtained from a fit of the data to Eq. 4. The fit for the signal amplitude and the muon decay parameters , , and is performed for values of at 0.05 MeV/c intervals between 17.03 MeV/c and 52.83 MeV/c. This choice of interval size was made to limit running time of the algorithm. The value of was fixed to Danneberg et al. (2005) in line with the TWIST muon decay parameter analysis Bayes et al. (2011). The decay parameters obtained from these fits are consistent with those obtained when the two body decay signal is omitted from the fit Hillairet et al. (2012) at the level of the measured statistical uncertainty, or a part in , but note that our results do not assume SM weak couplings.
The fitting procedure was assessed in two different ways. The first applied the algorithm to a large number of statistically independent simulations of three body muon decay spectra to study the statistical distribution of peaks due to statistical fluctuations. The branching ratios normalized by their uncertainties have a normal distribution with a mean, and a standard deviation, , with a of 43 for 54 degrees of freedom.
To assess the uncertainty introduced by the grid spacing used, two body signals of a known amplitude were added to the three body decay spectrum midway between the grid points. A maximum deviation of 10% between the result of the fit and the signal amplitude was found. Therefore we have increased by 10% the upper limits of the branching ratio obtained from our statistical analysis.
IV Systematic Uncertainties for Endpoint Fits
The momentum calibration used by the standard TWIST analysis distorts the three body muon decay spectrum at the endpoint in a way that is very similar to a two body decay signal. For this reason systematic effects associated with the momentum calibration dominate the uncertainty of a peak at the endpoint. Two body decays with 13 MeV/c2, or less than 3 resolution widths from the edge of the momentum spectrum at , are not clearly distinguishable from massless decays.
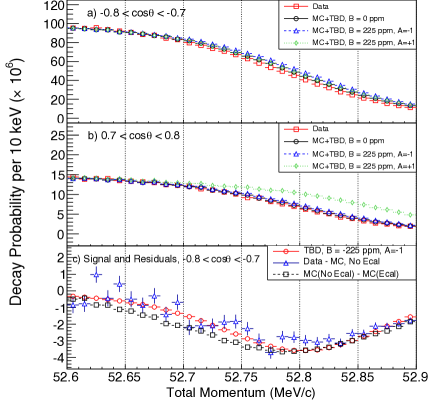
In the standard TWIST analysis, a momentum calibration is performed by matching the endpoint of the data spectrum to that of the simulated spectrum assuming that any differences are linear with respect to . The motivation for this procedure is to remove small differences in the momentum of the reconstructed positron tracks in data versus the simulation, consistent with differences of the energy loss on the order of 10 keV/c. The differences between data and simulation near the maximum possible momentum corresponding to can be characterized by the momentum difference at , where , are the momenta at the spectrum endpoint reconstructed from data and simulation. This sensitivity to the momentum calibration is demonstrated in Fig. 3 where the impact of two body decay signals of various anisotropies on the endpoint muon decay spectrum is shown. Figure 3(c) explicitly compares a two body decay signal to the effect of a change in the measured momentum calibration. In the analysis for light or massless boson production the momentum calibration and its uncertainty are obtained from known differences and uncertainties in the simulation inputs, without using the end point calibration fits.
The corrections and uncertainties affecting the endpoint are summarized in Table 1 for signals corresponding to massless production. The offset and uncertainty in the spectrum endpoint at indicates a magnitude for the associated effect and is reported in the “offset” column of Table 1. The effects in the spectrum endpoint are translated to uncertainties in the branching ratio using the sensitivity of two body decay signals to variations in the momentum calibration as shown in the right three columns. These sensitivities are derived by altering the angle dependent and angle independent components of the energy calibration, which are defined by a set of four energy calibration parameters, and fitting for the branching ratio for all accessible . Correlations between the endpoint calibration parameters are included to reflect upstream/downstream and angle dependent relationships for each contribution to the systematic uncertainties. For example, a fit to an angle independent offset will reveal that a 1 keV change will contribute 20 parts per million (ppm) to the branching ratio at the endpoint and 0.2 ppm to branching ratios for signals appearing at momenta less than 52 MeV/c assuming . The net effect of the uncertainties are generally much less than this after correlations are included, as they are in Table 1.
The uncertainties in the stopping power of the detector materials and the thickness of the muon stopping target produce a leading contribution to biases and uncertainties in , as shown in Table 1. The momentum loss in the stopping target alters the momentum offsets and by the same amount, with a 100% positive correlation between these parameters. The measured difference in the muon stopping target thickness from the value used in the simulation is 1.40.6 m for the silver target and 0.60.5 m for the aluminum target. The measurement was a destructive process conducted well after the simulation was programmed and run. Averaging this effect over all data sets yields a contribution of 0.4 keV/c to the momentum offsets. Further uncertainties in the energy loss are associated with the simulation of the target material which uses values taken from the Berger-Seltzer report Berger and Seltzer (1964). In this case there is a 2% uncertainty in the calculated ionization energy loss and a 3% uncertainty in the radiative energy losses. In the detector stack, events with large energy loss components are suppressed by the track fitting procedure, which disassociates the trajectory into multiple instances rather than changing the effective momentum of the fitted helix. As a result, only the ionization energy loss uncertainties are included for those materials.
The differences between the simulated and the true stopping position of the muon introduces anti-correlated contributions to and . These were estimated to be 1.6 m in Ag and 3.8 m in Al Hillairet et al. (2012). Averaging over all data sets, this produces a change in the offsets of keV/c.
The space time relationship (STR) within the drift cell Grossheim et al. (2010), magnetic field, and detector dimension uncertainties all affect the momentum offset and the angular dependence of the endpoint. These systematic uncertainties are independent upstream and downstream. A difference between data and simulation of 1.4 T in the average magnetic field at the position where it is monitored is predicted from a study of the field mapping systematicsHillairet et al. (2012). This alters the positron momentum scale by keV/c at . A fractional uncertainty of 5 in the detector length scale and thus the position of the wire planes was calculated from the uncertainties of the detector components. The uncertainty due to the STRs was estimated from their difference when the STR for each wire plane is separately determined from the data and when a plane-averaged STR is determined from the simulation. There is negligible evidence of corrections due to the STRs or a mis-calibration of the detector length scale.
| Offset | Uncertainty in (in ppm) | |||
|---|---|---|---|---|
| Detector Property | (in keV/c) | |||
| Target Thickness | -0.60.4 | 7.6 | 2.5 | 0.8 |
| Energy Loss in Target | 0.04.7 | 89.8 | 32.2 | 11.3 |
| Stopping Distribution | -0.91.0 | 17.3 | 0.4 | 1.8 |
| STRs | 0.03.1 | 49.1 | 10.8 | 4.3 |
| Field Map Correction | -2.81.5 | 6.0 | 3.8 | 0.6 |
| Detector Length | 0.04.3 | 12.9 | 9.3 | 0.9 |
| Calibration Model | 0.01.6 | 21.8 | 8.1 | 2.3 |
| Resolution | 0.03.0 | 21.4 | 7.6 | 3.1 |
| Total | -4.36.1 | 107.3 | 36.4 | 12.6 |
The above uncertainties assume a linear dependence of the momentum calibration with respect to . However, the determined from the fits of the upstream momentum calibration exceeds the number of degrees of freedom by a factor of 1.27, suggesting that the model used to determine the energy calibration is not an ideal model of the angular behavior at the endpoint. In absence of a motivated correction to the model, an inflation of the statistical uncertainty was introduced to account for this potential uncertainty. The inflation of the uncertainty produces a systematic bias in the endpoint momentum offset of 1.6 keV/c.
The contributions of each of these systematics to the value of the endpoint offset is shown in Table 1. The values of keV/c and keV/c are consistent at the 1.5 level with the offset obtained from fitting the endpoints of the data to the simulation Hillairet et al. (2012) that were used in the decay parameter analysis.
The momentum resolution difference between data and simulation has an upper limit of 3 keV/c based on the comparisons of fits to the endpoint spectra using an error function convolved with a linear approximation of the muon decay spectrum Hillairet et al. (2012). These differences produce structure in the endpoint region that will alter the two body decay fits. To evaluate the resolution sensitivity, the simulation was smeared on an event-by-event basis by an additional 40 keV, which exaggerates the existing difference between data and simulation by a factor of 3.55. A signal search was conducted on the altered spectrum. The resulting uncertainties in were added to the other uncertainties in quadrature to produce the total uncertainties at each trial momentum. The resolution uncertainties obtained at momenta less than 52 MeV/c are consistent with statistical noise as expected. The contribution for massless decays is given in Table 1.
V Limits for Massive Decays
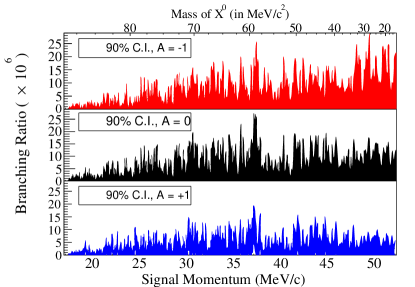
The 90% confidence intervals on for MeV/c2 are shown in Fig. 4 for the three signal asymmetries. These intervals were defined using the Feldman-Cousins (FC) approach Feldman and Cousins (1998) and include both statistical and systematic uncertainties. As expected from the number of grid points on which the search is conducted, some of these lower limits are non-zero. The significance (p-value) of these values is assessed by calculating the probability that a peak with the same or greater will occur at any of the grid points due to a random fluctuation. This was obtained by running the two body decay search on 1000 sets of randomized spectra and collecting the most significant signal from each search. The randomized spectra were generated by applying Poisson noise to the data and simulation. The signal amplitudes measured from the randomized spectra less the observed signal amplitude produces a probability distribution function (PDF) consistent with the null hypothesis. The resulting PDF has an appearance similar to a normal distribution and is used to define the p-value. Using the derived PDF is consistent with a simpler approach to obtaining these p-values assuming normally distributed uncertainties. These p-values, together with the average limits obtained, are reported in Table 2. The isotropic results can be compared directly to those of Balke et al.Balke et al. (1988) and Bryman and Clifford Bryman and Clifford (1986).
VI Limits for Massless Decays
| Decay Signal | 90% C.L. | p-value | |
|---|---|---|---|
| (in ppm) | |||
| Average | |||
| MeV/c | |||
| Endpoint | |||
| Average | |||
| MeV/c | |||
| Endpoint | |||
| Average | |||
| MeV/c | |||
| Endpoint | |||
| Previous Results | |||
| Balke et al. Balke et al. (1988) | |||
| Bryman and Clifford Bryman and Clifford (1986) | |||
| Jodidio et al. Jodidio et al. (1986) | |||
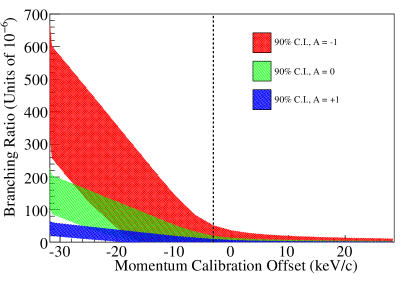
The branching ratio limits quoted at the endpoint and shown in Fig. 5 are based on the single fit of a signal at MeV/c. Values in Table 2 use the momentum calibration calculated from the systematic bias. All of the observed branching ratios are consistent with statistical fluctuations.
The isotropic results can be compared directly to those of Jodidio et al. Jodidio et al. (1986). Those limits on a signal are obtained from an accumulated 1.8 muon triggers using a spectrometer with an angular acceptance such that . The three body muon decays are strongly suppressed in this region. A consequence of the limited angular range is a much larger muon sample density and effective sample size. Since the momentum resolution was also better than that of the TWIST detector by a factor of 2 at similar angles, the upper limit on the branching ratio is an order of magnitude smaller than the comparable limits set by this work. However, the experiment was also insensitive to signal anisotropies. Consequently, a signal with would have not been visible, while a signal with would have been excluded with a 1.3 ppm upper limit at 90% confidence.
VII Conclusions
No significant evidence for decays has been found in this search. The limits on these decays for 13 MeV MeV, where the decay is not observed, have been improved by a factor of 10 over previously published limits. The dependence of these limits on the decay anisotropy has been studied for the first time.
Due to the systematics associated with the detailed understanding of the decay positron spectrum endpoint, our limits on processes with MeV/ are much less restrictive. For this range we have reported the first inclusive limit on decays having the same anisotropy as ordinary muon decay, while for other anisotropies the Jodidio et al. measurement is more sensitive.
VIII Acknowledgments
All early TWIST collaborators and students deserve profound thanks for their efforts in producing these results. Particular thanks go to N. Rodning, C. Ballard, M. Goyette, S. Chan, A. Rose, P. Winslow, and the TRIUMF cyclotron operations, beam lines, and support personnel. This work was supported in part by the Natural Science and Engineering Research Council and the National Research Council of Canada, the Russian Ministry of Science, and the U.S. Department of Energy. Computing resources were supplied by WestGrid and Compute/Calcul Canada.
References
- Hincks and Pontecorvo (1948) E. P. Hincks and B. Pontecorvo, Phys. Rev. 73, 257 (1948).
- Adam et al. (2011) J. Adam et al. (MEG collaboration), Phys.Rev.Lett. 107, 171801 (2011).
- Forero et al. (2011) D. Forero, S. Morisi, M. Tortola, and J. Valle, JHEP 1109, 142 (2011).
- Adam et al. (2013) J. Adam et al. (MEG Collaboration), Phys.Rev.Lett. 110, 201801 (2013).
- Eichler et al. (1986) R. Eichler et al. (SINDRUM Collaboration), Phys.Lett. B175, 101 (1986).
- Wilczek (1982) F. Wilczek, Phys. Rev. Lett. 49, 1549 (1982).
- Chikashige et al. (1981) Y. Chikashige, R. N. Mohapatra, and R. D. Peccei, Phys. Lett. B98, 265 (1981).
- Aulakh and Mohapatra (1982) C. S. Aulakh and R. N. Mohapatra, Phys. Lett. B119, 136 (1982).
- Goldstone et al. (1962) J. Goldstone, A. Salam, and S. Weinberg, Phys. Rev. 127, 965 (1962).
- Weinberg (1972) S. Weinberg, Phys. Rev. Lett. 29, 1698 (1972).
- Hillairet et al. (2012) A. Hillairet et al. (TWIST Collaboration), Phys.Rev. D85, 092013 (2012).
- Michel (1950) L. Michel, Proc. Phys. Soc. London Sect. A 63, 514 (1950).
- Fetscher et al. (2010) W. Fetscher, H. Gerber, and K. Nakamura, J. Phys. G 37, 075021 (2010).
- Hirsch et al. (2009) M. Hirsch, A. Vicente, J. Meyer, and W. Porod, Phys. Rev. D 79, 055023 (2009).
- Bayes et al. (2011) R. Bayes et al. (TWIST Collaboration), Phys.Rev.Lett. 106, 041804 (2011).
- Bueno et al. (2011) J. F. Bueno et al. (TWIST), Phys. Rev. D 84, 032005 (2011).
- Bueno et al. (2012) J. F. Bueno et al., Physical Review D 85, 039908(E) (2012).
- Henderson et al. (2005) R. S. Henderson et al., Nucl. Instrum. Methods A548, 306 (2005).
- MacDonald et al. (2008) R. MacDonald et al., Phys. Rev. D78, 032010 (2008).
- Danneberg et al. (2005) N. Danneberg, W. Fetscher, K. Kohler, J. Lang, T. Schweizer, et al., Phys.Rev.Lett. 94, 021802 (2005).
- Berger and Seltzer (1964) M. J. Berger and S. M. Seltzer, in Studies in Penetration of Charged Particles in Matter, Nuclear Science Series No. 39 (U.S. National Academy of Science, 1964).
- Grossheim et al. (2010) A. Grossheim, J. Hu, and A. Olin, Nucl. Instrum. Methods A623, 954 (2010).
- Feldman and Cousins (1998) G. J. Feldman and R. D. Cousins, Phys.Rev.D 57, 3873 (1998).
- Balke et al. (1988) B. Balke et al., Phys. Rev. D37, 587 (1988).
- Bryman and Clifford (1986) D. A. Bryman and E. T. H. Clifford, Phys. Rev. Lett. 57, 2787 (1986).
- Jodidio et al. (1986) A. Jodidio et al., Phys. Rev. D 34, 1967 (1986).