Fine Structures and Overlying Loops of Confined Solar Flares
Abstract
Using the H observations from the New Vacuum Solar Telescope at Fuxian Solar Observatory, we focus on the fine structures of three confined flares and the issue why all the three flares are confined instead of eruptive. All the three confined flares take place successively at the same location and have similar morphologies, so can be termed homologous confined flares. In the simultaneous images obtained by the Solar Dynamics Observatory, many large-scale coronal loops above the confined flares are clearly observed in multi-wavelengths. At the pre-flare stage, two dipoles emerge near the negative sunspot, and the dipolar patches are connected by small loops appearing as arch-shaped H fibrils. There exists a reconnection between the small loops, and thus the H fibrils change their configuration. The reconnection also occurs between a set of emerging H fibrils and a set of pre-existing large loops, which are rooted in the negative sunspot, a nearby positive patch, and some remote positive faculae, forming a typical three-legged structure. During the flare processes, the overlying loops, some of which are tracked by activated dark materials, do not break out. These direct observations may illustrate the physical mechanism of confined flares, i.e., magnetic reconnection between the emerging loops and the pre-existing loops triggers flares and the overlying loops prevent the flares from being eruptive.
Subject headings:
Sun: atmosphere — Sun: evolution — Sun: flares — Sun: surface magnetism1. INTRODUCTION
Solar flares are one of the most energetic phenomena in the solar atmosphere, indicating the explosive release of a great deal of energy, and one mechanism of the flare energy release is believed to be magnetic reconnection by many solar researchers. Flares and coronal mass ejections (CMEs) are suggested to be two different manifestations of the energy release process, as revealed by the previous observations (Harrison 1995; Zhang et al. 2001a). However, not all the flares are accompanied by CMEs, which can eject large-scale or even global magnetic structures into the interplanetary space (Harrison 1995; Yashiro et al. 2005). The flares associated with CMEs are termed “eruptive flares” and the others “confined flares” (Svestka & Cliver 1992). The eruptive flares usually last for a long period, from tens of minutes to hours, while the confined ones have a short duration. The occurrence rate of eruptive flares is dependent on the flare intensity and duration (Kahler et al. 1989; Andrews 2003). Generally, the larger flares in energy with longer duration tend to be eruptive. Wang & Zhang (2007) found that the occurrence of eruption (or confinement) is sensitive to the distance between the flares and the active regions, 22-37 Mm for eruptive flares and 6-17 Mm for confined flares. On the other hand, not all the CMEs are associated with noticeable flares (St. Cyr & Webb 1991; Green et al. 2002; Wang et al. 2002; Zhou et al. 2003; Ma et al. 2010).
To explain the physical mechanism of eruptive events, many theories and models have been proposed, in most of which there should exist an opening process of the overlying magnetic loops so that plasma and magnetic flux can escape (Lin et al. 2003; Forbes et al. 2006). For the eruptive flares, a standard model which involves a rising flux rope stretching the overlying magnetic lines has been widely accepted (Sturrock 1966; Masuda et al. 1994; Shibata et al. 1995; Tsuneta 1996). According to this model, between the stretched antiparallel lines, a current sheet is formed and magnetic reconnection takes place. Thus the released energy heats the coronal plasma and also accelerates particles. About the onset of eruptions, many different initiation mechanisms, such as flux emergence and cancellation, breakout, tether cutting, torus instability, and kink instability, have been proposed and well studied (Forbes & Isenberg 1991; Antiochos et al. 1999; Chen & Shibata 2000; Moore et al. 2001; Zhang et al. 2001b; Török & Kliem 2005, 2007). The confined flares are mainly affected by the surrounding coronal magnetic fields. Simulations by Török & Kliem (2005) and Fan & Gibson (2007) revealed that the slow decrease of the overlying arcade field with height is a major factor in permitting the instability to result in a confined event. Based on the potential field source-surface model, the calculations showed that stronger overlying magnetic arcades can prevent energy release, thus resulting in confined flares (Wang & Zhang 2007; Guo et al. 2010; Cheng et al. 2011). Direct observations of the overlying arcades above the failed filament eruptions have been provided by many authors (e.g., Ji et al. 2003; Zheng et al. 2012; Chen et al. 2013).
In the previous studies, direct observations for the overlying loops above confined flares and the reconnection process between H fibrils are rare. In this Letter, we mainly study the fine structures and the overlying loops of three homologous confined flares simultaneously observed by both the New Vacuum Solar Telescope (NVST; Liu et al. 2014) and the Solar Dynamics Observatory (SDO; Pesnell et al. 2012). The NVST is a primary facility of the Fuxian Solar Observatory, which is located on the northeast side of Fuxian Lake in China. Since the solar chromosphere is highly dynamic (van Noort & Rouppe van der Voort 2006; Lin et al. 2009; Yang et al. 2014), the high tempo-spatial resolution H observations with NVST can provide plentiful information of dynamic events, e.g., rapid changes of H fibrils during solar flares. The SDO provides full-disk multi-wavelength images of the Sun and high-quality magnetograms of the photosphere. The combination of these observations can help us to study the physical properties of confined flares in detail.
2. OBSERVATIONS AND DATA ANALYSIS
The NVST has three channels being used to image the Sun, i.e., H, TiO, and G band. The channel for observing the solar chromosphere is H 6562.8 Å with a bandwidth of 0.25 Å. It can be tuned in the range of 5 Å with a step of 0.1 Å. The NVST data adopted here were obtained in H 6562.8 Å from 01:01:32 UT to 09:10:42 UT on 2013 October 12 with a cadence of 12 s. In the sequence of H images, there is a gap from 05:40:26 UT to 05:49:54 UT. The H observations cover most of the AR 11861 with a field-of-view (FOV) of 152′′ 152′′ and a pixel size of 0.164. The data are first calibrated, including dark current subtraction and flat field correction, and then reconstructed by speckle masking (Weigelt 1977; Lohmann et al. 1983). In order to understand the flares better, the Geostationary Operational Environmental Satellite (GOES) data are employed to show the variation of soft X-ray flux.
Moreover, we also use the Helioseismic and Magnetic Imager (HMI; Scherrer et al. 2012; Schou et al. 2012) magnetograms and the Atmospheric Imaging Assembly (AIA; Lemen et al. 2012) multi-wavelength images from the SDO. AIA 1600 Å, 304 Å, 171 Å, and 131 Å data from 01:00 UT to 09:20 UT on October 12 with a spatial sampling of 0.6 pixel-1 are chosen. The cadence of the 1600 Å images is 24 s, and that of the other three wavelengths is 12 s. The HMI line-of-sight magnetograms were observed from 12:00 UT on October 11 to 12:00 UT on October 13. They have a pixel size of 0.5 and a cadence of 45 s. The AIA and HMI data are co-aligned by applying the standard routine aia_prep.pro available in the Solar Software (SSW) package, and differentially rotated to a reference time (02:00 UT, 2013 October 12). The SDO and NVST data are aligned using the cross-correlation with specific features.
3. RESULTS
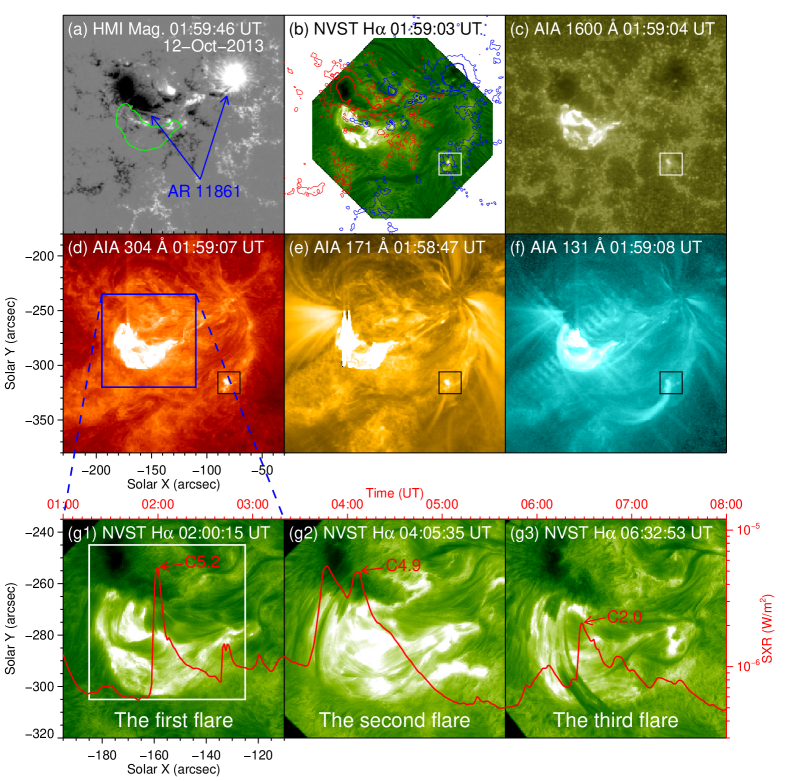
On 2013 October 12, the NVST observed three confined flares in good seeing conditions. The flares occurred successively in NOAA AR 11861, which is a complex sunspot group with a type of (see Figure 1(a)). All the three flares were located at the same location, close to the main sunspot with negative polarity. Each of the flares can be observed in multi-wavelengths. Panels (b)-(f) show the overview of the first flare observed in five wavelengths, 6562.8 Å, 1600 Å, 304 Å, 171 Å, and 131 Å, which are formed in the different layers of the solar atmosphere, from the chromosphere to the corona. We can see that the first flare appears as a compact bright structure. The general appearances of the three well-developed confined flares are shown in panels (g1)-(g3), respectively. These flares can be termed homologous confined flares since they (1) occur at an identical location, (2) have similar morphologies, (3) and take place successively with time intervals of 2.1 hr and 2.37 hr, and (4) their classes (C5.2, C4.9, and C2.0) are comparable (see the overplotted red curve in the bottom panels).
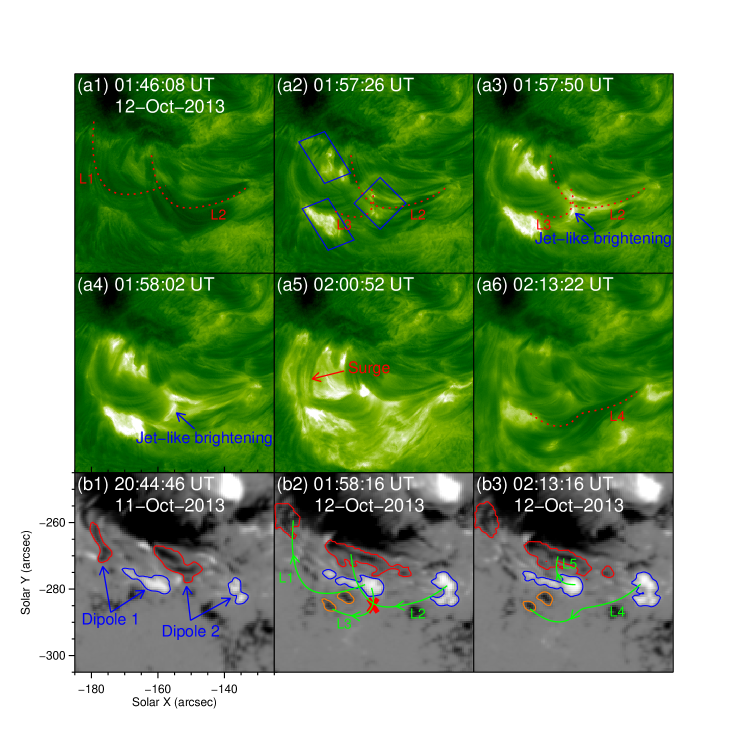
For the first flare, its evolution process is shown in Figure 2 (also see Movie 1). At the pre-flare stage, many small loops outlined by arch-shaped H fibrils can be clearly observed, as delineated with curves “L1” and “L2” (panel (a1)). Then in some areas near the footpoints and the interface of loops, several significant chromospheric brightenings appeared (outlined by quadrilaterals in panel (a2)), indicating the onset of the flare. At that time, some other loops (outlined by curve “L3”) were detected. At the intersection of “L2” and “L3”, a jet-like brightening (denoted by arrows in panels (a3) and (a4)) was observed, which can be considered as a signature of reconnection. The flare went on develop and reached the maximum around 02:00 UT (see panel (a5)). About 13 min later, the flare decayed significantly and a new loop configuration (labeled with “L4”) was formed (panel (a6)). During this process, there exists an ejection of dark material, appearing as a dark surge (denoted by the arrow in panel (a5)) which can be well identified from 01:58 UT to 02:15 UT. The bottom panels in Figure 2 display the evolution of the underlying magnetic fields (also see Movie 2). Before the occurrence of the first flare, two dipoles (indicated by arrows in panel (b1)) emerged and separated near the negative sunspot. There exists a great shear motion between the two dipoles during their emergence. For both of the dipoles, the magnetic patches with negative polarity moved toward the negative sunspot, while the positive ones away from it. In panels (b2)-(b3), the curves “L1”-“L4” overlaid in the magnetograms are the loops identified in the corresponding H images. As shown in panel (b2), loops “L1” and “L2” connect the opposite polarities of dipoles “1” and “2”, respectively. There also exists a loop connection “L3” between the positive polarity of dipole “1” and the nearby negative fields. Then magnetic reconnection took place between loops “L2” and “L3” at the site marked by the red cross symbol. Due to the reconnection, loops “L4” and “L5” were newly formed, as indicated by the green curves in panel (b3). It seems that the newly formed loop “L4” (“L5”) should be from the positive polarity of dipole “2” (dipole “1”) to the negative polarity of the other dipole. Loop “L4” is quite obvious in the H image shown in panel (a6), while the low-lying loop “L5” is speculated to exist although it cannot be identified in the corresponding H image.
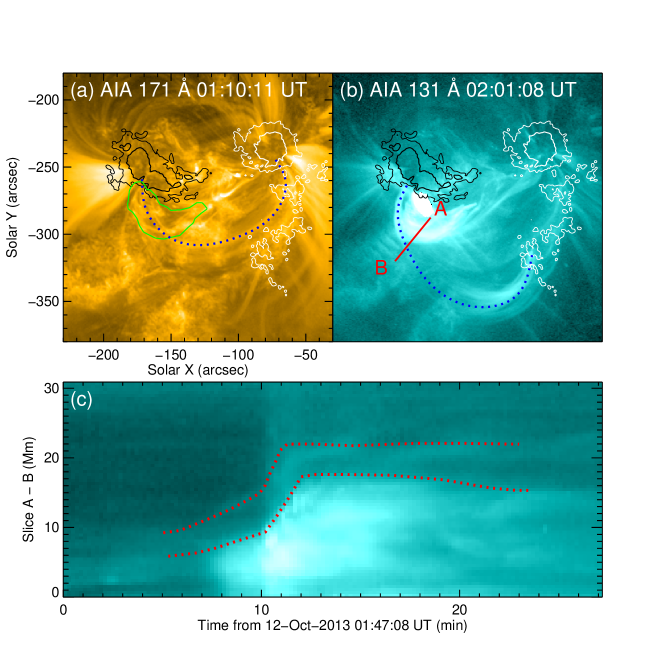
In the 171 Å and 131 Å images observed by AIA, many long and high coronal loops are observed above the flare (see Figures 3(a)-(b) and Movie 3). 171 Å line corresponds to a low temperature (0.6 MK), while 131 Å line corresponds to a high temperature (11 MK). Here, 171 Å and 131 Å images are used to show the appearance of the overlying loops at different temperatures. The dotted curves in panels (a) and (b) delineate the most conspicuous loops in 171 Å and 131 Å images, respectively. They are large-scale loops with an average length of about 130 Mm. Most of them connect the two main sunspots, the leading one with positive polarity and the following one with negative polarity. Besides, there are also many loops connecting the negative sunspot and the faculae with the positive polarity. Along slice “A–B” marked in panel (b), we make a space-time plot of a sequence of 131 Å images to study the evolution of the first flare and overlying loops and present it in panel (c). The higher and lower dotted curves indicate the leading edges of the loop and the first flare, respectively. As revealed by the two curves, the coronal loops lifted at first as the flare expanded, and then stopped at a certain height when the flare began to decay. Both of them have a similar evolution process at first, a slow-rise phase and a consequent fast-rise phase, after which the coronal loop stayed at the final location while the flare began to decrease.
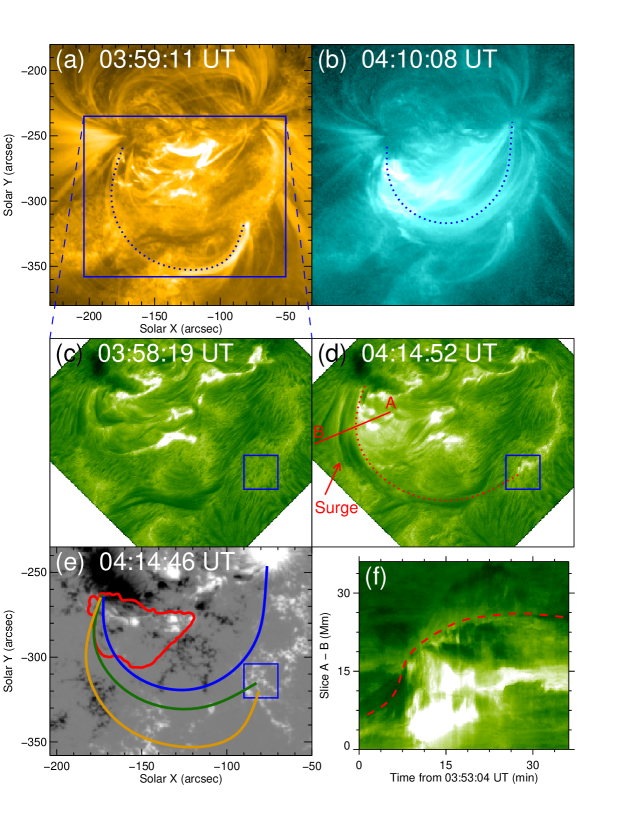
About 2 hr later after the first flare onset, the second confined flare occurred (see Movie 4). Similar to the first one, the second flare took place at the same site and many overlying coronal loops existed at the pre-flare stage (Figures 4(a)-(b)). The coronal loops maintained their initial configuration without significant change. In H images, a lot of dark materials were activated and ejected, appearing as a dark surge, and thus tracked a large arch-shaped structure which is emphasized with the red curve (panels (c)-(d)). One footpoint of the tracked structure is located within the negative sunspot, and the other one is at the quiet region about 60 Mm away (outlined by the small squares). At the pre-flare stage, there was no obvious activity in the square region. While when the activated dark materials reached the footpoint, conspicuous chromospheric brightenings were observed. The overlying arcades above the second flare identified in 171 Å, 131 Å, and H are plotted on the photospheric magnetogram with brown, blue, and green curves, respectively (see panel (e)). We can see that these loops are above the confined flare (indicated by the red solid curve). We also obtain a space-time plot along slice “A–B” marked in panel (d) and present it in panel (f). As shown by the dashed curve, the H arcade rose at first and then stopped gradually, instead of breaking out.
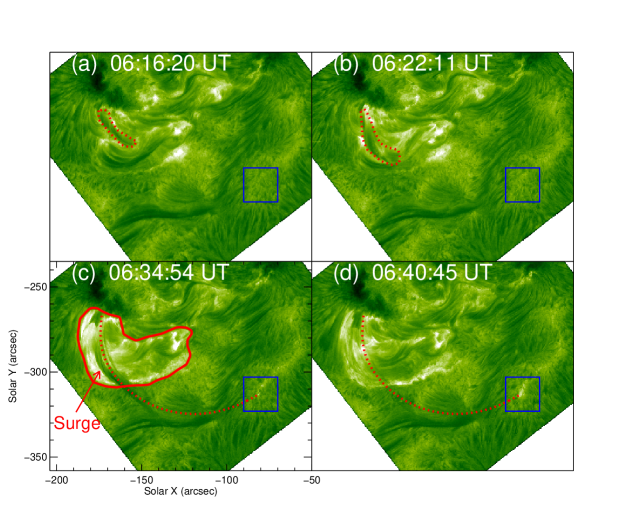
Figures 5(a)-(d) show the evolution of the third confined flare, which took place about another 2 hr later after the second one (also see Movie 5). Before the flare occurrence, a group of dark fibrils began to rise and expand slowly (outlined by the red curves in panels (a)-(b)). Meanwhile, the third flare took place at the same site where the former two flares occurred, and all the three flares generally have a similar shape. Then a dark surge appeared and some of the dark materials moved along a large arcade (indicated by the dotted curves in panels (c)-(d)), and ultimately fell down to the solar surface (outlined by the squares) and the chromosphere brightened up. The square region is almost the same location of the brightenings observed during the first two flares (e.g., see the small square area in Figure 1 and Movie 1).
4. CONCLUSIONS AND DISCUSSION
Based on the high resolution H data obtained by the NVST, we focus on the fine structures and the evolution processes of three confined flares which successively occurred. The flares have similar morphologies and the same location, and thus can be called homologous confined flares. Many large-scale coronal loops above the confined flares can be clearly identified in the AIA EUV images, and some loops were tracked by dark materials observed in the NVST H images. Before the flares, two dipoles emerged near the negative sunspot, and the opposite patches were connected by arch-shaped fibrils. There exists a reconnection between two groups of dark fibrils, resulting in the change of their configuration and the energy release. The reconnection also took place between a set of emerging small loops and a set of pre-existing large loops, rooted in the negative sunspot, a nearby positive patch, and the remote positive faculae. During the confined flares, the overlying loops did not break out.
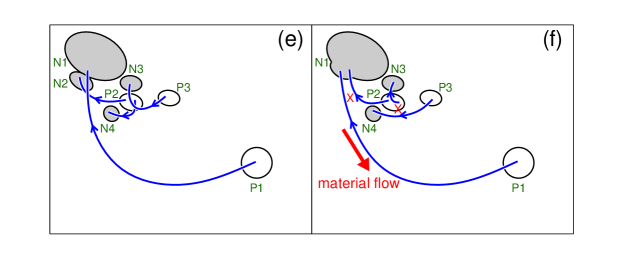
To illustrate the confined flares observed in this study, two schematic drawings are given in Figures 5 (e)-(f). Patch “N1” is the main sunspot with negative polarity and patch “P1” the remote faculae with positive polarity (see Figures 1 and 4). They are connected by large loops, which can be identified in the AIA EUV images (see Figures 3 and 4). Patches “N2” (“N3”) and “P2” (“P3”) are the opposite polarities of dipole “1” (“2”) that emerged near the negative sunspot, and are connected by the initial loops emerging from the sub-photosphere (see Figure 2). There also exists a connection between patch “P2” and the nearby “N4” (also see loop “L3” in Figure 2). After the emergence of dipole “1”, the negative patch “N2” moved toward the negative sunspot “N1” (panel (e)), and then merged with it (panel (f)). During this process, patch “N2” performed a clockwise rotation around “N1” (see Movie 2), which in our opinion led to the reconnection between a set of small loops connecting “N2” and “P2” and a set of large ones connecting “N1” and “P1”. When the ejected material reached the remote positive faculae “P1”, chromospheric brightenings can be observed. In fact, these two sets of loops were distributed in patches “N1” (actually containing a small patch “N2”), “P1”, and “P2”, forming a “three-legged” structure. According to previous studies, magnetic reconnection in this kind of configuration is much efficient in leading to a confined flare (e.g., Hanaoka 1996, 1997). Magnetic reconnection also occurred between two groups of small loops, one group connecting patches “N3” and “P3” and the other group connecting patches “N4” and “P2”. Due to the reconnection, new connections (“N3”–“P2”, “N4”–“P3”) were formed (also see Figure 2).
As revealed in previous observations, the overlying loops play an important role in resulting in failed filament eruptions (e.g., Ji et al. 2003; Chen et al. 2013). In this study, many pre-existing large loops above the confined flares are clearly observed in AIA EUV lines, e.g., 171 Å, and 131 Å (see Figures 3 and 4). Although the large loops could not be identified in the H at the pre-flare stage, they were tracked by dark materials during the flares. The dark materials were ejected toward the remote positive faculae, appearing as dark arcades (see Figures 4 and 5). In our opinion, the overlying large-scale loops contribute to the confinement of flares, due to the existence of magnetic tension of the overlying loops. In addition, since the three flares in this study are C-class ones, the flare energy is not high enough to destroy the overlying loops greatly. The three homologous confined flares occurred successively, implying that, during each flare process, only a part of loops were involved in the reconnection and the main structure was not destroyed. As new magnetic flux continuously emerged, another instability was produced, thus resulting in a new reconnection with energy release (Zhang & Wang 2002).
References
- Andrews (2003) Andrews, M. D. 2003, Sol. Phys., 218, 261
- Antiochos et al. (1999) Antiochos, S. K., DeVore, C. R., & Klimchuk, J. A. 1999, ApJ, 510, 485
- Chen et al. (2013) Chen, H., Ma, S., & Zhang, J. 2013, ApJ, 778, 70
- Chen & Shibata (2000) Chen, P. F., & Shibata, K. 2000, ApJ, 545, 524
- Cheng et al. (2011) Cheng, X., Zhang, J., Ding, M. D., Guo, Y., & Su, J. T. 2011, ApJ, 732, 87
- Fan & Gibson (2007) Fan, Y., & Gibson, S. E. 2007, ApJ, 668, 1232
- Forbes & Isenberg (1991) Forbes, T. G., & Isenberg, P. A. 1991, ApJ, 373, 294
- Forbes et al. (2006) Forbes, T. G., Linker, J. A., Chen, J., et al. 2006, Space Sci. Rev., 123, 251
- Green et al. (2002) Green, L. M., Matthews, S. A., van Driel-Gesztelyi, L., Harra, L. K., & Culhane, J. L. 2002, Sol. Phys., 205, 325
- Guo et al. (2010) Guo, Y., Ding, M. D., Schmieder, B., et al. 2010, ApJ, 725, L38
- Hanaoka (1996) Hanaoka, Y. 1996, Sol. Phys., 165, 275
- Hanaoka (1997) Hanaoka, Y. 1997, Sol. Phys., 173, 319
- Harrison (1995) Harrison, R. A. 1995, A&A, 304, 585
- Ji et al. (2003) Ji, H., Wang, H., Schmahl, E. J., Moon, Y.-J., & Jiang, Y. 2003, ApJ, 595, L135
- Kahler et al. (1989) Kahler, S. W., Sheeley, N. R., Jr., & Liggett, M. 1989, ApJ, 344, 1026
- Lemen et al. (2012) Lemen, J. R., Title, A. M., Akin, D. J., et al. 2012, Sol. Phys., 275, 17
- Lin et al. (2003) Lin, J., Soon, W., & Baliunas, S. L. 2003, NewAR, 47, 53
- Lin et al. (2009) Lin, Y., Soler, R., Engvold, O., et al. 2009, ApJ, 704, 870
- Liu et al. (2014) Liu, Z., Xu, J., Gu, B.-Z., et al. 2014, Research in Astronomy and Astrophysics, 14, 705
- Lohmann et al. (1983) Lohmann, A. W., Weigelt, G., & Wirnitzer, B. 1983, Appl. Opt., 22, 4028
- Ma et al. (2010) Ma, S., Attrill, G. D. R., Golub, L., & Lin, J. 2010, ApJ, 722, 289
- Masuda et al. (1994) Masuda, S., Kosugi, T., Hara, H., Tsuneta, S., & Ogawara, Y. 1994, Nature, 371, 495
- Moore et al. (2001) Moore, R. L., Sterling, A. C., Hudson, H. S., & Lemen, J. R. 2001, ApJ, 552, 833
- Pesnell et al. (2012) Pesnell, W. D., Thompson, B. J., & Chamberlin, P. C. 2012, Sol. Phys., 275, 3
- Scherrer et al. (2012) Scherrer, P. H., Schou, J., Bush, R. I., et al. 2012, Sol. Phys., 275, 207
- Schou et al. (2012) Schou, J., Scherrer, P. H., Bush, R. I., et al. 2012, Sol. Phys., 275, 229
- Shibata et al. (1995) Shibata, K., Masuda, S., Shimojo, M., et al. 1995, ApJ, 451, L83
- St. Cyr & Webb (1991) St. Cyr, O. C., & Webb, D. F. 1991, Sol. Phys., 136, 379
- Sturrock (1966) Sturrock, P. A. 1966, Nature, 211, 695
- Svestka & Cliver (1992) Svestka, Z., & Cliver, E. W. 1992, IAU Colloq. 133: Eruptive Solar Flares, 399, 1
- Tsuneta (1996) Tsuneta, S. 1996, ApJ, 456, 840
- Török & Kliem (2005) Török, T., & Kliem, B. 2005, ApJ, 630, L97
- Török & Kliem (2007) Török, T., & Kliem, B. 2007, Astronomische Nachrichten, 328, 743
- van Noort & Rouppe van der Voort (2006) van Noort, M. J., & Rouppe van der Voort, L. H. M. 2006, ApJ, 648, L67
- Wang & Zhang (2007) Wang, Y., & Zhang, J. 2007, ApJ, 665, 1428
- Wang et al. (2002) Wang, Y. M., Ye, P. Z., Wang, S., Zhou, G. P., & Wang, J. X. 2002, Journal of Geophysical Research (Space Physics), 107, 1340
- Weigelt (1977) Weigelt, G. P. 1977, Optics Communications, 21, 55
- Yang et al. (2014) Yang, S. H., Zhang, J., Liu, Z., & Xiang, Y. Y. 2014, ApJ, 784, L36
- Yashiro et al. (2005) Yashiro, S., Gopalswamy, N., Akiyama, S., Michalek, G., & Howard, R. A. 2005, Journal of Geophysical Research (Space Physics), 110, 12
- Zhang et al. (2001a) Zhang, J., Dere, K. P., Howard, R. A., Kundu, M. R., & White, S. M. 2001a, ApJ, 559, 452
- Zhang et al. (2001b) Zhang, J., Wang, J., Deng, Y., & Wu, D. 2001b, ApJ, 548, L99
- Zhang & Wang (2002) Zhang, J., & Wang, J. 2002, ApJ, 566, L117
- Zheng et al. (2012) Zheng, R., Jiang, Y., Yang, J., et al. 2012, A&A, 541, A49
- Zhou et al. (2003) Zhou, G., Wang, J., & Cao, Z. 2003, A&A, 397, 1057