The XMM-Newton Bright Survey sample of absorbed quasars: X-ray and accretion properties
Abstract
Although absorbed quasars are extremely important for our understanding of the energetics of the Universe, the main physical parameters of their central engines are still poorly known. In this work we present and study a complete sample of quasars (QSOs) that are absorbed in the X-rays (column density and X-ray luminosity ; XQSO2) belonging to the XMM-Newton Bright Serendipitous Survey (XBS). From the analysis of their ultraviolet-to-mid-infrared spectral energy distribution we can separate the nuclear emission from the host galaxy contribution, obtaining a measurement of the fundamental nuclear parameters, like the mass of the central supermassive black hole and the value of Eddington ratio, .
Comparing the properties of XQSO2s with those previously obtained for the X-ray unabsorbed QSOs in the XBS, we do not find any evidence that the two samples are drawn from different populations. In particular, the two samples span the same range in Eddington ratios, up to ; this implies that our XQSO2s populate the “forbidden region” in the so-called “effective Eddington limit paradigm”. A combination of low grain abundance, presence of stars inwards of the absorber, and/or anisotropy of the disk emission, can explain this result.
keywords:
galaxies: active – quasars: general – infrared: galaxies – X-rays: galaxies1 Introduction
Active Galactic Nuclei (AGN) are believed to be powered by accretion of matter onto a Supermassive Black Hole (SMBH, ; Salpeter, 1964; Lynden-Bell, 1969). The discovery of quiescent “non-active” SMBHs in the nuclei of nearby bulge galaxies, along with the presence of scaling relations between the central black hole (BH) mass and galaxy properties (e.g., bulge luminosity/mass and velocity dispersion; among others, Kormendy & Richstone, 1995; Ferrarese & Merritt, 2000; Marconi & Hunt, 2003; Ferrarese et al., 2006; Cattaneo et al., 2009) clearly indicate that AGN are fundamental actors in the formation and evolution of galaxies and, in general, of cosmic structures in the Universe (see Kormendy & Ho, 2013; Heckman & Best, 2014, for two recent reviews on different aspects of the SMBH-host galaxy coevolution). Essential points to study the galaxy evolution are the identification of AGN in all states of accretion and obscuration and an accurate assessment of their physical properties, in order to infer their influence (“feedback”) on the evolution of the host galaxy.
The “first order” model proposed to explain their characteristics, known as the Unified Model (Antonucci, 1993), assumes that all the AGN have a similar internal structure. The basic idea is that most of the observed differences are caused by the angle between our line of sight and the plane of the system. In particular, the toroidal obscuring material supposed to partially cover the nuclear engine along particular lines of sight regulates the possibility of observing in the optical spectrum both broad and narrow (optically unobscured, or type 1, AGN) or only narrow (optically obscured, or type 2, AGN) emission lines. Confirmations of this schematic picture come from spectropolarimetric studies of optically obscured AGN, and from X-ray observations (for a recent review, see Bianchi, Maiolino, & Risaliti, 2012).
However, several authors suggested a possible evolution of the obscuration with cosmic time, connected with the SMBH growth (Hopkins et al. 2006; Lapi et al. 2014, recently updating the original model presented by Granato et al. 2004) in addition to the effects of different viewing angles. The main phase of efficient accretion would be characterized by AGN heavily obscured by gas and dust; this obscuring matter would be then swept away by the nuclear radiation, and the accreting SMBH would shine as an optically luminous quasar (QSO) for a brief period, until it runs out of gas. The final product of the sequence is a “dead QSO” inside a passively evolving galaxy. In this scenario, unobscured AGN are a subsequent phase of obscured QSO.
In the framework of the Unified Model, we expect that absorbed and unabsorbed accreting nuclei share the same intrinsic properties (e.g., luminosity, BH mass, and accretion rate). Conversely, an evolutionary pattern for the two classes of AGN would imply a difference in their physical properties. Recently, a possible link between accretion and obscuration has been presented by Fabian, Vasudevan, & Gandhi (2008) and Fabian et al. (2009). By discussing the effects of accretion driven feedback on gas clouds in the innermost region of an AGN, the authors proposed that dusty absorbing structures around an AGN can be stable only for column densities [], where is the AGN Eddington ratio, defined as the ratio between the bolometric luminosity and the Eddington luminosity111The Eddington luminosity, defined as [], represents the exact balance between inward gravitational force and outward radiation force acting on the gas, assumed to be of ionized hydrogen in a spherical configuration..


The assessment of the nuclear properties of absorbed AGN is an issue that becomes more and more difficult as the amount of circumnuclear obscuring medium along the line of sight increases and does not permit a clear and direct view to the central energy source. In addition, at low nuclear luminosities a host contribution at optical-infrared (IR) wavelengths is expected to be increasingly noticeable, making even harder to isolate the nuclear component.
X-ray surveys are one of the best approaches to search for obscured AGN, since in this band the emission is less affected by absorption, if compared with the ultraviolet (UV)-optical domain. In this paper we discuss the broad-band physical properties of all the X-ray absorbed QSOs (, intrinsic ; hereafter, XQSO2) in the XMM-Newton Bright Serendipitous Survey222The XMM-Newton Bright Serendipitous Survey is a programme conducted by the XMM-Newton Survey Science Center (SSC, see http://xmmssc-www.star.le.ac.uk), a consortium of institutes in the ESA community; a full description of the role of the SSC is given in Watson et al. (2001). (XBS), a complete sample of bright X-ray sources. The XQSO2 sample considered here is unique at the moment: it consists of X-ray and optically bright sources at intermediate redshift (, plus one object at ), belonging to a complete and well-defined survey, for which multi-wavelength data have been already collected. Proprietary or archival photometry from Spitzer, the Wide-field Infrared Survey Explorer (WISE; Wright et al., 2010), the Sloan Digital Sky Surveys (SDSS; Abazajian et al., 2009) and the Digitized Sky Survey (DSS), and good quality optical spectra, in addition to X-ray spectroscopic observations from XMM-Newton, allow us to properly characterize the sources in our sample. The major goal of this paper is to estimate the nuclear properties of the XQSO2s, in particular black hole masses and Eddington ratios, and to compare them with those of the sample of X-ray unabsorbed QSOs in the XBS.
The paper is organized as follows: in Sect. 2 we briefly describe the XBS and the XQSO2 sub-sample. Sect. 3 reports on the multiwavelength data used to construct the UV-to-IR Spectral Energy Distribution (SED) for the XQSO2s studied here. We present the method adopted to deconvolve the host and AGN contributions in Sect. 4, while the details on the recovering of the nuclear properties are described in Sect. 5. We discuss the results obtained and their consequences, and compare the properties recovered for absorbed and unabsorbed sources, in Sect. 6. Finally, the main results are summarized in Sect. 7. The analysis of new XMM-Newton observations is presented in Appendix A, while details on the UV-to-mid-IR properties of the individual sources are reported in Appendix B. Throughout this paper, for consistency with the previous works on the XBS sample, a concordance cosmology with km s-1 Mpc-1, , and is adopted; when necessary, data and relations taken from the literature have been converted to our cosmology. The energy spectral index, , is defined such that . The X-ray photon index, defined as , is . Finally, X-ray surveys demonstrated the existence of a small number of AGN showing a mismatch between the optical and X-ray based methods of classification in terms of obscuration. In this paper, we define a source “absorbed” or “unabsorbed” on the basis of its X-ray properties (irrespective of the optical properties), adopting as threshold333For a Galactic dust-to-gas ratio (Bohlin, Savage, & Drake, 1978), the adopted threshold corresponds to a dust extinction of mag, which corresponds to the adopted dividing line between optically absorbed and unabsorbed sources (Caccianiga et al., 2008). an intrinsic absorbing column density .
2 The XBS sample of X-ray absorbed QSOs
The XBS consists of two flux-limited samples of X-ray selected serendipitous sources at high Galactic latitude (; total sky area sq. deg): the XMM Bright Serendipitous Survey sample (BSS; sources selected in the keV energy band, identification level of %) and the XMM Hard Bright Serendipitous Survey sample (HBSS; sources selected in the keV energy band, identification level of %; sources are in common with the BSS sample). The flux limit is in both the selection energy bands.
| Name | R.A. | Dec. | Opt. Class | Counts | Sample | ||||||||||||
|---|---|---|---|---|---|---|---|---|---|---|---|---|---|---|---|---|---|
| () | () | () | () | ||||||||||||||
| (1) | (2) | (3) | (4) | (5) | (6) | (7) | (8) | (9) | (10) | (11) | (12) | ||||||
| XBSJ000100.2-250501 | : | : | : | : | AGN1 | BSS | . | . | |||||||||
| XBSJ013240.1-133307 | : | : | : | : | AGN2 | HBSS,BSS | . | . | |||||||||
| . | . | ||||||||||||||||
| XBSJ021642.3-043553 | : | : | : | : | AGN2 | BSS | . | . | |||||||||
| XBSJ022707.7-050819 | : | : | : | : | AGN2 | BSS | . | . | |||||||||
| XBSJ050536.6-290050 | : | : | : | : | AGN2 | HBSS,BSS | . | . | |||||||||
| XBSJ051413.5+794343 | : | : | : | : | AGN2 | BSS | . | . | |||||||||
| XBSJ052128.9-253032 | : | : | : | : | Elusive | HBSS | . | . | |||||||||
| XBSJ080411.3+650906 | : | : | : | : | Elusive | HBSS,BSS | . | . | |||||||||
| XBSJ113148.7+311358 | : | : | : | : | AGN2 | HBSS,BSS | . | . | |||||||||
| . | . | ||||||||||||||||
| XBSJ122656.5+013126 | : | : | : | : | AGN2 | HBSS,BSS | . | . | |||||||||
| XBSJ134656.7+580315 | : | : | : | : | Elusive | HBSS | . | . | |||||||||
| XBSJ144021.0+642144 | : | : | : | : | AGN1 | BSS | . | . | |||||||||
| XBSJ160645.9+081525 | : | : | : | : | AGN2 | HBSS,BSS | . | . | |||||||||
| . | . | ||||||||||||||||
| XBSJ204043.4-004548 | : | : | : | : | AGN2 | HBSS,BSS | . | . | |||||||||
Note: The X-ray spectral results are from Corral et al. (2011), except for the new optical identifications, marked with (this work;
OBSID of the XMM-Newton observations: 0094400101 and 0094400301 for XBSJ051413.5+794343 and XBSJ080411.3+650906, respectively; a paper
reporting an update of the spectroscopic identifications is in preparation).
Fluxes and luminosities refer to the MOS calibration.
For all but one sources, the best-fitting model is an absorbed power law.
For this source, a best fit is not found
(i.e., null hypothesis probability % with all the model tested; see Corral et al., 2011); we adopt the absorbed power law
as best fit, as none of the additional components significantly improves the fit.
mark the XQSO2s for which we obtained new XMM-Newton observations: for these sources, more complex models (applied to the new data) are tested in
Appendix A and the results are reported in Table 7.
Here, we quote the values derived for the most significant properties (column density, photon index, observed flux, and intrinsic luminosity; second row).
For this source, only MOS cameras have been considered,
because in the pn the source falls in a CCD gap.
Column (1): source name in the XBS sample.
Columns (2) and (3): J2000 coordinates of the X-ray object.
Column (4): source redshift.
Column (5): optical classification, from Caccianiga et al. (2008) except for XBSJ144021.0+642144 (see Corral et al., 2011) and for the new optical identifications;
a paper reporting an update of the spectroscopic identifications is in preparation.
Column (6): total EPIC counts (keV).
Column (7): sample to which the source belongs.
Column (8): Galactic column density, from Dickey & Lockman (1990).
Column (9): source photon index, and % confidence errors; parameter fixed during the fit.
Column (10): intrinsic column density.
Column (11): observed flux (deabsorbed by our Galaxy) in the keV energy band.
Column (12): intrinsic luminosity in the keV energy band.
The details on the XMM-Newton fields selection strategy and the source selection criteria of the XMM BSS and HBSS samples are discussed in Della Ceca et al. (2004). A description of the optical data and analysis, of the optical classification scheme, and of the optical properties of the extragalactic sources identified so far is presented in Caccianiga et al. (2007, 2008); a paper presenting an update of the spectroscopic identifications (mostly based on data taken at the TNG, GTC and VLT telescopes) of the XBS survey is in preparation. The identification statistics below take into account these new identifications, along with the new X-ray spectral analysis in Corral et al. (2011).
Regarding the AGN population, the entire XBS sample comprises AGN divided into type 1, type 2, BL Lacs, and unclassified AGN (following the criteria described in Caccianiga et al., 2008). For the subsample of “optically elusive AGN” (i.e. sources for which the X-ray data are the only way to identify the AGN nature; Caccianiga et al., 2007), the type 1/type 2 classification is assigned on the basis of the intrinsic absorption in their X-ray spectra ( absorbed AGN, unabsorbed AGN, and AGN for which the upper limit on is not stringent enough to allow a classification). All but one of the type 1 AGN belong to the BSS sample, while a selection at higher energies confirms its effectiveness in finding obscured sources, with % of type 2 AGN detected in the HBSS, as opposed to only % of type 1 AGN. The cosmological and statistical properties of the HBSS AGN sample are extensively discussed in Della Ceca et al. (2008).
For most of the type 1 sources in the XBS AGN sample, the optical/UV SED has been build, and the bolometric luminosity has been estimated by fitting a multicolour disk model (Marchese et al., 2012). Caccianiga et al. (2013) report their black hole masses, estimated using the “single epoch” spectral method (based on measuring the broad line widths and the continuum emission).
The X-ray properties of the XBS AGN population are presented in Corral et al. (2011). From their analysis, the authors identify QSOs absorbed in the X-ray (XQSO2s, i.e. sources with intrinsic absorption and X-ray luminosity ). In the work presented here, we excluded sources, optically classified as unobscured objects, having with error bars crossing the threshold (XBSJ102417.5+041656, XBSJ213719.6-433347, and XBSJ213820.2-142536). We included two more XQSO2s, identified after the publication of the X-ray analysis of the sample (XBSJ051413.5+794343 and XBSJ080411.3+650906); the data analysis has been performed following the same prescriptions as in Corral et al. (2011). Note that for XBSJ051413.5+794343 the quality of the X-ray spectra allows us to obtain only an upper limit to the intrinsic column density . Nevertheless, this object has been included in the sample, since the optical classification as AGN2 suggests the presence of obscuration.
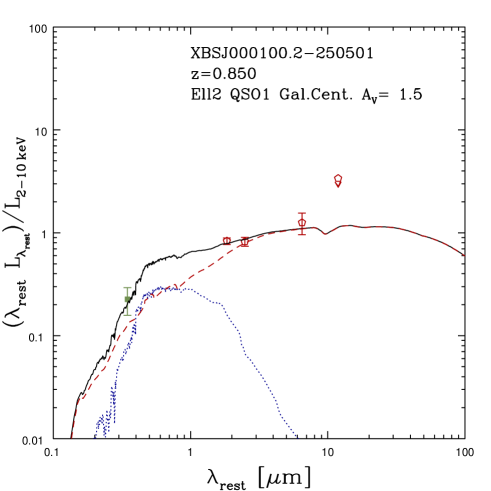
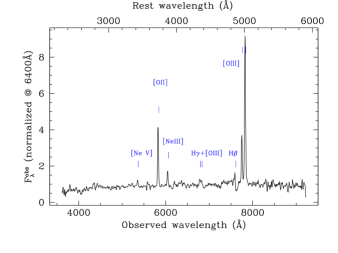
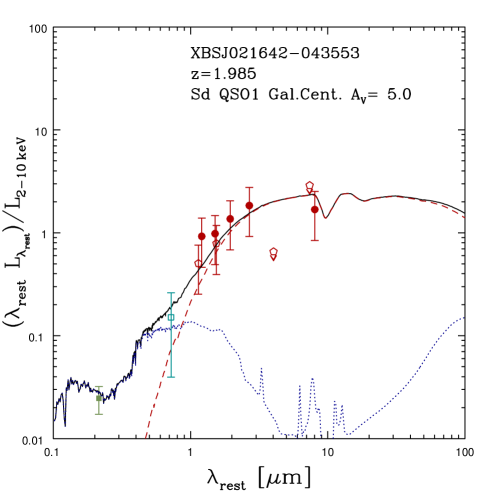
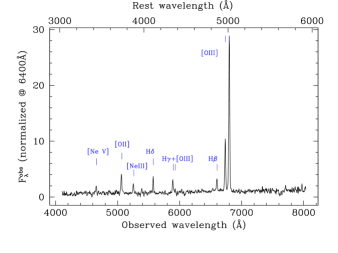
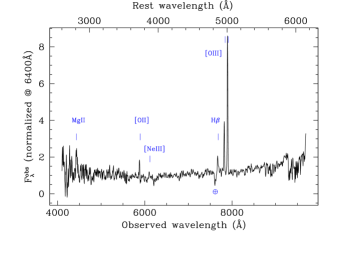
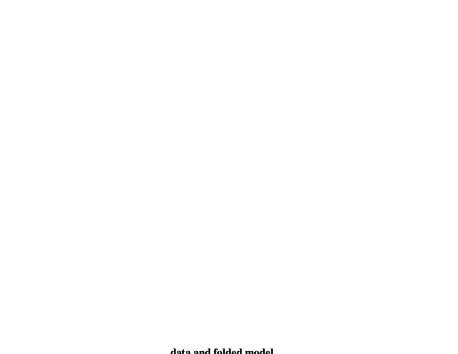
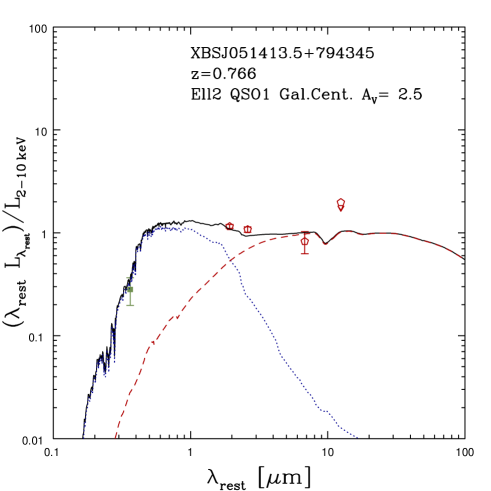
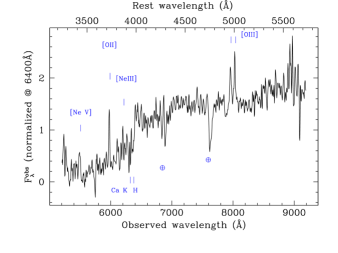
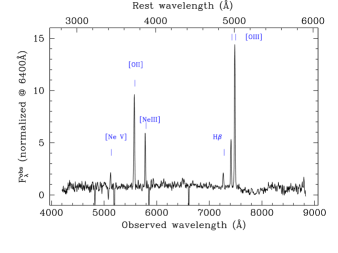
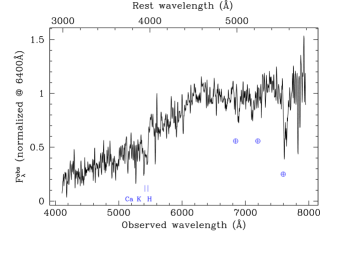
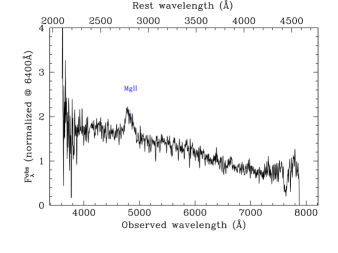
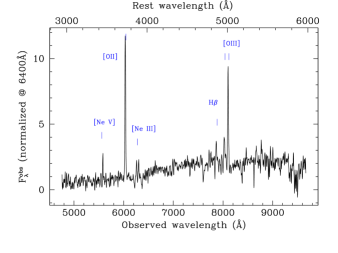
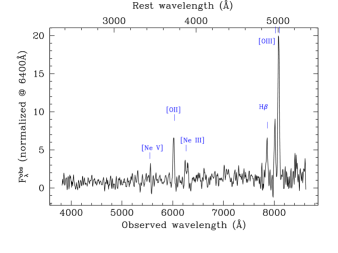
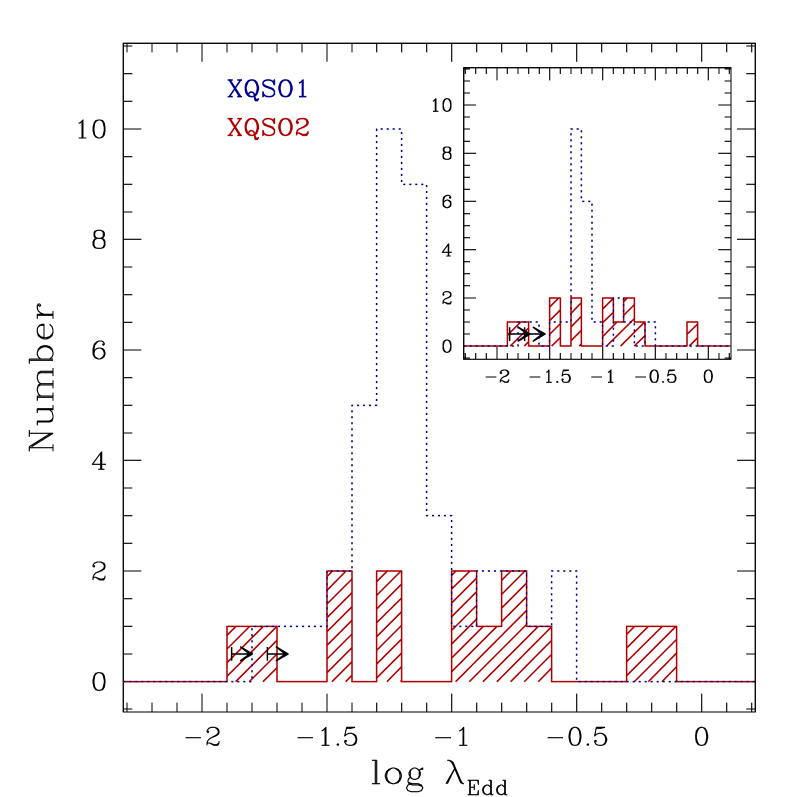
The final sample is then composed by objects; are found only in the HBSS, belong only to the BSS, and are present in both samples. We report the distributions in redshift, X-ray luminosity, and column density of the XQSO2s in Fig. 1. The XQSO2 sample covers a redshift range , with only one object at higher redshift, (XBSJ021642.3-043553, an X-ray selected Extremely Red Object discussed in details by Severgnini et al., 2006). Basic information is listed in Table 1, together with a summary of the results of the analysis performed by Corral et al. (2011), except for the two new optical identifications, presented here for the first time. The X-ray and optical spectra for all the sources are shown in Fig. 2 (top and central panels): for the majority of the XQSO2s, the optical spectra are typical of optically type 2 AGN, with only optically elusive AGN (XBSJ052128.9-253032, XBSJ080411.3+650906, and XBSJ134656.7+580315) and objects (XBSJ000100.2-250501 and XBSJ144021.0+642144, % of the XQSO2s) classified as type 1 AGN, in agreement with the fraction of “mixed” classification of about % reported in literature (e.g., Trouille et al., 2009; Merloni et al., 2014). For an extensive discussion on the X-ray versus optical absorption in the XBS, we refer the reader to section 4.1 in Corral et al. (2011); here we note that the only two optically classified type 1 sources have the lowest , near the adopted threshold, and the observed mismatch is probably due to the assumption of the Galactic dust-to-gas ratio as mean .
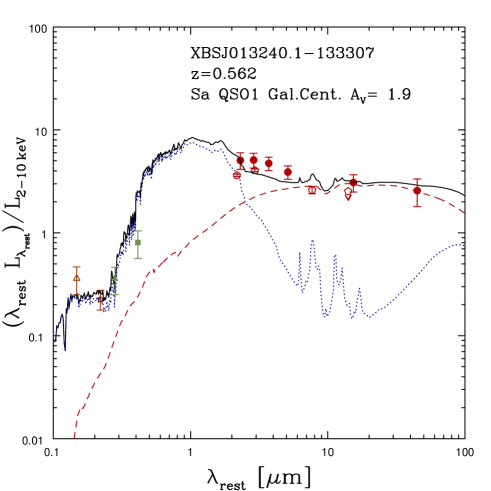
As a follow-up programme of specific XBS sources, we obtained new XMM-Newton observations for out of the XQSO2s, namely XBSJ013240.1-133307, XBSJ113148.7+311358, and XBSJ160645.9+081525 (OBSID , , and , respectively; PI Della Ceca). A detailed analysis of the new data is reported in Appendix A. In the following, for these three sources we will assume the and reported in Table 7 for the new XMM-Newton data; for each source, the most significant parameters are quoted also in Table 1 (second row).
3 UV-to-IR SED
In order to investigate the physical properties of the QSOs, we constructed their broad-band SED, from UV to IR wavelengths.
3.1 Spitzer observations and data reduction
Spitzer data for XQSO2s were obtained in the Cycle-, as part of a study of a statistically complete sample of optically absorbed AGN drawn from the XMM HBSS (Programme ID:; PI P. Severgnini). The observations were performed with the IRAC (, , , and m) and MIPS ( and m) instruments in photometry mode. We used a frame time of sec with a dither pattern of points for the IRAC observations, and a frame time of sec with a cycles and small field pattern for the MIPS ones. To estimate the flux densities in the IRAC and at the MIPS-m bands, we used the final combined post-basic calibrated data (BCD) mosaics produced by the Spitzer Science Center (SSC) pipeline. At m, we looked at both the filtered and unfiltered post-BCD mosaics and if we saw negative side-lobes around our target in the filtered data, we re-filtered our BCD data by Ge Reprocessing Tools (GeRT). The GeRT is a contributed software from the MIPS Instrument Support Team made available to the scientific community to carry out custom offline data reduction of MIPS-Ge ( and m) data. In those cases in which the re-filtering offline process was applied, we have co-added and background subtracted the updated BCDs with the SSC Spitzer Mosaiker - MOPEX software (Makovoz & Marleau, 2005). The resulting mosaics were made with pixel size.
The flux densities of our targets have been measured using the IRAF package and the Sextractor software. For point-like sources, we estimated the aperture photometry at the position of the sources and we applied aperture corrections as derived by using the Point Response Function. The chosen aperture radii are for the IRAC bands, and at m. Only in the presence of nearby optical and/or IR sources smaller apertures have been used. For all of those sources which appear extended in the IRAC and/or MIPS images we used the curve of growth by masking possible sources nearby the target.
All the sources are detected up to m. We find flux densities ranging from Jy to mJy in the IRAC bands, and from to mJy at m. At m, we measure a significant emission (from to mJy) for of our targets. For one additional source, we were able to estimate an upper limit to the flux using the weakest source detected in the field as limit.
Among the sources for which we do not have our own Spitzer data, XBSJ021642.3-043553 and XBSJ022707.7-050819 fall in one of the fields covered by the Spitzer Wide Area Infrared Extragalactic Survey (SWIRE; Lonsdale et al., 2003); from the SWIRE catalogue444http://irsa.ipac.caltech.edu/applications/Gator, we retrieved the flux densities obtained with aperture #4, corresponding to a radius of and for the IRAC and MIPS data, respectively. Both sources are detected up to m.
Images in the IRAC and MIPS bands for XBSJ122656+013126 were retrieved from the archive and reduced as was done for the proprietary data; the source is detected up to m. We found imaging at m for one more object, XBSJ144021.0+642144; for the remaining sources in our sample, we did not find either IRAC or MIPS data in the Spitzer archive.
Summarizing, including both proprietary and archival observations, we have and detections in the IRAC bands (at , , and m) and at m, respectively, while at m we have detections and upper limit; the results of the Spitzer data analysis are reported in Table 2.
3.2 WISE
WISE is a NASA satellite that imaged the whole sky in four mid-IR photometric bands, centred at , , and m. We refer to these bands as W1, W2, W3 and W4, respectively. The angular resolution is , , , and , respectively. We use the WISE All-Sky Data Release (2012 March), which includes all observations obtained during the fully cryogenic mission (2010 January 7 to 2010 August 6). The WISE All-Sky source catalogue has been searched by using the X-ray source position and assuming an impact parameter equal to ; we considered as detection only WISE magnitudes with signal-to-noise ratio in the W1, W2, and W3 bands, and in the W4 band; for lower , we assumed the corresponding upper limits. A posteriori we found that the selected WISE objects were closer than from the input source position. Using a simulated sample of objects, we estimated that the probability to have a random WISE source into a circle of radius is %, implying that all the associations between the WISE objects and our XQSO2s are likely real.
In Table 2, we report the flux densities, computed from the profile-fit photometry (obtained from the WISE All-Sky source catalogue) by assuming the magnitude zero points of the Vega system corresponding to a power-law spectrum () with . The differences in the computed flux densities expected using flux correction factors that correspond to , or (lower than %, %, %, and % in W1, W2, W3 and W4, respectively) have been linearly added to the catalogued flux errors. Following the prescription in Wright et al. (2010), an additional % uncertainty was linearly added to the and m fluxes.
3.3 Other data
In Table 3 we report the SDSS , , , , and magnitudes found for XQSO2s. Magnitudes in the -band were collected from the literature for XQSO2s (Fiore et al., 2003; Caccianiga et al., 2008); a DSS magnitude was available for one source, while we found a magnitude in the -band for one more object (Stalin et al., 2010). From the Galaxy Evolution Explorer (GALEX) catalogue we retrieved fluxes in the near-UV (at Å) for XQSO2s, one of them having also an entry in the far-UV (at Å); for XBSJ013240.1-133307 a magnitude in the -band was obtained from the Optical Monitor (OM) telescope onboard XMM-Newton (see Appendix A). At longer wavelengths, in addition to Spitzer and WISE photometry, a -band magnitude for XBSJ021642.3-043553 is reported by Severgnini et al. (2006).
4 SED deconvolution
To decompose the galaxy and AGN contributions, we adopted a very simple phenomenological approach. We have constraints from both photometry and optical spectra; to account for all of them, we made use of
- (a)
- (b)
-
a template of AGN narrow lines, constructed adopting the prescriptions in Krolik (1998) for the relative intensities of the lines;
- (c)
-
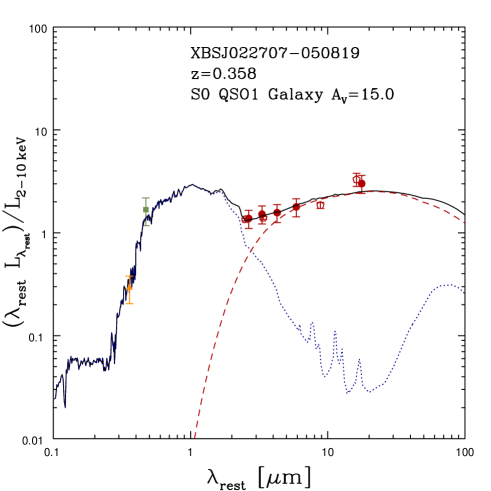
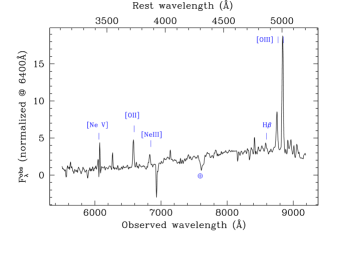
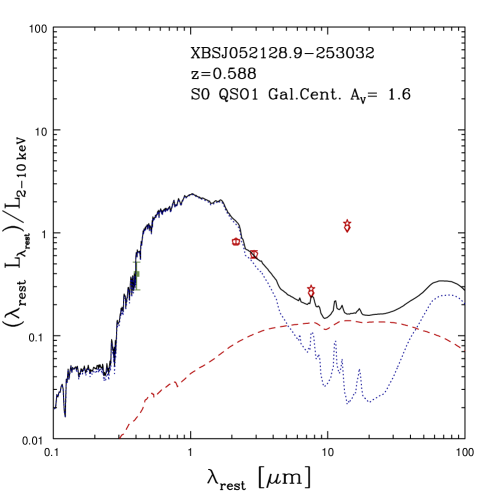
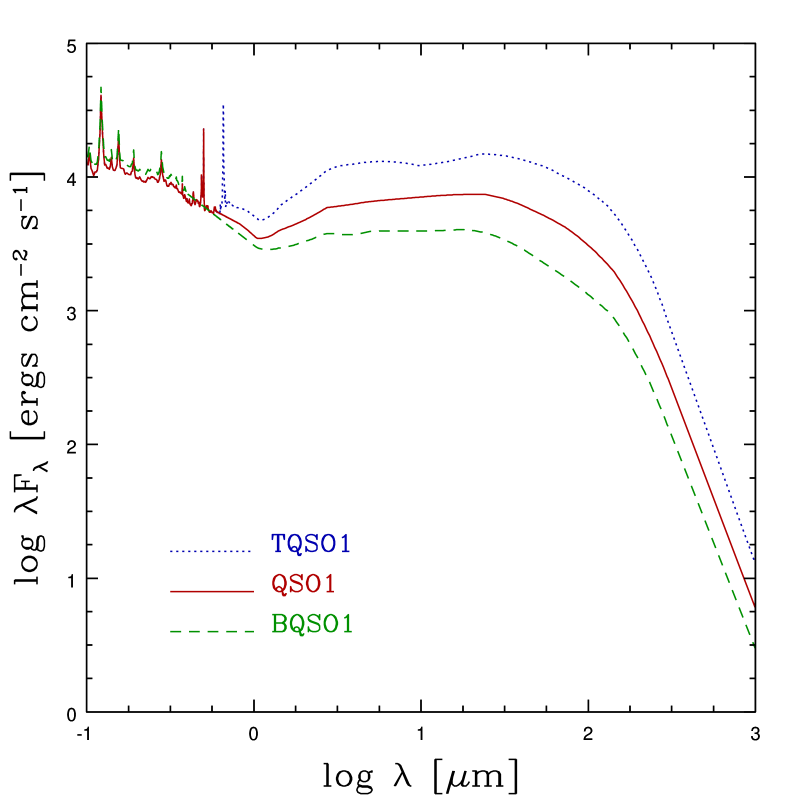
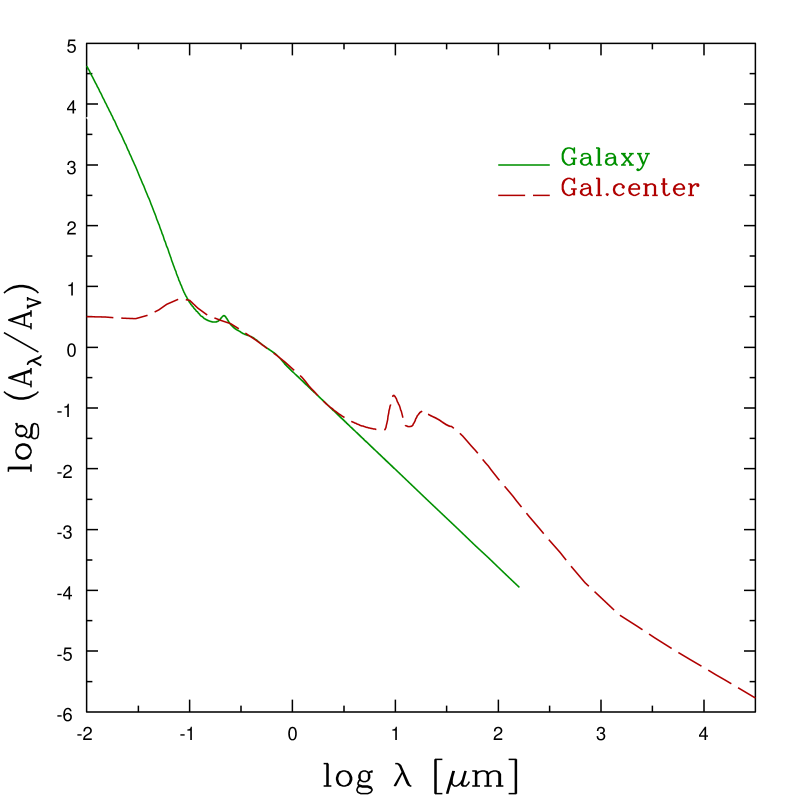
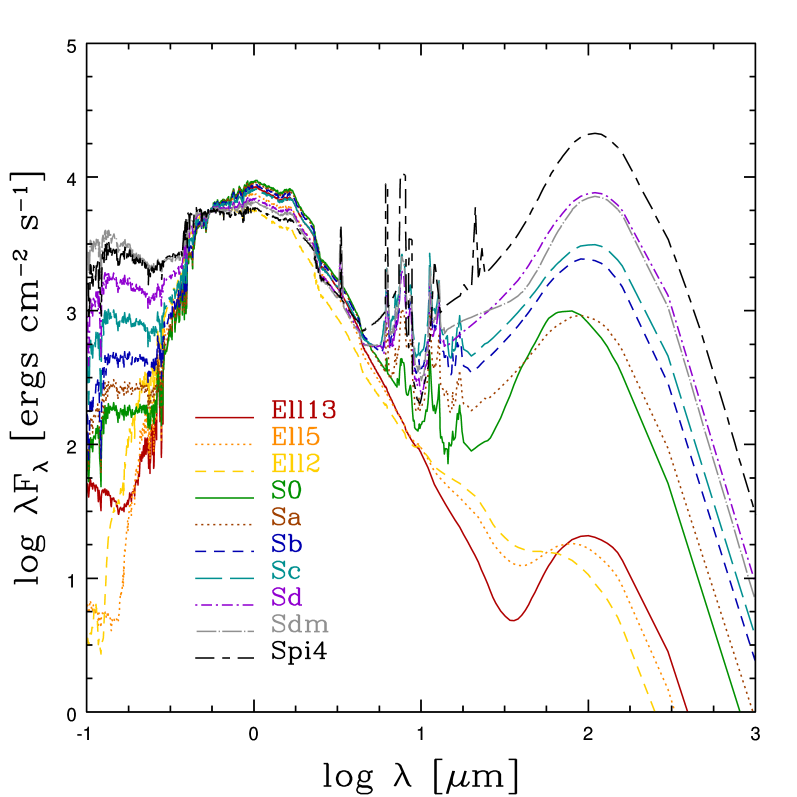
a set of templates of QSOs and galaxies, extending from the UV up to the mid-IR wavelength bands, chosen from the template library of Polletta et al. (2007). The broad-band QSO templates have been derived by combining the SDSS QSO composite spectrum and rest-frame IR data of a sample of optically-selected type 1 QSOs observed in the SWIRE programme. We considered three templates with the same optical spectrum but with three different IR SEDs: a mean IR spectrum, obtained from the average fluxes of all the measurements (“QSO1”), a template with high IR/optical flux ratio, obtained from the highest % measurements per bin (“TQSO1”), and a low-IR emission SED obtained from the lowest % measurements per bin (“BQSO1”). The three templates are shown in Fig. 3, left-hand panel. Regarding the galaxy emission in the UV-IR, we considered templates, each of them covering the wavelength range between Å and m. They include ellipticals and spirals (from early to late types, S0-Sdm; see Fig. 3, right-hand panel).
To extinguish the nuclear emission, both the extinction curves of our Galaxy, and of the Galactic Centre (Chiar & Tielens, 2006), have been considered; a comparison between the two curves is shown in Fig. 3, central panel.
First, we concentrated on the optical spectra, to obtain a guess for the dust extinction. XBSJ021642.3-043553 has been discussed in details in Severgnini et al. (2006); for the remaining sources, the optical AGN template (previously labelled as a) has been absorbed and then summed up to the narrow line component (previously labelled as b); the total AGN template was redshifted to the redshift of the source and summed with a redshifted galaxy template. We varied the amount of dust extinction, , and the relative AGN/galaxy normalization until a good reproduction of the available optical spectrum is reached. An estimate of ( objects), or a lower limit to the same parameter ( objects), have been thus obtained.
We then moved to the analysis of the UV-to-mid-IR SED. In this modelling, the (or the lower limit to ) obtained from the spectral analysis has been used as a first guess for the photometric dust extinction; the latter has been left free to vary during the SED modelling. Similarly, as guess for the host type, we considered the Ca break at Å obtained from the optical spectra. After shifting the photometric data to the rest frame, each SED has been reproduced by the sum of a galaxy plus a QSO template (both previously labelled as c). In the modelling, the latter was absorbed to reproduce the intrinsic obscuration at the source redshift before summing up with the galaxy component. For each source and for each QSO template, different combinations of nuclear and galaxy templates have been tested; we selected the combination that, from a visual match, was able to better reproduce most of the photometric points. In the SED analysis described here, we did not take into account information derived from the X-ray data. In particular, we did not assume any relation between the and the dust extinction.
Note that, since a significant fraction of the flux in the UV and optical bands has been absorbed in our AGN template, the UV and optical photometric data are most-likely dominated by the host galaxy template. In this sense, among the photometric points, the SDSS data are the most relevant ones to constrain the galaxy type, at least for the optically type 2 XQSO2s.
In discussing the results of our analysis, a couple of considerations about the adopted method of modelling must be taken into account. First, here we are assuming that the emission of type 2 QSOs can be reproduced using the mean disktorus emission of the QSO1s, after screening both components with a nuclear extinction, reproducing the absorption and auto-absorption associated with the torus. A more physical approach would require a more sophisticated parametrization of the AGN torus, to properly describe the auto-absorption and re-emission balance and its dependence on the angle of view or the dust properties. In particular, observational evidences suggest that the dust within the torus is arranged in clumps instead of being smoothly distributed (Krolik & Begelman, 1988; Tacconi et al., 1994; Tacconi, 1996; Markowitz, Krumpe, & Nikutta, 2014, and references therein). However, our data coverage and spectral resolution are not sufficient to constrain the huge number of parameters present in the torus models incorporating clumpy gas (e.g., Nenkova, Ivezić, & Elitzur 2002; Hoenig et al. 2006; Nenkova et al. 2008a, b; Schartmann et al. 2008; Heymann & Siebenmorgen 2012; see Hoenig 2013 for a review). Instead, an approach like the one adopted here is more than adequate for sparse photometric data point.
Moreover, in the mid/far-IR band the empirical QSO1 templates from Polletta et al. (2007) in principle could suffer of contamination due to the host galaxy emission. However, a comparison with the results presented by Mateos et al. (2012, 2013) on a sample of X-ray selected type 1 AGN SED strongly suggests that at luminosities greater than such a contribution, if present, would not affect our results. The selection technique applied by the authors, based on the mid-IR colours, suggests a total mid-IR emission dominated by the AGN component. The median SED of the Mateos et al. type 1 AGN is well represented by the same templates adopted here, therefore we expect that a similar result can be applied to our XQSO2s.
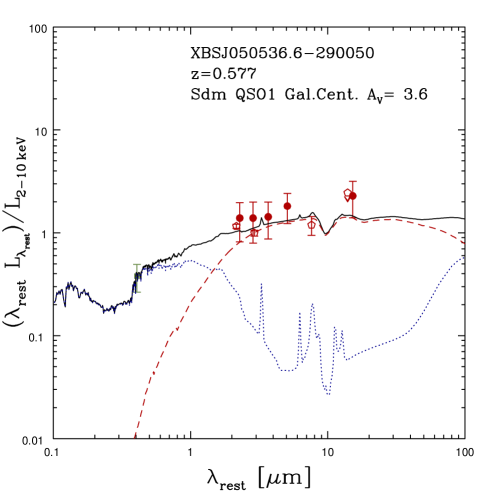
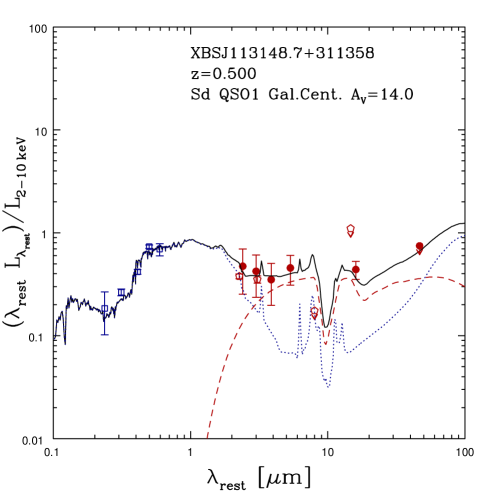
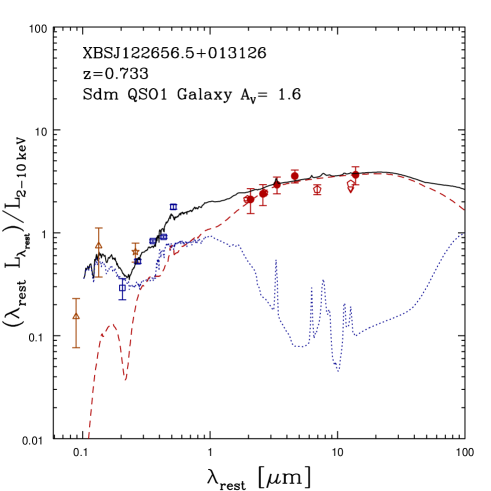
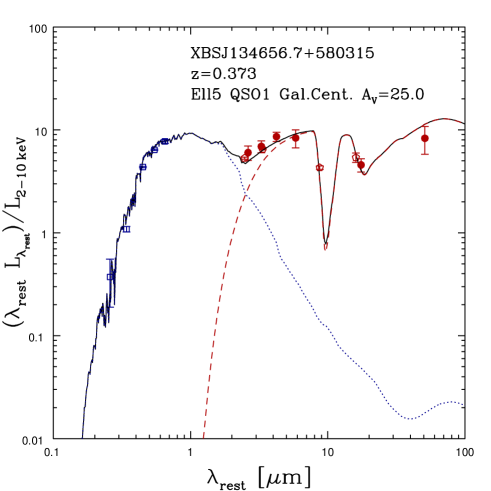
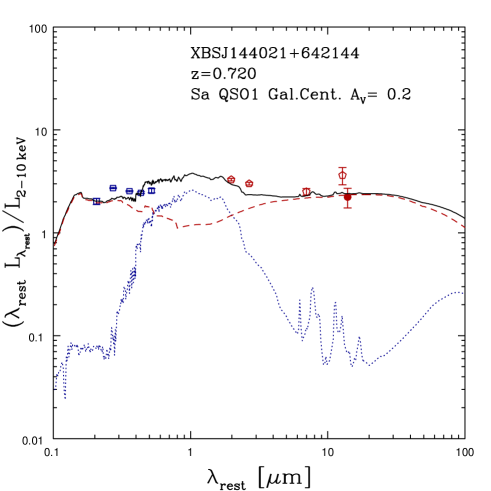
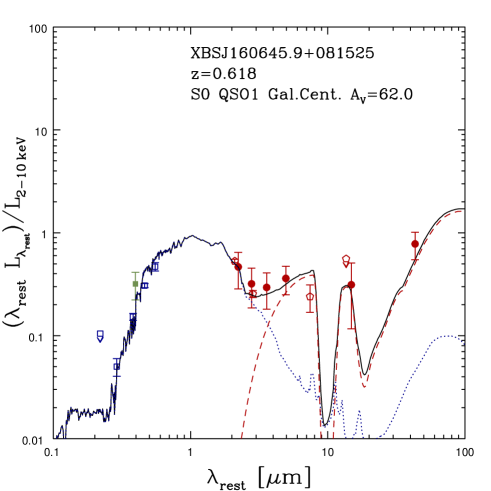
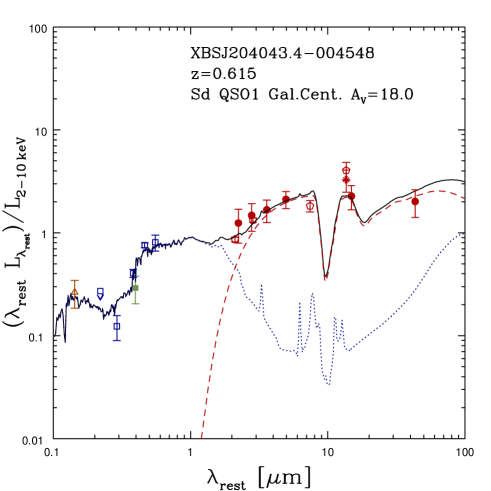
In Figure 2, bottom panel, we report the resulting SEDs normalized to the de-absorbed rest frame keV luminosity derived from the X-ray spectral analysis (as in Table 1). For most of the sources, each of the tested templates of QSO (i.e., “TQSO1”, “QSO1” and “BQSO1”) provides an acceptable description of the observed SED, with slightly different relative normalizations of the templates and amount of dust extinction: of course, this implies different values for the physical parameters estimated from the modelling (see Sect. 5). Details on the SED modelling of each object are reported in Appendix B; in the following, for each parameter we will quote the value estimated assuming the mean template, “QSO1”, while the associated range corresponds to the minimum and maximum values obtained when all the possible modellings (with all the QSO templates and extinction curves) are considered.
For XBSJ052128.9-253032 and XBSJ080411.3+650906, the available data do not allow us to infer both the intensity of the nuclear emission and the level of optical absorption. In these cases, we carried out the modelling several times, with fixed to different values ranging between the lower limit recovered by the analysis of the optical spectrum () and the highest value obtained from the column density provided by the X-ray analysis (), assuming a Galactic dust-to-gas ratio, mag/cm-2 (Bohlin, Savage, & Drake, 1978) to investigate the effects of different levels of obscuration. For each physical parameter, we assume the value provided by the modelling with as reference.
When the spectral analysis provides estimates of , these differ from the values derived from the SED by a factor lower than . Regarding the sources for which we obtained only a lower limit to the dust extinction, in cases the SED-derived values agree with these limits. For three sources, namely XBSJ022707.7-050819, XBSJ134656.7+580315, and XBSJ160645.9+081525 (which optical spectra suggest mag), the SEDs require an in good agreement with the derived from the X-ray analysis (see Table 4). For what concerns the two optically type 1 AGN, XBSJ000100.2-250501 and XBSJ144021.0+642144, both the spectral analysis and the SED modelling give us results in agreement with the optical classification. At the same time, the quite different recovered reflects the difference observed in the optical spectra (see Fig. 2), with XBSJ000100.2-250501 (mag, as derived from the SED) being clearly redder than XBSJ144021.0+642144 (for which we find mag).
From our analysis, out of the XQSO2s reside in ellipticals or early spirals (S0 or Sa). Our findings are quite in agreement with previous results on luminous type 2 AGN, such as the SDSS sample by Zakamska et al. (2006), who found mainly elliptical hosts. Recently, Mignoli et al. (2013) linked the lower fraction of ellipticals found in their sample of [\textNe v]-selected obscured AGN to the range in nuclear luminosity covered, extended to an order of magnitude lower than SDSS type 2 QSOs. For XQSO2, instead, the SED modelling suggests a late-type host galaxy (Sd and Sdm). In three cases, this result is quite robust thanks to the availability of SDSS and/or GALEX data. Although any comparison should be done with caution, due to the different methods of classification (X-ray based or optically-based), this is an interesting result since a paucity of AGN hosted in late-type spiral and irregular morphologies has been claimed, at least in optically selected samples (e.g., Mignoli et al., 2013).
5 Recovering the nuclear properties
Disentangling the AGN and host galaxy emission as described in Sect. 4 provides detailed information on the host-galaxy bulge and nuclear components. In this section, we detail how we use this information to derive the BH masses, the bolometric luminosities, and the Eddington ratios for the XQSO2s.
5.1 Black hole masses
Starting from the absolute magnitude of the host galaxy only, we obtain an estimate of the mass of the central compact object, using the observed local relationship between BH mass and bulge component luminosity. Several versions of this relation have been proposed with the bulge luminosity evaluated in different electromagnetic bands ranging from to (see e.g., Kormendy & Gebhardt, 2001; McLure & Dunlop, 2002; Marconi & Hunt, 2003). Here, we adopt the relation discussed in Graham (2007), corrected for our different cosmology:
| (1) |
where is given in units of solar masses and is the absolute -band magnitude of the bulge; the total scatter associated is dex. In order to determine the -band luminosity of the bulge component, we combined the total luminosity of the host galaxy, as estimated from our SED fitting, with the bulge-to-disk flux ratio in the -band as a function of galaxy type reported by Graham & Worley (2008).
Note that adopting these relations implies assuming that the absolute magnitude of the bulge strictly mirrors the mass in old stars, , which is the quantity primarily related to the BH mass. Moreover, we are implicitly assuming that the - relation is already imprinted at , driving the main episode of accretion.
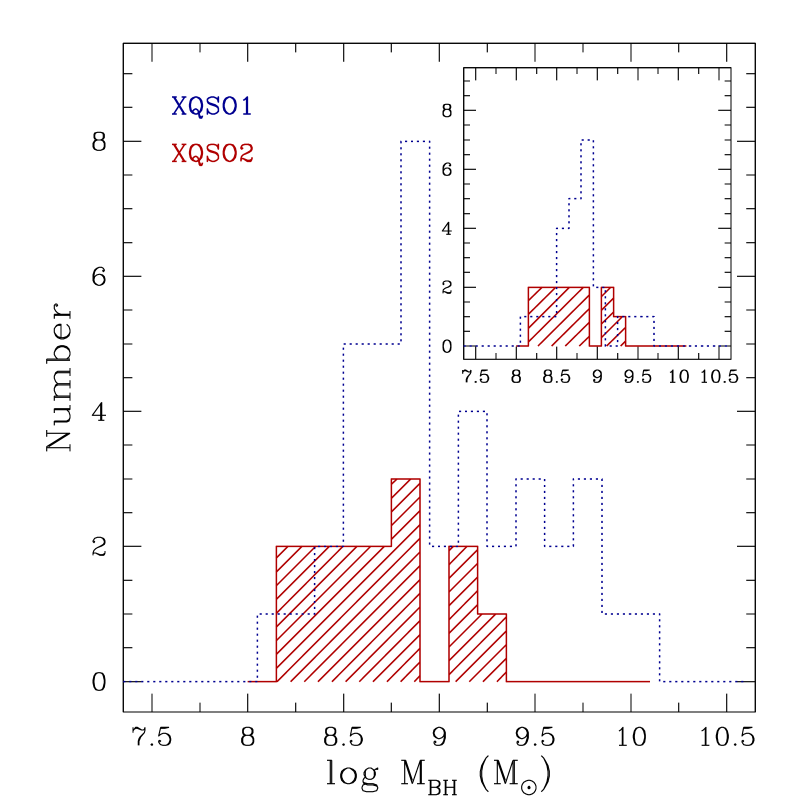
We found rather high masses, narrowly distributed between and (see Table 4 and Fig. 4, left-hand panel).
For the two optically type 1 objects in our sample (i.e., XBSJ000100.2-250501 and XBSJ144021.0+642144) we compared the mass of the central BH recovered from the scaling relations with the value estimated via the “single epoch” method. Taking into account the redshift of the sources ( and for XBSJ000100.2-250501 and XBSJ144021.0+642144, respectively), we used the Å emission line, adopting the relation presented in Shen et al. (2011):
| (2) |
for Å. The width of the line has been measured as described in Caccianiga et al. (2013), while the monochromatic continuum luminosity has been recovered from our SED modelling, after correcting the nuclear template for the absorption. We obtain values of mass of and for XBSJ000100.2-250501 and XBSJ144021.0+642144, respectively. For one more object, XBSJ122656.5+013126, showing a low-level of dust extinction in the optical spectrum, Shen et al. (2011) derived an estimate of the BH mass of (from the FWHM of the line and the continuum luminosity at Å, adopting their equation 5). In all cases, the virial estimators give values for the BH mass in relatively good agreement with the values obtained from equation 1 (see Table 4), considering that the uncertainties associated with the “single epoch” masses are of the order of dex (Park et al., 2012).
5.2 Bolometric luminosities and Eddington ratios
The next step is to investigate the nuclear bolometric luminosity of the XQSO2s. In unabsorbed sources, this quantity can be computed as the sum555In this case, the IR emission is not taken into account: being re-processed emission mainly from the UV, its inclusion would mean counting part of the emission twice, overestimating the derived bolometric luminosities. of the accretion disk optical/UV luminosity integrated at wavelengths shorter than m and the intrinsic X-ray luminosity between and keV rest frame, +.
However, in obscured sources is almost completely absorbed due to the high dust extinction. Thus any estimate of the accretion disk luminosity would strongly depend on the template adopted to reproduce the intrinsic optical-UV emission of the QSO. Moreover, from the analysis of the optical/UV SED of the type 1 AGN in the XBS presented in Marchese et al. (2012), we found that the effective disk temperature ranges from to eV, and on average the disk emission has a eV. Therefore, the limit at m of the template of AGN would provide a change in an estimated disk luminosity lower than the intrinsic one by a factor up to %.
We therefore adopted a different approach: we self-calibrated the intrinsic nuclear emission using the SED of the X-ray unabsorbed QSOs drawn from the XBS.
We considered the AGN in the XBS (hereafter, XQSO1s) with (i) intrinsic absorption (detected, or upper limit) low enough to minimize the possible effects of absorption on the estimate of the ( or upper limit to lower than ; Fanali et al., 2013); and (ii) X-ray luminosity above the threshold assumed for the XQSO2s (). The redshift, X-ray luminosity, and column density distributions of the XQSO1s are reported as dashed blue lines in Fig. 1. A Kolmogorov-Smirvov (KS) test indicates that this subsample is not statistically different from the sample of X-ray unabsorbed () AGN with belonging to the XBS for what concerns the distributions in redshift, X-ray and bolometric luminosities, BH mass and Eddington ratio.
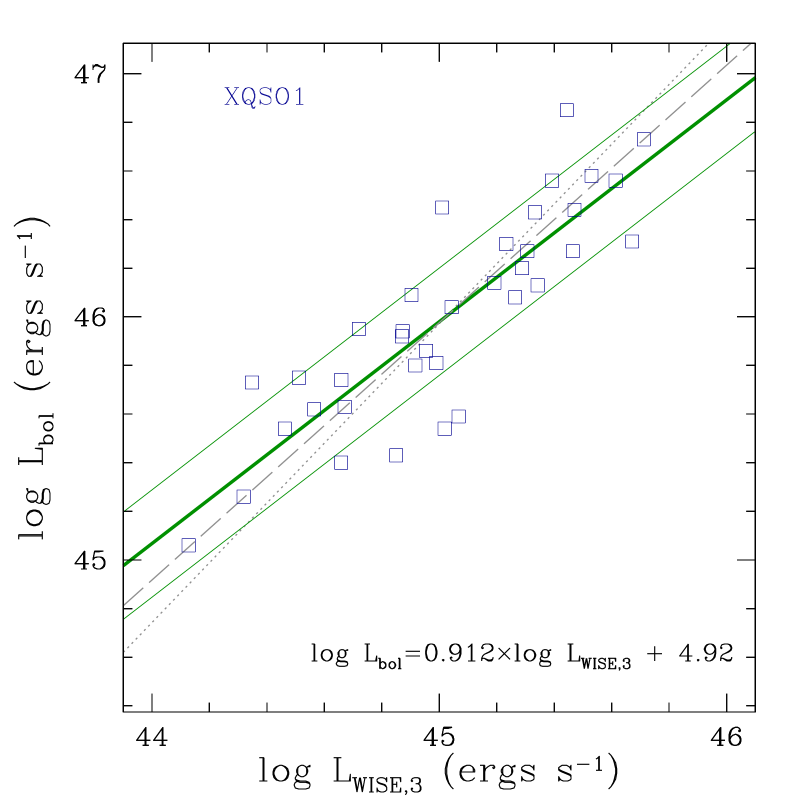
We want to use this sample of XQSO1s, for which a bolometric luminosity has been already computed, to obtain an IR bolometric correction to be applied to the sample of XQSO2. In particular, we use the WISE W3 magnitude since in this band (a) observations with good are available, and (b) we are confident that in luminous unobscured QSOs the data are dominated by the AGN (note that all the XQSO1s are also optically classified as type 1). From our SED modelling, when the QSO emission is corrected for the absorption (thus reproducing the SED of an unabsorbed QSO), we expect that the galaxy contributes less than % to the total luminosity observed in the W3 band.
As done for the XQSO2s, we looked for a WISE counterpart of the XQSO1s, finding an IR detection in WISE for all but one; here we considered the WISE counterparts with in W3. For these XQSO1s, we computed the luminosity in the W3 band, , where and are the monochromatic luminosity (derived from the catalogued WISE magnitude as detailed in Sect. 3) and the central frequency correspondent to the W3 band, observed frame (corresponding to m rest frame, depending on the redshift). Since early studies based on IRAS data (e.g. Spinoglio & Malkan, 1989), it is known that the AGN flux emitted at these wavelengths is a fraction almost constant of the bolometric flux.
We then compared with the ; the latter has been derived by Marchese et al. (2012) from an optical/UV SED modelling (therefore the IR emission is not included in the calculation). The ratio between and is approximately constant, with a mean “WISE W3” bolometric correction (see Fig. 5). In these high-luminosity QSOs the bolometric and W3 luminosities are well-correlated over dex. The best-fitting relations using an ordinary least squares (OLS) analysis, treating as independent variable [OLS(YX)] or [OLS(XY)], as well as the OLS bisector666This is the line that bisects the smaller of the two angles between the OLS(YX) and OLS(XY) lines., are as follows:
| [OLS(YX)] | (3) | ||||
| [OLS(XY)] | (4) | ||||
| [bisector] | (5) |
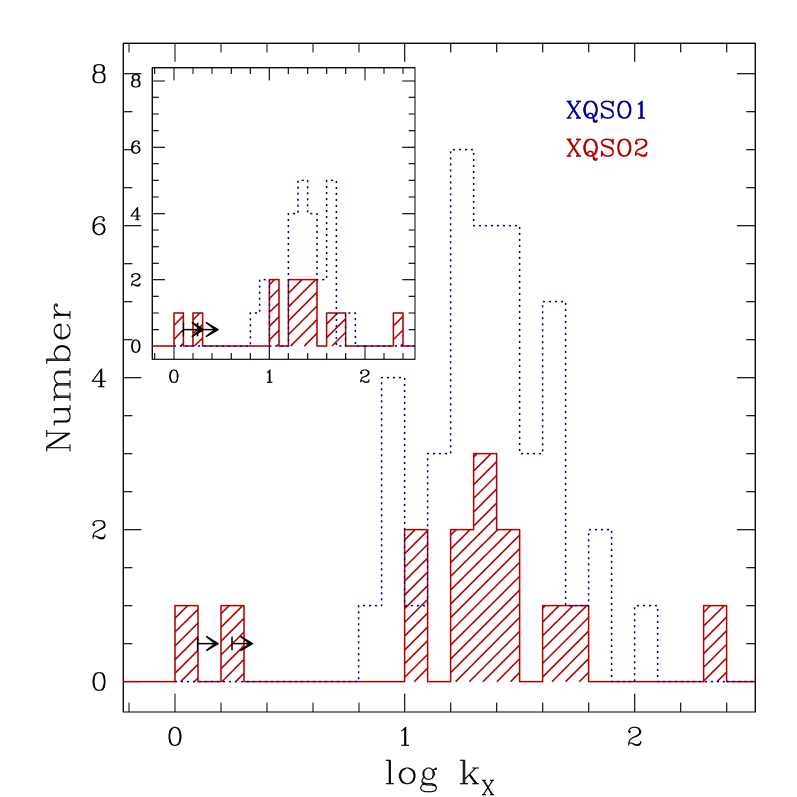
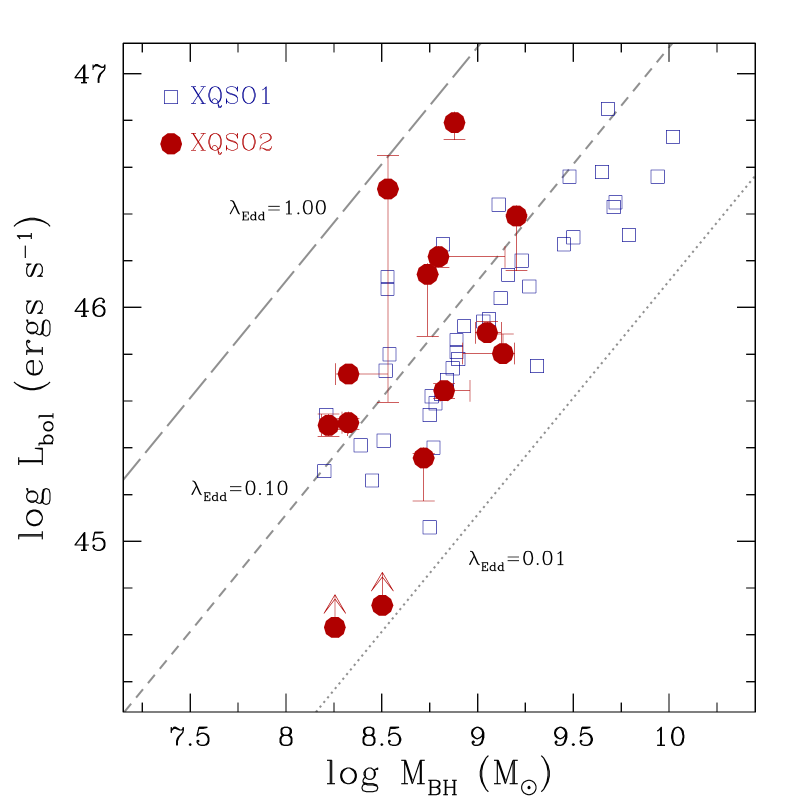
The bolometric luminosities of the XQSO2s have been recovered from equation 3; the has been derived from the nuclear component, as obtained in our deconvolution of the SED, after correcting for the estimated absorption. The estimated are reported in Table 4 and are plotted versus the in Fig. 6 (where the diagonal lines represent the trend between and at different fractions of the Eddington luminosity). The distribution of X-ray bolometric corrections, , is reported in Fig. 4 (central panel). We note again that our framework is the basic Unified Model; in particular, we are assuming that the covering factors of absorbed and unabsorbed objects are the same.
From the black hole mass and the bolometric luminosity, we can estimate the accretion rate normalized to the Eddington luminosity, (as defined in Sect. 1). The values are reported in Table 4; as shown in Fig. 4 (right-hand panel), ranges from and ; for out of QSOs (among them, the two sources for which we are only able to put limits to the nuclear emission) we found .
| Name | Host | |||||||||||||||
|---|---|---|---|---|---|---|---|---|---|---|---|---|---|---|---|---|
| (1) | (2) | (3) | (4) | (5) | (6) | (7) | (8) | |||||||||
| XBSJ000100.2-250501 | . | ( - | ) | ( - | ) | Ell2 | ( - | ) | ( - | ) | ||||||
| XBSJ013240.1-133307 | . | ( - | ) | ( - | ) | Sa | ( - | ) | ( - | ) | ||||||
| XBSJ021642.3-043553 | . | ( - | ) | ( - | ) | Sd | ( - | ) | ( - | ) | ||||||
| XBSJ022707.7-050819 | . | ( - | ) | ( - | ) | S0 | ( - | ) | ( - | ) | ||||||
| XBSJ050536.6-290050 | . | ( - | ) | ( - | ) | Sdm | ( - | ) | ( - | ) | ||||||
| XBSJ051413.5+794345 | . | ( - | ) | ( - | ) | Ell2 | ( - | ) | ( - | ) | ||||||
| XBSJ052128.9-253032 | . | ( - | ) | ( - | ) | S0 | ( - | ) | ( - | ) | ||||||
| XBSJ080411.3+650906 | . | ( - | ) | ( - | ) | Sa | ( - | ) | ( - | ) | ||||||
| XBSJ113148.7+311358 | . | ( - | ) | ( - | ) | Sd | ( - | ) | ( - | ) | ||||||
| XBSJ122656.5+013126 | . | ( - | ) | ( - | ) | Sdm | ( - | ) | ( - | ) | ||||||
| XBSJ134656.7+580315 | . | ( - | ) | ( - | ) | Ell5 | ( - | ) | ( - | ) | ||||||
| XBSJ144021.0+642144 | . | ( - | ) | ( - | ) | Sa | ( - | ) | ( - | ) | ||||||
| XBSJ160645.9+081525 | . | ( - | ) | ( - | ) | S0 | ( - | ) | ( - | ) | ||||||
| XBSJ204043.4-004548 | . | ( - | ) | ( - | ) | Sd | ( - | ) | ( - | ) | ||||||
Note: New optical identifications. The two objects for which we are able to put only limits to the nuclear emission.
Col. (1): Source name in the XBS sample.
Col. (2): Dust extinction (in mag).
Col. (3): Dust extinction (in mag) expected from the observed , for a Galactic dust-to-gas ratio.
Col. (4): X-ray bolometric correction.
Col. (5): Nuclear bolometric luminosity, recovered as described in Sect. 5, in units of .
Col. (6): Galactic template used in the SED modelling.
Col. (7): Mass of the central BH, in units of .
Col. (8): Eddington ratio, defined as .
6 Discussion
6.1 XQSO1s vs. XQSO2s in the XBS
In the previous sections we described how we recovered , and for the complete sample of XQSO2s in the XBS. Thanks to the analysis previously performed for the XQSO1s (Marchese et al., 2012; Caccianiga et al., 2013; Fanali et al., 2013), we are now able to compare the physical properties of X-ray absorbed and X-ray unabsorbed QSOs on a statistical basis.
Using the project for statistical computing777http://www.r-project.org/index.html R (R Core Team, 2013), we performed a set of two-samples KS tests; we compared for various parameters of interest the cumulative distributions obtained for the XQSO1s and for the XQSO2s for which we were able to infer the intensity of the nuclear emission (i.e. excluding XBSJ052128.9-253032 and XBSJ080411.3+650906). There is no evidence that the two samples are drawn from different populations in terms of any of the tested quantities (see the first row in Table 5, where the results are summarized), although the KS probability for the Eddington ratio is quite low, %.
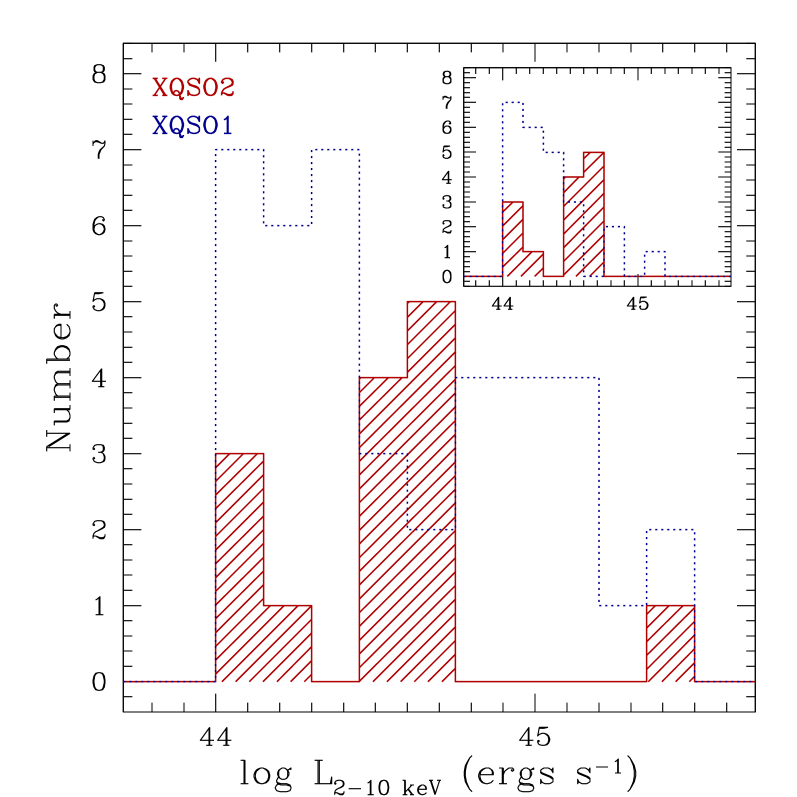
While the lower end of the two redshift distributions are similar ( and for XQSO1s and XQSO2s, respectively), all but one the XQSO2s have , while % of the XQSO1s have a redshift between and (see Fig. 1, left-hand panel). In Table 5, second row, we quote the results of the KS tests performed on the two subsamples with (their distributions in terms of intrinsic X-ray luminosity, black hole mass, X-ray bolometric correction and Eddington ratio are reported in the insets of Fig. 1, central panel, and Fig. 4): also with this cut applied, the hypothesis of the same original population is confirmed, although with a lower significance in . The KS probability for increases significantly when we restrict to ; out of the XQSO1s with , that is, the maximum value found for the XQSO2s (see Fig. 4, left-hand panel, and Fig. 6) have .
| Probability | ||||||
|---|---|---|---|---|---|---|
| All | 0.284 | 0.412 | 0.284 | 0.999 | 0.988 | 0.036 |
| 0.860 | 0.126 | 0.716 | 0.594 | 0.942 | 0.072 | |
Note: For each physical parameter, the probability for the null hypothesis (i.e. the two cumulative distributions are drawn from the same parent population) is reported (first and second rows, for the whole samples and the subsamples with , respectively).
6.2 IR emission and
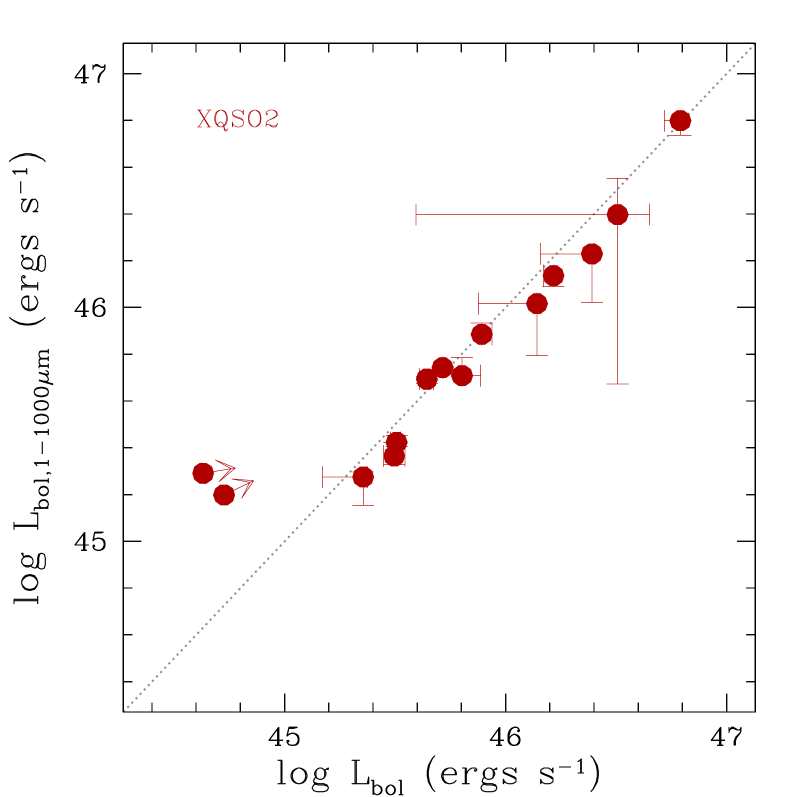
In Sect. 5.2, we derived the bolometric luminosity of the XQSO2s using the properties of the XQSO1s. The SED decomposition presented in Sect. 4 allows us to check these estimates. The IR luminosity is considered an indirect probe of the accretion disk optical/UV luminosity; using an approach similar to Pozzi et al. (2007, 2010) and Vasudevan et al. (2010), the bolometric luminosity can be computed as the sum of the total IR luminosity and the X-ray luminosity, +, where the former can be obtained from the nuclear luminosity between and m.
We calculate the by integrating the QSO template between and m after correcting for absorption. Following the works of Pier & Krolik (1992) and Pozzi et al. (2007, see also ), can be converted into the nuclear accretion disk luminosity when corrected for geometrical effects related to the covering factor of the torus. Following Pozzi et al. (2007, 2010), we assumed , corresponding to an angle between the axis of the disk and the edge of the torus. This is of course a mean value, and the derived luminosities must be assumed just as a first-order estimate.
The bolometric luminosities as derived from equation 3 are compared to the m-based bolometric luminosities in Fig. 7. The sources with well-constrained nuclear component in our SED modelling fall around the equal-luminosity relation, with a mean and a maximum scatter of dex and dex, respectively. The agreement of the two estimates of implies that absorbed and unabsorbed QSOs in the XBS have the same direct-to-reprocessed luminosity ratio. Moreover, this confirms that equation 3 can be confidently used to derive a first-order estimate of the bolometric luminosity, at least for unabsorbed high-luminosity QSOs, where the host galaxy is not expected to contaminate the emission in the WISE W3 band.
6.3 The effective Eddington limit
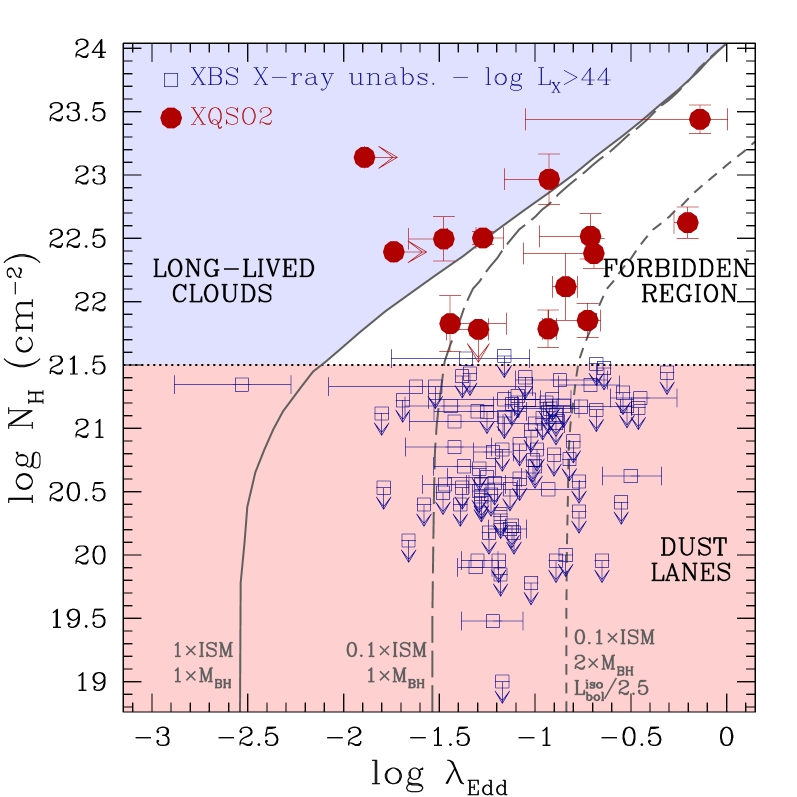
The studies of Fabian, Vasudevan, & Gandhi (2008) and Fabian et al. (2009) identify an “effective Eddington limit” for dusty gas in the - plane (see Fig. 8). Starting from the model presented in Fabian, Celotti, & Erlund (2006), the authors suggest a connection between the radiation pressure exerted by the AGN on its proximity (i.e., where the influence of the BH is dominant) and the structure of the surrounding material. Briefly, for a fixed nuclear luminosity, the incident radiation would result on an easier sweeping away of the absorber when the medium is more dusty. Assuming a dust-to-gas ratio constant during the process of “cleaning”, this translates in a “forbidden region” at high and high “classical” (i.e., derived by assuming a distribution of gas composed only of ionized hydrogen). In this region, absorbing dusty gas clouds are unstable to radiation and absorption may be transient or variable. For lower “classical” Eddington ratios, also quite dense absorbing clouds can survive to the radiation pressure (“long-lived clouds region”). Finally, sources with low () can accrete at high , being the absorption possibly associated with dust lanes, far away from the nucleus, so as to be retained by a gravitational mass large enough to balance also an intense nuclear emission.
In Fig. 8 we plot the XQSO2s studied here (red filled circles) in the - diagram; the blue open squares mark the positions of the X-ray unabsorbed AGN in the XBS with . Unlike in the previous sections, to properly fill the plane we do not restrict the comparison to AGN with , but we consider the whole sample studied by Marchese et al. (2012, ). As evident from the figure, our XQSO2s populate the “forbidden region” proposed by Fabian and collaborators (the white part of the plot). The agreement found in Sect. 6.2 between the different estimates of guarantees that this result does not depend on the method adopted to derive the bolometric luminosity. In particular, the small scatter found between the bolometric luminosities derived from equation 3 and from is not enough to move any source outside the “forbidden region”.
The “effective Eddington limit” drawn in Fig. 8 (grey continuous line) has been calculated for a grain abundance typical of the interstellar medium (ISM), and under the hypothesis that the only inward gravitational force of importance is that from the central BH (see Fabian et al., 2009). Different assumptions can modify the shape of the “forbidden region”. The lower is , the stronger are the effects of a decreasing of the grain abundance (e.g., long-dashed grey line in Fig. 8). Ratios of optical extinction to X-ray column density lower than the Galactic dust-to-gas ratio are not unusual in AGN (Maiolino et al., 2001); in out of the XQSO2s, for which we were able to properly model the nuclear properties, we find a dust-to-gas ratio lower than the Galactic one (we stress again that in Sect. 4 the dust extinction from the SED modelling was derived independently of the value of from the X-ray spectra).
As suggested by Fabian et al. (2009), the presence of stars inwards from the dusty gas clouds close to the nucleus would increase the effective Eddington limit by an amount proportional to the total enclosed mass, regardless of the amount of obscuration. Near-IR high-resolution data for Seyfert galaxies (Davies et al., 2007) have revealed evidence for recent, intense, short-lived starbursts on few pc scale distance from the BH, leaving behind massive and vertically thick nuclear star clusters.
We suggest here a further effect that could concur in reducing the proposed locus of short life: the estimation of the radiation pressure boost factor presumes isotropic emission from the accretion disk, while emission from an optically thick disk is, in principle, anisotropic. Following e.g. Kawaguchi & Mori (2010), the dependence from the polar angle of the radiation flux from a unit surface area of the disk can be expressed as (see also Laor & Netzer, 1989; Sun & Malkan, 1989). Therefore, the assumption of isotropy, that adopts the radiation observed face-on as an estimate of the flux incident on the torus at an angle with respect to the axis of the system, overestimates by a factor :
| (6) |
where is the angle between the rotation axis of the disk and the line of sight. As an example, for a , typical of type 1 AGN, the incident radiation on the torus surface at an angle would be reduced by a factor of . This would reflect on an increasing in the “effective Eddington limit” in this direction by a factor of .
Qualitatively, a combination of low grain abundance (e.g., of the order of one tenth of the ISM abundance), enclosed mass higher than (e.g., twice the mass of the central BH), and anisotropy of the disk emission, would reduce the proposed “forbidden region” in the - plane as marked by the dashed grey line in Fig. 8.
7 Summary
In this paper, we presented a detailed analysis of the accretion properties of a complete sample of XQSO2s (column density and X-ray luminosity ; , plus one object at ) drawn from the XBS.
The bright flux of these sources guarantees a high detection rate in a number of multiwavelength catalogues (Spitzer, WISE, SDSS, GALEX), thus allowing us (in combination with proprietary observations) to construct photometric broad-band SED from the optical range up to m (observed frame), or even m (observed frame). By analysing the SED with a combination of empirical templates we were able to separate the nuclear and the host-galaxy emission. For all the sources, we obtained the masses of the central black hole from the luminosity of the host galaxy, using the well-known scaling relations linking the BH mass and the host properties.
To derive the nuclear bolometric luminosities, we used the properties of the X-ray unabsorbed high-luminosity AGN (and ; XQSO1s) in the XBS. We compared their WISE luminosity at m (observed frame, a wavelength range where a powerful QSO is expected to dominate over the host galaxy emission) with the , derived from an optical/UV SED modelling (an approach that does not include the IR emission; Marchese et al., 2012). We found that in these high-luminosity unabsorbed QSOs the bolometric luminosity and the W3 luminosity are well-correlated over dex. The best-fitting relation has been then applied to the XQSO2s, adopting as W3 luminosity the value derived from the nuclear component after correcting for the estimated absorption.
The main results of our work can be summarized as follows.
-
1.
Being the unabsorbed population in the XBS previously analysed (Marchese et al., 2012; Caccianiga et al., 2013; Fanali et al., 2013), we could compare the two samples of XQSO1s and XQSO2s, looking for possible statistically significant differences. We found that X-ray-selected absorbed and unabsorbed QSOs share the same intrinsic properties (, , , and ).
-
2.
The WISE-based have been compared with the IR-based , derived from the intrinsic (i.e., absorption-corrected) as computed from the SED modelling. We found a good agreement between the two estimates. We conclude that the absorbed ad unabsorbed QSOs in the XBS sample have similar observed torus-reprocessed luminosity-to-bolometric luminosity ratio.
-
3.
The XQSO2s analysed here populate the proposed “forbidden region” in the vs. diagram. This result could imply a grain abundance much lower than in the local ISM or the presence of stars inwards of the obscuring material with mass comparable to the mass of the BH. In addition, we propose that the anisotropy in the nuclear emission can also play a significant role.
In conclusion, our work suggests that the hypothesis of different evolutionary states for absorbed and unabsorbed QSOs in addition to the basic Unified Model is not required, at least up to .
Acknowledgements
We thank the referee for her/his constructive comments that improved the paper. The research leading to these results has received funding from the European Commission Seventh Framework Programme (FP7/2007-2013) under grant agreement n. 267251 “Astronomy Fellowships in Italy” (AstroFIt). The authors acknowledge financial support from the Italian Ministry of Education, Universities and Research (PRIN2010-2011, grant n. 2010NHBSBE) and from ASI (grant n. I/088/06/0). SM and FJC acknowledge financial support by the Spanish Ministry of Economy and Competitiveness through grant AYA2012-31447. SM acknowledges support from the ARCHES project (th Framework of the European Union, n. 313146).
We thank F. Pozzi, A. Feltre and E. Lusso for the useful discussions; T. Maccacaro and L. Maraschi for their helpful suggestions; and R. Paladini for her assistance with the WISE data and catalogue.
Based on observations obtained with XMM-Newton (an ESA science mission with instruments and contributions directly funded by ESA Member States and the USA, NASA). Based on observations made under the proposals GTC18-10B and GTC44-11A with the Gran Telescopio Canarias (GTC), installed at the Spanish “Observatorio del Roque de los Muchachos” of the Instituto de Astrofísica de Canarias, in the island of La Palma. This work is based in part on observations made with the Spitzer Space Telescope, which is operated by the Jet Propulsion Laboratory, California Institute of Technology under a contract with NASA.
Funding for the SDSS and SDSS-II has been provided by the Alfred P. Sloan Foundation, the Participating Institutions, the National Science Foundation, the U.S. Department of Energy, the National Aeronautics and Space Administration, the Japanese Monbukagakusho, the Max Planck Society, and the Higher Education Funding Council for England. The SDSS Web Site is http://www.sdss.org/. The SDSS is managed by the Astrophysical Research Consortium for the Participating Institutions. This publication makes use of data products from the Wide-field Infrared Survey Explorer, which is a joint project of the University of California, Los Angeles, and the Jet Propulsion Laboratory/California Institute of Technology, funded by the National Aeronautics and Space Administration. This research has made use of NASA’s Astrophysics Data System.
References
- Abazajian et al. (2009) Abazajian K. N., et al., 2009, ApJS, 182, 543
- Antonucci (1993) Antonucci R., 1993, ARA&A, 31, 473
- Arnaud (1996) Arnaud K. A., 1996, ASPC,101, 17
- Bianchi, Maiolino, & Risaliti (2012) Bianchi S., Maiolino R., Risaliti G., 2012, AdAst, 2012,
- Bohlin, Savage, & Drake (1978) Bohlin R. C., Savage B. D., Drake J. F., 1978, ApJ, 224, 132
- Chiar & Tielens (2006) Chiar J. E., Tielens A. G. G. M., 2006, ApJ, 637, 774
- Caccianiga et al. (2007) Caccianiga A., Severgnini P., Della Ceca R., Maccacaro T., Carrera F. J., Page M. J., 2007, A&A, 470, 557
- Caccianiga et al. (2008) Caccianiga A., et al., 2008, A&A, 477, 735
- Caccianiga et al. (2013) Caccianiga A., Fanali R., Severgnini P., Della Ceca R., Marchese E., Mateos S., 2013, A&A, 549, A119
- Cattaneo et al. (2009) Cattaneo A., et al., 2009, Natur, 460, 213
- Corral et al. (2011) Corral A., Della Ceca R., Caccianiga A., Severgnini P., Brunner H., Carrera F. J., Page M. J., Schwope A. D., 2011, A&A, 530, A42
- Dadina (2008) Dadina M., 2008, A&A, 485, 417
- Davies et al. (2007) Davies R. I., Müller Sánchez F., Genzel R., Tacconi L. J., Hicks E. K. S., Friedrich S., Sternberg A., 2007, ApJ, 671, 1388
- Della Ceca et al. (2008) Della Ceca R., et al., 2008, A&A, 487, 119
- Della Ceca et al. (2004) Della Ceca R., et al., 2004, A&A, 428, 383
- de Rosa et al. (2008) de Rosa A., Bassani L., Ubertini P., Panessa F., Malizia A., Dean A. J., Walter R., 2008, A&A, 483, 749
- de Rosa et al. (2012) de Rosa A., et al., 2012, MNRAS, 420, 2087
- Dickey & Lockman (1990) Dickey J. M., Lockman F. J., 1990, ARA&A, 28, 215
- Elvis et al. (1994) Elvis M., et al., 1994, ApJS, 95, 1
- Fabian, Celotti, & Erlund (2006) Fabian A. C., Celotti A., Erlund M. C., 2006, MNRAS, 373, L16
- Fabian, Vasudevan, & Gandhi (2008) Fabian A. C., Vasudevan R. V., Gandhi P., 2008, MNRAS, 385, L43
- Fabian et al. (2009) Fabian A. C., Vasudevan R. V., Mushotzky R. F., Winter L. M., Reynolds C. S., 2009, MNRAS, 394, L89
- Fanali et al. (2013) Fanali R., Caccianiga A., Severgnini P., Della Ceca R., Marchese E., Carrera F. J., Corral A., Mateos S., 2013, MNRAS, 433, 648
- Ferrarese & Merritt (2000) Ferrarese L., Merritt D., 2000, ApJ, 539, L9
- Ferrarese et al. (2006) Ferrarese L., et al., 2006, ApJS, 164, 334
- Fiore et al. (2003) Fiore F., et al., 2003, A&A, 409, 79
- Francis et al. (1991) Francis P. J., Hewett P. C., Foltz C. B., Chaffee F. H., Weymann R. J., Morris S. L., 1991, ApJ, 373, 465
- Graham (2007) Graham A. W., 2007, MNRAS, 379, 711
- Graham & Worley (2008) Graham A. W., Worley C. C., 2008, MNRAS, 388, 1708
- Granato et al. (2004) Granato G. L., De Zotti G., Silva L., Bressan A., Danese L., 2004, ApJ, 600, 580
- Heckman & Best (2014) Heckman T., Best P., 2014, arXiv, arXiv:1403.4620
- Heymann & Siebenmorgen (2012) Heymann F., Siebenmorgen R., 2012, ApJ, 751, 27
- Hoenig et al. (2006) Hoenig S. F., Beckert T., Ohnaka K., Weigelt G., 2006, A&A, 452, 459
- Hoenig (2013) Hoenig S. F., 2013, arXiv, arXiv:1301.1349
- Hopkins et al. (2006) Hopkins P. F., Hernquist L., Cox T. J., Di Matteo T., Robertson B., Springel V., 2006, ApJS, 163, 1
- Kawaguchi & Mori (2010) Kawaguchi T., Mori M., 2010, ApJ, 724, L183
- Kormendy & Richstone (1995) Kormendy J., Richstone D., 1995, ARA&A, 33, 581
- Kormendy & Gebhardt (2001) Kormendy J., Gebhardt K., 2001, AIPC, 586, 363
- Kormendy & Ho (2013) Kormendy J., Ho L. C., 2013, ARA&A, 51, 511
- Krolik & Begelman (1988) Krolik J. H., Begelman M. C., 1988, ApJ, 329, 702
- Krolik (1998) Krolik J. H., 1998, “Active Galactic Nuclei: From the Central Black Hole to the Galactic Environment”, Princeton: Princeton University Press
- Laor & Netzer (1989) Laor A., Netzer H., 1989, MNRAS, 238, 897
- Lapi et al. (2014) Lapi A., Raimundo S., Aversa R., Cai Z.-Y., Negrello M., Celotti A., De Zotti G., Danese L., 2014, ApJ, 782, 69
- Lonsdale et al. (2003) Lonsdale C. J., et al., 2003, PASP, 115, 897
- Lusso et al. (2011) Lusso E., et al., 2011, A&A, 534, A110
- Lynden-Bell (1969) Lynden-Bell D., 1969, Natur, 223, 690
- McLure & Dunlop (2002) McLure R. J., Dunlop J. S., 2002, MNRAS, 331, 795
- Maiolino et al. (2001) Maiolino R., Marconi A., Salvati M., Risaliti G., Severgnini P., Oliva E., La Franca F., Vanzi L., 2001, A&A, 365, 28
- Makovoz & Marleau (2005) Makovoz D., Marleau F. R., 2005, PASP, 117, 1113
- Malizia et al. (2014) Malizia A., Molina M., Bassani L., Stephen J. B., Bazzano A., Ubertini P., Bird A. J., 2014, ApJ, 782, L25
- Marchese et al. (2012) Marchese E., Della Ceca R., Caccianiga A., Severgnini P., Corral A., Fanali R., 2012, A&A, 539, A48
- Marconi & Hunt (2003) Marconi A., Hunt L. K., 2003, ApJ, 589, L21
- Mason et al. (2001) Mason K. O., et al., 2001, A&A, 365, L36
- Markowitz, Krumpe, & Nikutta (2014) Markowitz A. G., Krumpe M., Nikutta R., 2014, MNRAS, 439, 1403
- Mateos et al. (2010) Mateos S., et al., 2010, A&A, 510, A35
- Mateos et al. (2012) Mateos S., et al., 2012, MNRAS, 426, 3271
- Mateos et al. (2013) Mateos S., Alonso-Herrero A., Carrera F. J., Blain A., Severgnini P., Caccianiga A., Ruiz A., 2013, MNRAS, 434, 941
- Merloni et al. (2014) Merloni A., et al., 2014, MNRAS, 437, 3550
- Mignoli et al. (2013) Mignoli M., et al., 2013, A&A, 556, A29
- Nandra et al. (2007) Nandra K., O’Neill P. M., George I. M., Reeves J. N., 2007, MNRAS, 382, 194
- Nenkova, Ivezić, & Elitzur (2002) Nenkova M., Ivezić Ž., Elitzur M., 2002, ApJ, 570, L9
- Nenkova et al. (2008a) Nenkova M., Sirocky M. M., Ivezić Ž., Elitzur M., 2008, ApJ, 685, 147
- Nenkova et al. (2008b) Nenkova M., Sirocky M. M., Nikutta R., Ivezić Ž., Elitzur M., 2008, ApJ, 685, 160
-
Ness et al. (2010)
Ness, J.-U., (Revision editor) & ESA: XMM-Newton SOC 2010, “XMM-Newton Users Handbook”, Issue 2.8.1
http://xmm.esac.esa.int/external/xmm_user_support/
documentation/uhb/XMM_UHB.html - Park et al. (2012) Park D., et al., 2012, ApJ, 747, 30
- Pier & Krolik (1992) Pier E. A., Krolik J. H., 1992, ApJ, 401, 99
- Piconcelli et al. (2005) Piconcelli E., Jimenez-Bailón E., Guainazzi M., Schartel N., Rodríguez-Pascual P. M., Santos-Lleó M., 2005, A&A, 432, 15
- Polletta et al. (2007) Polletta M., et al., 2007, ApJ, 663, 81
- Pozzi et al. (2007) Pozzi F., et al., 2007, A&A, 468, 603
- Pozzi et al. (2010) Pozzi F., et al., 2010, A&A, 517, A11
- R Core Team (2013) R Core Team, 2013, “R: A Language and Environment for Statistical Computing”, R Foundation for Statistical Computing, Vienna, Austria; http://www.R-project.org/
- Salpeter (1964) Salpeter E. E., 1964, ApJ, 140, 796
- Schartmann et al. (2008) Schartmann M., Meisenheimer K., Camenzind M., Wolf S., Tristram K. R. W., Henning T., 2008, A&A, 482, 67
- Severgnini et al. (2006) Severgnini P., et al., 2006, A&A, 451, 859
- Shen et al. (2011) Shen Y., et al., 2011, ApJS, 194, 45
- Silva et al. (1998) Silva L., Granato G. L., Bressan A., Danese L., 1998, ApJ, 509, 103
- Spinoglio & Malkan (1989) Spinoglio L., Malkan M. A., 1989, ApJ, 342, 83
- Stalin et al. (2010) Stalin C. S., Petitjean P., Srianand R., Fox A. J., Coppolani F., Schwope A., 2010, MNRAS, 401, 294
- Strüder et al. (2001) Strüder L., et al., 2001, A&A, 365, L18
- Sun & Malkan (1989) Sun W.-H., Malkan M. A., 1989, ApJ, 346, 68
- Tacconi et al. (1994) Tacconi L. J., Genzel R., Blietz M., Cameron M., Harris A. I., Madden S., 1994, ApJ, 426, L77
- Tacconi (1996) Tacconi L. J., 1996, IAUS, 178, 489
- Trouille et al. (2009) Trouille L., Barger A. J., Cowie L. L., Yang Y., Mushotzky R. F., 2009, ApJ, 703, 2160
- Turner et al. (2001) Turner M. J. L., et al., 2001, A&A, 365, L27
- Vasudevan et al. (2010) Vasudevan R. V., Fabian A. C., Gandhi P., Winter L. M., Mushotzky R. F., 2010, MNRAS, 402, 1081
- Watson et al. (2001) Watson M. G., et al., 2001, A&A, 365, L51
- Wilms, Allen, & McCray (2000) Wilms J., Allen A., McCray R., 2000, ApJ, 542, 914
- Wright et al. (2010) Wright E. L., et al., 2010, AJ, 140, 1868
- Zakamska et al. (2006) Zakamska N. L., et al., 2006, AJ, 132, 1496
Appendix A New XMM-Newton observations
| Name | OBSID | Instr. | Filter | Start Date & Time | Stop Date & Time | Tot. Exp. Time | Net Exp. Time | Net Count Rates | |||
|---|---|---|---|---|---|---|---|---|---|---|---|
| (1) | (2) | (3) | (4) | (5) | (6) | (7) | (8) | (9) | (10) | (11) | (12) |
| MOS1 | medium | 2008/12/16 | 185540 | 2008/12/17 | 080947 | 22.88 | |||||
| XBSJ013240.1-133307 | MOS2 | medium | 2008/12/16 | 185540 | 2008/12/17 | 080952 | 25.82 | ||||
| pn | thin | 2008/12/16 | 191825 | 2008/12/17 | 081007 | 34.05 | |||||
| MOS1 | thin | 2008/11/26 | 174840 | 2008/11/27 | 002427 | 8.13 | |||||
| XBSJ113148.7+311358 | MOS2 | thin | 2008/11/26 | 174840 | 2008/11/27 | 002432 | 8.85 | ||||
| pn | thin | 2008/11/26 | 181125 | 2008/11/27 | 002447 | 13.46 | |||||
| MOS1 | thin | 2009/02/01 | 180906 | 2009/02/02 | 025953 | 7.35 | |||||
| XBSJ160645.9+081525 | MOS2 | thin | 2009/02/01 | 180906 | 2009/02/02 | 025958 | 7.10 | ||||
| pn | thin | 2009/02/01 | 183151 | 2009/02/02 | 030013 | 7.77 | |||||
Column (1): source name in the XBS sample. Column (2): OBSID of the new XMM-Newton observation. Column (3): EPIC instrument. Column (4): EPIC filter. Columns (5) and (6): observation start date and time. Columns (7) and (8): observation end date and time. Column (9): performed duration, in units of ksec. Column (10): exposure time after removing high-background intervals, in units of ksec. Column (11): count rate after removing high-background intervals, in the energy range keV, in units of counts sec-1. Column (12): signal-to-noise ratio after removing high-background intervals, in the energy range keV.
| Name | BF model | / | EW | |||||||||||||||
|---|---|---|---|---|---|---|---|---|---|---|---|---|---|---|---|---|---|---|
| (1) | (2) | (3) | (4) | (5) | (6) | (7) | (8) | (9) | (10) | (11) | ||||||||
| XBSJ013240.1-133307 | aPL+scatt+line | . | . | . | - | . | . | / | ||||||||||
| XBSJ113148.7+311358 | aPL+scatt+refl | . | . | . | . | - | - | . | / | |||||||||
| XBSJ160645.9+081525 | aPL+scatt | . | . | - | - | - | . | / | ||||||||||
Note: Fluxes and luminosities refer to the MOS calibration. Errors are quote at % confidence level.
Column (1): source name in the XBS sample.
Column (2): best-fitting model: aPL = absorbed power law; scatt = scattering component (additional unabsorbed power law
with the same photon index as the primary one); refl = neutral Compton reflection (continuum + Fe and Ni lines;
the pexmon model in XSPEC, with the same photon index as the primary power law); line = narrow Gaussian line.
Column (3): intrinsic column density; in units of .
Column (4): source photon index.
Column (5): scattering fraction, defined as the ratio of the unabsorbed and the direct power-law normalizations.
Column (6): reflection scaling factor of the pexmon component.
Column (7): line energy.
Column (8): line EW.
Column (9): observed flux (deabsorbed by our Galaxy) in the keV energy band, in units of .
Column (10): luminosity of the direct component (deabsorbed by intrinsic and Galactic ) in the keV energy band,
in units of .
Column (11): and number of degree of freedom.

A.1 Data reduction
The observations were performed with the European Photon Imaging Camera (EPIC), the OM (Mason et al., 2001) and the Reflection Grating Spectrometer (RGS); the sources are not detected with the last instrument. The three EPIC cameras (pn, MOS1, and MOS2; Strüder et al., 2001; Turner et al., 2001) were operating in full frame mode with the thin filter, except for XBSJ013240.1-133307 that was observed by the MOS cameras with the medium filter. The observation details are reported in Table 6.
The XMM-Newton data have been processed using the Science Analysis Software (SAS version 9.0) with the calibration from 2009 July; the tasks epproc and emproc were run to produce calibrated and concatenated event lists for the EPIC cameras.
EPIC event files have been filtered for high-background time intervals, following the standard method consisting in rejecting periods of high count rate at energies keV. Strong flares affect the last part of the observation of XBSJ013240.1-133307 and the whole observation of XBSJ160645.9+081525; in this case, we tried different filtering, to find a compromise between cleaning and net exposure time. After checking the consistency of the spectral results, we chose a rather relaxed filtering, that warrants the collection of a number of source counts high enough.
Events corresponding to patterns (MOS1&2) and (pn) have been used (see Ness et al., 2010). We have also generated the spectral response matrices at the sources position using the SAS tasks arfgen and rmfgen. We exclude event pile-up in the MOS and pn data. The net exposure times at the source positions, the net count rates and the signal-to-noise ratios () in the energy range keV are reported in Table 6. We tested short-time variability within each observation, generating source light curves in different energy ranges. No bin shows significant deviation from the mean value. To improve statistics, the MOS1 and MOS2 data have been combined together, and the MOS and pn spectra have been fitted simultaneously, keeping the relative normalization free.
The OM performed several observations for each source, with the -filter (Å; XBSJ013240.1-133307, for a total of ksec) and the -filter (Å; XBSJ113148.7+311358 and XBSJ160645.9+081525, for a total of and ksec, respectively) in the optical light path. All OM exposures were performed in the “Science User Defined” image mode (with a window size of ). Only XBSJ013240.1-133307 is detected in the OM images obtained running the standard data reduction (performed with the omichain routine of SAS). In the OM observing window there is no evidence of variability of the source emission in the -filter; the averaged magnitude (in the AB system) and flux density, extracted from the omichain output, are and , respectively.
A.2 X-ray spectral analysis
The MOS and pn spectra have been analysed over the energy range from to keV using standard software packages (FTOOLS version 6.9, XSPEC version 12.7.0; Arnaud, 1996). All the models discussed in the following assume Galactic absorption (see Table 1); Galactic and intrinsic absorptions have been parametrized with the (z)phabs model in XSPEC, adopting cross-sections and abundances of Wilms, Allen, & McCray (2000). When a reflection component has to be tested, we adopted the pexmon model in XSPEC (Nandra et al., 2007). pexmon is an additive component self-consistently incorporating the Compton-reflected continuum from a neutral slab combined with emission from , , , and the Compton shoulder. In this model, the reflection scaling factor is defined so that corresponds to reflection from a semi-infinite slab subtending sr to the central source of X-rays. During the fit, the inclination angle was fixed to (an average value for Seyfert galaxies). We assumed also a fixed energy cut-off, keV, since our data are not sensitive to this parameter; the adopted value of is typical for local Seyfert galaxies (e.g., Dadina, 2008; de Rosa et al., 2008, 2012; Malizia et al., 2014). Unless otherwise stated, the figures and fit parameters are in the rest-frame of the sources.
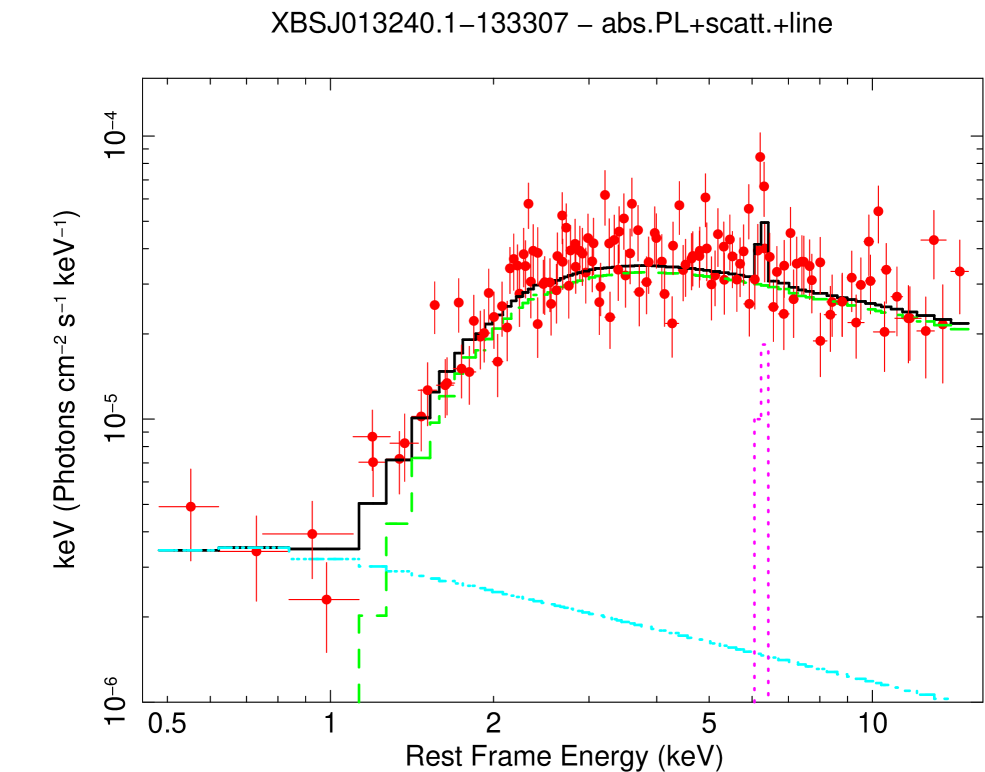
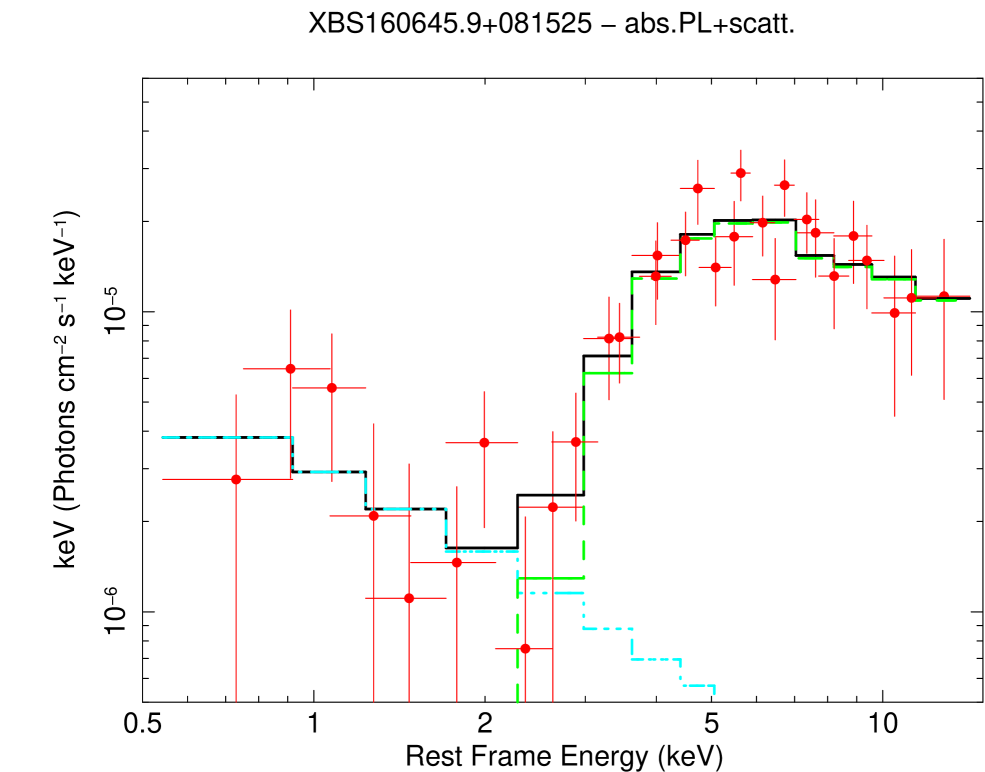
The data were grouped to ensure a minimum of net source counts per bin in the pn and MOS spectra; the use of statistics is then allowed. All uncertainties are quoted at the 90% confidence level for one parameter of interest (). The results of our analysis are reported in Table 7, while the unfolded spectra are shown in Fig. 9.
-
XBSJ013240.1-133307
Unlike the archival spectra analysed in Corral et al. (2011), the quality of the proprietary data allows us to investigate both the power-law photon index and the intrinsic absorption at the same time. Using an absorbed (Galactic intrinsic ) power-law model we obtain a flat photon index, , with an absorption (, for bins). When a scattering component (modelled with a second, unabsorbed power law, with the same as the direct one) is added to the model, the fit improves (, ), but it still results in a quite low photon index, . A narrow (eV) line is partially detected at keV [, equivalent width with respect to the observed continuum eV; ]. The best-fitting parameters for this model are reported in the first row in Table 7.A flat observed continuum could suggest the presence of a reflection component; we then investigated this possibility. A pure neutral reflection model is rejected by the data (), while assuming an absorbed power law plus a reflection component strong residuals below keV are evident. When a model composed by an intrinsic absorbed power law, a scattering component and a reflection component is fitted to the data, we obtain a photon index closer to typical values for unabsorbed AGN, (Piconcelli et al., 2005; Mateos et al., 2010; Corral et al., 2011); the column density is , while the scattering fraction is %. The magnitude of the reflection scaling factor is found to be . Although this model provides an acceptable description for the keV spectrum of XBSJ013240.1-133307 (), the statistics favours the unabsorbed power-law plus absorbed power-law plus Gaussian line model: , F-test probability %.
A joint fit of the new and old datasets, with only the normalizations of the intrinsic power laws free to change between the two observations, shows that the best-fitting model (intrinsic power law scattering component emission line) provides a satisfactory description of all the available data: , , scattering fraction (consistent within the errors) changing from % (old dataset) to % (new dataset); line energy keV and equivalent width (consistent within the errors) changing from eV (old dataset) to eV (new dataset); , for bins between and keV. The intrinsic keV luminosity slightly increase, of a factor of .
-
XBSJ113148.7+311358
The photon index required by the data when an absorbed power law is assumed, is extremely flat, [, consistent within the errors with the previous measurement; , for bins]. The addition of a scattering component does not change significantly the resulting value of the photon index ().As in the previous case, we tested the data for the presence of a reflection component. A pure neutral reflection model can reproduce the observed spectra assuming a steep intrinsic continuum, between and (the upper limit of the range allowed in pexmon for the photon index), although the fit is poor (). The fit improves when both the reflection component and the intrinsic, absorbed power law are included in the model (, F-test probability % with respect to the pure reflection model). The addition of a scattering component, with an intensity of % of the intrinsic emission, is significant at % (). The final spectral parameters are , ; the reflection component contributes significantly to the observed emission, with the reflection factor (see Table 7, second row).
A joint fit of the new and old datasets, with only the normalisations of the intrinsic power laws free to change between the two states, shows that this model provides a satisfactory description of all the available data: , , ( for bins). Although the values are marginally consistent within the errors, our analysis suggests a decrease of a factor of in the intrinsic keV luminosity.
-
XBSJ160645.9+081525
The best-fitting model reported by Corral et al. (2011) can reproduce the new data above keV (i.e., in the energy range where the source is detected in the old spectra); the best-fitting values for the photon index and the column density are consistent within the (large) errors with the previous values: and (, for bins). However, strong residuals are clearly visible below keV, suggesting that a more complex model must be tested. With the addition of an unabsorbed power law, the observed residuals are completely accounted for (, for bins between and keV). Although this scattering component is weak (scattering fraction %), its inclusion is statistically significant (, F-test probability %; see Table 7, third row).A joint fit of the new and old datasets, with only the normalisations of the intrinsic power laws free to change between the two states, shows that this model provides a satisfactory description of all the available data: , , scattering fraction % for both datasets (, for bins). Although the values are consistent within the errors, our analysis suggests a decrease of a factor of two in the intrinsic keV luminosity.
Appendix B Notes on individual objects
-
XBSJ000100.2-250501
The optical spectrum is characterized by broad emission lines (km/s), typical of type 1 AGN. By using only a type 1 QSO template to recover the SED, we are not able to simultaneously reproduce the optical and IR photometric points. The addition of an early-type component is needed to take into account the WISE data at lower wavelengths. Nevertheless, due to the scarcity of photometric points available for this source, the normalization of the host galaxy component remains poorly constrained. -
XBSJ013240.1-133307
The optical spectrum is characterized by a galaxy continuum with a reduced Ca break, suggesting the presence of a non-negligible contribution of the nuclear radiation in the bluer part of the spectrum. These spectral characteristics strongly constrain the level of dust absorption to be used in the SED modelling, between and mag. For this low amount of absorption both the Galactic and the Galactic Centre extinctions curves produce a very similar shape above m, while below this wavelength they have different behaviour. The SDSS, GALEX, and OM data seem to prefer the Galactic extinction curve, although also the Galactic Centre curve gives a reasonable reproduction of the SED. -
XBSJ021642.3-043553
This is the high-redshift Extremely Red Object discussed in details by Severgnini et al. (2006). Its optical spectrum, characterized by narrow emission lines plus a host galaxy continuum, strongly suggests a nuclear absorption larger than mag to be applied to our SED modelling. As for the -band flux, as noted by Severgnini et al. (2006), two possible weak near-IR objects are visible in this band within the same distance from the X-ray position, separated by and with a similar magnitude. The two sources cannot be resolved either by Spitzer or by WISE; to take into account the contamination due to the second source, expected at least at the lowest wavelengths, we associated with the observed fluxes a larger error than the quoted one (%). -
XBSJ022707.7-050819
Although the IR SED data can be well modelled both by a nuclear dust extinction of mag plus an early-type galaxy or by an mag plus a late-type host, the optical spectrum is better reproduced by the former combination of template and . As for the extinction curve, the spectral shape described by the Spitzer and WISE data is inconsistent with the deep absorption features observed when the extinction curve of the Galactic Centre is assumed. Therefore, we assumed as reference modelling the one with lowest ; the ranges of physical parameters have been evaluated by considering all the best modelling obtained with the three nuclear templates quoted in the text with only the Galactic curve applied.Finally, we note that in the optical image we can see several objects near the QSO. We therefore cannot exclude a contamination at some level of the IR fluxes.
-
XBSJ050536.6-290050
In the Spitzer images at and m, a second source is detected at a distance of ; however, in the image at m this source disappears. Therefore, we do not expect a contamination from this source in the WISE upper limit at m (that has the largest PSF, ; Wright et al., 2010). Moreover, the profile-fitting method adopted to recover the WISE magnitudes assumed here strongly reduces the level of contamination expected. With this method, carried out using the data from all bands simultaneously, the higher resolution data at the shorter wavelengths can guide the extraction at the longer wavelengths.The optical spectrum requires a dust obscuration of mag, while the Ca break is typical of a late-type galaxy.
-
XBSJ051413.5+794345
The morphological type of the host is strongly driven by the Ca break observed in the optical spectrum, suggesting an elliptical or an early spiral. The spectrum provides only a lower limit to the dust extinction, mag. -
XBSJ052128.9-253032
This is the source with the poorest photometric coverage: only an -band magnitude and two detections at m and m by WISE. At longer wavelength, the WISE catalogue does not provide any flux, even a limit. We therefore estimated upper limits to the fluxes at m and m using the weakest source detected in the field.The host galaxy morphology is well constrained by the Ca break measured from the optical spectrum. Concerning the nuclear emission, we cannot constrain at the same time both its intensity and the absorption; as said in the text, the quoted physical parameters are limits, in the sense detailed below. In modelling the SED, we first fixed the dust extinction to the lower limit obtained from the optical spectrum, mag. An estimate of the way in which a different optical obscuration affects our determination of the physical parameters has been obtained by increasing up to the value expected from the column density derived from the X-ray data (when a Galactic dust-to-gas ratio is assumed, mag/cm-2; Bohlin, Savage, & Drake, 1978) and performing again the SED modelling.
The point-like appearance of the source in the WISE images at and m (dominated in our modelling by the host), is consistent with the WISE resolution being not good enough to resolve the galaxy at a redshift of (where corresponds to about kpc with the cosmology adopted here). The result of our modelling is in agreement with the elusive nature of this QSO; in particular, taking into account the observed X-ray luminosity, the expected is too low to be detected out from the host galaxy light.
-
XBSJ080411.3+650906
For this source, both the morphological type and the intensity of the host galaxy is well constrained by the availability of the SDSS data and by the measurement of the Ca break obtained by the optical spectrum. Concerning the nuclear emission, the quality of the mid-IR coverage does not allow us to constrain at the same time both its intensity and the absorption; as done for XBSJ052128.9-253032, in the text we quote limits to the physical parameters. A first SED modelling has been done with the dust extinction fixed to the lower limit obtained from the optical spectrum, mag. To investigate the effects of a different optical obscuration on our determination of the physical parameters, we increased up to the value expected for a Galactic dust-to-gas ratio (mag/cm-2; Bohlin, Savage, & Drake, 1978), assuming the derived from the X-ray data; then we performed again the SED modelling.Again, taking into account the WISE resolution, not good enough to resolve the galaxy at (where corresponds to about kpc with the cosmology adopted here), we expect a point-like appearance of the source in the WISE images also in the bands dominated in our modelling by the host ( and m).
The result of our modelling is in agreement with the elusive nature of this QSO.
-
XBSJ113148.7+311358
A second source is clearly detected in the optical at a distance of ; although it is still present in the Spitzer images at low wavelength, in the image at m it disappears. Therefore, we do not expect a contamination due to this source either in the WISE upper limit at m (that has the largest PSF, ; Wright et al., 2010) or in the Spitzer flux at m (that we recovered from IRSA888The NASA/IPAC Infrared Science Archive, http://irsa.ipac.caltech.edu/cgi-bin/Gator/nph-scan?submit=Select&projshort=SPITZER.). Moreover, the profile-fitting method adopted to recover the WISE magnitudes assumed here strongly reduces the level of contamination expected. With this method, carried out using the data from all bands simultaneously, the higher resolution data at the shorter wavelengths can guide the extraction at the longer wavelengths.The optical spectrum suggests a high absorption, mag, and a late-type host galaxy. The absorption feature due to silicates present in the Galactic Centre extinction curve is in better agreement with the m upper limit than the shape obtained by applying the Galactic curve, although both curves provide an acceptable representation of the SED.
-
XBSJ122656.5+013126
The optical spectrum is characterized by a galaxy continuum with a strongly reduced Ca break, suggesting the presence of a significant contribution of the nuclear radiation in the bluer part of the spectrum. For the low amount of absorption implied by the optical spectrum, mag, both the Galactic and the Galactic Centre extinctions curves produce a very similar shape above m, while below this wavelength they have different behaviour. The GALEX data in the near-UV and far-UV allowed us to prefer the Galactic extinction curve; therefore, the ranges for the physical parameters have been evaluated by considering only the three best modelling with the three nuclear templates with only this extinction curve applied. -
XBSJ134656.7+580315
The Ca break observed in the optical spectrum suggests an elliptical or an early spiral host galaxy. The spectrum provides only a lower limit to the dust extinction, mag.The spectral shape described by the Spitzer and WISE data can not be reproduced if the Galactic extinction curve is assumed; therefore, the ranges for the physical parameters have been evaluated by considering only the three best modelling with the three nuclear templates with only the curve of the Galactic Centre applied.
-
XBSJ144021.0+642144
The optical spectrum of this source is characterized by broad emission lines (km/s), typical of type 1 AGN, and the amount of intrinsic absorption is constrained to be low, . By using only a type 1 QSO template to recover the SED, we are not able to simultaneously reproduce the optical and IR photometric points. The addition of an early-type component is needed to well reproduce the data between and m. -
XBSJ160645.9+081525
In the optical domain, both the spectrum and the photometric points strongly constrain the host to be an early-type galaxy. The spectrum provides only a lower limit to the dust extinction , mag. At wavelength longer than m (rest frame), the SED is better reproduced when a shape like that of the deep due to the absorption from silicates is assumed. We note that the feature obtained when the former is applied with the high required by the modelling is probably too deep to be realistic. However, the exact shape of this feature does not affect our estimate of the physical parameters. -
XBSJ204043.4-004548
The Spitzer images reveal the presence of a source at less than from this object. While the emission of the two objects can be resolved in the Spitzer/MIPS data at m, due to the larger PSF (; Wright et al., 2010) the flux measured by WISE at m is probably contaminated by the second source. According to the WISE catalogue, no deblending has been applied999Number of PSF components used simultaneously in the profile-fitting for the source, including the source itself, ; active deblending flag, indicating if a single detection was split into multiple sources in the process of profile-fitting, , i.e. the source is not actively deblended; see http://wise2.ipac.caltech.edu/docs/release/allsky/expsup/sec2_2a.html.. To estimate a correction factor for from the Spitzer image at m, we compared (i) the aperture-corrected fluxes from Spitzer (radius of ) with and without deblending applied (to estimate how the second object affects the observed emission); and (ii) the aperture-corrected fluxes from Spitzer and WISE (radius of ), both not corrected for blending (to take into account the different background of the two cameras). The corrected flux is marked as an asterisk in the SED of XBSJ204043.4-004548 in Fig. 2 (bottom panel).Concerning the SED modelling, the small decrease in the flux implied by the WISE data at m, followed by a new increase at longer wavelength, suggesting the presence of a deep due to the presence of silicates, seems to prefer the extinction curve of the centre of the Galaxy. However, both the tested curves provide an acceptable modelling of the SED.
| Spitzer | WISE | ||||||||||||||||||||
|---|---|---|---|---|---|---|---|---|---|---|---|---|---|---|---|---|---|---|---|---|---|
| Name | Note | ||||||||||||||||||||
| (1) | (2) | (3) | (4) | (5) | (6) | (7) | (8) | (9) | (10) | (11) | (12) | ||||||||||
| XBSJ000100.2-250501 | |||||||||||||||||||||
| XBSJ013240.1-133307 | own obs | ||||||||||||||||||||
| XBSJ021642.3-043553 | SWIRE | ||||||||||||||||||||
| XBSJ022707.7-050819 | SWIRE | ||||||||||||||||||||
| XBSJ050536.6-290050 | own obs | ||||||||||||||||||||
| XBSJ051413.5+794345 | |||||||||||||||||||||
| XBSJ052128.9-253032 | |||||||||||||||||||||
| XBSJ080411.3+650906 | |||||||||||||||||||||
| XBSJ113148.7+311358 | own obs | ||||||||||||||||||||
| XBSJ122656.5+013126 | archive | ||||||||||||||||||||
| XBSJ134656.7+580315 | own obs | ||||||||||||||||||||
| XBSJ144021.0+642144 | archive | ||||||||||||||||||||
| XBSJ160645.9+081525 | own obs | ||||||||||||||||||||
| XBSJ204043.4-004548 | own obs | ||||||||||||||||||||
Column (1): source name in the XBS sample. Columns (2)-(7): Spitzer imaging photometric fluxes in Jy, not corrected for Galactic extinction. Column (8): notes to the Spitzer data. Columns (9)-(12): WISE fluxes in Jy, not corrected for Galactic extinction.
| GALEX | SDSS | ||||||||||
| Name | FUV | NUV | OM | Other UV | Note | ||||||
| (1) | (2) | (3) | (4) | (5) | (6) | (7) | (8) | (9) | (10) | (11) | (12) |
| XBSJ000100.2-250501 | (2) | ||||||||||
| XBSJ013240.1-133307 | (A,a,1) | ||||||||||
| XBSJ021642.3-043553 | (3) | ||||||||||
| XBSJ022707.7-050819 | (b,3) | ||||||||||
| XBSJ050536.6-290050 | (3) | ||||||||||
| XBSJ051413.5+794345 | - | ||||||||||
| XBSJ052128.9-253032 | (3) | ||||||||||
| XBSJ080411.3+650906 | - | ||||||||||
| XBSJ113148.7+311358 | - | ||||||||||
| XBSJ122656.5+013126 | (B) | ||||||||||
| XBSJ134656.7+580315 | - | ||||||||||
| XBSJ144021.0+642144 | - | ||||||||||
| XBSJ160645.9+081525 | (3) | ||||||||||
| XBSJ204043.4-004548 | (3) | ||||||||||
Column (1): source name in the XBS sample. Columns (2)-(3): GALEX fluxes at Å (FUV) and Å (NUV) corrected for Galactic absorption, in units of . Column (4): OM AB magnitudes, corrected for Galactic extinction; for details, see column (13). Column (5): UV magnitudes found in the literature, corrected for Galactic extinction; for details, see column (13). Columns (6)-(10): SDSS DR7 magnitudes in the (Å), (Å), (Å), (Å), and (Å) filters, corrected for Galactic extinction. Column (11): -band magnitudes found in literature, corrected for Galactic extinction; for details, see column (13). Column (12): notes to the OM, UV and optical data in cols. (4), (5) and (11): (A)= filter (Å); (B)= filter (Å); (a)=DSS magnitude Å; (b)=-band magnitude Å (Stalin et al., 2010); (1)=DSS Å (Caccianiga et al., 2008); (2)=Cousin Å (Fiore et al., 2003); (3)=Cousin Å (Caccianiga et al., 2008).