Structure and gap of low- (Ga1-xInx)2O3 alloys
Abstract
We study the electronic and local structural properties of pure and In-substituted -Ga2O3 using density functional theory (DFT). Our main result is that the structural energetics of In in Ga2O3 causes most sites to be essentially inaccessible to In substitution, thus reducing the maximum In content in thi to somewhere between 12 and 25 % in this phase. We also find that the gap variation with doping is essentially due to “chemical pressure”, i.e. volume variations with doping.
1 Introduction
Ga2O3 is attracting interest recently as a material for high-power transport and ultraviolet optical absorbers, owing to its wider band gap and larger electric breakdown voltage compared to e.g. GaN. Combined with In2O3 (already widely used as transparent conducting oxide), Ga2O3 originates a new materials system which is tunably insulating, easily -doped (not so easily -doped), and potentially magnetic (as In2O3 can be made ferromagnetic [1] through magnetic doping, the same may well apply to Ga2O3). Further, the band-engineering and nanostructuration concepts from popular semiconductor systems such as, e.g., AlGaAs or InGaN may be exported to these materials, and thus to a whole new region of high absorption energies and breakdown voltages. This may enable the design of devices based on Ga2O3/(Ga1-xInx)2O3 such as high-power field effect transistors and far-UV photodetectors or emitters.
2 Ga2O3
Gallium oxide, Ga2O3, exists in various polymorphs, the most stable being monoclinic -Ga2O3 at ambient condition [2]. The monoclinic phase, shown in Figure 1, belongs to the C2/m space group. The unit cell contains 20 atoms, with two crystallographically nonequivalent Ga atoms in tetrahedral and octahedral like coordinations in the lattice. Geometry and volume optimizations as well as electronic structure calculations have been done using density functional theory (DFT) in the generalized gradient approximation (GGA), and the PAW method as implemented in the VASP code [4]. The bulk Brillouin zone is sampled on a 486 Monkhorst-Pack grid. The calculated lattice parameters compare well with experiment [3] (in parenthesis): =12.46 Å (12.23), =3.08 Å (3.04), =5.88 Å (5.80), =103.65∘ (103.7).
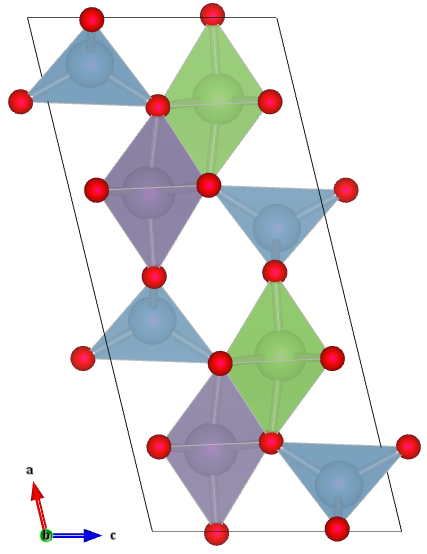
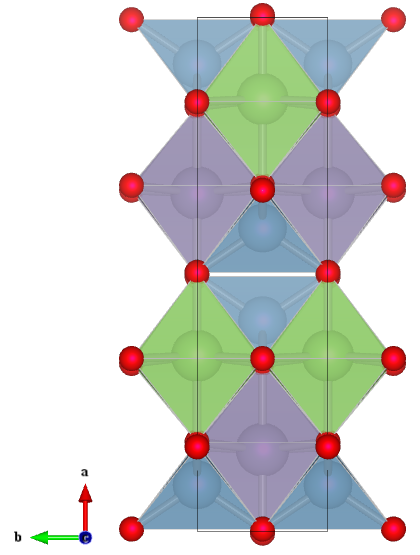
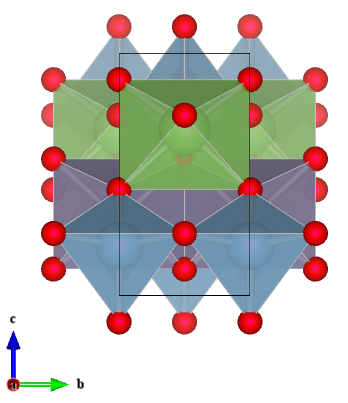
The band structure of Ga2O3, similarly to other binary Ga compounds, has mainly O 2 character in the upper valence band and Ga content in the bottom conduction band. The direct gap appears at the point. GGA underestimates it at about 2 eV, as expected of semilocal functionals. Adding an empirical self-energy correction [5] involving the high-frequency dielectric constant, we obtain a gap of 4.2 eV, not far from the experimental range of 4.5-5 eV.
Surprisingly, the precise value of the gap is still uncertain even in recent work [6]. The reason for this is probably the significant anisotropy of the absorption, which we have analyzed, and will report elsewhere [7], with hybrid functionals and pseudo self-interaction corrections (known to be free of the typical LDA/GGA gap errors). For the present purposes, we just note that these advanced methods confirm that a direct minimum gap at zone center between 4.2 eV (hybrids) and 4.7 eV (self-interaction-correction), and also confirm the pressure derivative of the gap to be 3 meV/kbar essentially as in GGA (see below).
3 Low-In-content alloying
Because unalloyed In and Ga oxides have different structures (bixbyite and monoclinic , respectively) the high-In and low-In-content alloying limits will behave quite differently, and at intermediate concentrations the two phases are likely to mix in an complicated way. The experimental alloying of Ga2O3 with In2O3 indeed faces significant limitations [6], with -Ga2O3-like and bixbyite-like X-ray spectra at low and high respectively, and a mixed-phase region at midrange . In particular the -Ga2O3-like phase persists only up to about 15% or so [6]. Thus, keeping in mind that the large- end of the alloying spectrum will have to be treated differently, here we tackle the low- end substituting In for Ga in -Ga2O3 at nominal concentrations of 3, 6, 9, and 12 % (one to four In atoms per 80-atom or 32-cation supercell). Our results naturally suggest an interpretation for the observed behavior.
We optimize (in volume, shape, and internal coordinates) supercells of Ga2O3 with InGa substitutions sampling some of the various possible octahedral and tetrahedral sites and combinations thereof as function of composition (i.e. In concentration); we use a 242 k-point grid. The calculations at 3% In (one ”isolated” In atom per 80-atom cell) show that In only substitutes octahedral Ga: tetrahedral sites are ruled out by a huge excess energy cost of 1.1 eV. Therefore, half the cation sites are essentially inaccessible to In, and hence the amount of In that can actually be incorporated into Ga oxide is automatically halved – to put it differently, all available sites would be occupied already at 50% nominal In content.

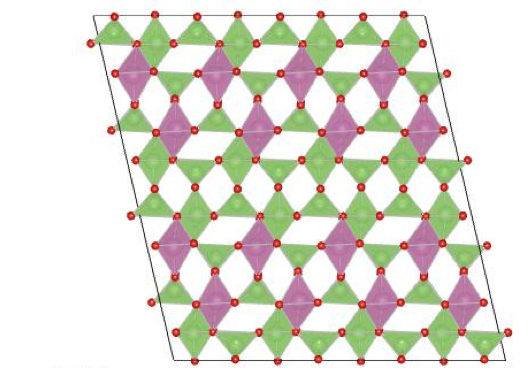
Even reaching this limit, though, is quite unlikely. Indeed, In incorporation is not arbitrary in terms of configuration. At 6% In content, i.e two In atoms per supercell, one can estimate the energetics of pairing (or, rather, non-pairing) of In in Ga2O3. In Figure 2, left, we display the preferential couplings. The energy of configuration ’0’ is chosen as zero; the structures numbered ’1’ to ’4’ are in progressively unfavorable energetic order, with ’1’ at 16 meV, ’2’ at 50 meV, ’3’ at 100 meV, ’4’ at 125 meV. In the configuration labeled ’*’, In atoms occupy adjacent octahedra; this structure is 250 meV higher than the reference.
Clearly, In atoms tend to avoid one another, and it is likely that at the common growth temperatures of 850 K the typical configurations will be such as our ’0’ and ’1’ above. Inspecting the structure, this suggests that well below a half, and probably closer to a quarter, of the octahedral sites can be occupied by In with a reasonable energy cost; when these are filled, the formation of some mixed /bixbyite phase may be preferable to substitution in the phase. This brings the effective solubility in the original -Ga2O3 structure down to between 12% and 25% as found in experiment [6].
Consistently with the above configurational restrictions on pairing, the admissible arrangements at 9% and especially 12% In content are few. For example, the structure used at 12% is in Figure 2, right. The resulting structures are probably a fairly decent model of the alloy, given the very limited configurational freedom of In already at these concentrations. (Cluster-expansion work is ongoing on miscibility at finite temperature and will be reported elsewhere.)
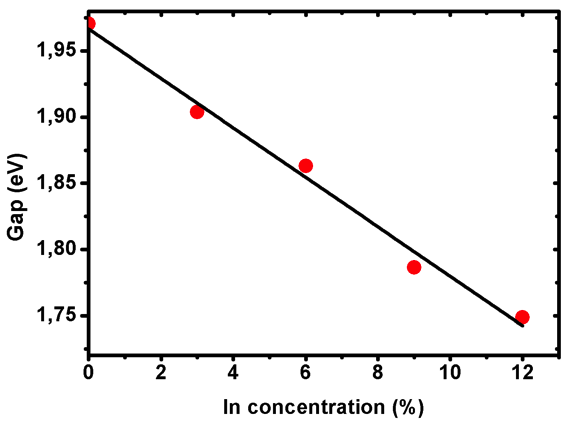
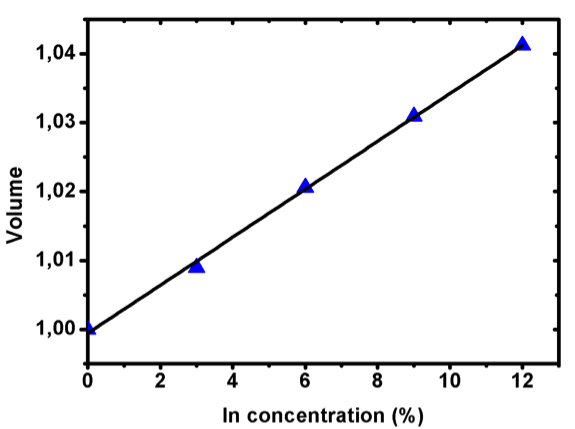
We calculated the gap and the volume change with concentration of (Ga1-xInx)2O3 in the 80-atom supercell for the structures mentioned. The gap is in Figure 3, left, and the volume is in the same Figure, right. Although the gap is underestimated (a token of using GGA), its concentration change of 17 meV/ is quite similar to 20 meV/% experimentally [6]. Using the the volume change with and the bulk modulus, we can evaluate the concentration derivative as a pressure derivative, obtaining 2.5 meV/kbar. This is similar to the Ga2O3 value of 3 meV/kbar [7, 8], which suggests that the gap is mainly affected by volume change, and marginally by other factors. In this light, the agreement with experiment therefore falls in line with expectations from previous work [9].
4 Conclusions
In summary, we have performed first-principles calculations on the electronic and local structural properties of In-containing Ga2O3. The energetics of In in Ga2O3 limits the maximum In content to somewhere between 12 and 25 %. We also find that the gap variation with doping is essentially due to “chemical pressure”, i.e. volume variations with doping.
M.B.M. gratefully acknowledges Sardinia Regional Government for the financial support of her PhD scholarship (P.O.R. Sardegna F.S.E. Operational Programme of the Autonomous Region of Sardinia, European Social Fund 2007-2013 - Axis IV Human Resources, Objective l.3, Line of Activity l.3.1). This work was also supported in part by MIUR-PRIN 2010 project Oxide, Fondazione Banco di Sardegna and CINECA grants.
References
References
- [1] Alippi P, Cesaria M, and Fiorentini V 2014 Phys. Rev. B 89 134423.
- [2] Edwards D F 1998 Handbook of Optical Constants of Solids Academic Press, III 753
- [3] Geller S 1960 J. Chem. Phys. 33 676
- [4] Kresse G and Furthmuller J 1996 Phys. Rev. B 54 11169
- [5] Fiorentini V and Baldereschi A 1992 J. Phys.: Condens. Matter 4 5967
- [6] Zhang F et al 2014 Solid State Comm. 186 28
- [7] Ricci F et al 2014, to be published.
- [8] He H et al 2006 Phys. Rev. B 74 195123.
- [9] Fiorentini V 1992 Phys. Rev. B 46 2086