GALFIT-CORSAIR: implementing the core-Sérsic model into GALFIT
Abstract
We introduce Galfit-Corsair: a publicly available, fully retro-compatible modification of the 2D fitting software Galfit (v.3) which adds an implementation of the core-Sérsic model.
We demonstrate the software by fitting the images of NGC 5557 and NGC 5813, which have been previously identified as core-Sérsic galaxies by their 1D radial light profiles. These two examples are representative of different dust obscuration conditions, and of bulge/disk decomposition. To perform the analysis, we obtained deep Hubble Legacy Archive (HLA) mosaics in the F555W filter (-band). We successfully reproduce the results of the previous 1D analysis, modulo the intrinsic differences between the 1D and the 2D fitting procedures.
The code and the analysis procedure described here have been developed for the first coherent 2D analysis of a sample of core-Sérsic galaxies, which will be presented in a forth-coming paper. As the 2D analysis provides better constraining on multi-component fitting, and is fully seeing-corrected, it will yield complementary constraints on the missing mass in depleted galaxy cores.
1 Introduction
1.1 Core-Sérsic galaxies
The presence of cores in luminous early type galaxies, and their correlation with the global galaxy properties, has been known since the early ground-based studies (e.g. King & Minkowski, 1966, 1972; King, 1978; Young et al., 1978; Duncan & Wheeler, 1980; Begelman et al., 1980; Kormendy, 1985; Lauer, 1985, and references therein). Through the advent of the high resolution offered by HST it was possible to characterize the radial profiles of cores. In particular, it was observed that cores could be approximated by a power law (e.g. Lauer et al., 1991; Crane et al., 1993; Ferrarese et al., 1994; Kormendy et al., 1994; Forbes et al., 1995).
In the same framework, it was also observed that elliptical galaxies and bulges of disk galaxies (hereafter, commonly labelled as “spheroids”) present a dichotomy in the distribution of the power-law index (e.g. Jaffe et al., 1994; Ferrarese et al., 1994). According to this bimodality, galaxies were classified into two sharp categories: “core” ( 0.3) galaxies, and “power-law” ( 0.5) galaxies, although later studies suggested the existence of intermediate objects (e.g. Ravindranath et al., 2001; Rest et al., 2001, see also Figure 8 from Graham & Guzmán 2003).
In order to coherently connect the core/power-law region to the overall shape of the galaxy profile, Kormendy et al. (1994), Grillmair et al. (1994), and Lauer et al. (1995) introduced the “Nuker law” (also know as “Nuker model”). Similarly to the double power-law model of Ferrarese et al. (1994), the Nuker law is composed of two connected power laws, with the difference that the “smoothness” of the transition is regulated by an additional parameter (). This 5-parameter model has the same functional form as the double power-law density model of Hernquist (1990, his Equation 43), but it is applied to the projected surface brightness rather than to the internal density profile. The Nuker model soon became the reference tool for the study of the cores of early type galaxies.
Later studies, however, demonstrated that the Nuker model, and hence the relevant classification scheme, are critically affected by the observational and fit conditions. For example, Faber et al. (1997) and Rest et al. (2001) showed that a “core” galaxy can be misclassified as “power-law” if the break radius is below the resolution limit, or if the transition is so smooth that the index is overestimated because of poor sampling of the innermost radii. In addition, Graham et al. (2003) showed that a Nuker fit is highly dependent on the radial extent of the fit.
In order to overcome these limitations, Graham et al. (2003) and Trujillo et al. (2004) introduced the “core-Sérsic” model, which represents a smooth connection between a Sérsic (1963) component (descriptive of the outer spheroid profile), and a single power-law component (descriptive of the core). These authors showed that the spheroids of the “core” and “power-law galaxies” could have their full radial extent fit simply by a core-Sérsic and a Sérsic model, respectively.
Cores are believed to be created by the scouring action of a binary supermassive black hole (SMBH) system produced in “dry” major merging events, which ejects stars via a three-body interaction. This hypothesis was first formulated by Begelman et al. (1980), and its plausibility was later confirmed by numerical simulations (e.g. Ebisuzaki et al., 1991; Merritt, 2006). In this sense, a core-Sérsic galaxy is simply a Sérsic galaxy with a depleted core.
In the last decade, the sample of know core-Sérsic galaxies (identified by their 1D radial light profile) has been constantly expanded by a collection of studies focused on a critical review of the structure of early type galaxies (e.g. Trujillo et al., 2004; Ferrarese et al., 2006), and/or aimed to the study of the relations between SMBHs and their host galaxies (e.g. Richings et al., 2011; Dullo & Graham, 2012, 2013a, 2013b). In addition to these samples, possible core-Sérsic candidate galaxies may be “hidden” in the sample by Lauer et al. (2007), who gathered information from diverse studies which used the Nuker law to characterize the inner light profiles of galaxies.
1.2 2D modeling of core-Sérsic galaxies
As mentioned above, coherent studies of core-Sérsic galaxies have been based solely on 1D radial light profiles. The 1D fitting procedures have the remarkable advantage of being able to work in poor conditions. For example, in the isophote fitting method (Jedrzejewski, 1987) - which is arguably the most widely used - higher is provided because each point on the radial profile is calculated as azimuthally-averaged surface brightness along a curve. On the other hand, in 1D methods the definition of “radial” profile itself can be ambiguous. In isophote fitting, isophotes at different galactocentric radii can have different ellipticities and position angles, so that the radial intensity profile is actually extracted along the curved path defined by the apocenters of the ellipses. In major/minor axis fitting, the presence of multiple galaxy components with intrinsically different orientations make the definition of “major” or “minor” axis arbitrary; moreover, the true major axis could be along the line of sight. An additive limitation is that 1D models are intrinsically assumed to be axisymmetric.
On the other hand, 2D models with fixed ellipticity and position angle cannot accommodate such changes, whereas isophote fitting does so naturally. However, given the often very different ellipticity and position angle of bulges and disks, fitting in 2D can help disentangling those components in the projected galaxy image, hence releasing part of the degeneracy in the parameters. These issues and the advantages of 2D fitting have been discussed extensively in the literature (see e.g. Ravindranath et al., 2001; de Souza et al., 2004, and references therein).
There exists a number of public softwares performing multi-component 2D fit of galaxies, offering a variety of features (e.g. analytic models), and tuned to tackle different objects or galaxy characteristics (e.g. distant/nearby galaxies, symmetric/asymmetric features, etc.), such as Gim2D (Simard, 1998), Budda (de Souza et al., 2004), Budda v.2 (Gadotti, 2008), and Galfit (Peng et al., 2010).
In particular, Gim2D and Galfit are arguably the codes which have received the biggest attention from the astronomical community, and have undergone the most extensive testing. In their review, Häussler et al. (2007) discuss the treatment of the uncertainties in the two codes, and their robustness in crowded-field environments, and conclude that Galfit has an advantage in terms of dealing with contaminating objects (which can be fit independently), although both codes are found to underestimate true uncertainties.
More than the other available codes, Galfit was updated along the years to include new features: the latest update of the software (v3111\seqsplithttp://users.obs.carnegiescience.edu/peng/work/galfit/galfit.html ; 2010) implemented the possibility of fitting complex and asymmetric galaxy features such as spiral arms, rings, bars, etc. via Fourier modification of standard models (exponential disk, Sérsic, etc.) or coordinates rotations along the radial direction. Recently, a plethora of codes based on Galfit were developed in order to automatize the source detection and fit (e.g. Galapagos; Barden et al., 2012), or to expand its capabilities (e.g. GalfitM222 http://nottingham.ac.uk/astronomy/megamorph/ allows simultaneous multi-band fitting); Galfit also represents the basic ingredient for some software suites designed for the decomposition of galaxy images, such as MegaMorph333 http://nottingham.ac.uk/astronomy/megamorph/ .
With Galfit-Corsair, we expanded further the potential of Galfit v.3 by including the core-Sérsic profile, which was not present among its native models.
To our knowledge, there is no other 2D fitting code which is natively able to fit a core-Sérsic profile, except for Imfit444 http://mpe.mpg.de/~erwin/code/imfit/ (Erwin 2014; in preparation), which we recently learnt has simultaneously been under development. Comparing the performance of the two codes is beyond the scope of this article.
In the following, we introduce our implementation of the core-Sérsic model into Galfit, and we describe its potential and limitations. In a forth-coming paper (Bonfini et al. 2014, in preparation), we will present a study of a large sample of core-Sérsic galaxies based on this software. This article is structured as follows. In §2 we briefly present how Galfit works, and we give the definition of the core-Sérsic model, along with the basic instructions for its usage. In §3 we show a practical application of the software to the HST data of two core-Sérsic galaxies: NGC 5557 and NGC 5813. We evaluate the reliability of the results, and we report some troubleshooting to assist the reader interested in using our model. Our conclusions are summarized in §4. We also provide an appendix focused on the details of the examined galaxies (Appendix A), and finally an appendix summarizing the instructions on how to use our code (Appendix B)
2 Implementation of the core-Sérsic model in GALFIT
Galfit is a 2D-fitting software coded in c and based on the Levenberg-Marquardt method (e.g. Bevington & Robinson, 2003) for the minimization of the , which is defined in the classical way, i.e.:
| (1) |
where is the value of the (,) pixel of the input image, is the value of the corresponding pixel in the PSF-convolved model image generated at each iteration, and refer to the pixels in the images, and is the “sigma” image. The sigma image is used to weight the discrepancy of the model to the data, given the statistical error of the observed counts at each pixel position.
In order to determine in which direction to look for the next iteration parameter set, the Levenberg-Marquardt method requires knowledge of the local curvature of the space, which is given by the Jacobian (or “convolution”) matrix (i.e., the matrix of the partial derivatives of the model with respect to its parameters). When the global minimum is found, the parameter uncertainties are obtained from the final convolution matrix, and represent the 1- errors under the assumption that the data probability distribution function is Gaussian, and that the space around the minimum has a parabolic shape.
In order to include the core-Sérsic profile in Galfit, we had to code the model and its partial derivatives. The model surface brightness profile is defined as555 Notice that in this formulation we have chosen a specific meaning for : see discussion in the text :
| (2) |
where:
| (3) |
The model represents a smooth connection between a Sérsic component (descriptive of the overall spheroid profile), and a power-law component (descriptive of the “core”), separated at a characteristic break radius . The transition is modulated by the parameter , which determines the sharpness of the changeover. It is trivial to show that far from , the second term of Equation 2 represents a power-law component with slope -, while the third term represents the classic Sérsic component. The normalization factor represents the surface brightness at the break radius. In this formulation of the core-Sérsic profile, the other parameters retain the meaning they have in the classic definition of the Sérsic model. In particular, is the normalization factor which lets the parameter assume the role of the effective radius (half-light radius) of the Sérsic part of the model, and is defined by the equation:
| (4) |
where and represent here the complete and incomplete gamma functions, respectively (e.g. Graham & Driver, 2005, and references therein). An approximated expression for was provided by Capaccioli (1989) for the range 0.5 10, in the form:
| (5) |
For the sake of completeness, we notice that the couple (,) can be replaced - without changing the functional shape - with the couple (,), with now being the half-light radius of the whole model, and defined accordingly (see Trujillo et al., 2004, Appendix A). Though, we chose to implement the definition implied by Equation 4, because it readily allows for a comparison against a Sérsic fit. The two effective radii are anyway very close, as the amount of “missing light” is typically less than 1% (e.g. Graham, 2004; Ferrarese et al., 2006; Côté et al., 2007; Dullo & Graham, 2013b). In our definition of the model, is calculated according to Equation 5 for 5, and through a numerical evaluation of Equation 4 otherwise; this is consistent with what happens for the existing Sérsic model in Galfit.
In practice, for values of larger than 10, the transition is already almost indistinguishable from a discontinuity, therefore we could restrict the code from sampling an unnecessary large parameter range. Moreover, the analytical form of the model and of its derivatives contains several powers of , and it is expected that the code may encounter numerical problems if was to became too large. For this reasons, we decided to set a hard constraint on the upper limit of that parameter, so that is limited in Galfit-Corsair as: 0 20. The upper limit was selected after extensive testing, in which we observed that if at any iteration was going past 20, then the fit would inevitably end up diverging. See §3.4 for further troubleshooting related to this parameter. Similarly, the power-law slope has been limited to a physically viable lower limit of -0.2. The choice of the aforementioned constraints have been chosen based on the available data for confirmed core-Sérsic galaxies (Dullo & Graham, 2013b).
A pre-compiled version of Galfit including the core-Sérsic model is available at the address:
along with an example input file, and usage notes, as summarized in Appendix B.
3 A practical example: analysis of HST data
3.1 Data set
We present here a practical application of our code on two core-Sérsic galaxies: NGC 5557 and NGC 5813, selected from the catalogue of “secure” core galaxies of Dullo & Graham (2013b). These objects have been chosen because of their relatively large break radii (), which best suits the illustrative purposes of this example. Moreover, NGC 5813 also includes a disk component (apart from the core-Sérsic bulge component), hence it represented a good test for the robustness of our code with respect to multiple component analysis. In a following paper (Bonfini et al. 2014, in preparation), we will present our 2D analysis for the full sample of the core-Sérsic galaxies of Dullo & Graham (2013b).
To perform our analysis, we decided to take advantage of the high resolution offered by HST over large area detectors. In particular, high resolution is critical for the purposes of the current exercise, as previous 1D analysis have shown that depleted cores have linear sizes of few hundreds parsecs at most (Dullo & Graham, 2012, 2013b), which at the distances of our sample galaxies NGC 5557 (47.9 Mpc; Cantiello et al., 2005) and NGC 5813 (32.2 Mpc; Tonry et al., 2001) translates to few arcseconds.
We profited of the data by the Hubble Legacy Archive (HLA666 http://hla.stsci.edu/ ) project, which offers high level archival products from the Hubble Space Telescope. We searched for images in the F555W filter (similar to the Johnson-Cousin -band), due to its higher , and for the purpose of comparison against literature data (mostly Dullo & Graham, 2013b). For both galaxies, the best available data resulted to be single-visit combined images (“level 2”) for the WFPC2 camera.
These products consist of mosaics of multiple WFPC2 images created via the MultiDrizzle software (Fruchter & et al., 2009), [up]binned to the Wide Field Camera CCD (WF) pixel scale (nominally, 0.0996″/pixel), aligned north up, and astrometrically corrected. The sky level was automatically estimated by MultiDrizzle via sigma-clipping algorithms, and then subtracted from the images. Notice that the image data are expressed in electrons/second, while the standard WFPC2 pipeline products are expressed in DN. Each mosaic is accompanied by a weight and an exposure image (as produced by MultiDrizzle), but unfortunately not a bad pixel mask, at least for the WFPC2 camera. The details of the sample images are summarized in Table 1.
The HLA also provides combined mosaics of the sole PC chip of WFPC2 with a higher pixel scale (nominally 0.050/pixel), which would intuitively appear more beneficial to our analysis. Though, as Graham et al. (2003) suggest, in order to constrain the degenerate and parameters of the model, it is better to extend the core-Sérsic fit up to . Given this warning, for the illustrative purposes of this example we opted for the whole WFPC2 images (as opposed to the sole PC chip), even if that meant sacrificing pixel resolution in the core regions. We will show that - at least for the galaxies under examination - the WF pixel scale was still sufficient to trace the power-law part of the core-Sérsic model.
3.2 Data preparation and fitting
The minimization algorithm of Galfit requires the user to provide an initial point from where to start mapping the space determined by the fit parameters; in particular, a critical parameter is represented by the sky level estimate. Galfit also allows the user to supply meta-images - such as the sigma (error) image, or the bad pixel mask - to assist the fitting procedure. In the following, we detail the necessary preparatory steps tuned to fit the HLA mosaics, and then proceed to illustrate the fit results in §3.3.
3.2.1 Sky level estimation, sigma image, and fit extent
The information about the sky level can be input to Galfit for two purposes: as a component of the fit model, and in order to calculate the sigma image.
We will focus first on the second aspect. In our procedure, we let Galfit generate the sigma image by its internal calculations. This image, which in Galfit represents the Poissonian approximation to the 1- error at each pixel position (assuming a Gaussian distribution of the image data), is internally calculated as (Peng et al., 2010, Equation 33):
| (6) |
where is the input image, is the median value of the sky, is actually the effective gain (i.e., analog to digital gain times the number of combined images; ), and is the sky root mean square (RMS) measured by Galfit (which is here assumed to also include the systematic readout noise).
Galfit calculates the sky level and the RMS via a sigma-clipping algorithm, after smoothing the image with a Gaussian filter with a hard-coded FWHM of 2 pixels, and kernel size of 5 pixels. Obviously, for this procedure to work properly, it is necessary that the fit area is devoid of sources for the most part: at least 60% (Peng et al., 2010). In our images, the wings of the galaxy light was clearly extending well beyond the aforementioned limit, therefore we had to supply the sky level and RMS to Galfit from an independent calculation. Moreover, as described in §3.1, the HLA products are provided sky-subtracted, and the sky is evaluated along the HLA pipeline (nominally, by MultiDrizzle) in a similar fashion as for Galfit, hence it was affected by the same issue, and turned out to be unreliable. In particular, both looking at the extended light profiles of the target galaxy, and by noticing a systematic abundance of negative-valued pixels at the image borders, we inferred that the sky level was over-estimated due to the contribution of the galaxy light.
At a first attempt, we tried to restore the sky level by using the relevant information stored in the mdrizsky keyword within the file headers. As mentioned in §3.1, the units of the HLA output differ from those of the standard WFPC2 pipeline. We warn the reader that the units of mdrizsky are supposed to be those indicated by bunit, but this header keyword is not updated by the HLA pipeline: the correct units for WFPC2 mdrizsky are DN (STScI Archive; personal communication). We therefore added back the mdrizsky value to the images (after proper unit conversion), but the derived sky surface brightness resulted a few magnitudes off what we expected (i.e. 22.9 mag/arcsec2 for a -band filter as F555W). We also tried to add back the mdrizsky value to the single native WFPC2 images (i.e. the *_c0m.fits) without being able to reproduce the sky counts in the corresponding drizzled single images (hst_*_drz.fits)777 Both kinds of images are accessible by using the ”more” option under the Image display of the HLA. . We deduced that there is a mismatch in the header keyword units, and we discarded this approach to the sky calculation.
Instead, we estimated the background level and RMS from Poissonian calculations, using tabulated values for the expected sky brightness in the F555W filter, and the detector readout noise and dark current characterized by the STScI team, as described in the following.
The average background value per pixel () is dominated by the sky noise: the readout noise is negligible, while the dark current is in principle subtracted by the HLA pipeline (although the value reported in the darkcorr keyword suggests it is underestimated). Hence, can be expressed simply as:
| (7) |
where (electrons/pixel) is the sky count rate per pixel expected for a sky brightness of 22.9 mag/arcsec2 observed in the F555W filter, which we obtained from the WFPC2 Instrument Handbook (0.052 electrons/second/pixel; McMaster & et al., 2008, Table 6.4), where we used WF chip values as the galaxies are centered on the PC chip.
On the other hand, the average background RMS per pixel () can be expressed by the sum in quadrature of the noise due to the sky (), the readout noise (), and the detector dark current ():
| (8) |
where:
| (9) |
can be estimated by the Poissonian error on the dark current rate ():
| (10) |
We obtained from the WFPC2 Instrument Handbook (Figure 4.8), where we conservatively adopted the maximum ever recorded value among the WF chips ( 30 electrons/second/pixel). Similarly, the readout noise for the combined image can be estimated by applying error propagation on the readout RMS of each single field ():
| (11) |
was obtained from the WFPC2 Instrument Handbook (Table 4.2), where we adopted the maximum readout noise among the WF chips ( 5.51 electrons).
Equations 7 through 11 are expressed in terms of DN as these are the input units required by Galfit. The background level and RMS information was passed to Galfit to generate the sigma image as per Equation 6.
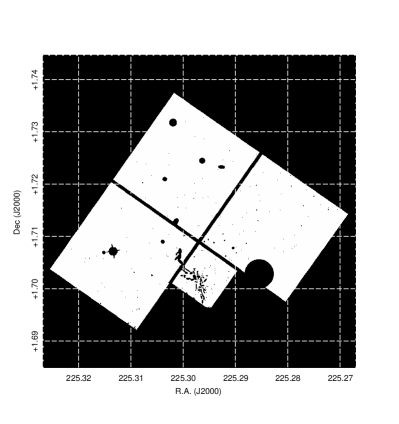
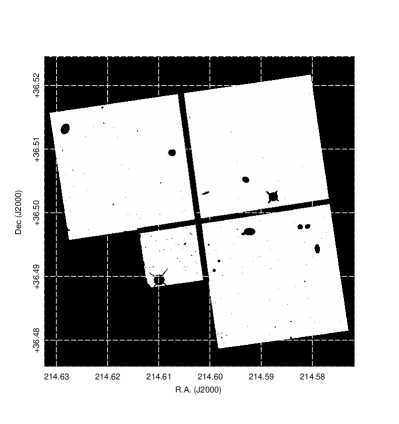
Due to the alleged HLA over-subtracted sky, we decided to limit our fit extent to roughly the point at which the galaxian brightness dropped to the estimated background level. For the same reason we did not include any sky component in the fit. Figure 1 shows the HLA images for NGC 5557 and NGC 5813, and the region we fit.
3.2.2 Masking
With our procedure, we aimed to mask any detector effect (e.g. hot pixels, charge transfer trails, chip-to-chip seams, ghosts, etc.), as well as contaminating objects.
In the first place, we dealt with the chip-to-chip seams by creating masks covering the intersections between the different chips of the WFPC2 camera, as well as the chip borders, where several “deviant” pixels can be found (i.e., pixels with very low response or with high/erratic dark current). As the relative chip positions change with time up to a shift of 5 pixels (McMaster & et al., 2008, Table 5.9), it was not possible to automatize this process, and these masks had to be adapted by hand. In §3.4 we discuss the effects of an unproper masking of such deviant pixels on the fit results.
Contaminating objects were masked by using a 2-step procedure based on SExtractor (Bertin & Arnouts, 1996). A first, small (16 pixel) background mesh, SExtractor run was performed to identify point-like sources, especially those embedded well within the innermost galactocentric radii (25% of effective radius); for this purpose, the deblending contrast was set to a particularly low value (0.0001), and filtering turned off. A second run with a bigger background mesh (64 pixels) aimed to identify extended objects. Using a mesh wider than the one we adopted resulted in missing small extended sources near the target galaxy.
The segmentation maps obtained in this way (after excluding the galaxy of interest) were combined to obtain the “SExtractor mask”. Finally dust, charge transfer trails, diffraction spikes, hot pixels, and contaminating sources were inspected and masked by hand, and the result was combined with the SExtractor mask to get the final mask (right panels of Figure 1).
3.2.3 PSF
Artificial PSFs were produced using the TinyTim tool (Krist et al., 2011). The HST PSF is diffraction limited, therefore its diffraction pattern expands with increasing wavelength. To account for this, the user has to suggest TinyTim a spectral profile representative of the object under examination. The software offers two choices of in-built stellar spectra: power-law and black body. We chose to approximate the galaxian spectra with a black body distribution characterized by a temperature of 4500 K, under the assumption that the early type galaxies in our sample could be considered as a collection of coeval K-type stars (e.g. Lindsay, 1964). The PSF image size was chosen to be 30 times its FWHM in order to include the extended wings of the PSF, and the convolution box was conservatively set to several hundreds times the PSF FWHM, well beyond the core region.
3.3 Fit
Initial guess fit parameters were chosen based on the results by Dullo & Graham (2013b), and by inspecting the 1D radial profiles along elliptical annulii of fixed axis ratio and position angle generated via the IRAF.ellipse task (Jedrzejewski, 1987). As noted earlier, the light profile of NGC 5557 can be accurately described by a single core-Sérsic component, while that of NGC 5813 also requires a disk component.
Fit results are presented in Table 2. The magnitudes have been zero-pointed to the STMAG system by using the relevant STScI information reported in the images header (nominally, the photflam keyword). By construction, the STMAG magnitude for the F555W filter is very close (0.01 mag brighter) to the Vegamag Cousin -band magnitude (see WFPC2 Instrument Handbook, version 10.0, §5.1). Galfit fit errors are not reported here, as the uncertainties derived from the covariance matrix are usually underestimated (Peng et al., 2010). We stress the fact that the values obtained for the reduced must be considered with caution, as they are extremely dependent on the normalization imposed to the sigma image by the evaluation of the background (§3.2.1).
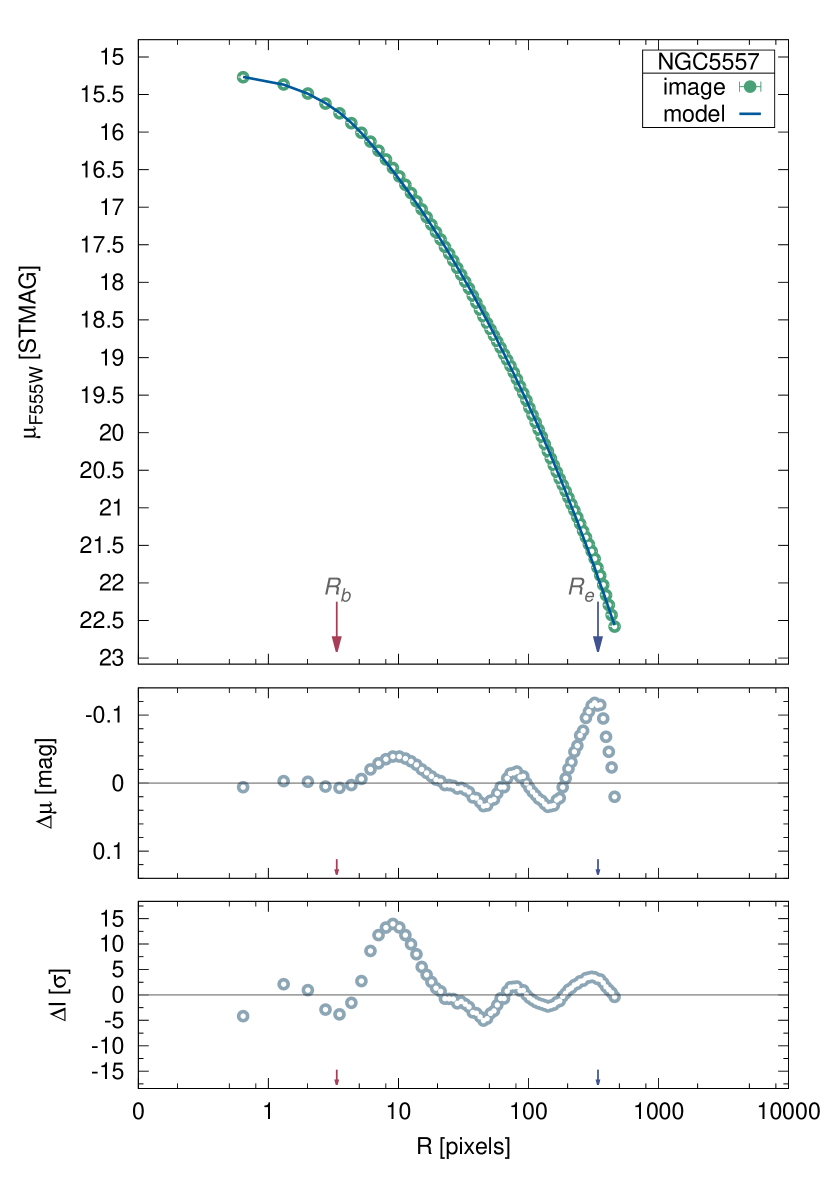
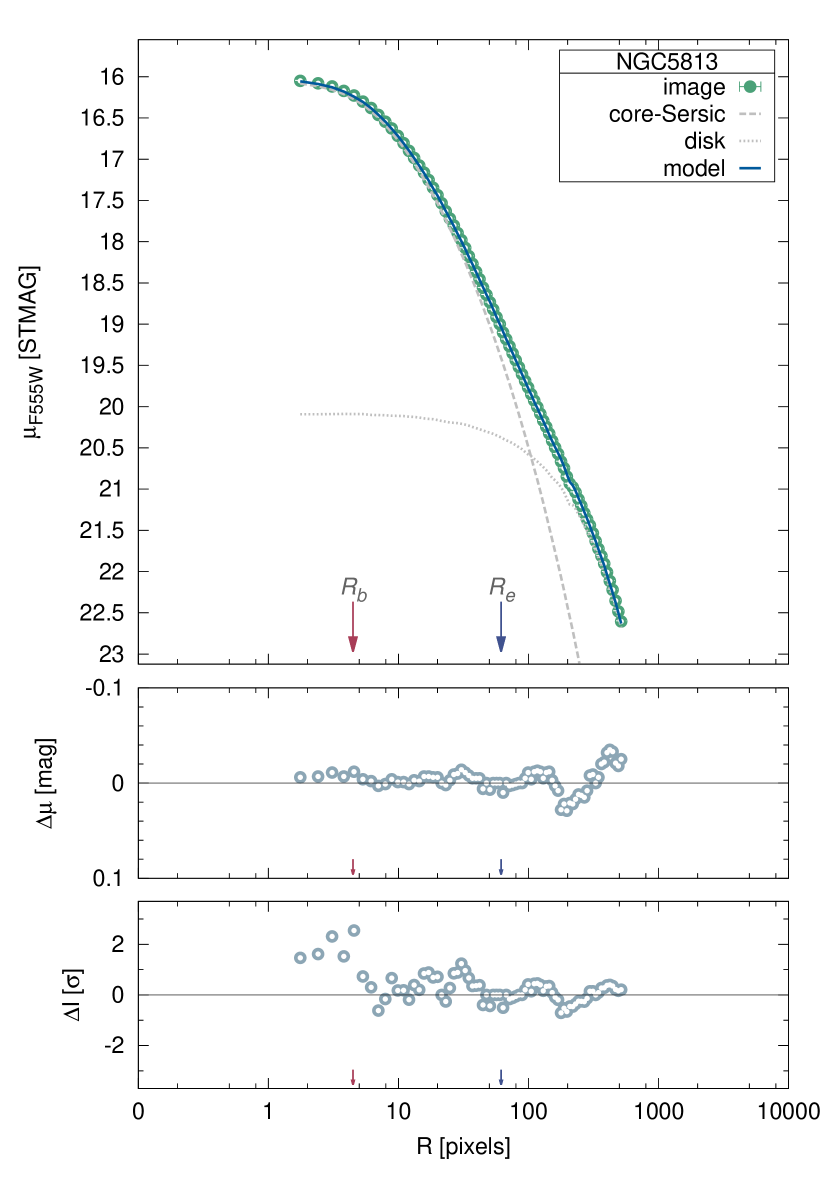
Figure 2 shows the radial profiles of the galaxy light (obtained as mentioned above), of the Galfit best-fit model, and of the model residuals, for NGC 5557 (left) and NGC 5813 (right).
Inspecting the residuals (middle panels), we observe that the chosen models provide a fairly good fit to the data, with residuals less than 0.1 mag/arcsec2 over the extent of the fit: an accuracy comparable to that of previous 1D analysis of the same objects (Dullo & Graham, 2013b, their Figure A1). Though, we notice a peculiar pattern of the residuals at the outermost radii, corresponding to a steepening of the slope of the light profile: we attribute this effect to possible sky over-subtraction (see 3.2.1).
In the bottom panels of Figure 2, we report the fit residuals expressed in units of (“weighted residuals”). This visualization shows that, despite the Galfit Poissonian weighting scheme is naturally biased towards the brightest - innermost - data, the fit is actually constrained by the data at large radii, which show smaller weighted residuals. The reason is that the outer Sérsic part of model is sampled by a number of pixels which is orders of magnitude larger than the few pixels of the power-law part, hence it contributes more to the overall . Indeed, we observe that the dispersion of the weighted residuals at the innermost radii decreases when fitting a smaller area around the galaxy center.
The slight boxiness of the disk component of NGC 5813 is to be attributed to a distortion of the isophotes due partly to an anomalous intensity discontinuity between the WF2 chip (which appears slightly brighter) and the other chips, and partly to the dust “waist” which reduces the galaxy intensity along the S-W to N-E direction (the dust pattern is evident in the image residuals; see Figure 4).
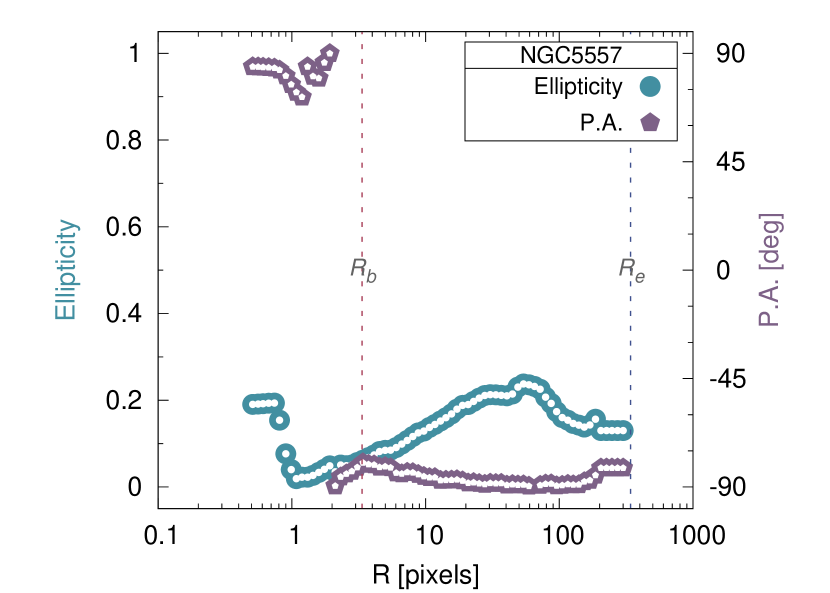
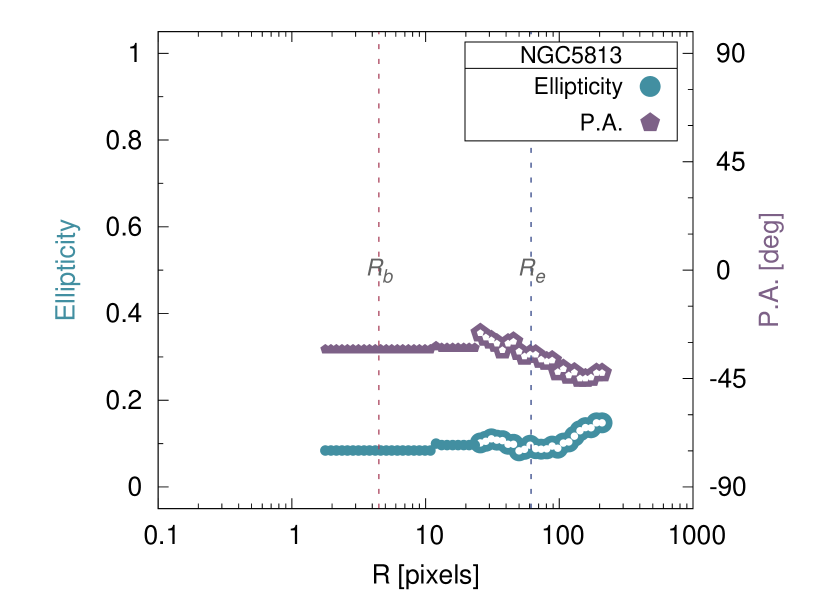
In comparing our results against previous 1D studies, the reader should bear in mind that (a) we performed PSF-convolved fitting, and that (b) the photometry presented in Figure 2 was performed along elliptical annulii of fixed axis ratio and position angle corresponding to the best-fit parameters. The reason for this choice is due to the fact that Galfit allows only for one value of axis ratio and position angle for each component of the model. Differences may arise with studies based on the IRAF.ellipse task, when the task is allowed to fit for ellipticity and position angle. We performed such ellipse analysis, and report in Figure 3 the trends of the ellipticities and position angles of the fitted elliptical isophotes. Indeed, it is the case that - at least for the galaxy NGC 5557 (lef panel) - there is a significant variation of the ellipticity throughout the galaxy extent.
Figure 4 shows the residual images for the sub-section of the HLA images (Figure 1) over which the fit was performed. The image for NGC 5557 (left panel) shows a weak residual structure within the innermost radii (500 pc), attributable to the change in the ellipticity (Figure 3). The residual image for NGC 5813 (right panel) clearly shows the trace of its dust content (which was masked prior to fitting; see §3.2.2).
3.4 Assessing results and troubleshooting
3.4.1 Comparison against 1D results
In order to assess the reliability of our 2D analysis, we compared our results against those of 1D core-Sérsic fits found in the literature. Both NGC 5557 and NGC 5813 have been analysed based on WFPC2 images in the F555W filter (-band) by Dullo & Graham (2013b). This work represents our main reference study, as we used data obtained with the same instrument and filter setup. NGC 5557 was also investigated by Trujillo et al. (2004) in the -band (HST WFPC2/F702W), too far from our -band to allow for a comparison without using a statistically significant sample. NGC 5813 was studied by Richings et al. (2011) in the -band (HST NICMOS/F814W). However, Richings et al. (2011) failed to fit the large scale disk component of NGC 5813, deemed necessary in this work and by Dullo & Graham (2013b), hence it was not possible to compare the results. A comparison of the parameters obtained in this work against those by Dullo & Graham (2013b) are reported in Table 3.
We obtained a fairly good agreement, with the values reported by Dullo & Graham (2013b). In their Figures 2, 3, and 4, these authors present a comparison between their parameters , Sérsic , and , and those obtained by diverse 1D studies of core galaxies (including both Nuker and core-Sérsic modeling): all of our values lay well within the scatter of these plots.
The only noticeable difference with Dullo & Graham (2013b) is in the values of the power-law slopes (), despite both our (Figure 2) and their (Dullo & Graham, 2013b, their Figure A1) fits yielded to very low residuals inside the break radii. For the photometry of the very inner part of the galaxies (R 1″), Dullo & Graham (2013b) used the data from Lauer et al. (2005), which were obtained through a PSF-deconvolution technique. On the contrary, Galfit follows a PSF-fitting method working directly on the convolved image. We notice that, for both galaxies, the radial extent of the power-law part of the core-Sérsic model is very close to the size of the PSF, as measured on the HLA images (2 pixels FWHM). Therefore, it is plausible that the value of is sensitive to the different treatment of the PSF in the two methods.
In the case of NGC 5813, an additive issue is that the different inner power-law slopes may be the reflection of a difference in the position of the galaxian centers derived in the two works. An offset center strongly affects the radial profile at the innermost radii, and could even mimic a slope of opposite sign with respect to the true one. In Galfit, the galaxian center is determined using information from the whole image, while the isophote fitting used in Dullo & Graham (2013b) uses the local pixels. The inner regions of NGC 5813 are severely affected by dust (see Figure 1), therefore it is possible that the different centering methods and, most of all, the different choices for the dust mask in the two works yielded to a different fit of the center of this galaxy. Indeed, even in our Galfit fit, the value of turned out to be very sensitive to the masking choice.
Our values for the effective radii are only slightly different from those of Dullo & Graham (2013b) for both galaxies. We ascribe the small discrepancy to the different radial extent of the fit: Dullo & Graham (2013b) were able to fit further, while we had to restrain our fits due to the alleged over-subtraction of the sky (see §3.2.1). Finally, we stress that the fits by Dullo & Graham (2013b) were performed by keeping the parameter “frozen”, hence part of the discrepancies in the other parameters can be a reflection of this constraint.
3.4.2 Troubleshooting
In this section we will present a short summary of the possible sources of error we had to account for in the current analysis.
Issues with HLA WFPC2 data.
In §3.2.1, we extensively presented the issues arising from the sky-subtraction procedure performed by the HLA pipeline. An over-subtraction of the sky contribution could easily mimic a truncation of the external region of the disk, while an under-subtraction can be misinterpreted as an extended disk. In the specific cases examined here (NGC 5557 and NGC 5813), we inferred that the sky was over-subtracted. This influenced the estimate of the effective radius ().
In §3.2.2 we discussed the importance of masking the bad pixels (i.e., pixels with very low response or with high/erratic dark current) at the borders of the detector, or along the seams between chips. The effects of these deviant pixels can be easily recognized as they drive the fit towards nonphysical position angles. In §3.4, we also discussed how dust can influence the parameters of the inner part of the core-Sérsic model, and especially .
Notes on the core-Sérsic model in Galfit.
The parameter is the one that required most attention in the implementation of the core-Sérsic model. In the first place, as discussed in §2, high values of can generate numerical overflows, although we limited the onset of this problem by setting a hard upper boundary for (20). We observed that in most of the cases in which the fit did not converged was prone to be continuously reset to the upper boundary with each fit iteration. In the case of small cores, or when the transition between the core and the Sérsic region is very mild, the code may “decide” to bypass the core by fitting low values of alpha, and essentially use only the Sérsic part to fit the whole profile. This has the immediate effect of coupling the and parameters (which regulate the inner and outer curvature), as noted also in Graham et al. (2003).
In order to achieve a robust fit, the break radius should be bigger than PSF FWHM (and the PSF be Nyquist sampled). This is related to the suggestion by Trujillo et al. (2004) that should be beyond the radius corresponding to the second innermost data point (of deconvolved light profiles) to obtain an unambiguous identification of the core.
Finally, we recall that it is suggested to extend the fit up to the galactocentric distance corresponding to the effective radius to obtain proper constraining of the Sérsic part of the model (see also Graham et al., 2003), although Dullo & Graham (2012, 2013b) have revealed that a careful modeling of smaller radial extents can still recover the Sérsic parameters.
4 Summary and conclusions
We introduced Galfit-Corsair: a publicly available, fully retro-compatible modification of the 2D fitting software Galfit (v.3) which adds an implementation of the core-Sérsic model.
We presented a practical application of the code through the analysis of Hubble Legacy Archive (HLA; F555W filter) data of two “secure” core-Sérsic galaxies (Trujillo et al., 2004; Richings et al., 2011; Dullo & Graham, 2013b): NGC 5557 and NGC 5813. We showed that the code is robust with respect to multi-component fitting, even in conditions of heavy dust obscuration. We compared our results against previous 1D analysis, and we find reasonable consistency in the derived core-Sérsic parameters, considering the intrinsic differences between the 1D and the 2D fitting methods. Finally, we reported a summary of warnings regarding the specific analysis of HLA images, and on the usage of the core-Sérsic model.
The code and the analysis procedure described here have been developed to perform the first coherent 2D analysis of a sample of core-Sérsic galaxies (the one of Dullo & Graham, 2013b), which will be presented in a companion paper (Bonfini et al. 2014, in preparation). As discussed in §1.2, two dimensional fitting proved to be superior to 1D approaches in multi-components analysis. Moreover, Galfit fit is fully seeing-corrected, through the convolution of the model with the PSF. Therefore, our 2D analysis will yield complementary constraints on the missing mass in depleted galaxy cores.
Appendix A Notes on sample galaxies
A.1 NGC 5557
NGC 5813 is a massive ( = -22.39 mag; Lauer et al., 2007), rounded (see Table 2) elliptical galaxy (E1; de Vaucouleurs et al., 1995), and it has been identified as a slow rotator by the ATLAS3D survey (Emsellem et al., 2011). These characteristics match the profile of the prototype core-Sérsic galaxies, which are believed to be result of dry merger events (see 1.1). Contrarily, using deep MegaCam exposures, Duc et al. (2011) found that NGC 5557 shows clear evidence for extremely elongated tidal tails (for a total extent of 375 kpc), and high fine-structure index (Schweizer & Seitzer, 1992), which they attributed to a recent (z0.5) gas-rich major merger event. Though, the authors acknowledge that this hypothesis can be reconciled with the mild rotation of NGC 5557 only under the specific assumption that the merger collision had a low impact parameter.
A.2 NGC 5813
NGC 5813 has been classified as elliptical galaxy (E1) in the Third Reference Catalogue (RC3; de Vaucouleurs et al., 1995). However, both Trujillo et al. (2004, their Appendix C) and Dullo & Graham (2013b) found that the galaxy may be better described by a core-Sérsic + disk component, hence suggesting it may be a S0 galaxy. The results of our 2D analysis (§3.3) confirm that the galaxian light profile is well fit by the aforementioned components. It is worth mentioning, though, that the galaxy is believed to have a kinematically decoupled core, as first found by Efstathiou et al. (1982), and interpreted by Kormendy (1984) as the result of a minor merger. The kinematically decoupled core was also reported among the early SAURON results by de Zeeuw et al. (2002). Indeed, inspecting the ATLAS3D velocity maps (Krajnović et al., 2011), we observe that the decoupled core extends up to 6″, beyond which the rotational velocity suddenly drops.
Appendix B GALFIT-CORSAIR “how to”
A pre-compiled version of Galfit-Corsair is available at the address:
along with an example input file, and usage notes. The code is completely retro-compatible with Galfit v.3, but, at the moment this document is written, the core-Sérsic model has not been tested yet for the azimuthal/truncation functions, and it is not possible to apply constraints on its parameters , , , , and . Further updates will be notified on the website.
The definition of the core-Sérsic model follows the standards of the Galfit input parameter file:
# core-Sersic function

 0) corser         # object type
 1) 123 456   1 1  # position x, y        [pixel]
 3) -10.0     1    #    mu(Rb)            [surface brightness mag. at Rb]
 4) 4.0       1    #     R_b              [pixel]
 5) 5.0       1    #     alpha
 6) 0.1       1    #     gamma
 7) 123       1    #     R_e              [pixel]
 8) 4         1    # Sersic exponent (deVauc=4, expdisk=1)
 9) 0.90      1    # axis ratio (b/a)
10) 90        1    # position angle (PA)  [Degrees: Up=0, Left=90]
C0) 1e-05     1    # diskyness(-)/boxyness(+)
 Z) 0              # leave in [1] or subtract [0] this comp from data?
NOTE 1: The core-Sérsic flux normalization (parameter #3) can only be defined at the model’s native size parameter (), therefore the other normalizations (as per Peng et al., 2010, §6.1), will not be recognized.
NOTE 2: As for the other models in Galfit, the diskyness/boxyness parameter (C0) shall be always set to an initial value different than 0 if this parameter is fit, or else the software will crash.
Please report any bug to: pbonfini@swin.edu.au.
References
- Barden et al. (2012) Barden, M., Häußler, B., Peng, C. Y., McIntosh, D. H., & Guo, Y. 2012, MNRAS, 422, 449
- Begelman et al. (1980) Begelman, M. C., Blandford, R. D., & Rees, M. J. 1980, Nature, 287, 307
- Bertin & Arnouts (1996) Bertin, E., & Arnouts, S. 1996, A&AS, 117, 393
- Bevington & Robinson (2003) Bevington, P. R., & Robinson, D. K. 2003, Data reduction and error analysis for the physical sciences, 3rd ed., by Philip R. Bevington, and Keith D. Robinson. Boston, MA: McGraw-Hill, ISBN 0-07-247227-8, 2003.,
- Cantiello et al. (2005) Cantiello, M., Blakeslee, J. P., Raimondo, G., et al. 2005, ApJ, 634, 239
- Capaccioli (1989) Capaccioli, M., 1989, in The World of Galaxies, eds. H. G. Corwin, & L. Bottinelli (Berlin: Springer-Verlag), 208
- Côté et al. (2007) Côté, P., Ferrarese, L., Jordán, A., et al. 2007, ApJ, 671, 1456
- Crane et al. (1993) Crane, P., Stiavelli, M., King, I. R., et al. 1993, AJ, 106, 1371
- de Souza et al. (2004) de Souza, R. E., Gadotti, D. A., & dos Anjos, S. 2004, ApJS, 153, 411
- de Vaucouleurs et al. (1995) de Vaucouleurs, G., de Vaucouleurs, A., Corwin, H. G., et al. 1995, VizieR Online Data Catalog, 7155, 0
- de Zeeuw et al. (2002) de Zeeuw, P. T., Bureau, M., Emsellem, E., et al. 2002, MNRAS, 329, 513
- Duc et al. (2011) Duc, P.-A., Cuillandre, J.-C., Serra, P., et al. 2011, MNRAS, 417, 863
- Dullo & Graham (2012) Dullo, B. T., & Graham, A. W. 2012, ApJ, 755, 163
- Dullo & Graham (2013a) Dullo, B. T., & Graham, A. W. 2013, ApJ, 768, 36
- Dullo & Graham (2013b) Dullo, B. T., & Graham, A. W. 2013, arXiv:1310.5867
- Duncan & Wheeler (1980) Duncan, M. J., & Wheeler, J. C. 1980, ApJ, 237, L27
- Ebisuzaki et al. (1991) Ebisuzaki, T., Makino, J., & Okumura, S. K. 1991, Nature, 354, 212
- Efstathiou et al. (1982) Efstathiou, G., Ellis, R. S., & Carter, D. 1982, MNRAS, 201, 975
- Emsellem et al. (2011) Emsellem, E., Cappellari, M., Krajnović, D., et al. 2011, MNRAS, 414, 888
- Faber et al. (1997) Faber, S. M., Tremaine, S., Ajhar, E. A., et al. 1997, AJ, 114, 1771
- Ferrarese et al. (1994) Ferrarese, L., van den Bosch, F. C., Ford, H. C., Jaffe, W., & O’Connell, R. W. 1994, AJ, 108, 1598
- Ferrarese et al. (2006) Ferrarese, L., Côté, P., Jordán, A., et al. 2006, ApJS, 164, 334
- Forbes et al. (1995) Forbes, D. A., Franx, M., & Illingworth, G. D. 1995, AJ, 109, 1988
- Fruchter & et al. (2009) Fruchter, A., & et al. 2009, HST MultiDrizzle, HST Data Handbooks,
- Gadotti (2008) Gadotti, D. A. 2008, MNRAS, 384, 420
- Graham et al. (2003) Graham, A. W., Erwin, P., Trujillo, I., & Asensio Ramos, A. 2003, AJ, 125, 2951
- Graham & Guzmán (2003) Graham, A. W., & Guzmán, R. 2003, AJ, 125, 2936
- Graham (2004) Graham, A. W. 2004, ApJ, 613, L33
- Graham & Driver (2005) Graham, A. W., & Driver, S. P. 2005, PASA, 22, 118
- Grillmair et al. (1994) Grillmair, C. J., Faber, S. M., Lauer, T. R., et al. 1994, AJ, 108, 102
- Jaffe et al. (1994) Jaffe, W., Ford, H. C., O’Connell, R. W., van den Bosch, F. C., & Ferrarese, L. 1994, AJ, 108, 1567
- Jedrzejewski (1987) Jedrzejewski, R. I. 1987, MNRAS, 226, 747
- Häussler et al. (2007) Häussler, B., McIntosh, D. H., Barden, M., et al. 2007, ApJS, 172, 615
- Hernquist (1990) Hernquist, L. 1990, ApJ, 356, 359
- King & Minkowski (1966) King, I. R., & Minkowski, R. 1966, ApJ, 143, 1002
- King & Minkowski (1972) King, I. R., & Minkowski, R. 1972, External Galaxies and Quasi-Stellar Objects, 44, 87
- King (1978) King, I. R. 1978, ApJ, 222, 1
- Kormendy (1984) Kormendy, J. 1984, ApJ, 287, 577
- Kormendy (1985) Kormendy, J. 1985, ApJ, 292, L9
- Kormendy et al. (1994) Kormendy, J., Dressler, A., Byun, Y. I., et al. 1994, European Southern Observatory Conference and Workshop Proceedings, 49, 147
- Krajnović et al. (2011) Krajnović, D., Emsellem, E., Cappellari, M., et al. 2011, MNRAS, 414, 2923
- Krist et al. (2011) Krist, J. E., Hook, R. N., & Stoehr, F. 2011, Proc. SPIE, 8127,
- Lauer (1985) Lauer, T. R. 1985, ApJ, 292, 104
- Lauer et al. (1991) Lauer, T. R., Faber, S. M., Holtzman, J. A., et al. 1991, ApJ, 369, L41
- Lauer et al. (1995) Lauer, T. R., Ajhar, E. A., Byun, Y.-I., et al. 1995, AJ, 110, 2622
- Lauer et al. (2005) Lauer, T. R., Faber, S. M., Gebhardt, K., et al. 2005, AJ, 129, 2138
- Lauer et al. (2007) Lauer, T. R., Gebhardt, K., Faber, S. M., et al. 2007, ApJ, 664, 226
- Lindsay (1964) Lindsay, E. M. 1964, Irish Astronomical Journal, 6, 256
- McMaster & et al. (2008) McMaster, M., & et al. 2008, Wide Field and Planetary Camera 2, HST Instrument Handbook,
- Merritt (2006) Merritt, D. 2006, ApJ, 648, 976
- Peng et al. (2010) Peng, C. Y., Ho, L. C., Impey, C. D., & Rix, H.-W. 2010, AJ, 139, 2097
- Ravindranath et al. (2001) Ravindranath, S., Ho, L. C., Peng, C. Y., Filippenko, A. V., & Sargent, W. L. W. 2001, AJ, 122, 653
- Rest et al. (2001) Rest, A., van den Bosch, F. C., Jaffe, W., et al. 2001, AJ, 121, 2431
- Richings et al. (2011) Richings, A. J., Uttley, P., Kording, E. 2011, MNRAS, 415, 2158
- Schweizer & Seitzer (1992) Schweizer, F., & Seitzer, P. 1992, AJ, 104, 1039
- Sérsic (1963) Sérsic, J. L. 1963, Boletin de la Asociacion Argentina de Astronomia La Plata Argentina, 6, 41
- Simard (1998) Simard, L. 1998, Astronomical Data Analysis Software and Systems VII, 145, 108
- Tonry et al. (2001) Tonry, J. L., Dressler, A., Blakeslee, J. P., et al. 2001, ApJ, 546, 681
- Trujillo et al. (2004) Trujillo, I., Erwin, P., Asensio Ramos, A., & Graham, A. W. 2004, AJ, 127, 1917
- Young et al. (1978) Young, P. J., Westphal, J. A., Kristian, J., Wilson, C. P., & Landauer, F. P. 1978, ApJ, 221, 721
| Target | RA (J2000) | Dec (J2000) | Camera/Filter | Nexp | Exp. time | |
|---|---|---|---|---|---|---|
| [hh:mm:ss] | [dd:mm:ss] | [Mpc] | [sec] | |||
| (1) | (2) | (3) | (4) | (5) | (6) | (7) |
| NGC 5557 | 14:18:25.7 | +36:29:37 | 47.9 | WFPC2/F555W | 6 | 1400 |
| NGC 5813 | 15:01:11.2 | +01:42:07 | 32.2 | WFPC2/F555W | 2 | 1000 |
Note. — Details of the images for the sample galaxies. The final HLA products used in the current work are sky-subtracted mosaics of the observations for each galaxy. The number of combined images and exposure time are relevant to the statistics used by Galfit to perform the fit (see §3.2)
(1) Target name. (2,3) Target coordinates from NED (J2000). (4) Target distance: from Cantiello et al. (2005) for NGC 5557, and from Tonry et al. (2001) for NGC 5813. (5) HST camera and filter. (6) Number of exposures combined to obtain the HLA product. (7) Total exposure time.
| Target | Component | / | P.A. | ||||||||||
|---|---|---|---|---|---|---|---|---|---|---|---|---|---|
| [mag/″2] | [mag] | [pc] | [ ″ ] | [ ″ ] | [deg] | ||||||||
| (1) | (2) | (3) | (4) | (5) | (6) | (7) | (8) | (9) | (10) | (11) | (12) | (13) | (14) |
| NGC 5557 | core-Sérsic | 15.62 | - | 77.8 | 10.1 | 0.38 | 34.2 | - | 5.0 | 0.82 | 90.5 | -0.08 | 17.3 |
| NGC 5813 | core-Sérsic | 16.20 | - | 69.8 | 2.5 | 0.01 | 6.2 | - | 2.7 | 0.94 | 149.4 | -0.03 | 4.7 |
| NGC 5813 | disk | - | 11.50 | - | - | - | - | 24.4 | - | 0.69 | 134.8 | +0.17 | - |
Note. — Results of the Galfit core-Sérsic analysis.
(1) Target name. (2) Model component. (3) Surface brightness at break radius. (4) Total apparent magnitude. (5) Break radius for the core-Sérsic model. Lengths have been calculated assuming linear approximation of the angular separations. (6) Alpha parameter for the core-Sérsic model. (7) Inner power-law index for the core-Sérsic model. (8) Effective radius. (9) Disk scale length. (10) Sérsic index. (11) Axis ratio. (12) Position angle (east: P.A. = 0). (13) Boxyness of generalized ellipse (boxy isophote: 0). (14) Reduced for the whole model.
| Target | Source | ||||||
|---|---|---|---|---|---|---|---|
| [STMAG] | [arcsec] | [arcsec] | |||||
| (1) | (2) | (3) | (4) | (5) | (6) | (7) | (8) |
| NGC 5557 | This work | 15.62 | 0.34 | 10.1 | 0.38 | 34.2 | 5.0 |
| NGC 5557 | Dullo & Graham (2013b) | 15.47 | 0.23 | —5— | 0.19 | 30.2 | 4.6 |
| NGC 5813 | This work | 16.21 | 0.45 | 2.5 | 0.01 | 6.2 | 2.7 |
| NGC 5813 | Dullo & Graham (2013b) | 16.12 | 0.35 | —2— | -0.10 | 7.1 | 2.8 |
Note. — Comparison of the core-Sérsic parameters obtained through our 2D Galfit analysis against the work by Dullo & Graham (2013b) based on 1D analysis in the same instrument/band (WFPC2/F555W). The parameter in Dullo & Graham (2013b) has been held fixed in the fit.
(1) Target name. (2) reference study. (3) Break radius surface brightness. Dullo & Graham (2013b) obtained their -band magnitudes from the STMAG magnitudes by applying the -0.01 mag shift prescribed by the HST WFPC2 Photometry Cookbook (Dullo, private communication). Their values have been converted back to the STMAG system, in this table. (4) Break radius for the core-Sérsic model. (5) Alpha parameter for the core-Sérsic model. (6) Inner power-law index for the core-Sérsic model. (7) Effective radius of the core-Sérsic model. (8) Sérsic index.
\begin{overpic}[width=208.13574pt]{f1_top_left_lowres.eps}
\put(20.0,75.0){{\color[rgb]{1,1,1}NGC 5557}}
\end{overpic}
 \begin{overpic}[width=208.13574pt]{f1_bot_left_lowres.eps}
\put(20.0,75.0){{\color[rgb]{1,1,1}NGC 5813}}
\end{overpic}
\begin{overpic}[width=208.13574pt]{f1_bot_left_lowres.eps}
\put(20.0,75.0){{\color[rgb]{1,1,1}NGC 5813}}
\end{overpic}