Present address: ]Institute of Materials Structure Science, KEK, 1-1 Oho, Tsukuba, Ibaraki 305-0801, Japan
Detailed neutron diffraction study of magnetic order in NdFe2Al10
Abstract
The orthorhombic compound NdFe2Al10 has been studied by powder and single-crystal neutron diffraction. Below K, the Nd3+ magnetic moments order in a double- [, ] collinear magnetic structure, whose unit cell consists of four orthorhombic units in the direction.The refinements show that this structure consists of (0 1 0) ferromagnetic planes stacked along , in which the moments are oriented parallel to (the easy anisotropy axis according to bulk magnetization measurements) and nearly equal in magnitude (). The alternating 8-plane sequence providing the best agreement to the data turns out to be that which yields the lowest exchange energy if one assumes antiferromagnetic near-neighbor exchange interactions with . With increasing temperature, the single-crystal measurements indicate the suppression of the component at K, supporting the idea that the anomalies previously observed around 2–2.5 K result from a squaring transition. In a magnetic field applied along the axis, the magnetic Bragg satellites disappear at T, in agreement with earlier measurements. Comparisons are made with related magnetic orders occurring in CeAl10 (: Ru, Os) and TbFe2Al10.
pacs:
71.27.+a, 71.70.Ch, 71.70.Gm, 75.25.+z, 75.30.Gw, 75.30.Kz,I Introduction
Orthorhombic compounds with formula CeAl10 (: Ru, Os, Fe) have attracted considerable interest recently because they exhibit a very peculiar coexistence of long-range magnetic order and Kondo-insulator properties,Muro et al. (2009); Nishioka et al. (2009); Strydom (2009) which has been ascribed to an unusually strong anisotropy of the hybridization between and conduction electron states.Kondo et al. (2011); Tanida et al. (2012) The antiferromagnetic (AFM) order reported for CeRu2Al10 and CeOs2Al10 has a number of intriguing features such as the very large value of the ordering temperature, K, in comparison with other Al10 compounds (: Nd, Gd),Kobayashi et al. (2011); Kunimori et al. (2012) the direction of the AFM moment () not complying with the single-ion anisotropy (easy axis), or the lack of transverse, “”-type, behavior in the temperature dependence of the magnetic susceptibility for a field applied along , etc. Neutron scattering experiments have clarified several aspects of the magnetic structureRobert et al. (2010); Khalyavin et al. (2010); Mignot et al. (2011) (AFM with propagation vector and a strongly reduced Ce magnetic moment, on the order of 0.3 ) and dynamicsKhalyavin et al. (2010); Robert et al. (2010, 2012) (spin gap and dispersive magnetic excitations forming below ). The spectrum of magnetic excitations, in particular, points to a strong anisotropy of exchange interactions, which competes with the conventional crystal-field anisotropy.
In an attempt to set an appropriate reference for the exotic magnetism occurring in the Ce compounds, experiments have been carried out on their Nd counterparts, which are expected to exhibit “normal-rare-earth” properties, dominated by crystal-field (CF) effects and Ruderman-Kittel-Kasuya-Yosida (RKKY) exchange interactions. The results reported by Kunimori et al.Kunimori et al. (2012) confirmed this expectation, and the anisotropic magnetization (easy axis) in the paramagnetic regime could be reproduced satisfactorily using a simple two-sublattice mean-field model, with a small CF splitting, imputable to the large distance from the Ce ion to its ligands, and a moderate anisotropy in the exchange interactions. Below the ordering temperature, K, the ordered moments orient along the easy anisotropy axis, and their magnitude looks consistent with the values calculated for the Nd3+ CF doublet ground state. The overall picture is thus that of weakly interacting integral-valence rare-earth ions. Interestingly, anomalies have been observed in specific heat,Kunimori et al. (2012) SR,Adroja et al. (2013) and electrical resistivityTanida et al. (2014) measurement at temperatures close to 2–2.5 K, suggesting the possible existence of a second transition below . However, no indication of the nature of that transition has been reported so far. Previous neutron diffraction experiments on the isostructural heavy-rare-earth compound TbFe2Al10 have revealed a sequence of magnetic phases consisting of a sine-wave modulation with a wave vector very close to forming at = 16.5 K, followed by a squaring of the structure below 11 K.Reehuis et al. (2000, 2003)
Wyckoff positions are: [Nd], [Fe], [Al(1), Al(2)], [Al(3), Al(4)], [Al(5)].Thiede et al. (1998) Space group (Å) (Å) (Å) factor this work 9.0148(7) 10.2168(7) 9.0793(7) 3.31 2.89 X-rays111Ref. Sera et al.,2013a 9.0158(1) 10.2182(1) 9.0800(1)
| this work | 0.1238(2) | 0.2290(3) | 0.3617(3) | 0.3500(3) | 0.1286(3) | 0.1602(3) | 0.5975(3) | 0.3765(3) | 0.0514(3) | 0.2280(2) |
|---|---|---|---|---|---|---|---|---|---|---|
| X-rays222Ref. Sera et al.,2013b | 0.12428 | 0.22727 | 0.36085 | 0.34989 | 0.12843 | 0.16077 | 0.59844 | 0.37661 | 0.05077 | 0.22721 |
In the present work we have performed neutron diffraction experiments to characterize the magnetic structure of NdFe2Al10, which could not be determined from magnetic measurements alone. At the base temperature of K, the structure is found to be commensurate, with cell dimensions , and can be derived from the AFM structure of CeRu2Al10 and CeOs2Al10 by a change in the moment direction and the introduction of periodic spin-discommensurations.
II Experiments
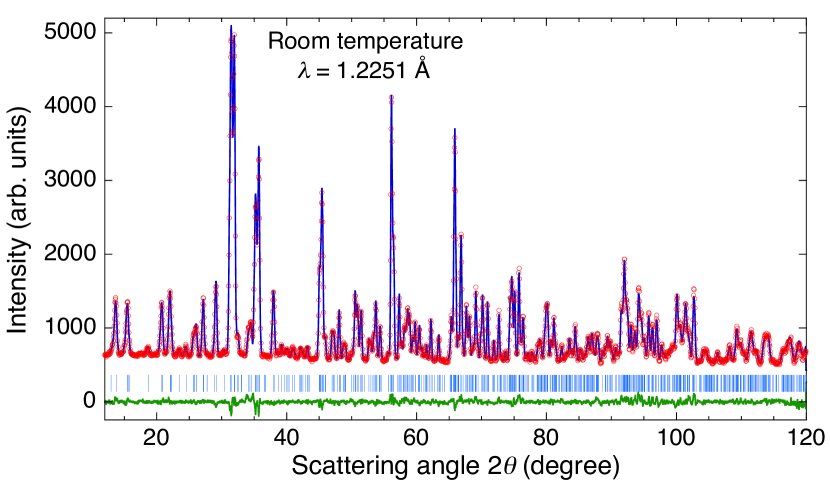
NdFe2Al10 was synthesized in single-crystal form starting from 99.9% Nd and 99.995% Fe constituents in a 99.999% Al flux. A powder sample of 6.3 g in mass was prepared by crushing small single-crystal pieces. Its quality was checked on the high-resolution powder diffractometer 3T2 (Orphée-LLB), using an incident neutron wavelength Å. The diffraction pattern is shown in Fig. 1. The parameters derived from the Rietveld refinement, listed in Table 1, are in excellent agreement with the space group (, #63), lattice constants,Thiede et al. (1998); Sera et al. (2013a) and atomic parameters Sera et al. (2013a) determined previously by X-ray diffraction.
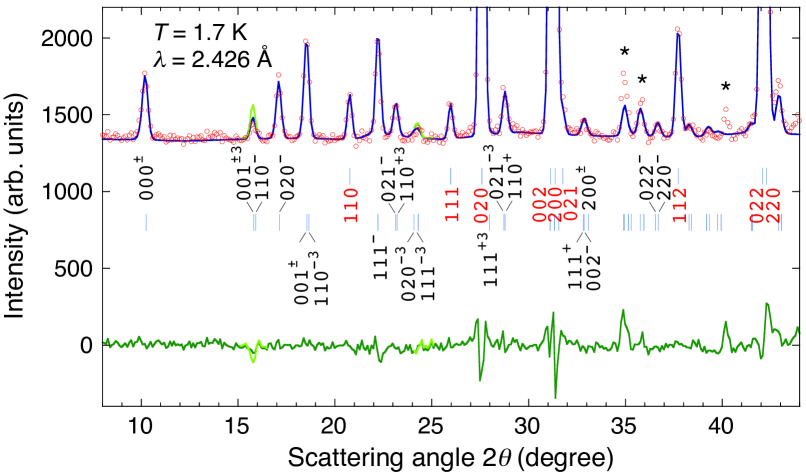
Neutron powder diffraction (NPD) patterns were collected on the two-axis diffractometer G4-1 (Orphée-LLB, Saclay) equipped with a 800-cell position-sensitive detector. A monochromatic incident neutron beam of wavelength 2.426 Å was produced by a pyrolytic graphite (PG002) monochromator, and higher-order contamination was suppressed by means of a PG filter. The sample powder was contained in a thin-walled cylinder-shape vanadium container, 6 mm in diameter, and cooled to 1.7 K in the exchange-gas chamber of a liquid-He cryostat. The data analysis was performed using the Rietveld refinement program FullProf,Rodriguez-Carvajal (1993, 2001) with neutron scattering lengths and magnetic form factors taken from Refs. Sears, 1992 and Freeman and Desclaux, 1979, respectively. Absorption corrections were treated as negligible.
A large single-crystal ( g) was mounted on an aluminum sample holder with the axis vertical, and cooled to 1.7 K in the variable-temperature insert (VTI) of a 7-T, split-coil, vertical-field cryomagnet from Oxford Instruments. Single-crystal diffraction (SCD) experiments were performed on the thermal beam, two-axis neutron diffractometer Super-6T2 (Orphée-LLB).Gukasov et al. (2007) Intensity maps were measured at two incident wavelengths, Å (Cu monochromator, Er filter) and 2.345 Å (PG002 monochromator, PG filter), by rotating the sample around the vertical axis with 0.1∘steps and recording the diffraction pattern in a Bidim26 multiwire position-sensitive gas detector (PSD) developed at the ILL (Grenoble) and manufactured by INEL (Artenay, France). This procedure allowed us to explore a large three-dimensional (3D) segment of the reciprocal space by transforming a complete set of PSD images into the reciprocal space of the crystal. For quantitative refinements and studies of temperature and magnetic field dependences, the configuration was changed to a single lifting counter, with Soller collimators. An extensive data set was collected at Å in zero field at the base temperature, and more restricted ones at K and at T. The results were analyzed using the Cambridge Crystallography Subroutine Library (CCSL).ccs
III Results
III.1 Magnetic structure: powder diffraction
The NPD pattern measured on G4-1 for K is presented in Fig. 2. Magnetic superstructure peaks are clearly visible at low scattering angles. However, these peaks cannot be indexed in the original space group using a single vector. The reason (made obvious from the positions of the Bragg spots in the single-crystal map, to be discussed in the following) is that pairs of satellites occur not only near allowed nuclear reflections but also, with even larger intensities, near positions which are forbidden by the centering of the unit cell. If one assumes a propagation vector , this would require treating the magnetic superstructure in the primitive orthorhombic lattice, although the nuclear reflections, measured in the same temperature range, give no indication of a symmetry lowering with respect to the space group. The latter was unambiguously assigned from accurate X-ray diffraction measurements at room temperature,Thiede et al. (1998); Sera et al. (2013a) and is confirmed for the present sample by the neutron data collected on 3T2 (Sect. II).
In fact, it turns out that a more correct description of the same diffraction pattern can be achieved within the original space group, provided one introduces two different wave vectors and . It is noteworthy that , where is a reciprocal lattice vector, and thus can be regarded as the third harmonic of . Its existence implies that significant squaring of the structure takes place. 333Strictly speaking, the term “squaring” applies to a non-sinusoidal periodic wave form and, by extension, to a magnetic structure consisting of -up–-down moment sequences. Here we use it in the sense of equal magnetic moments reaching full saturation value at . In the following, the notations and represent satellites associated with and (3rd harmonic), respectively (see, e.g., Fig. 2).
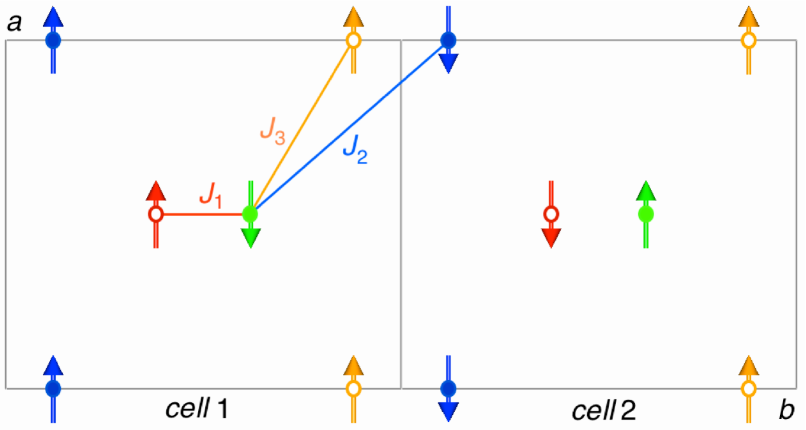
As a first step, since the diffraction pattern was measured significantly below , we have tentatively assumed that the structure consists of fully saturated Nd magnetic moments of equal size. In the primitive (single-) representation, it is easy to see that the wave vector implies four “+ + – –” sequences propagating along on four independent sublattices. We thus have carried out a systematic investigation of all possible phase relationships between the four magnetic sublattices that produce constant moments at the Nd sites and no net magnetization. From a total of 256, only 24 correspond to distinct magnetic structures, for which FullProf refinements have been performed. The best fit, represented by the solid line in Fig. 2, has a magnetic -factor of 19 (24) excluding (including) the contaminated regions denoted by stars in Fig. 2, and corresponds to the collinear structure represented in Fig. 3. The refinement is very sensitive to the orientation of the moments, which are undoubtedly parallel to the easy axis, as was inferred earlier from the bulk magnetization measurements.Kunimori et al. (2012) The magnetic -factor for the next best solution is 33 (36), indicating that the agreement with the experimental data is significantly worse. In particular, it completely fails to account for the strong intensity of the 010- peak near .
Returning to the two- description, it can first be noted that the Fourier representation of constant-moment structures with a periodicity of 4 unit cells along the direction necessarily involves the two vectors and . The solution obtained above can indeed be reproduced using Fourier components and with appropriate phases, namely
| (1) |
for the Nd atoms lying in the and planes, respectively. Here represents the coordinates of the th unit cell, and , are the (real) vector Fourier components associated with and . In this solution, full squaring is ensured by keeping the phases as above, and the ratio equal to . Under these conditions, the refinement obtained is the same as in the equivalent primitive description, displayed in Fig. 2, with Nd moments equal to 1.82(2) . The only notable discrepancy (apart from the contaminations near and 40∘, which already exist above and up to RT) is some overestimation of the intensity of the 001±3 magnetic satellite near 15.5∘(light-green trace in the figure). The component of the vector refines to 0.750(1) r.l.u., i.e. to 3/4 within experimental accuracy.
If the “full-squaring” condition is relaxed, the agreement with the measured data slightly improves for and (), mainly regarding the intensity of the 001±3 peak. This points to an incomplete squaring of the structure. Assuming (somewhat arbitrarily444the global phase cannot be deduced from a NPD experiment, which measures only the squared module of the magnetic structure factor.) that the phases remain the same as for the constant-moment solution, one gets two slightly different values, 1.68 and 1.92, for the moments at the Nd sites.
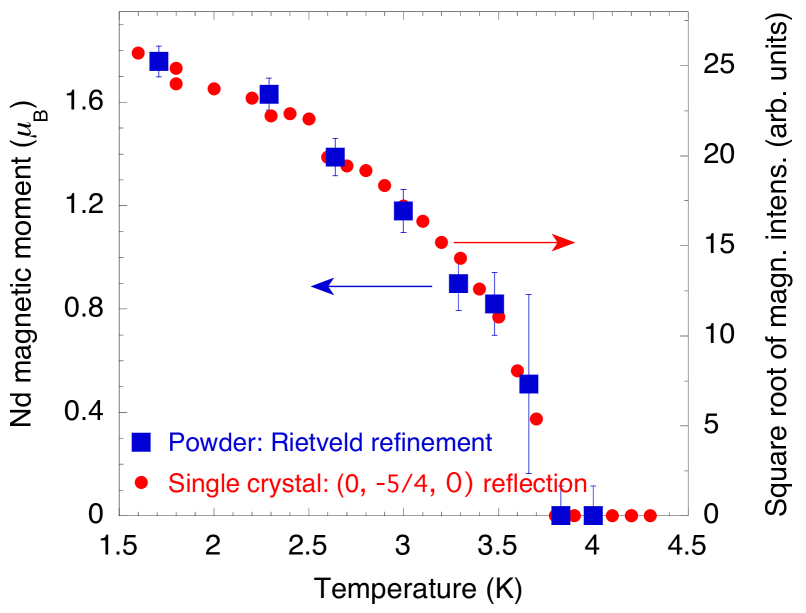
With increasing temperature, the magnetic signal decreases gradually, but no change is observed in the position of the peaks. At K, the refinement yields the same value , as at 1.7 K. The temperature dependence plotted in Fig. 4 shows that the Nd magnetic moment vanishes at the Néel temperature K. No anomaly is observed near the temperature of 2–2.5 K, at which anomalies were reported from previous experiments.Kunimori et al. (2012); Adroja et al. (2013); Tanida et al. (2014) Neither could any conclusive change in the relative intensities of the two Fourier components be ascertained, within experimental accuracy, because of the overall loss of magnetic intensity in the temperature range of interest.
III.2 Magnetic structure: single-crystal diffraction
Single-crystal experiments have been performed on 6T2 using the PSD at an incident neutron wavelength Å. Figure 5(a) shows a cut in the plane through the data measured at K. The nuclear peaks are observed at the positions ( even, even if ) corresponding to the reflection conditions for the space group, namely: , with if = 0. The violation observed for is ascribed to multiple scattering. Satellites are clearly visible at positions shifted by from nuclear peaks. However, even stronger magnetic reflections exist near extinct positions (0, . As mentioned in Sect. III.1, these satellites can be indexed either by artificially lowering the symmetry to primitive orthorhombic (with four independent Nd Bravais lattices) or, more correctly, staying in the space group (two Nd Bravais lattices), by introducing the extra wave vector .
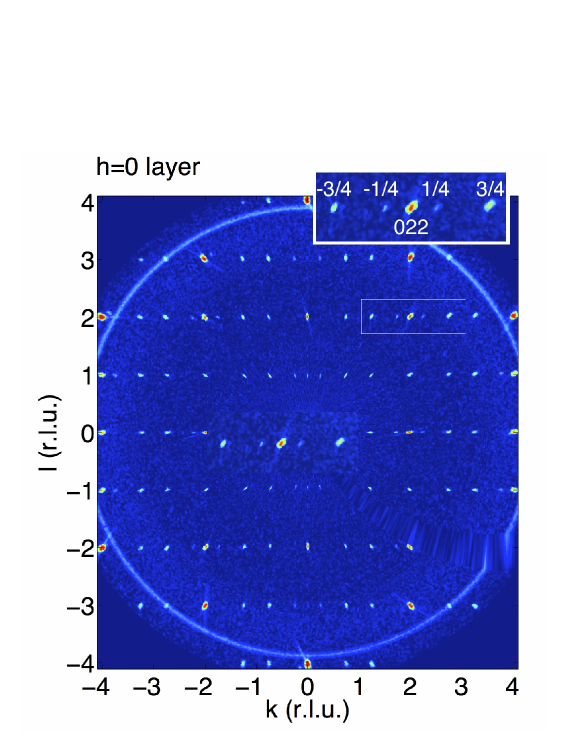
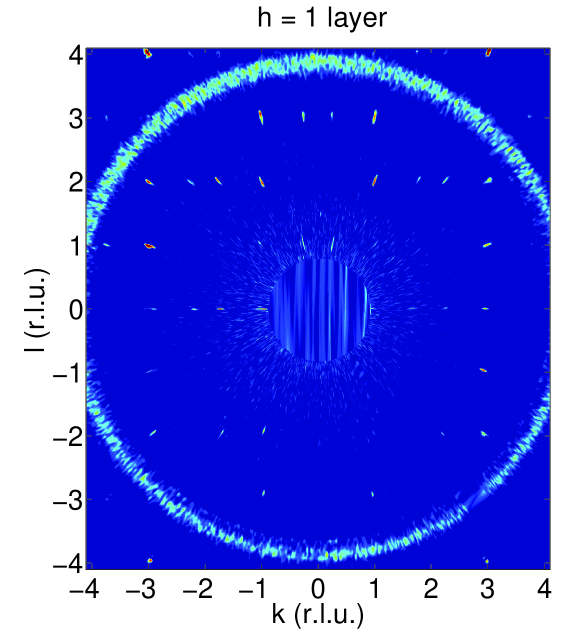
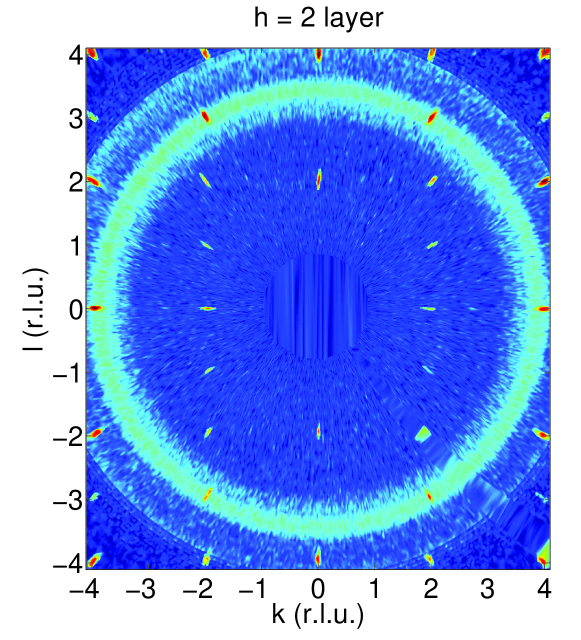
To study the higher layers and 2, it was necessary to use a shorter wavelength Å from the Cu monochromator so as to remain within the vertical opening of the cryomagnet and the solid angle covered by the detector. The maps measured at K for and 2 are shown in Figs. 5(b) and (c) (for , the results are consistent with those of Fig. 5(a), but only the stronger () satellites can be detected—see Fig. S1 of the Supplemental MaterialSup ). The map for is qualitatively similar to that for , but few satellites remain observable. For , nuclear reflection conditions reduce to “ odd”. Again, the stronger satellites occur near forbidden () reciprocal lattice points, as implied by the wave vector. These observations are fully consistent with the magnetic structure suggested above from the NPD results.
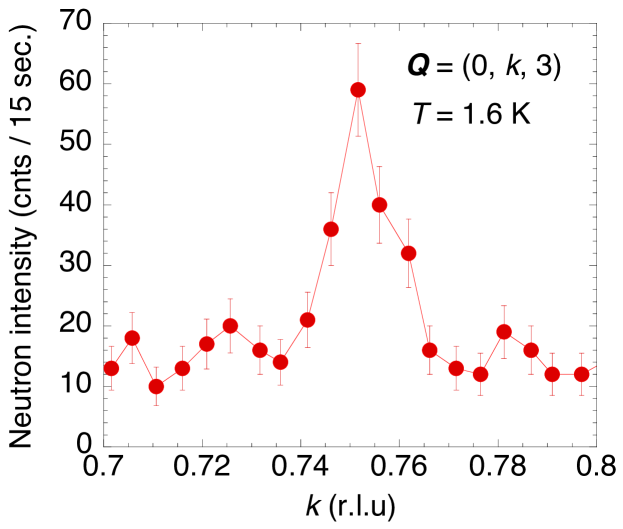
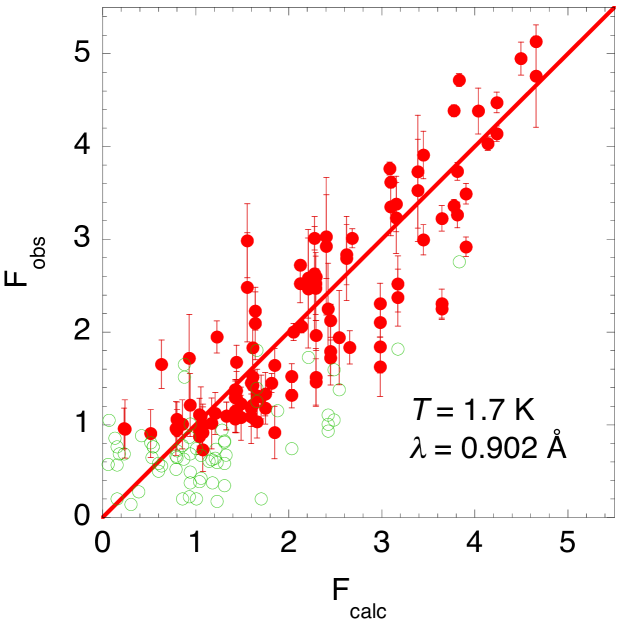
Measurements performed using the lifting counter further confirm the validity of this solution. The (0, , 3) longitudinal scan along the direction presented in Figure 6 demonstrates that the component of the vector is locked at the commensurate value 1/4. The integrated intensities of 178 nonequivalent magnetic reflections have been collected at the base temperature of 1.7 K by performing rocking curves through the nominal peak positions. Figure 7 shows that there is a good linear correlation between the measured (square root of the intensity corrected for the Lorentz factor) and , the component normal to the scattering vector of the calculated magnetic structure factor (including the magnetic form factor and corrected for extinction effects). The refinement has a reliability factor of 16% (all reflections included), and yields an ordered magnetic moment of 1.95(7) on the Nd ions, slightly larger than that obtained in the NPD measurements.
In Fig. 4, the square root of the integrated intensity of the magnetic reflection is shown to follow the temperature dependence of the Nd magnetic moment derived from the Rietveld refinements of the powder data (Sect. III.1). Despite the much smaller temperature step used here, in comparison with the NPD data (Sect. III.1), there is still no clear evidence for the second transition expected to occur near 2–2.5 K.
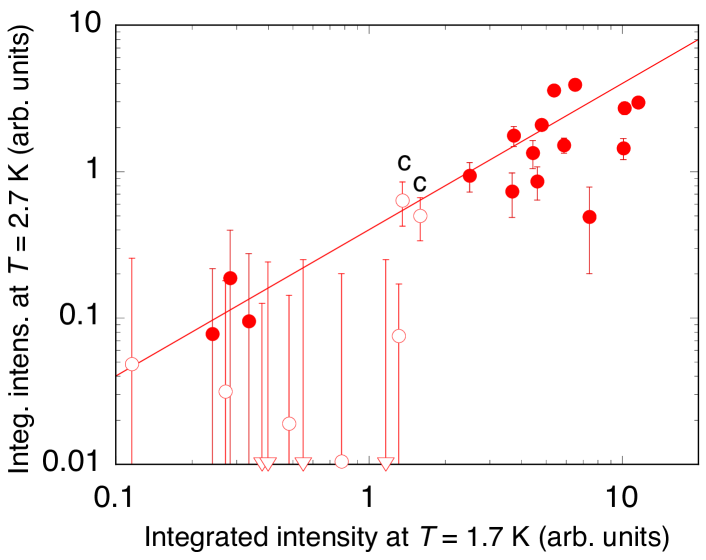
We have performed a data collection at K on a limited number of representative magnetic reflections associated with the two wave vectors and (see Fig. S2 of the Supplemental MaterialSup ). Their integrated intensities are plotted in Fig. 8 as a function of the corresponding values measured at 1.7 K. Different markers denote the data for and . Despite considerable scatter due to the low measured intensities, the results point to a complete suppression of the satellites, while sizable intensity remains in the satellites. This observation supports the interpretation of the transition reported previously as being due to a squaring of the magnetic structure. We note that a scan performed at K through the (0, , 3) Bragg peak did not show any deviation of the maximum from the commensurate position . It would now be interesting to trace the temperature dependences of selected reflections from the two subsets in the temperature range of interest.
III.3 Magnetic field effects
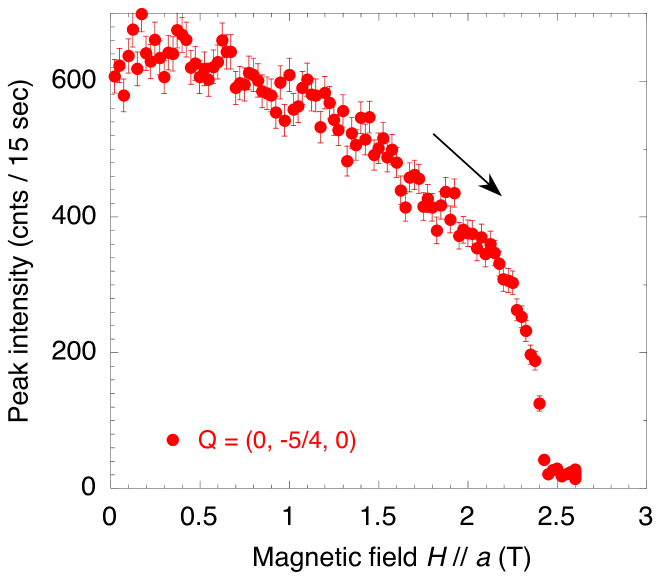
Single-counter measurements have been performed in magnetic fields of up to T applied along the axis (parallel to the ordered Nd moments). The peak intensity of the magnetic satellite () was traced in an increasing magnetic field at K (Fig. 9). One observes a steady decrease in the intensity, which drops to zero at about 2.45 T. In their magnetization measurements, Kunimori et al.,Kunimori et al. (2012) observed a steplike increase in at K for , at a transition field of T, in excellent agreement with the present data.
Integrated intensities were measured for a limited set of magnetic reflections in a field of 2.6 T. No residual intensity was detected, except for the ()- and ()-type reflections, which exhibit the same contamination as in the corresponding zero-field scans at K (Fig. 8 and Figs. S3 and S4 of the Supplemental MaterialSup ). No evidence was thus found for an intermediate ferrimagnetic phase of the type reported for TbFe2Al10.Reehuis et al. (2003).
IV Discussion and conclusion
In the previous sections, we have shown that the ordered magnetic structures formed in NdFe2Al10 below K can be described, in the crystallographic space group , using a double- representation with and . At the base temperature 1.6 - 1.7 K, the powder and single-crystal data are consistently accounted for by assuming a collinear () structure with constant magnetic moments of (NPD) or 1.95(7) (single-crystal diffraction), in good agreement with the value of calculated for the Nd3+ CF doublet ground state derived in Ref. Kunimori et al., 2012. This is in contrast with the simple antiferromagnetic order with reported previously for CeRu2Al10 and CeOs2Al10.Khalyavin et al. (2010); Robert et al. (2010); Mignot et al. (2011); Kato et al. (2011)
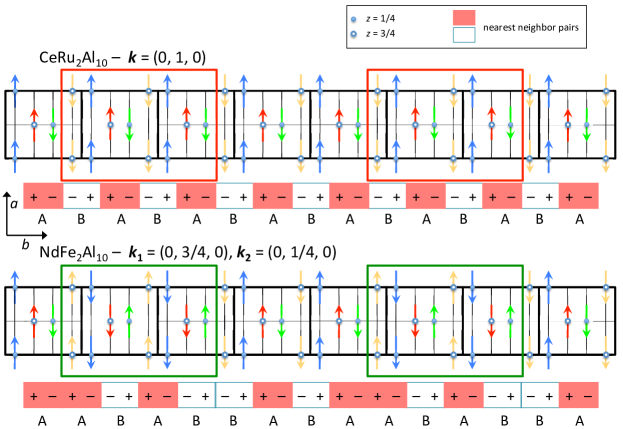
In intermetallic lanthanide compounds, couplings between magnetic moments are usually dominated by RKKY interactions, and the wave vector of the structure is thus sensitive to peculiarities of the Fermi surface, whose consideration is beyond the scope of this work. However, to try and quantify the competition between the 24 different constant-moment structures (Sect. III.1) consistent with the and wave vectors, we have calculated the corresponding exchange energies, assuming couplings extending to the third nearest neighbors (Fig. 3). The results show that the structure derived from the refinements is actually that which minimizes the energy () if all three couplings are AFM (taken here as ) and satisfy the two conditions (1), and (2). This seems reasonable since the distance to the first neighbors is much shorter than to the second and third neighbors.
It is easy to see in Fig. 3 that AFM couplings to the first and second neighbors ( and ) can be simultaneously satisfied if the spin sequence (from left to right) is changed to “+ + – – + + – –”, i.e. blue and red moments up, yellow and green moments down. This sequence actually corresponds to that observed in CeRu2Al10 and CeOs2Al10 (Fig. 10), except for the Ce moments being oriented parallel to , and can be described in the space group by the simple wave vector (0, 1, 0). In this structure, all third-neighbor pairs are ferromagnetic (FM) and, in Ref. Robert et al., 2012, magnetic excitation spectra of CeRu2Al10 in the AFM state could be reproduced assuming exchange interactions with (predominant and anisotropic) and AFM, and FM. It can be noted that, in the present (YbFe2Al10-typeNiemann and Jeitschko (1995)) structure, there is one transition-metal atom located between third-neighbor rare-earth ions, which may explain why can change significantly from one compound to another.
The structure determined above for NdFe2Al10 suggests that is now AFM. It can be obtained (Fig. 10) from the structure by flipping the moments in a block of 8 consecutive magnetic planes. The new sequence is identical to that shown in Fig 3. If one denotes the near-neighbor AFM pairs (forming alternating zigzag chains along ) as “+ –” and “– +”, it is clear that the change from ABABABAB to AABABBAB can be described by the introduction of periodic spin discommensurations (sometimes also termed “spin-slips”Cowley and Bates (1988)).
At the borders of one flipped block, couplings become frustrated (FM), whereas originally FM third-neighbor pairs become AFM. Correspondingly, the exchange energy changes from to , and the spin-block reversal thus results in a more stable structure provided is larger than . This, however, is in contradiction to condition (2) above. Therefore, while the comparison of exchange energies provides a hint as to why this particular {, } structure is favored with respect to others, it cannot explain simultaneously why a double- structure occurs in the first place, rather than antiferromagnetism existing in CeRu2Al10. An improved model, e.g. taking into account more distant neighbors and/or anisotropic couplings, is needed to solve this problem.
The commensurate structure of NdFe2Al10 has strong similarities with that previously observed by Reehuis et al.Reehuis et al. (2000, 2003) in TbFe2Al10 below 11 K. In the latter compound, the magnetic period along is equal to 5, rather than 4, unit cells and the order at base temperature was shown to result from the squaring of the sine-wave modulation which forms below . Using the same notation as above, that structure can be written as AABABAABAB, i.e. with a longer interval between discommensurations.555Another difference due to the different parity is that, unlike in NdFe2Al10, the two sublattices ( or ) now carry net magnetizations of opposite signs. Such steplike reversals of the moment direction likely represent the way in which the system achieves the magnetic period prescribed by long-range RKKY interactions while fulfilling local constraints embedded here in the phenomenological constants , , .
The existence of a second phase transition below , at about 2–2.5 K seems related to the appearance of the magnetic satellites associated with the wave vector . This wave vector can equivalently be written as and plays the same role of the third harmonic in squared “-up–-down” structures, by allowing the moments at all sites to reach full saturation as . Concerning the effect of a magnetic field at the lowest temperature, we find no indication of an intermediate spin-flip transition to a ferrimagnetic phase of the type reported in Ref. Reehuis et al., 2003 for TbFe2Al10. This is consistent with the existence of a single anomaly in the magnetic isotherm reported in Ref. Kunimori et al., 2012, in contrast to the two-step curve in the Tb case.Reehuis et al. (2003) The metamagnetic jump at T coincides with the suppression of all measured magnetic satellites in our single-crystal experiments, suggesting that the system directly reaches a fully polarized state.
Finally, it results from the above discussion that the contrast between the complex commensurate order occurring in NdFe2Al10 and the simple AFM one found previously in its cerium-ruthenium and cerium-osmium homologues could be explained by relatively minor changes in the magnitude of the exchange interactions, in particular the coupling between third neighbors. However, this similarity may be deceiving because the bulk of experimental evidence points to an unconventional mechanism of magnetic interactions in CeAl10 compounds, with a prominent role of anisotropic - hybridization. This should be the subject of future investigations.
Acknowledgements.
We are grateful to J.-L. Meuriot, Th. Robillard, J. Dupont, and X. Guillou for technical support during the experiments. K. S. was supported by a Japan Society for the Promotion of Science Research Fellowship.References
- Muro et al. (2009) Y. Muro, K. Motoya, Y. Saiga, and T. Takabatake, J. Phys. Soc. Jpn. 78, 083707 (2009).
- Nishioka et al. (2009) T. Nishioka, Y. Kawamura, T. Takesaka, R. Kobayashi, H. Kato, M. Matsumura, K. Kodama, K. Matsubayashi, and Y. Uwatoko, J. Phys. Soc. Jpn. 78, 123705 (2009).
- Strydom (2009) A. M. Strydom, Physica B 404, 2981 (2009).
- Kondo et al. (2011) A. Kondo, J. Wang, K. Kindo, Y. Ogane, Y. Kawamura, S. Tanimoto, T. Nishioka, D. Tanaka, H. Tanida, and M. Sera, Phys. Rev. B 83, 180415 (2011).
- Tanida et al. (2012) H. Tanida, Y. Nonaka, D. Tanaka, M. Sera, Y. Kawamura, Y. Uwatoko, T. Nishioka, and M. Matsumura, Phys. Rev. B 85, 205208 (2012).
- Kobayashi et al. (2011) R. Kobayashi, Y. Kawamura, T. Nishioka, H. Kato, M. Matsumura, K. Kodama, H. Tanida, M. Sera, K. Matsubayashi, and Y. Uwakoto, J. Phys. Soc. Jpn. Suppl. 80SA, SA044 (2011).
- Kunimori et al. (2012) K. Kunimori, M. Nakamura, H. Nohara, H. Tanida, M. Sera, T. Nishioka, and M. Matsumura, Phys. Rev. B 86, 245106 (2012).
- Robert et al. (2010) J. Robert, J.-M. Mignot, G. André, T. Nishioka, R. Kobayashi, M. Matsumura, H. Tanida, D. Tanaka, and M. Sera, Phys. Rev. B 82, 100404(R) (2010).
- Khalyavin et al. (2010) D. D. Khalyavin, A. D. Hillier, D. T. Adroja, A. M. Strydom, P. Manuel, L. C. Chapon, P. Peratheepan, K. Knight, P. Deen, C. Ritter, Y. Muro, and T. Takabatake, Phys. Rev. B 82, 100405(R) (2010).
- Mignot et al. (2011) J.-M. Mignot, J. Robert, G. André, A. M. Bataille, T. Nishioka, R. Kobayashi, M. Matsumura, H. Tanida, D. Tanaka, and M. Sera, J. Phys. Soc. Jpn. Suppl. 80SA, SA022 (2011).
- Robert et al. (2012) J. Robert, J.-M. Mignot, S. Petit, P. Steffens, T. Nishioka, R. Kobayashi, M. Matsumura, H. Tanida, D. Tanaka, and M. Sera, Phys. Rev. Lett. 109, 267208 (2012).
- Adroja et al. (2013) D. T. Adroja, A. D. Hillier, Y. Muro, T. Takabatake, A. M. Strydom, A. Bhattacharyya, A. Daoud-Aladin, and J. W. Taylor, Physica Scripta 88, 068505 (2013).
- Tanida et al. (2014) H. Tanida et al., (2014), unpublished.
- Reehuis et al. (2000) M. Reehuis, B. Fehrmann, M. W. Wolff, W. Jeitschko, and M. Hofmann, Physica B: Condensed Matter 276-278, 594 (2000).
- Reehuis et al. (2003) M. Reehuis, M. W. Wolff, A. Krimmel, E.-W. Scheidt, N. Stüsser, A. Loidl, and W. Jeitschko, Journal of Physics: Condensed Matter 15, 1773 (2003).
- Thiede et al. (1998) V. M. T. Thiede, T. Ebel, and W. Jeitschko, J. Mater. Chem. 8, 125 (1998).
- Sera et al. (2013a) M. Sera, D. Tanaka, H. Tanida, C. Moriyoshi, M. Ogawa, Y. Kuroiwa, T. Nishioka, M. Matsumura, J. Kim, S. Tsuji, and M. Takata, J. Phys. Soc. Jpn. 82, 024603 (2013a).
- Sera et al. (2013b) M. Sera et al., (2013b), unpublished.
- Rodriguez-Carvajal (1993) J. Rodriguez-Carvajal, Physica B 192, 55 (1993).
- Rodriguez-Carvajal (2001) J. Rodriguez-Carvajal, Commission on Powder Diffraction (IUCr) Newsletter 26, 12 (2001).
- Sears (1992) V. F. Sears, Neutron News 3, 26 (1992).
- Freeman and Desclaux (1979) A. Freeman and J. Desclaux, J. Magn. Magn. Mater. 12, 11 (1979).
- Gukasov et al. (2007) A. Gukasov, A. Goujon, J.-L. Meuriot, C. Person, G. Exil, and G. Koskas, Physica B: Condensed Matter 397, 131 (2007).
- (24) J. Brown and J. Matthewman, Cambridge Crystallography Subroutine Library, Report No. RAL93-009 (1993).
- Note (1) Strictly speaking, the term “squaring” applies to a non-sinusoidal periodic wave form and, by extension, to a magnetic structure consisting of -up–-down moment sequences. Here we use it in the sense of equal magnetic moments reaching full saturation value at .
- Note (2) The global phase cannot be deduced from a NPD experiment, which measures only the squared module of the magnetic structure factor.
- (27) See Supplemental Material at [URL] for a presentation of additional data sets (single-crystal intensity map, rocking curves through magnetic peaks at different temperatures and magnetic fields).
- Kato et al. (2011) H. Kato, R. Kobayashi, T. Takesaka, T. Nishioka, M. Matsumura, K. Kaneko, and N. Metoki, J. Phys. Soc. Jpn. Suppl. 80, 073701 (2011).
- Niemann and Jeitschko (1995) S. Niemann and W. Jeitschko, Z. Kristallogr. 210, 338 (1995).
- Cowley and Bates (1988) R. A. Cowley and S. Bates, J. Phys. C: Solid State Phys. 21, 4113 (1988).
- Note (3) Another difference due to the different parity is that, unlike in NdFe2Al10, the two sublattices ( or ) now carry net magnetizations of opposite signs.