Molecular-Atomic Transition in the Deuterium Hugoniot with Coupled Electron Ion Monte Carlo
Abstract
We have performed accurate simulations of the Deuterium Hugoniot using Coupled Electron Ion Monte Carlo (CEIMC). Using highly accurate quantum Monte Carlo methods for the electrons, we study the region of maximum compression along the principal Hugoniot, where the system undergoes a continuous transition from a molecular fluid to a monatomic fluid. We include all relevant physical corrections so that a direct comparison to experiment can be made. Around 50 GPa we found a maximum compression of 4.85, roughly 10% larger than previous theoretical predictions and experimental data but still compatible with the latter because of their large uncertainty.
The study of high pressure hydrogen is particularly interesting as progress in the field has come about from difficult experiments under extreme conditions and computationally expensive quantum simulations McMahon et al. (2012). Experiments on hydrogen under high pressure have direct implications for planetary science: laboratory setups attempt to recreate the extreme conditions which describe planetary formation and equilibrium properties of planetary interiors Stevenson (1982); Militzer et al. (2008); Nettelmann et al. (2008); Guillot (2005); Fortney (2004). Improvements from both theory and experiment have been essential to creating our current understanding of the hydrogen phase diagram Vorberger et al. (2007); Morales et al. (2010); Nellis (2006); Ross (1985). A key experimental technique to probe hydrogen under extreme conditions is dynamic compression via shock wave generation. The principal Hugoniot Rankine (1870); Johnson and Cheret (1998); Nellis (2006); Ross (1985) is determined by shocking a material from an initial state to a state of higher pressure, temperature, and density. The locus of points reachable in such an experiment is determined by conservation laws and initial conditions with few theoretical assumptions. Shock experiments often use deuterium instead of hydrogen as a means to reach higher overall pressures Knudson et al. (2004); Boriskov et al. (2005); Nellis (2002); Hicks et al. (2009); Grishechkin et al. (2004); Belov et al. (2002); Wang et al. (2010); van Thiel M. et al. (1973); Knudson et al. (2003); Knudson and Desjarlais (2009). Theoretical methods used so far to investigate this interesting region of phase diagram are based on density functional theory (DFT) which is expected to describe molecular dissociation and metallization with only limited accuracy.
In this work we present highly accurate quantum Monte Carlo (QMC) results for the crossover between the molecular liquid to monatomic liquid along the principal deuterium Hugoniot. We find that the maximum compression through this molecular dissociation crossover is 10% larger than previous predictions from DFT. Among the many computational methods used in high pressure electronic structure simulations, QMC is considered among the highest quality Grossman (2002); Tubman et al. (2011, 2012); Neuscamman (2013), with Fixed-Node Projector Quantum Monte Carlo being the most accurate Foulkes et al. (2001); Baroni and Moroni (1999); Shulenburger and Mattsson (2013); Clay et al. (2014); Krogel et al. (2014); Zheng and Wagner (2013); Foyevtsova et al. (2014); Azadi et al. (2014). The Coupled Electron Ion Monte Carlo method (CEIMC) Ceperley et al. (2002); Ceperley and Dewing (1999); Pierleoni and Ceperley (2006) uses QMC to determine the electronic ground state energy, with a finite temperature sampling of the nuclear coordinates on the resulting Born-Oppenheimer energy surface Born and Oppenheimer (1927); Tubman et al. (2014); Mitroy et al. (2013). This can be combined with other techniques such as DFT and variational Monte Carlo (VMC) for wave function generation, path integral Monte Carlo (PIMC) for the ions Ceperley (1995, 1996), correlated sampling for calculating energy differences Hammond et al. (1994), and Reptation Quantum Monte Carlo (RQMC) for calculating unbiased estimators Baroni and Moroni (1999), all of which are included in our simulations.
Deuterium Hugoniot: Shock experiments are used to determine the equation of state of a material that is in an initial state at a known energy, pressure and volume: (,,). The zeros of the Hugoniot function determines the final conditions ,, as
| (1) |
where is the atomic volume, is the internal energy/atom and is the pressure. We use initial conditions (0.167 g/cm3, 22K, 1.24GPa) matching some of the previous experiments Knudson et al. (2004). In atomic units this corresponds to a.u., Ha/atom. and .
| P(GPa) | rs | (gcm | T(10 | |
|---|---|---|---|---|
| 18(1) | 2.019(5) | 0.654(5) | 3.91(3) | 4 |
| 32(1) | 1.909(9) | 0.773(9) | 4.63(6) | 6 |
| 39(1) | 1.882(3) | 0.807(4) | 4.83(2) | 8 |
| 48(1) | 1.880(3) | 0.810(4) | 4.85(2) | 10 |
| 66(1) | 1.895(1) | 0.791(2) | 4.73(1) | 15 |
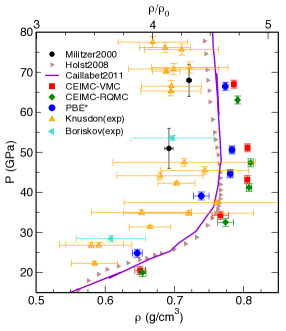
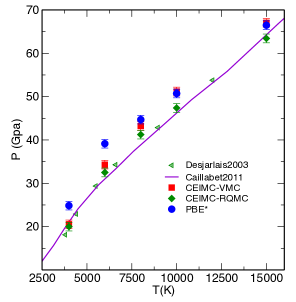
To calculate the Hugoniot in the region of interest, we perform simulation at fixed densities in the range and along isotherms in the range . Fitting at fixed T to a quadratic polynomial of we solve for . Our results are shown in Figure 1, Figure 2 and Table 1. The main result is the CEIMC-RQMC curve. The CEIMC-VMC and PBE* predictions are also results from this work and will be discussed later.
Previous theoretical results have been generated from a variety of different methods which include DFT, PIMC, and wave packet MD Desjarlais (2003); Holst et al. (2008); Caillabet et al. (2011); Militzer and Ceperley (2000); Filinov et al. (2001); Lenosky et al. (2000); Bonev et al. (2004); Khairallah et al. (2011); Knaup et al. (2003). So far DFT Hugoniots have been performed with the PBE functional; two of them are shown in the Hugoniot plots (Holst2008 Holst et al. (2008), and Caillabet2011 Caillabet et al. (2011)). The DFT studies generally show similar behavior, but other methods that involve different approximations generally do not agree with these results, especially in the crossover region. For instance, previous PIMC calculations Militzer and Ceperley (2000) with variational density matrix nodes show significantly different behavior in this region of phase space. The present calculation is unique in that we are able to control many of the relevant errors with a wave function based approach.
There are notable differences between previous DFT predictions and our results, especially when considering the maximum compressibility region between 8,000K and 10,000K. The DFT Hugoniots consistently show a maximum compression of 4.4, but both the VMC and RQMC results show a maximum compression of 4.85. It might be expected that most DFT functionals would struggle to capture the physics of this crossover, as the energies of bond breaking of just two hydrogen atoms are poorly described with many density functionals such as PBE. However, despite the differences between the QMC and DFT results, it is not clear that this is the origin of the discrepancy. The average distance between hydrogen atoms at these pressures is much smaller than that of traditional bond breaking physics and it is not clear how important issues of self-interaction and symmetry-breaking effects are for this transition.
There has been an extensive amount of experimental work in measuring the Hugoniot for deuterium Knudson et al. (2004); Boriskov et al. (2005); Nellis (2002); Hicks et al. (2009); Grishechkin et al. (2004); Belov et al. (2002); Wang et al. (2010); van Thiel M. et al. (1973); Knudson et al. (2003); Knudson and Desjarlais (2009) and hydrogen Nellis et al. (1995); Weir et al. (1996); Holmes et al. (1995); Nellis et al. (1983); Sano et al. (2010). Experimental results from Knudson et al. Knudson and Desjarlais (2009) and Boriskov et al. Boriskov et al. (2005) are plotted for comparison in Figure 1.
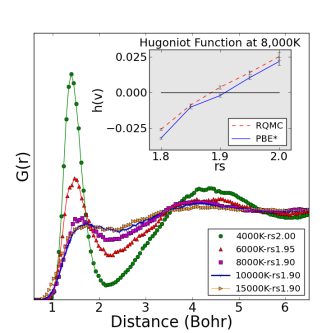
Evidence of the bond-breaking crossover is given in Fig. 3 where we present the proton-proton correlation function along the Hugoniot. The minimum temperature at which we observe the breaking of hydrogen molecules is density dependent. At the highest density in this work , a small increase in the temperature over 4,000K causes a transition to the monatomic phase whereas in the lowest density systems , the crossover does not occur until the system is above 10,000 K.
To establish the accuracy of our results, we now discuss the details of our simulations. It is crucial that the main part of our simulations, the QMC electronic structure calculations, are performed with high quality wave functions. The wave function form we use consists of a single Slater determinant for each spin component and a correlation part consisting of one, two, and three body Jastrows. We use DFT Kohn-Sham orbitals from quantum espresso package Giannozzi et al. (2009), for each configuration of the ions, in the Slater determinants. Analytical expressions from RPA for both correlation and backflow functions are employed Holzmann et al. (2003); Ceperley et al. (2002); Pierleoni et al. (2008); Ceperley and Alder (1987), which are complemented by empirical expressions, with a few variational parameters, that preserve the short and large distance limits Ceperley et al. (2002); Pierleoni et al. (2008). To mitigate the computational effort we optimize the wave function parameters over an ensemble of statistically independent configurations at a fixed density and at thermal equilibrium. We find that using this form of the wave function yields energies within 1mHa/atom of a full optimization of each configuration individually.
| Avg Err | 4000(K) | 6000 | 8000 | 10000 | 15000 | ||
|---|---|---|---|---|---|---|---|
| 1.8 | 2.7(3) | 3.2(3) | 3.4(3) | 3.6(3) | 4.1(3) | ||
| 1.85 | 3.0(3) | 3.2(3) | 3.6(3) | 3.8(3) | 4.5(3) | ||
| 1.9 | 3.2(3) | 3.5(3) | 3.9(3) | 4.5(3) | 4.6(3) | ||
| Rel Err | 4000(K) | 6000 | 8000 | 10000 | 15000 | ||
| 1.8 | 0.16(1) | 0.21(2) | 0.27(2) | 0.34(3) | 0.42(3) | ||
| 1.85 | 0.18(2) | 0.22(2) | 0.19(2) | 0.32(2) | 0.48(3) | ||
| 1.9 | 0.16(2) | 0.24(3) | 0.28(5) | 0.33(5) | 0.44(4) |
We perform simulation of systems of 54 protons and 54 electrons at fixed volume and temperature. CEIMC runs are performed with energy differences from VMC. To demonstrate the quality of our wave function we select a number of statistical independent configurations generated during the CEIMC run and compare VMC against RQMC energies, as shown in Table 2.
In order to calculate an accurate Hugoniot the errors in the energy and pressure need to be consistent across densities for a given temperature. This consistency is apparent in our data for all the temperatures considered in this work. Just as important, the largest discrepancy is less than 1 mHa/atom, which is small enough as to not influence the results beyond the final error bars on our calculated Hugoniot curves.
Additionally in Table 2 we report relative energy errors. The relative energies between configurations is important as it determines whether we are sampling an accurate thermal distribution for the ions. Table 2 shows that these relative energy differences are significantly less than 1 mHa/atom. To test the quality of our sampled distribution, we used reweighting Ceperley and H. (1979) at 8000K for rs=1.85,1.90 over 1500 nuclear configurations getting an efficiency of 0.5, high enough to testify the significant overlap of RQMC-generated and VMC-generated thermal distributions of the ions.
Approximations and corrections: Due to the nature of these simulations, there are other issues of accuracy beyond the electronic structure. In this section we discuss how we correct for the finite size of the simulation cell, thermal effects of the electrons, nuclear quantum effects, and corrections coming from RQMC.
The corrections for using a finite simulation cell can be divided into single particle and many particle effects. Single particle finite size effects can be accounted for by using twisted boundary conditions Lin et al. (2001). We used a fixed grid of () twisted angles. The many body finite size effects can be estimated Chiesa et al. (2006); Drummond et al. (2008) by extrapolating the small wave length limit of the charge-charge structure factor . The corrections comprises a kinetic energy contribution, , and a potential energy contribution . Corrections to the pressure can also be introduced Martin (2004), .
Corrections from electronic thermal effects are computed with PBE-DFT. Given a set of representative configurations, we have run DFT with a smearing of the electronic density over an ensemble of single particle orbitals weighted by the Fermi-Dirac distribution. Once the energies and pressures have been calculated in DFT, there are two types of corrections that can be made. The thermal DFT energy and pressure corrections can be added in directly to correct our QMC energies and pressures. The second correction involves reweighting the configurations with the electronic entropy term, , so as to incorporate the effects of using Mermin finite temperature DFT Mermin (1965). It is not clear in whether including these thermal corrections improve our estimates, as both the DFT band gaps and pressures are important in determining thermal effects. The problems with DFT band gaps is well studied Städele and Martin (2000); Chacham and Louie (1991); Chacham et al. (1992); Azadi and Foulkes (2013), and in the next section we show that the DFT pressure errors are significant. We have included the first correction by calculating the thermal effects on 50 configurations for each temperature/density considered in this work. We also tested re-weighting with the electronic entropy at 8000K and observed no effect within our error bars.
Nuclear quantum effects (NQE) can be explicitly taken into account with PIMC techniques. However because the temperatures considered are rather large and such calculations are computationally more expensive, we spot-checked with PIMC simulations at only two densities () and at T=8,000K. We found no effect on the energies and pressures within our error bars. Further we have estimated NQE at T=4,000K by the molecular zero point energy with fitted to the observed bond distribution Holst et al. (2008). Corrections to the energy and pressure are significant at this lower temperature but the global effect on the Hugoniot is within our present error bars.
Lastly, as previously mentioned, we perform VMC-CEIMC calculations and add in the RQMC energy and pressure as a correction. RQMC calculations of the energy and pressure are extrapolated to infinite projection time () and zero time step ().
| 8K-VMC | 10K-VMC | 8K-PBE | 10K-PBE | |||
|---|---|---|---|---|---|---|
| 1.8 | 2.8(2) | 2.8(2) | 6.4(2) | 6.3(2) | ||
| 1.85 | 2.3(2) | 2.7(2) | 3.1(2) | 3.7(2) | ||
| 1.9 | 2.7(2) | 3.6(2) | 6.1(3) | 5.7(3) |
| 8K-VMC | 10K-VMC | 8K-PBE | 10K-PBE | |||
|---|---|---|---|---|---|---|
| 1.8 | 3.4(3) | 3.6(3) | 4.0(3) | 3.7(3) | ||
| 1.85 | 3.6(3) | 3.8(3) | 3.6(3) | 4.2(3) | ||
| 1.9 | 3.9(3) | 4.5(3) | 4.2(3) | 3.5(3) |
A question that remains to be clarified is the origin of the differences between the PBE functional and QMC. The simulations described in this work involve a main QMC calculation of the energy and pressure before corrections are taken into account. We can replace the QMC calculation with PBE-DFT, as a test of how the functional behaves differently from our QMC results, while the finite size corrections and the thermal corrections remain fixed. Specifically we took a subset of our VMC-CEIMC configurations and used PBE-DFT to recalculate all the energies and pressures. All electron PBE calculations were performed with a sufficiently high plane wave cutoff (500 Ry) to converge the energies and pressures. We perform the PBE calculations at zero temperature and with the same k-point sampling that we used for our QMC twist averaging. With this data we recalculated the Hugoniot. The results are shown in the Figures 1 and 2 as PBE*. We are most interested in the temperatures at 8,000 K and 10,000 K where our CEIMC calculations exhibit the largest compression The PBE* curve at both these temperatures are less compressed (4.6), than our VMC/RQMC results. We can understand this result by considering the energy and pressure errors in Table 3 and Table 4 for our PBE and VMC. The VMC and PBE energy errors are actually quite close, and consistently agree within error bars for this part of the phase diagram. A trace of the energies for the individual configurations suggests that the two methods may generate very similar ensembles of ionic configurations. The change in the PBE* curve mainly comes from errors in the pressure as shown in Table 3. These pressure errors are more than twice as large as the VMC and their magnitude fluctuates significantly at different densities. This is in comparison to the VMC pressure errors which are not only smaller, but are consistent with the energy errors in such a way that the VMC and RQMC Hugoniot functions are very similar. A comparison of PBE* and the VMC/RQMC Hugoniot functions are plotted in the inset of Figure 3.
Discussion/Conclusions: In this work we have performed a calculation of the principal Hugoniot of deuterium in the region of the crossover between the molecular to atomic phase. Our results show that deuterium is more compressible than estimated on the basis of previous PBE-DFT simulations. We suggest that a large part of the difference arises from errors in the DFT pressures, and our results suggest that both energy and pressure errors become more significant at temperatures below 8000K. This represents one of the first works for dense hydrogen in which all the relevant physical effects were taken into account without the possibility for any large uncontrolled errors. In fact, algorithmic and computational advances in the last several years have been significant and we are in a position to improve upon many previous predictions in high pressure physics.
Acknowledgments: We thank L. Schulenburger, L. Benedict, W. Nellis, E. Brown, T. Mattsson, H. Changlani, I. Kylanpaa, and M. Knudson for useful discussions. This work was supported by DOE DE-NA0001789. NA0001789. CP was supported by the Italian Institute of Technology (IIT) under the SEED project Grant 259 SIMBEDD. Computer time was provided by XSEDE, supported by the National Science Foundation Grant No. OCI-1053575, and by PRACE projects 2011050781 and 2013091918.
References
- McMahon et al. (2012) J. M. McMahon, M. A. Morales, C. Pierleoni, and D. M. Ceperley, Rev. Mod. Phys. 84, 1607 (2012).
- Stevenson (1982) D. J. Stevenson, Annu. Rev. Earth. Pl. Sc. 10, 257 (1982).
- Militzer et al. (2008) B. Militzer, W. B. Hubbard, J. Vorberger, I. Tamblyn, and S. A. Bonev, Astrophys. J. Lett. 45, 688 (2008).
- Nettelmann et al. (2008) N. Nettelmann, B. Holst, A. Kietzmann, M. French, R. Redmer, and D. Blaschke, Astrophys. J. 683, 1217 (2008).
- Guillot (2005) T. Guillot, Annu. Rev. Earth Planet Sci. 33, 493 (2005).
- Fortney (2004) J. Fortney, Science 305, 1414 (2004).
- Vorberger et al. (2007) J. Vorberger, I. Tamblyn, B. Militzer, and S. Bonev, Phys. Rev. B 75, 024206 (2007).
- Morales et al. (2010) M. A. Morales, C. Pierleoni, E. Schwegler, and D. M. Ceperley, PNAS 107, 12799 (2010).
- Nellis (2006) W. Nellis, Rep. Prog. Phys. 69, 1479 (2006).
- Ross (1985) M. Ross, Rep. Prog. Phys. 48, 1 (1985).
- Rankine (1870) W. J. M. Rankine, Philos. T. R. Soc. Lond. 160, 277 (1870).
- Johnson and Cheret (1998) J. N. Johnson and R. Cheret, Classic Papers in Shock Compression Science: 1st Edition (Springer, 1998).
- Knudson et al. (2004) M. Knudson, D. Hanson, J. Bailey, C. Hall, J. Asay, and C. Deeney, Phys. Rev. B 69, 144209 (2004).
- Boriskov et al. (2005) G. Boriskov, A. Bykov, R. Il’Kaev, V. Selemir, G. Simakov, R. Trunin, V. Urlin, A. Shuikin, and W. Nellis, Phys. Rev. B 71, 092104 (2005).
- Nellis (2002) W. Nellis, Phys. Rev. Lett. 89, 165502 (2002).
- Hicks et al. (2009) D. Hicks, T. Boegly, P. Celliers, J. Eggert, S. Moon, D. Meyerhofer, and G. Collins, Phys. Rev. B 79, 014112 (2009).
- Grishechkin et al. (2004) S. Grishechkin, S. Gruzdev, V. Gryaznov, M. Zhernokletov, R. Il’Kaev, I. Iosilevskii, G. Kashintseva, S. Kirshanov, S. Manachkin, and V. Mintsev, JETP Lett+ 80, 398 (2004).
- Belov et al. (2002) S. Belov, G. Boriskov, A. Bykov, R. Il’Kaev, N. Luk’yanov, A. Matveev, O. Mikhailova, V. Selemir, G. Simakov, and R. Trunin, JETP Lett+ 76, 433 (2002).
- Wang et al. (2010) C. Wang, X. He, and P. Zhang, J. Appl. Phys. 108, 044909 (2010).
- van Thiel M. et al. (1973) van Thiel M., M. Ross, B. Hord, A. Mitchell, W. Gust, M. D’Addario, R. Keeler, and K. Boutwell, Phys. Rev. Lett. 31, 979 (1973).
- Knudson et al. (2003) M. Knudson, D. Hanson, J. Bailey, C. Hall, and J. Asay, Phys. Rev. Lett. 90, 35505 (2003).
- Knudson and Desjarlais (2009) M. Knudson and M. Desjarlais, Phys. Rev. Lett. 103, 225501 (2009).
- Grossman (2002) J. C. Grossman, J. Chem. Phys. 117, 1434 (2002).
- Tubman et al. (2011) N. M. Tubman, J. L. DuBois, R. Q. Hood, and B. J. Alder, J. Chem. Phys. 135, 184109 (2011).
- Tubman et al. (2012) N. M. Tubman, J. L. DuBois, and B. J. Alder, “Recent results in the exact treatment of fermions at zero and finite temperature,” in Advances in Quantum Monte Carlo (ACS, 2012) Chap. 5, pp. 41–50.
- Neuscamman (2013) E. Neuscamman, J. Chem. Phys. 139, 194105 (2013).
- Foulkes et al. (2001) W. M. C. Foulkes, L. Mitas, R. J. Needs, and G. Rajagopal, Rev. Mod. Phys. 73, 33 (2001).
- Baroni and Moroni (1999) S. Baroni and S. Moroni, Phys. Rev. Lett. 82, 4745 (1999).
- Shulenburger and Mattsson (2013) L. Shulenburger and T. R. Mattsson, Phys. Rev. B 88, 245117 (2013).
- Clay et al. (2014) R. C. Clay, J. Mcminis, J. M. McMahon, C. Pierleoni, D. M. Ceperley, and M. A. Morales, Phys. Rev. B 89, 184106 (2014).
- Krogel et al. (2014) J. T. Krogel, J. Kim, and F. A. Reboredo, Phys. Rev. B 90, 035125 (2014).
- Zheng and Wagner (2013) H. Zheng and L. K. Wagner, ArXiv e-prints (2013), arXiv:1310.1066 [cond-mat.str-el] .
- Foyevtsova et al. (2014) K. Foyevtsova, J. T. Krogel, J. Kim, P. R. C. Kent, E. Dagotto, and F. A. Reboredo, Phys. Rev. X 4, 031003 (2014).
- Azadi et al. (2014) S. Azadi, B. Monserrat, W. M. C. Foulkes, and R. J. Needs, Phys. Rev. Lett. 112, 165501 (2014).
- Ceperley et al. (2002) D. Ceperley, M. Dewing, and C. Pierleoni, in Bridging Time Scales: Molecular Simulations for the Next Decade, Lecture Notes in Physics, Vol. 605, edited by P. Nielaba, M. Mareschal, and G. Ciccotti (Springer-Verlag, Berlin, 2002) p. 473.
- Ceperley and Dewing (1999) D. M. Ceperley and M. Dewing, J. Chem. Phys. 110, 9812 (1999).
- Pierleoni and Ceperley (2006) C. Pierleoni and D. M. Ceperley, Lecture Notes in Physics 714, 641 (2006).
- Born and Oppenheimer (1927) M. Born and J. Oppenheimer, Ann. Physik. 84, 457 (1927).
- Tubman et al. (2014) N. M. Tubman, I. Kylänpää, S. Hammes-Schiffer, and D. M. Ceperley, ArXiv e-prints (2014), arXiv:1407.3788 [physics.chem-ph] .
- Mitroy et al. (2013) J. Mitroy, S. Bubin, W. Horiuchi, Y. Suzuki, L. Adamowicz, W. Cencek, K. Szalewicz, J. Komasa, D. Blume, and K. Varga, Rev. Mod. Phys. 85, 693 (2013).
- Ceperley (1995) D. M. Ceperley, Rev. Mod. Phys. 67, 279 (1995).
- Ceperley (1996) D. M. Ceperley, in Monte Carlo and Molecular Dynamics of Condensed Matter Systems, edited by K. Binder and G. Ciccotti (Editrice Compositori, Bologna, 1996).
- Hammond et al. (1994) B. L. Hammond, P. J. Reynolds, and W. A. Lester, Monte Carlo Methods in Ab Initio Quantum Chemistry (World Scientific, 1994).
- Holst et al. (2008) B. Holst, R. Redmer, and M. Desjarlais, Phys. Rev. B 77, 184201 (2008).
- Caillabet et al. (2011) L. Caillabet, S. Mazevet, and P. Loubeyre, Phys. Rev. B 83, 094101 (2011).
- Militzer and Ceperley (2000) B. Militzer and D. M. Ceperley, Phys. Rev. Lett. 85, 1890 (2000).
- Desjarlais (2003) M. P. Desjarlais, Phys. Rev. B 68, 064204 (2003).
- Filinov et al. (2001) V. S. Filinov, M. Bonitz, W. Ebeling, and V. E. Fortov, Plasma Physics and Controlled Fusion 43, 743 (2001).
- Lenosky et al. (2000) T. J. Lenosky, S. R. Bickham, J. D. Kress, and L. A. Collins, Phys. Rev. B 61, 1 (2000).
- Bonev et al. (2004) S. A. Bonev, B. Militzer, and G. Galli, Phys. Rev. B 69, 014101 (2004).
- Khairallah et al. (2011) S. Khairallah, J. Shumway, and E. Draeger, Arxiv preprint arXiv:1108.1711 (2011).
- Knaup et al. (2003) M. Knaup, P. Reinhard, C. Toepffer, and G. Zwicknagel, J. Phys. A-Math. Gen. 36, 6165 (2003).
- Nellis et al. (1995) W. Nellis, M. Ross, and N. Holmes, Science 269, 1249 (1995).
- Weir et al. (1996) S. Weir, A. Mitchell, and W. Nellis, Phys. Rev. Lett. 76, 1860 (1996).
- Holmes et al. (1995) N. C. Holmes, M. Ross, and W. J. Nellis, Phys. Rev. B 52, 15835 (1995).
- Nellis et al. (1983) W. J. Nellis, A. C. Mitchell, M. van Thiel, G. J. Devine, and R. J. Trainor, J. Chem. Phys. 79, 1480 (1983).
- Sano et al. (2010) T. Sano, N. Ozaki, T. Sakaiya, K. Shigemori, M. Ikoma, T. Kimura, K. Miyanishi, T. Endo, A. Shiroshita, and H. Takahashi, Journal of Physics: Conference Series 244, 042018 (2010).
- Giannozzi et al. (2009) P. Giannozzi, S. Baroni, N. Bonini, M. Calandra, R. Car, C. Cavazzoni, D. Ceresoli, G. L. Chiarotti, M. Cococcioni, I. Dabo, A. Dal Corso, S. de Gironcoli, S. Fabris, G. Fratesi, R. Gebauer, U. Gerstmann, C. Gougoussis, A. Kokalj, M. Lazzeri, L. Martin-Samos, N. Marzari, F. Mauri, R. Mazzarello, S. Paolini, A. Pasquarello, L. Paulatto, C. Sbraccia, S. Scandolo, G. Sclauzero, A. P. Seitsonen, A. Smogunov, P. Umari, and R. M. Wentzcovitch, Journal of Physics: Condensed Matter 21 (2009).
- Holzmann et al. (2003) M. Holzmann, D. M. Ceperley, C. Pierleoni, and K. Esler, Phys. Rev. E 68, 046707 (2003).
- Pierleoni et al. (2008) C. Pierleoni, K. T. Delaney, M. A. Morales, D. M. Ceperley, and M. Holzmann, Comput. Phys. Commun. 179, 89 (2008).
- Ceperley and Alder (1987) D. M. Ceperley and B. J. Alder, Phys. Rev. B 36, 2092 (1987).
- Ceperley and H. (1979) D. Ceperley and K. M. H., in Monte Carlo Methods in Statistical Physics, edited by K. Binder (Springer-Verlag, 1979) p. 145.
- Lin et al. (2001) C. Lin, F. H. Zong, and D. M. Ceperley, Phys. Rev. E 64, 016702 (2001).
- Chiesa et al. (2006) S. Chiesa, D. M. Ceperley, R. M. Martin, and M. Holzmann, Phys. Rev. Letts 97, 076404 (2006).
- Drummond et al. (2008) N. Drummond, R. J. Needs, A. Sorouri, and M. Foulkes, Phys. Rev. B 78, 125106 (2008).
- Martin (2004) R. M. Martin, Electronic Structure: Basic theory and practical methods (Cambridge University Press, 2004).
- Mermin (1965) N. D. Mermin, Phys. Rev. 137, A1441 (1965).
- Städele and Martin (2000) M. Städele and R. M. Martin, Phys. Rev. Lett. 84, 6070 (2000).
- Chacham and Louie (1991) H. Chacham and S. G. Louie, Phys. Rev. Lett. 66, 64 (1991).
- Chacham et al. (1992) H. Chacham, X. Zhu, and S. G. Louie, Phys. Rev. B 46, 6688 (1992).
- Azadi and Foulkes (2013) S. Azadi and W. M. C. Foulkes, Phys. Rev. B 88, 014115 (2013).