Pair Cascades in the Disk Environment of the Binary System PSR B1259-63/LS 2883.
Abstract
PSR B1259-63/LS 2883 is a very high energy (VHE; GeV) -ray emitting binary consisting of a 48 ms pulsar orbiting around a Be star with a period of years. The Be star features a circumstellar disk which is inclined with respect to the orbit in such a way that the pulsar crosses it twice every orbit. The circumstellar disk provides an additional field of target photons which may contribute to inverse Compton scattering and -absorption, leaving a characteristic imprint in the observed spectrum of the high energy emission. At GeV energies, the source was detected for the first time during the previous periastron passage which took place on December 15, 2010. The Fermi Large Area Telescope (LAT) reported a spectacular and unexpected -ray flare occurring around 30 days after periastron and lasting for about 7 weeks. In this paper, we study the signatures of Compton-supported, VHE -ray induced pair cascades in the circumstellar disc of the Be star and their possible contribution to the GeV flux. We show that cascade emission generated in the disk cannot be responsible for the GeV flare, but it might explain the GeV emission observed close to periastron. We also show that the -absorption in the disk might explain the observed TeV light curve.
keywords:
Binaries: PSR B1259-63/LS 2883 , radiation mechanisms: non-thermal , gamma-rays1 Introduction
PSR B1259-63/LS 2883 is a member of the small class of very high energy (VHE; GeV) -ray binaries which comprises only five known objects. PSR B1259-63/LS 2883 is unique for being the only -ray binary for which the compact object is clearly identified as a pulsar. This pulsar with a spin period of ms and a spin-down luminosity of erg s-1 is moving in a highly eccentric () orbit around a massive Be star with a period of years (1237 days) (Johnston et al., 1992a, b). The companion star LS 2883 has a luminosity of erg s-1. Because of the fast rotation of the star, it has an oblate shape with an equatorial radius of and a polar radius of , which in turn leads to a strong gradient of the surface temperature from K at the equator to K at the poles (Negueruela et al., 2011).
The Be star features an equatorial circumstellar disk, which is believed to be inclined with respect to the pulsar’s orbit (see e.g. Negueruela et al., 2011), so that the pulsar crosses the disk twice each orbit. The circumstellar disk of a Be star is a decretion disk with an enhanced stellar outflow formed around the star. As shown in optical interferometry observations, these disks are symmetrical with respect to the star’s rotation axis (see e.g., Quirrenbach et al., 1994). Circumstellar disks generate excess infrared (IR) emission produced through free-free and free-bound radiation, providing an additional IR photon field to the blackbody flux from the optical star.
The dense medium of the disk is believed to play an essential role in the resulting emission from the system. The position of the disk can be localized based on the disappearance of the pulsed radio emission from the pulsar. The observed radio emission far from periastron consists only of the pulsed component (Johnston et al., 1999, 2005), but closer to periastron, at about d ( is the time of periastron), the intensity of the pulsed emission starts to decrease and completely disappears at about d. It then re-appears at around d. This eclipse of the pulsed emission is believed to be caused by the circumstellar disk. It is accompanied by an increase of the transient unpulsed radio flux beginning at d and reaching its maximum at d. This is followed by a decrease around the periastron passage and a second peak at about d (Johnston et al., 1999, 2005; Chernyakova et al., 2014). A similar behavior is observed also for the unpulsed X-ray emission. Close to the periastron passage the X-ray emission features two peaks at around 20 days before and after periastron with flux levels 10 – 20 times higher than during apastron, and a decrease of the emission at the time of the periastron passage itself. The X-ray data is very similar from orbit to orbit repeating the shape of the light curve very well (Chernyakova et al., 2014, and references therein). These peaks might be connected to the crossing of the disk environment.
At TeV energies the source was observed by H.E.S.S. around three periastron passages in 2004 (Aharonian et al., 2005), 2007 (Aharonian et al., 2009) and 2010 (H.E.S.S. Collaboration et al., 2013). The TeV emission from the source shows a variable behavior around the periastron passage. Although the exposure of the source is not sufficient to draw firm conclusions, the combined light curves from all three observing campaigns show a hint of two asymmetrical peaks before and after periastron, which roughly coincide in time with the peaks of the emission in the radio and X-ray bands, and a decrease of the flux at periastron. This enhancement of the flux before and after periastron might be induced by the interaction of the pulsar with the dense photon field region inside the circumstellar disk.
First observations at GeV energies conducted by Fermi-LAT took place around the 2010 periastron passage revealing quite unexpected results (Abdo et al., 2011; Tam et al., 2011). Fermi-LAT detected a low flux from the source close to periastron with a subsequent dissapearance of the source after periastron followed by a sudden flare (with times the pre-periastron flux level) 30 days after periastron. This flare lasted for about 7 weeks without any obvious counterparts at other energy bands. The flare is shifted in time with respect to the post-periastron peak at other energy bands. The nature of the flare is still not understood, but several possible explanations have been discussed in the literature. Khangulyan et al. (2012) proposed that the GeV flare might be the result of inverse Compton (IC) scattering of stellar and circumstellar disk photons by the unshocked pulsar wind. The model suggests that right after the pulsar escapes the circumstellar disk, the sharp decrease of the ram pressure rapidly increases the unshocked pulsar wind zone towards the observer which, assuming that the density of the seed photons is still high, results in the observed GeV flare. The enhancement of the GeV emission is not observed in the pre-periastron phase due to an unfavourable geometry. Another possible explanation of the GeV flare can be the Doppler boosting of the radiation created by the shocked pulsar wind (Bogovalov et al., 2008; Dubus et al., 2010; Kong et al., 2012). However, this scenario is problematic because the Doppler boosting should affect the emission in all energy bands, but no counterparts of the GeV flare at other energy bands were detected. Kong et al. (2012) tried to solve this problem by assuming a specific anisotropy of the pulsar wind with different emission behaviors in different regions of the termination shock. Dubus and Cerutti (2013) suggested that the GeV flare may be generated by IC scattering of the X-ray photons from the pulsar wind nebula instead of the stellar photons. In this model, the lightcurve naturally peaks after the periastron as the cone of shocked material passes through the line of sight. However, the model does not explain the delay between the GeV flare and the post-periastron X-ray peak. It should be noted that all the proposed models suggest that the flare occurs due to geometrical effects
The circumstellar disk of the companion star plays a crucial role in the variability of the -ray emission from the system. The dense disk photon field should significantly contribute to the target photons for inverse Compton scattering from the source, enhancing the observed TeV emission. The abrupt change of density at the pulsar’s entrance and escape from the disk should also cause a change of the shape of the shock between the pulsar wind and stellar environment, which might be the reason of such spectacular events as the GeV flare. The high density of seed photons should also increase the opacity for -absorption, followed by electron-positron pair production, which in turn might scatter again the disk photon field, generating secondary -rays. This cascade process may cause the re-emission of the TeV IC flux at lower GeV energies. Moreover, because of the deflection of electrons and positrons in the magnetic field, secondary -rays can be re-emitted into randomized directions. Therefore, even if the primary VHE photon was emitted into the direction opposite to the line of sight to the observer, it can still contribute to the observable flux at lower GeV energies through the cascade emission. The pair cascade emission in binary systems caused by the interaction of the primary very high energy photons with the stellar photons was studied in detail for several cases (see e.g. Sierpowska and Bednarek, 2005; Cerutti et al., 2010, and references therein). These studies showed that, although environments of the binary systems fulfill all the requirements for effective pair cascading, the resulting spectrum is in conflict with the GeV data observed by Fermi-LAT, since the expected cascade emission peaks in the Fermi-LAT energy band with very constraining upper limits. The -absorption of the TeV -rays by stellar photons was also suggested as a possible explanation of the variability of the TeV flux across the orbit (Dubus, 2006). The idea is that at periastron, when the pulsar is at the shortest distance to the star, the absorption should be the most effective, which would provide the decrease of the flux. However, Dubus (2006) showed that absorption only cannot explain the TeV light curve.
In this study we investigate the possibility of pair cascading in the binary system PSR B1259-63/LS 2883 induced by the interaction with the circumstellar disk photons alone without taking into account the stellar wind from the companion star. We numerically evaluate the contribution of the cascade emission produced in the circumstellar disk to the overall spectrum. The comparison of the resulting modified spectrum with the observational data may be used to probe the circumstellar disk environment.
2 Model Setup
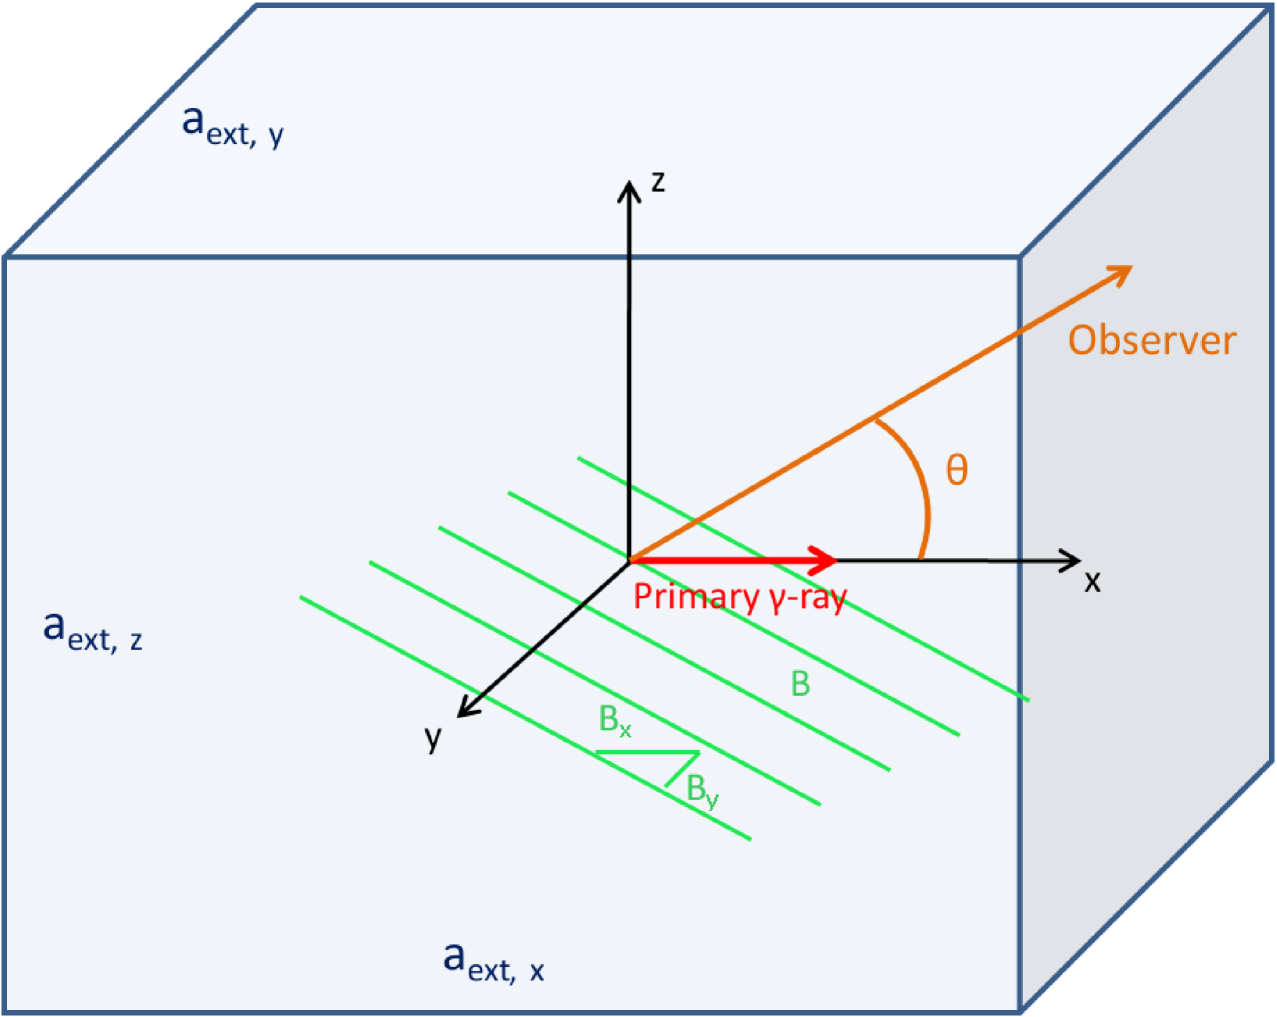
The geometry of the model setup is illustrated in Fig. 1. In order to be able to isolate all geometric effects, we represent the primary VHE emission as a mono-directional beam and define the x-axis as the direction of propagation of the primary VHE -rays. The VHE -ray spectrum is described by a power law with an exponential cut-off,
| (1) |
where is the photon energy, is the spectral index, and is the cut-off energy. For an initial, general study we assume that the primary -rays interact via -absorption and pair production with the disk photons, approximated by an isotropic thermal blackbody radiation field within fixed spatial boundaries given by a cuboid with side lengths , and , i.e.,
| (2) |
where is the target photon frequency, is the Planck constant, is the Boltzman constant, is the speed of light, is the temperature and is a normalization factor chosen to obtain a total radiation energy density
| (3) |
We choose the y- and z-axes of the coordinate system in a way that the magnetic field B lies in the xy-plane.
For our cascade simulations, we have adapted the Monte Carlo code developed by Roustazadeh and Böttcher (2010, 2012) to our chosen disk geometry. The code calculates -absorption and pair production using the full analytical solution to the pair production spectrum of Böttcher and Schlickeiser (1997) under the assumption that the produced electron and positron travel along the direction of propagation of the incoming VHE photon. The trajectories of particles are followed in full three-dimensional geometry. Inverse Compton scattering is evaluated using a head-on approximation, assuming that the scattered photon travels along the direction of motion of the electron/positron at the time of scattering. Compton and synchrotron losses are properly taken into account. Tables for the absorption opacity , Compton scattering length and Compton cross section for dense grids of photon energy, electron energy, and interaction angle are pre-calculated before the start of simulations, in order to save CPU time. The simulation produces a photon event file containing the energy, statistical weight, and propagation direction of every photon which escapes the cuboid target photon region. A separate post-processing routine is used to extract the angle-dependent photon spectra with arbitrary energy and angular binning.
3 Application to PSR B1259-63/LS 2883
3.1 Model Assumptions
PSR B1259-63/LS 2883 is a rather complicated source for modeling due to the variety of different physical processes which may take place in the system. The binary system consists of the pulsar and the massive Be star which produces a stellar wind and features a dense equatorial circumstellar disk. The interaction of the pulsar wind with the stellar wind and/or circumstellar disk of the companion star results in the creation of a termination shock between the two winds. Relativistic leptons (electrons and positrons) injected by the pulsar can be accelerated and isotropised at the termination shock and subsequently interact with the stellar radiation fields (stellar wind and circumstellar disk) producing very-high-energy -rays via inverse Compton scattering. These primary -rays can be absorbed in the stellar radiation fields producing electron-positron pairs, which in turn propagate in the stellar magnetic field and further scatter stellar and circumstellar disk photons producing the second generation of -rays. This cascade will continue until the lepton does not have enough energy to produce another secondary photon and/or the -ray escapes from the system. To provide a first general study of the pair cascades generated in the disk environment we will use several assumptions to constrain the stellar-pulsar wind interaction, the stellar radiation field, and the magnetic field structure.
The location of the wind termination shock can be estimated from the winds’ ram pressure ratio (Ball and Kirk, 2000), where is the pulsar spin-down luminosity and and are the stellar wind mass-loss rate and the stellar wind velocity at the interaction position. Wind characteristics are different in the polar and equatorial regions. The polar stellar wind has a relatively low density and high velocity, while the equatorial wind is much denser and slower. This difference results in the different geometry of the wind interaction in different orbital phases. For known the distance from the pulsar to the termination shock is given by
| (4) |
where is the separation distance between the star and the pulsar. According to Vink et al. (2000) the mass and effective temperature of LS 2883 correspond to the mass-loss rate of (in the polar region) depending on the assumed vaule of the ratio respectively, where is the terminal velocity of the wind at infinity and is the effective escape velocity. In the polar region the wind velocity can be aproximated by the profile
| (5) |
where is the distance from the star. Assuming km s-1 and (see e.g. Sierpowska-Bartosik and Bednarek, 2008, and references therein), km s-1 (McCollum, 1993), and the separation distance at periastron of , the polar wind velocity is km s-1. Then the parameter for the periastron passage is and the distance to the termination shock is equal to . When the pulsar crosses the circumstellar disk the ram pressure ratio will be much smaller due to the much higher value of the mass-loss rate, which in equatorial region is about (Sierpowska-Bartosik and Bednarek, 2008, and references therein). The equatorial wind velocity described by
| (6) |
at the corresponding distance of (the separation distance at days after periastron (see e.g. van Soelen et al., 2012) is, however, comparable to the one at periastron. Therefore, in the disk is lower than at periastron resulting in the distance to the termination shock of . Moreover, the inclination angle of the equatorial disk to the orbital plane is argued to be rather small, at about ∘ (Melatos et al., 1995, see below), i.e. even at periastron the environment should be influenced by the dense equatorial wind resulting in a lower value of . Therefore, we decide that for our simulations the source can be assumed point-like neglecting the distance from the pulsar to the termination shock, where the electrons and positrons are accelerated.
Both stellar raditation fields (stellar wind and circumstellar disk) are expected to contribute to the Comptonization by relativistic leptons. However, the contribution of these two radiation fields is different in different regions of the system and different orbital phases, i.e. the location of the pulsar within the system. The energy density of the stellar radiation can be estimated as
| (7) |
This corresponds to erg cm-3 in the vicinity of the pulsar when the pulsar is at periastron and to erg cm-3 when the pulsar is in the disk (20 days after periastron). If the energy density of the disk photons is higher than the stellar photon energy density in the same region, we can neglect the contribution of the stellar photons to the -absorption and to the IC scattering, and consider circumstellar disk radiation as the only source of target photons. The binary separation at days provides a lower limit for the disk radius of , where radius of the star is (van Soelen et al., 2012), i.e. cm. Circumstellar disks of Be stars are believed to be very thin (see Rivinius et al., 2013, and references therein). In recent theoretical works on PSR B1259-63/LS 2883, a value of ∘∘ was adopted for the disk half-opening angle (Okazaki et al., 2011; Takata et al., 2012; van Soelen et al., 2012), which corresponds to a width of cm at the distance of . The fit of the dispersion and rotation measures suggests a small value of the inclination angle of the disk with respect to the orbit of about ∘ (Melatos et al., 1995). Although this fit requires a quite high value of the magnetic field strength at the star surface of kG (Walder et al., 2012), larger disk inclincation angles require an even stronger magnetic field. Therefore the inclination angle is expected to be small ∘. However, it should be noted that other values, such as ∘ and ∘, were also considered in theoretical modeling of the system by different authors (see e.g. Okazaki et al., 2011; van Soelen et al., 2012). Assuming the inclination angle of the disk is ∘ and the disk half-opening angle is ∘, the path length of the pulsar inside the disk at the distance of from the star would be cm. A temperature of the disk of is usually assumed (Okazaki et al., 2011; Takata et al., 2012; van Soelen et al., 2012), which corresponds to K for K. Here we approximate the disk by a grey-body with the energy density and temperature , the shape of the disk region we approximate by a cuboid with side lengths cm, cm, and cm. The value of is constrained by the total lumonosity of the star , i.e.
| (8) |
where is the effective surface of the disk. In the following, we assume the circumstellar disk energy density in the range of
| (9) |
which allows us to neglect the contribution of the stellar photons to the considered physical processes.
The magnetic field in the wind of the massive star has a complicated structure which depends on the distance from the star (see e.g. Sierpowska and Bednarek, 2005, and references therein). In the region very close to the stellar surface the magnetic field has a dipolar structure. At a distance characterized by the Alfven radius the radial component of the magnetic field starts to dominate due to the ionized plasma. Finally, at larger distances, the magnetic field becomes toroidal due to the rotation of the star. The strength of the magnetic field as a function of distance from the star is given by (Usov and Melrose, 1992)
where is the transition radius to a toroidal field defined by the ratation velocity of the star and the terminal velocity as . For LS 2883 km s-1 (Negueruela et al., 2011) and km s-1 (McCollum, 1993) implying . In PSR B1259-63/LS 2883 the pulsar is never coming this close to the Be star, therefore we can safely assume that the region where the cascades can efficiently develop is dominated by a magnetic field with a toroidal structure. Moreover, when the pulsar is inside the disk at a large distance from the star ( cm) and with a relatively short path within the disk () the magnetic field can be assumed mono-directional. Characteristic lengths of the -absorption and IC scattering are lower than the curvature radius of the magnetic field which is equal to the distance to the star. Mean free path of the -absorption process can be estimated as
| (10) |
where denotes normalized photon energy. Using the delta-function approximation of the cross section one can make a rough estimate of the mean free path for the primary photon with energy GeV
| (11) |
Similarly, the characteristic length of the IC scattering in the Thomson regime can be estimated as
| (12) |
The strength of the surface magnetic field for Be stars is about G (Walder et al., 2012). For these values of the Alfven radius is equal to . Then at the distance of the strength of the magnetic field is of the order of G. To be on the safe side, we decided to consider a wider range of different values of magnetic field of G in our calculations.
3.2 Numerical results
We used the cascade Monte Carlo code described above to calculate the angle-dependent cascade spectra for a variety of different input parameter sets within a parameter space motivated by the known properties of the Be star and its circumstellar disk in the PSR B1259-63/LS 2883 binary system. In these calculations we assume that the pulsar is a point-like source emitting isotropically in all directions. This assumption is reasonable if the wind termination shock at which leptons injected by the pulsar are efficiently accelerated and isotropized is close to the pulsar and the density of target seed photons is high enough to lead to IC scattering in the direct vicinity of the shock, which is the case for PSR B1259-63/LS 2883 (see above). We approximate the spectrum of the VHE -rays as generated by IC scattering by electrons a power law distribution with an exponential cut-off. In our simulations we consider a mono-directional beam of photons to isolate all the geometrical effects. The source would emit the same beam of photons in every direction, and in the case of efficient cascading even those photons emitted in the opposite direction from the observer can contribute to the resulting observable spectrum. The orientation of the magnetic field would be different for primary photons emitted in different directions. Below we discuss the dependence of the cascade emission on the magnetic field orientation.
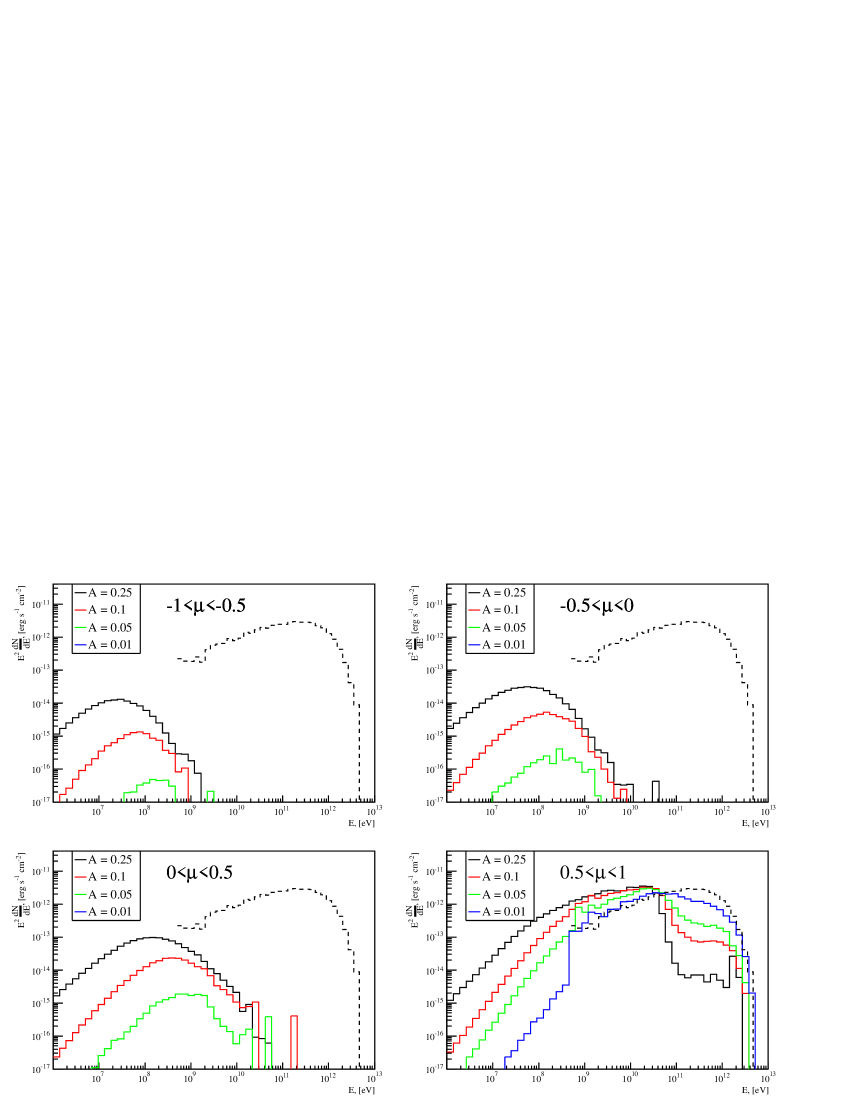
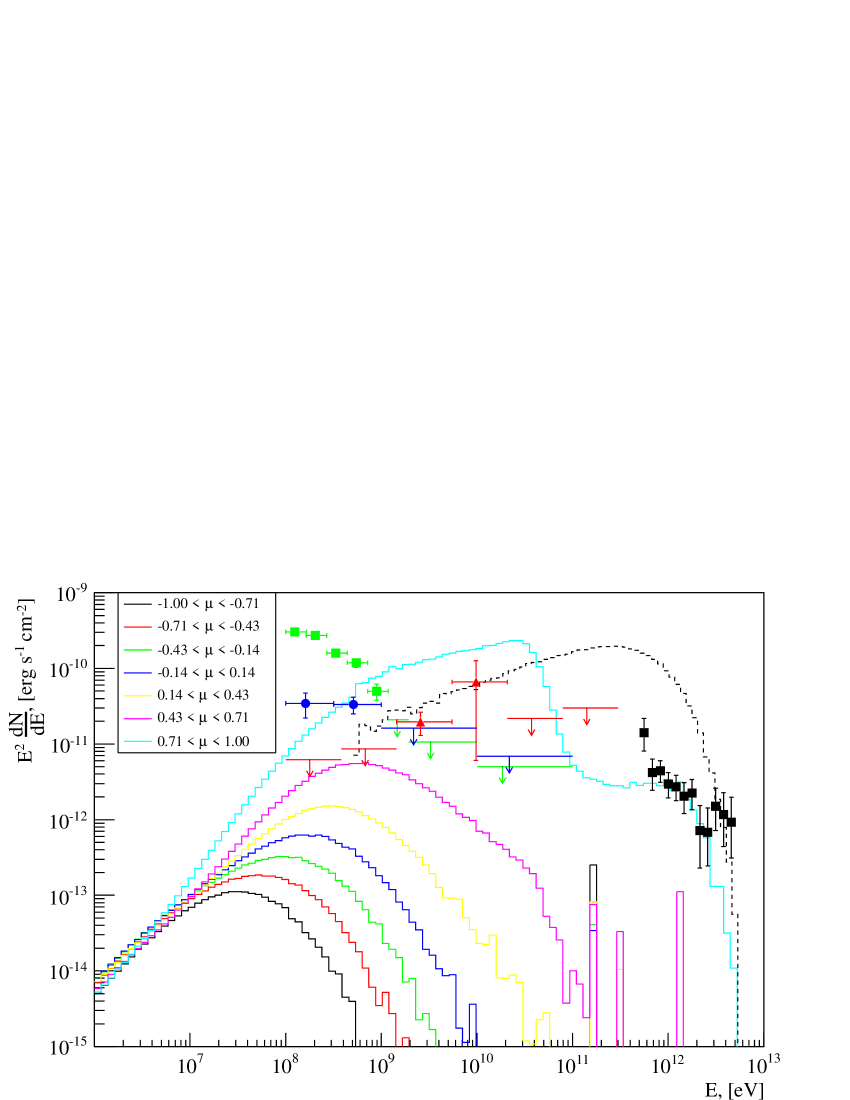
Figure 2 shows the viewing angle dependence of the cascade emission resulting from a monodirectional VHE -ray beam. For this simulation we chose a magnetic field of G oriented in a way that G and G, and an energy density of the target photon field of erg cm-3 (), which corresponds to the upper limit for the disk energy density (see Section 3.1). The input -ray spectrum is described as an exponentially cut-off power law with a photon spectral index and a cut-off energy TeV. The resulting photon spectra for all directions were normalized with the same normalization factor, chosen to yield the observed TeV flux level of PSR B1259-63/LS 2883 (H.E.S.S. Collaboration et al., 2013), as shown with black squares in Fig. 2, in the forward direction. The input photon spectrum is shown as the black dashed line. For this high value of the energy density within the disk, gamma-ray-induced pair cascades would provide a significant contribution to the GeV -ray spectrum. However, the modified spectrum is in conflict with the GeV data obtained with Fermi-LAT (Abdo et al., 2011; Tam et al., 2011), which reveal very constraining upper limits in the same range of energies where the forward cascade emission peaks (cyan line in Fig. 2). The comparison with the observed spectrum of the GeV emission detected at the periastron passage is not conclusive, because the spectral shape is quite controversial: two independent analyses revealed two different spectral shapes shown with blue circles (Abdo et al., 2011) and red triangles (Tam et al., 2011) in Fig. 2. This contradiction should be resolved by new observations around the periastron passage on 4th of May, 2014. Nevertheless, both spectral shapes provide upper limits in the energy range GeV, which are violated by the forward cascade emission. The spectrum of the GeV emission during the flaring period reveals a quite sharp cut-off consistent with an exponential cut-off at GeV (H.E.S.S. Collaboration et al., 2013) and upper limits in the energy range from 1 to 100 GeV. However, the GeV flare occurs when the pulsar is at the edge of the circumstellar disk or already after the pulsar has crossed the disk and, thus, no forward cascade emission is expected in the direction of the observer, while the -rays emitted in other directions can still reach the observer. The cascade emission in non-frontal directions peaks in the energy range in which the GeV flare emission is detected. Approximating PSR B1259-63/LS 2883 as a point-source and taking into consideration that numerical calculations are provided only for a monodirectional beam of VHE -rays, the total observed cascade emission at GeV energies from the source can be estimated as the sum of all -rays emitted in non-frontal directions produced in cascades generated by a monodirectional beam, assuming that the cascade emission is not strongly dependent on the orientation of the primary beam. This cascade emission might be high enough to contribute significantly to the observed GeV flux. To study the possible contribution of the cascade emission to the observed GeV flux without violating Fermi-LAT upper limits at higher energies, we examine, in the following, the dependence of the cascade emission on the parameter , i.e. energy density of the radiation field, on the strength and orientation of the magnetic field, and on the location of the pulsar within the radiation field.
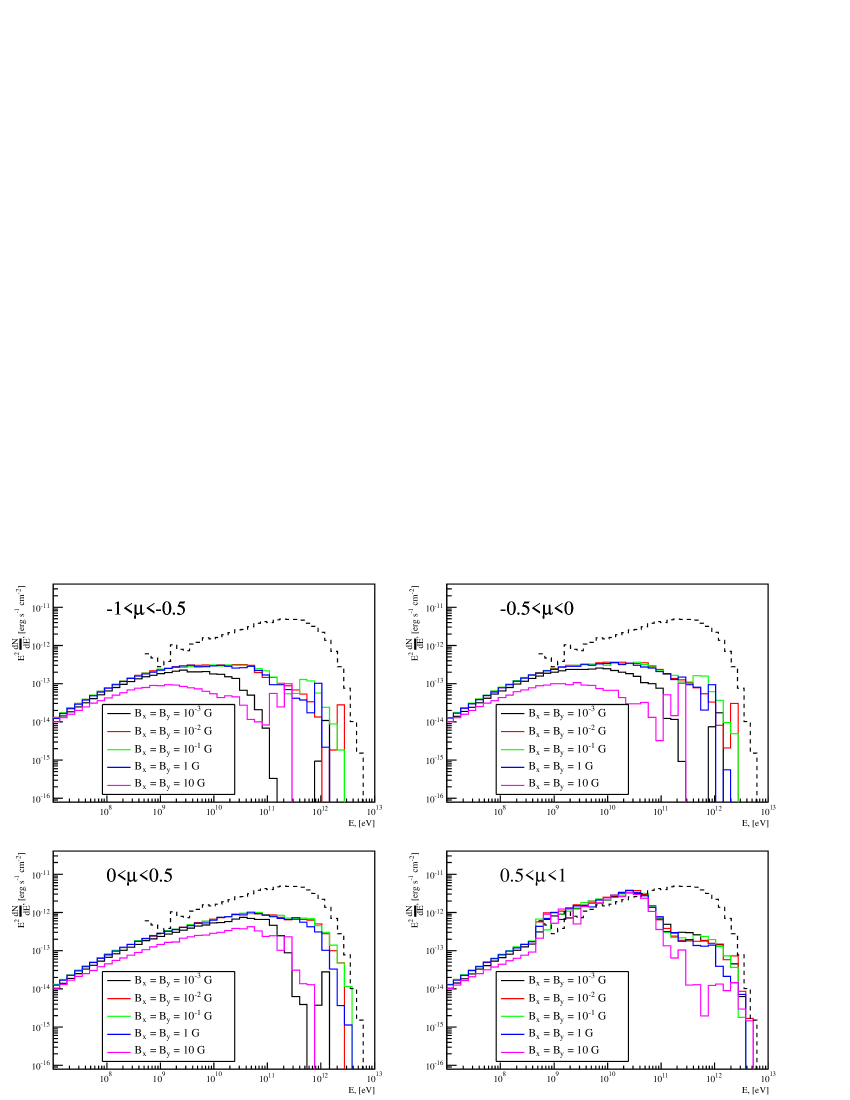
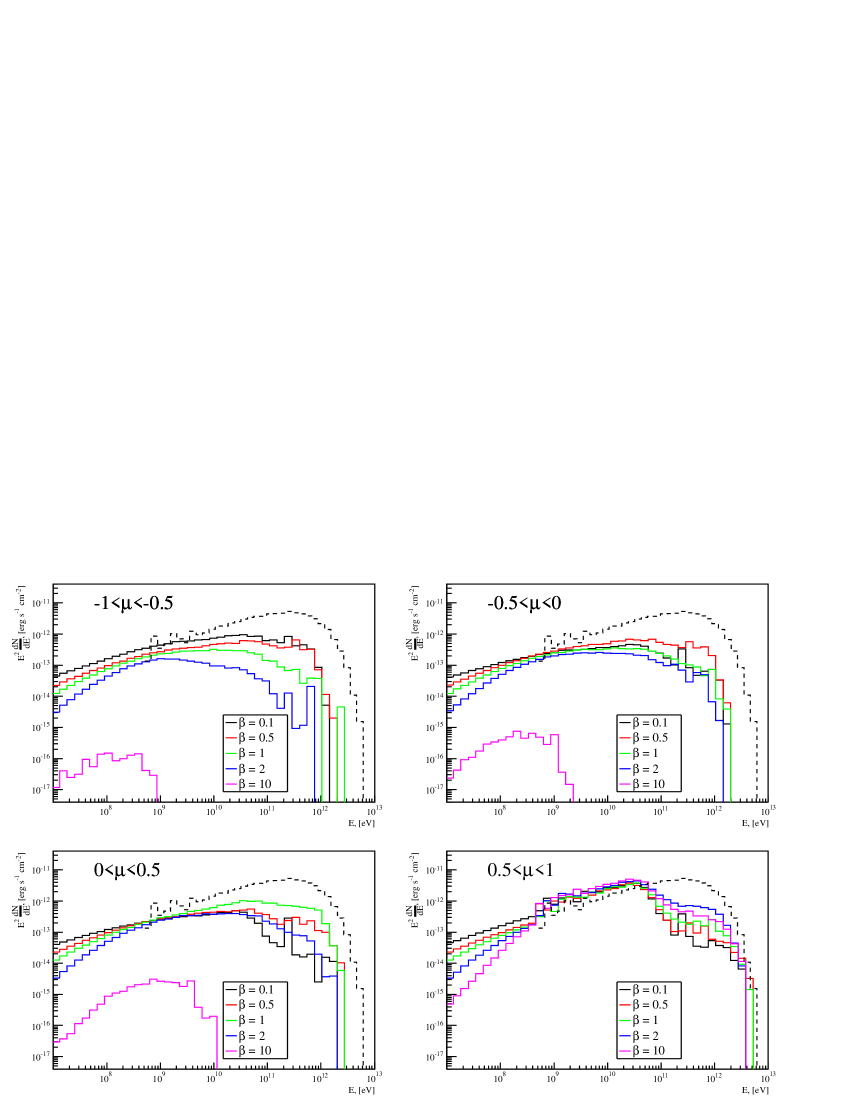
Figure 3 illustrates the dependence on the energy density normalisation parameter for different values of , i.e. for the different viewing angles: the top left panel shows the spectra for , the top right panel for , the bottom left panel for , and the bottom right panel for . For this simulation, we chose a magnetic field of G oriented in such a way that G and G, and shifted the source location to the edge of the simulation box, along the -axis at . The curves for the forward cascade emission (Fig. 3, bottom right panel) show that only for , i.e. erg/cm3, the Fermi-LAT upper limits in the energy range GeV are not violated. For this low energy density, the cascade emission in other directions decreases dramatically (Fig. 3: left and top right panels) and will not contribute to the observable spectrum.
Figures 4 and 5 show the dependence of the cascade emission on the strength and orientation of the magnetic field for different viewing angles (arranged in the same way as in Fig. 3). For this simulation we assumed and . The cascade emission is strongly dependent on both the strength and the orientation of the magnetic field. For the same orientation, the stronger magnetic field increases the cascade emission in the non-frontal directions (Fig. 4 top-left, top-right and bottom-left panels). For stronger magnetic fields, electrons and positrons are effectively isotropised before they produce secondary -rays through the IC scattering. For the magnetic field strength of G electrons and positrons are completely isotropised and thus already the first generation of cascade photons is completely isotropised and emitted evenly in all directions. For the magnetic field strength of G, the magnetic field energy density becomes comparable with the photon energy density (in this case ) which results in significant synchrotron losses.
To study the dependence of the cascade emission on the orientation of the magnetic field, we introduce the parameter as the ratio of the - and -components of the magnetic field. For the same strength of the magnetic field of G, a higher value of , i.e. a stronger -component results in a shift of the peak of the non-frontal cascade emission to lower energies. However, this is coincident with a decrease of the flux level of the non-frontal cascade emission. A ”co-alignment” of the magnetic field with the direction of the primary photon beam () reduces the contribution of the non-frontal cascade emission dramatically, since almost all the secondary photons are emitted in the forward direction. For , i.e. for a magnetic field oriented at large angle with respect to the primary photon direction, the cascade emission in all directions peaks at roughly 30 GeV. The lower the value of , the more cascade radiation is emitted backwards (Fig. 5 top-left panel).
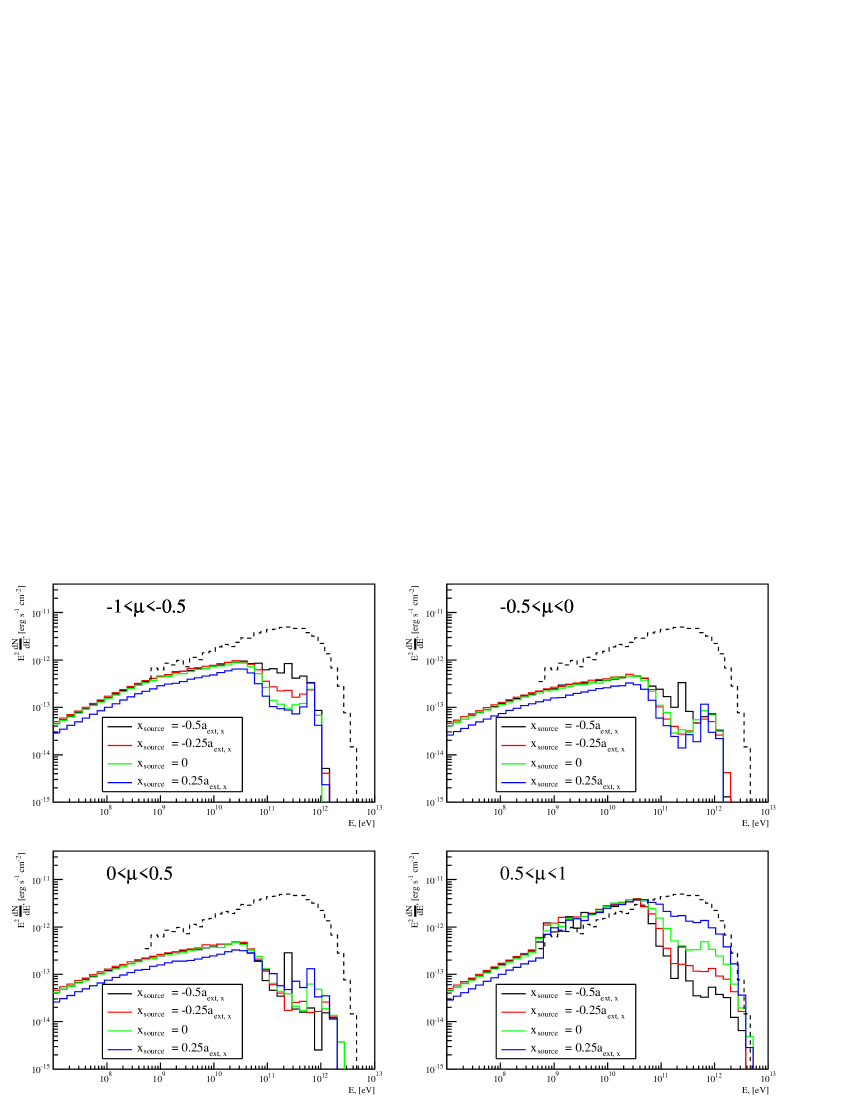
The dependence of the cascade emission on the location of the source within the disk for different viewing angles (same as in Fig. 3) is shown in Fig. 6. For this simulation, we chose a magnetic field of G oriented in such a way that G and G, and . The bottom-right panel of Fig. 6 confirms that — as expected — the level of the -absorption of the -ray beam directed along the -axis decreases as the source is moving towards the front edge of the radiation field region. However, for the cascade emission at the energies below GeV does not depend significantly on the location of the source. This reflects the fact that in such configurations, a high-opacity regime () has been reached, and a further increase of the opacity only has a minor effect on the absorption and cascading process. Minor differences still occur only in the energy range GeV TeV and only in the backward directions (Fig. 6 top panels). This can be naturally explained by the immediate escape of first generation cascade photons emitted in backward directions as the source is located close to the back edge of the radiation field region. Obviously, the effect of the location of the source inside the radiation field region depends on the value of the energy density as the opacity is proportional to the energy density for a given radiation temperature.
4 Discussion
4.1 GeV emission
The Fermi-LAT data taken around the 2010 periastron passage were analysed by two independent groups (Abdo et al., 2011; Tam et al., 2011) yielding similar results for the flaring period, but quite different results for the first detection period close to periastron, when a very low GeV flux was observed. Both light curves and spectral shapes of the emission for this period obtained by the two different groups are considerably different. Abdo et al. (2011) announced the first detection of the source integrating the data in the so-called ”brightening” period from d to d. The light curve study on a weekly basis showed a significant flux in the periods d to d and d to d with an upper limit between those periods. However, a subsequent re-analysis of the same data by the same group showed a constant flux in the period from d to d (Chernyakova et al., 2014). In contrast, Tam et al. (2011) detected the low GeV flux in the period from about a month before periastron to periastron with no significant emission after periastron until the GeV flare.
There is also an essential discrepancy in the obtained spectra for the ”low-flux” periods for two different groups as shown in Fig. 3. These two spectra contradict each other revealing a significant flux in different energy bands ( GeV (Abdo et al., 2011) and GeV (Tam et al., 2011)). Resolving this spectral descrapancy is very important in terms of comparison of the data to the simulated cascade emission and drawing any conclusions. The spectrum obtained by Abdo et al. (2011) (blue circles in Fig. 3) rejects the possibility of a significant cascade contribution, because even the slightest absorption of the TeV -rays and re-emission at lower energies would violate the Fermi-LAT upper limit in GeV energy band. Therefore, the Fermi-LAT upper limit in this case constrains the energy density in the disk to erg/cm3, i.e. .
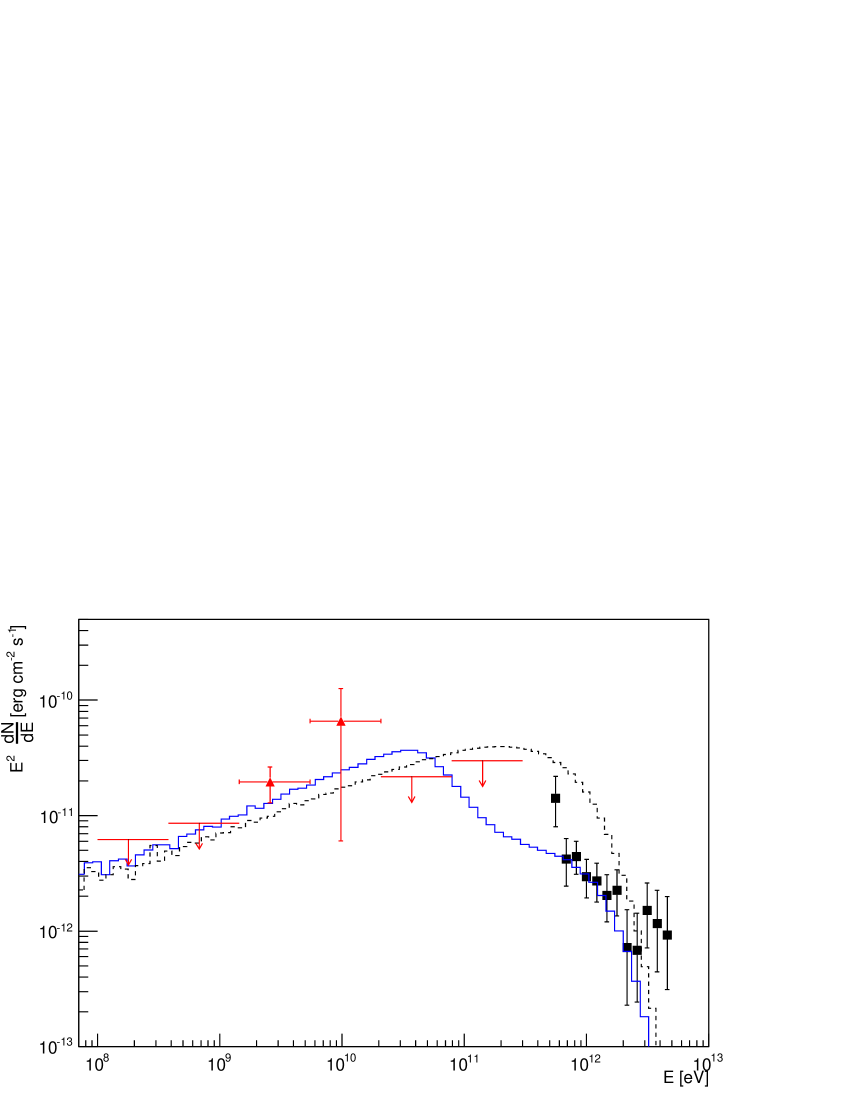
In contrast, the spectrum presented by (Tam et al., 2011) is consistent with a substantial contribution from cascade emission. The energy of the peak in the spectrum of the cascade -rays emitted in the forward direction only slightly depends on the energy density and magnetic field (see Figures 3, 4 and 5) and is in the energy range of GeV. Figure 7 shows the comparison of the GeV-TeV data with the simulation results of the cascade Compton radiation from the primary photon beam directed towards the observer emitted in the forward direction into a cone with an opening angle 11∘ (). This corresponds to the cascade emission radiated in the direction of the observer from the primary -rays emitted within the cone of the same opening angle assuming that the magnetic field affects the cascades initiated by every primary photon identically. This assumption is valid for sufficiently small values of the opening angle, such that the orientation of the magnetic field with respect to the direction of the primary photon does not change much and its influence on the shape of the cascade emission spectrum is negligible. The simulation was performed for , i.e. erg/cm3, magnetic field G with and the location of the source . We decided to choose the magnetic field which is oriented close to the direction of the primary photon (and in the direction of the observer) since in this case we avoid the dependence on the orientation, because secondary photons are emitted in the same direction as the primary photon. Otherwise, the cascade radiation emitted in other directions can become higher than the forward emission and a cone with a bigger opening angle should be considered, which in turn requires an accurate calculation of the magnetic field orientation for every primary photon. This assumption, however, is close to the realistic scenario. The direction of the toroidal magnetic field in the disk region is close to the direction towards the observer for given low values of the orbital inclination angle of about ∘ (Negueruela et al., 2011) and the disk inclination angle with respect to the orbit of about ∘.
The disappearance of the GeV emission in the period from 16 to 30 days after periastron can be naturally explained within this model by the fact that the forward cascade emission decreases as the pulsar moves towards the frontal edge of the disk. In the framework of this model, the GeV emission should appear during the first crossing of the disk and stay constant until the second crossing of the disk. This is consistent with the light curve reported by Abdo et al. (2011), but does not agree with the light curve reported by Tam et al. (2011), which reveals the disappearance of the GeV emission after periastron. Therefore, the proposed model of the non-flaring GeV emission from the system is consistent with the spectrum reported by Tam et al. (2011) and light curve reported by Abdo et al. (2011), but inconsistent vice versa.
It should be noted though that simulations presented above are performed considering only disk radiation field and neglecting the stellar radiation field. As discussed in Section 3.1 this assumption can be valid when the pulsar is located in the disk environment where the energy density of the disk photons is higher than the energy density of stellar photons. But if the pulsar is close to periastron the energy density of the stellar radiation is higher and the efficient cascading is possible before -rays reach the disk environment. The modeling of the cascade emission from the pulsar at periastron would require to take into account the stellar photons as well as the toroidal structure of the magnetic field, since the path of the -ray within the system is long and the direction of the magnetic field will change considerably. Therefore, the comparison of the model with the ”periastron” emission presented on Fig. 7 should be treated only as a hint that the GeV emission may be explained by the cascade radiation (even if we consider only disk photons). This implies that taking into account stellar photons might probably provide a better fit of the data and decrease the estimate (upper limit) of the disk energy density. A detailed study of the cascades development in the system which would properly account for all the effects discussed in this work is in progress and will be applied to the new GeV data taken around 2014 periastron. Preliminary analysis reported in Tam and Kong (2014) revealed no significant GeV emission, i.e. , close to the 2014 periastron, with a 90% confidence level upper limit about times lower than the flux reported around the previous periastron passage. This result, if confirmed, might provide evidence for periastron-to-periastron variability.
The GeV flare is most probably generated by some other process for several reasons. Although the cascade emission radiated in the backward direction may contribute to the flux at GeV, this contribution is small compared to the GeV flare even for very high values of the energy density. Moreover, for high values of the energy density in the disk we expect a strong cascade emission in the forward direction at energies GeV. Although during the GeV flare, when the pulsar is escaping the disk, no forward cascade emission is expected, it should have been observed in earlier phases. Finally, if the flare is due to cascade emission, the same effect should be observed before and at the beginning of the first crossing of the disk, but this is not seen.
4.2 TeV light curve
The absorption of the -ray emission caused by the interaction with the disk radiation field might have a significant impact at the observed TeV light curve. Dubus (2006) calculated the resulting integrated flux above 380 GeV after absorption caused by the stellar radiation field. It was shown that the absorption due to the stellar radiation plays only a minor role in the observed variability. However, the disk radiation was not considered in those calculations. Using the estimate of the resulting integrated flux after the absorption on stellar photons only, , calculated in Dubus (2006) we calculated the resulting flux after the total absorption due to both stellar and disk radiation fields as
| (13) |
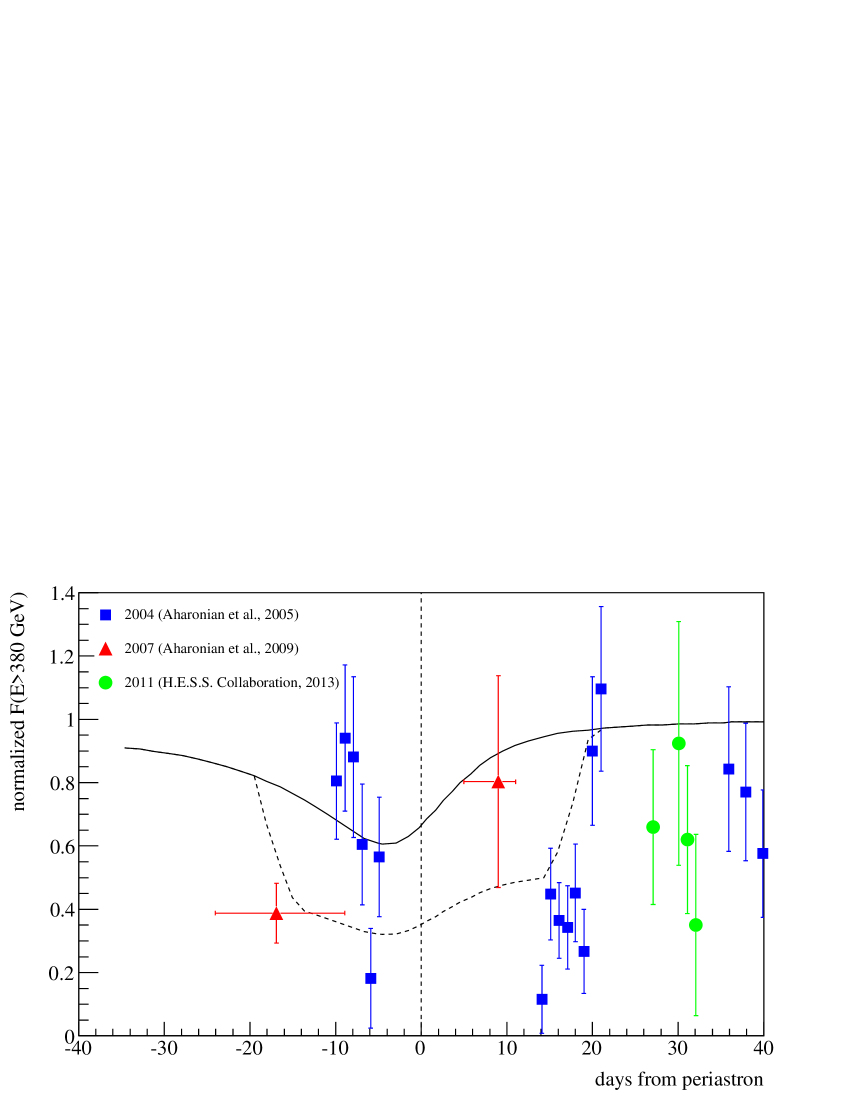
where is the optical depth of the disk radiation field, is the normalised -ray energy and the integration is performed between GeV and TeV. For these calculations we used the same orbital parameters as used in Dubus (2006): orbital period , eccentricity , periastron longitude , and inclination angle . The disk inclination angle is assumed to be . The disk is assumed to be perpendicular to the major axis of the orbit with a constant width of cm (corresponds to half-opening angle at a distance of ) and constant energy density of erg cm-3 (the highest energy density for which the Fermi-LAT upper limits are not violated, see previous subsection). The expected light curve after absorption assuming a constant initial -ray flux is shown in Figure 8. The solid line represents the flux after absorption taking into account only stellar photons as reported by Dubus (2006) and the dashed line shows the flux after the total absorption including the disk radiation field. It can be seen that the circumstellar disk might play a crucial role in the flux variability around the periastron passage and that the observed flux variability can be explained by the absorption. The time shift of the observed preperiastron peak with respect to the modelled light curve might be explained by the rotation of the disk normal with respect to the major axis. The assumption of the constant width of the disk results in an overestimation of the absorption close to periastron, since the disk should be thiner close to the star. However, the energy density in the disk is expected to be highest close to the star. The combined effect might result in a shallower minimum near periastron than predicted by our calculations. The light curve has been modelled under the assumption that the primary -ray flux is constant. This is a valid approximation only in the case when IC scattering occurs in the saturation regime which is believed to be true around periastron. Farther from periastron the primary flux would decrease. In the case when IC scattering is not in the saturation regime, local maxima are expected at the disk crossings and at the periastron. This would completely change the expected light curve. With the current quality of the observed TeV light curve it is difficult to draw any final conclusions. New observations conducted in 2014 might bring some clarity and give answers to some of these open questions.
A critical test of the absorption model could be derived from the study of the spectral variability of the TeV emission. The TeV spectrum is expected to soften when the pulsar is moving through the disk for the first time, then the spectral shape should remain almost unchanged with a slight variability due to the absorption in the stellar radiation field until the pulsar moves out of the disk after periastron. After that the spectrum should harden again. Unfortunately, the VHE -ray observations during previous periastron passages did not provide enough statistics to draw firm conclusions about the spectral variability. Although there are some indications of spectral changes both during the 2004 (Aharonian et al., 2005) and the 2007 (Aharonian et al., 2009) periastron passages, these changes are not significant. However, if the spectral variability is real on both occasions, it suggests a hardening of the spectrum towards periastron, which is in contradiction with the effect we expect in the case of effective cascading.
5 Summary
We investigated the generation of -ray induced pair cascades in the circumstellar disk of the companion Be star in the binary system PSR B1259-63/LS 2883 and the possible contribution of the cascade emission to the observed -ray spectrum of the source. It is shown that the cascade emission generated in the disk cannot be responsible for the GeV flare observed about 30 days after periastron. However, the cascade emission might explain the GeV emission observed close to periastron. The spectrum and the light curve of the GeV emission close to periastron are not well resolved (two different groups obtained results which contradict each other), which is probably because of a very low flux in this period of time. This uncertainity in the light curve and spectral shape widen a scope of different mechanisms which can explain the GeV emission. We showed that the cascade emission generated in the disk may make a non-negligible contribution to this GeV emission. We also showed that the absorption of the -ray emission in the disk might explain the observed TeV light curve. Observations around the 2014 periastron passage might provide further tests to our model and serve as a guideline to a more detailed modeling.
References
References
- Abdo et al. (2011) Abdo, A. A., Ackermann, M., et al., Jul. 2011. Discovery of High-energy Gamma-ray Emission from the Binary System PSR B1259-63/LS 2883 around Periastron with Fermi. ApJ, 736, L11.
- Aharonian et al. (2005) Aharonian, F., Akhperjanian, A. G., et al., Oct. 2005. Discovery of the binary pulsar PSR B1259-63 in very-high-energy gamma rays around periastron with HESS. A&A, 442, 1–10.
- Aharonian et al. (2009) Aharonian, F., Akhperjanian, A. G., et al., Nov. 2009. Very high energy -ray observations of the binary PSR B1259-63/SS2883 around the 2007 Periastron. A&A, 507, 389–396.
- Ball and Kirk (2000) Ball, L., Kirk, J. G., Jan. 2000. Probing pulsar winds using inverse Compton scattering. Astroparticle Physics 12, 335–349.
- Bogovalov et al. (2008) Bogovalov, S. V., Khangulyan, D. V., Koldoba, A. V., Ustyugova, G. V., Aharonian, F. A., Jun. 2008. Modelling interaction of relativistic and non-relativistic winds in binary system PSR B1259-63/SS2883 - I. Hydrodynamical limit. MNRAS, 387, 63–72.
- Böttcher and Schlickeiser (1997) Böttcher, M., Schlickeiser, R., Sep. 1997. The pair production spectrum from photon-photon annihilation. A&A, 325, 866–870.
- Cerutti et al. (2010) Cerutti, B., Malzac, J., Dubus, G., Henri, G., Sep. 2010. Modeling the three-dimensional pair cascade in binaries. Application to LS 5039. A&A, 519, A81.
- Chernyakova et al. (2014) Chernyakova, M., Abdo, A. A., Neronov, A., McSwain, M. V., Moldón, J., Ribó, M., Paredes, J. M., Sushch, I., de Naurois, M., Schwanke, U., Uchiyama, Y., Wood, K., Johnston, S., Chaty, S., Coleiro, A., Malyshev, D., Babyk, I., Mar. 2014. Multiwavelength observations of the binary system PSR B1259-63/LS 2883 around the 2010-2011 periastron passage. MNRAS, 439, 432–445.
- Dubus (2006) Dubus, G., May 2006. Gamma-ray absorption in massive X-ray binaries. A&A, 451, 9–18.
- Dubus and Cerutti (2013) Dubus, G., Cerutti, B., Sep. 2013. What caused the GeV flare of PSR B1259-63? A&A, 557, A127.
- Dubus et al. (2010) Dubus, G., Cerutti, B., Henri, G., Jun. 2010. Relativistic Doppler-boosted emission in gamma-ray binaries. A&A, 516, A18.
- H.E.S.S. Collaboration et al. (2013) H.E.S.S. Collaboration, Abramowski, A., et al., Mar. 2013. H.E.S.S. observations of the binary system PSR B1259-63/LS 2883 around the 2010/2011 periastron passage. A&A, 551, A94.
- Johnston et al. (2005) Johnston, S., Ball, L., Wang, N., Manchester, R. N., Apr. 2005. Radio observations of PSR B1259-63 through the 2004 periastron passage. MNRAS, 358, 1069–1075.
- Johnston et al. (1992a) Johnston, S., Lyne, A. G., Manchester, R. N., Kniffen, D. A., D’Amico, N., Lim, J., Ashworth, M., Apr. 1992a. A high-frequency survey of the southern Galactic plane for pulsars. MNRAS, 255, 401–411.
- Johnston et al. (1992b) Johnston, S., Manchester, R. N., Lyne, A. G., Bailes, M., Kaspi, V. M., Qiao, G., D’Amico, N., Mar. 1992b. PSR 1259-63 - A binary radio pulsar with a Be star companion. ApJ, 387, L37–L41.
- Johnston et al. (1999) Johnston, S., Manchester, R. N., McConnell, D., Campbell-Wilson, D., Jan. 1999. Transient radio emission from the PSR B1259-63 system near periastron. MNRAS, 302, 277–287.
- Khangulyan et al. (2012) Khangulyan, D., Aharonian, F. A., Bogovalov, S. V., Ribó, M., Jun. 2012. Post-periastron Gamma-Ray Flare from PSR B1259-63/LS 2883 as a Result of Comptonization of the Cold Pulsar Wind. ApJ, 752, L17.
- Kong et al. (2012) Kong, S. W., Cheng, K. S., Huang, Y. F., Jul. 2012. Modeling the Multiwavelength Light Curves of PSR B1259-63/LS 2883. II. The Effects of Anisotropic Pulsar Wind and Doppler Boosting. ApJ, 753, 127.
- McCollum (1993) McCollum, B., Dec. 1993. A Pre-Periastron UV Look and Estimate of the Mass Loss Rate of the Be Companion of PSR 1259-63. In: American Astronomical Society Meeting Abstracts. Vol. 25 of Bulletin of the American Astronomical Society. p. 1321.
- Melatos et al. (1995) Melatos, A., Johnston, S., Melrose, D. B., Jul. 1995. Stellar wind and stellar disc models of dispersion and rotation measure variations in the PSR B1259 - 63/SS2883 binary system. MNRAS, 275, 381–397.
- Negueruela et al. (2011) Negueruela, I., Ribó, M., Herrero, A., Lorenzo, J., Khangulyan, D., Aharonian, F. A., May 2011. Astrophysical Parameters of LS 2883 and Implications for the PSR B1259-63 Gamma-ray Binary. ApJ, 732, L11.
- Okazaki et al. (2011) Okazaki, A. T., Nagataki, S., Naito, T., Kawachi, A., Hayasaki, K., Owocki, S. P., Takata, J., Aug. 2011. Hydrodynamic Interaction between the Be Star and the Pulsar in the TeV Binary PSR B1259-63/LS 2883. PASJ, 63, 893–.
- Quirrenbach et al. (1994) Quirrenbach, A., Buscher, D. F., Mozurkewich, D., Hummel, C. A., Armstrong, J. T., Mar. 1994. Maximum-entropy maps of the Be shell star zeta Tauri from optical long-baseline interferometry. A&A, 283, L13–L16.
- Rivinius et al. (2013) Rivinius, T., Carciofi, A. C., Martayan, C., Oct. 2013. Classical Be stars. Rapidly rotating B stars with viscous Keplerian decretion disks. A&ARv, 21, 69.
- Roustazadeh and Böttcher (2010) Roustazadeh, P., Böttcher, M., Jul. 2010. Very High Energy Gamma-ray-induced Pair Cascades in Blazars and Radio Galaxies: Application to NGC 1275. ApJ, 717, 468–473.
- Roustazadeh and Böttcher (2012) Roustazadeh, P., Böttcher, M., May 2012. Synchrotron Emission from Very High Energy Gamma-Ray-induced Pair Cascades in Active Galactic Nucleus Environments. ApJ, 750, 26.
- Sierpowska and Bednarek (2005) Sierpowska, A., Bednarek, W., Jan. 2005. -rays from cascades in close massive binaries containing energetic pulsars. MNRAS, 356, 711–726.
- Sierpowska-Bartosik and Bednarek (2008) Sierpowska-Bartosik, A., Bednarek, W., Apr. 2008. -rays from binary system with energetic pulsar and Be star with aspherical wind: PSR B1259-63/SS2883. MNRAS, 385, 2279–2288.
- Takata et al. (2012) Takata, J., Okazaki, A. T., Nagataki, S., Naito, T., Kawachi, A., Lee, S.-H., Mori, M., Hayasaki, K., Yamaguchi, M. S., Owocki, S. P., May 2012. Modeling High-energy Light curves of the PSR B1259-63/LS 2883 Binary Based on 3D SPH Simulations. ApJ, 750, 70.
- Tam et al. (2011) Tam, P. H. T., Huang, R. H. H., Takata, J., Hui, C. Y., Kong, A. K. H., Cheng, K. S., Jul. 2011. Discovery of GeV -ray Emission from PSR B1259-63/LS 2883. ApJ, 736, L10.
- Tam and Kong (2014) Tam, P. H. T., Kong, A. K. H., Jun. 2014. Fermi/LAT and Swift/XRT observations of PSR B1259-63/LS 2883 over the recent periastron passage. The Astronomer’s Telegram 6198, 1.
- Usov and Melrose (1992) Usov, V. V., Melrose, D. B., Aug. 1992. X-ray emission from single magnetic early-type stars. ApJ, 395, 575–581.
- van Soelen et al. (2012) van Soelen, B., Meintjes, P. J., Odendaal, A., Townsend, L. J., Nov. 2012. Anisotropic inverse Compton scattering of photons from the circumstellar disc in PSR B1259-63. MNRAS, 426, 3135–3147.
- Vink et al. (2000) Vink, J. S., de Koter, A., Lamers, H. J. G. L. M., Oct. 2000. New theoretical mass-loss rates of O and B stars. A&A, 362, 295–309.
- Walder et al. (2012) Walder, R., Folini, D., Meynet, G., May 2012. Magnetic Fields in Massive Stars, Their Winds, and Their Nebulae. Space Sci. Rev., 166, 145–185.