2014 \SetConfTitleProceedings of the astrorob conference
Automated differential photometry of TAOS data: preliminary analysis
Abstract
A preliminary data analysis of the stellar light curves obtained by the robotic telescopes of the TAOS project is presented. We selected a data run relative to one of the stellar fields observed by three of the four TAOS telescopes, and we investigate the common trend and the correlation between the light curves. We propose two ways to remove these trends and show the preliminary results. A project aimed at flagging interesting behaviors, such as stellar variability, and to set up an automated follow-up with the San Pedro Mártir Facilities is on the way.
Presentamos un análisis preliminar de curvas de luz obtenidas con datos de los telescopios robóticos del proyecto TAOS. Elegimos una serie de datos en relación a uno de los campos estelares observados por tres de los cuatro telescopios de TAOS, e investigamos la tendencia común y la correlación entre las curvas de luz. Proponemos dos maneras de borrar estas tendencias y presentamos los primeros resultados. Este es un proyecto dirigido a detectar comportamientos interesantes, como variabilidad estelar, que son importantes para establecer un seguimiento automatizado con las instalaciones del Observatorio de San Pedro Mártir que está actualmente en desarrollo.
Stars: Variables \addkeywordTechniques: Photometric \addkeywordMethods: Data Analysis
0.1 General
TAOS (Taiwan American Occultation Survey) is a project111http://taos.asiaa.sinica.edu.tw/ which makes use of an array of four wide-field robotic telescopes at the Lulin Observatory (Taiwan), to monitor mainly in the ecliptic plane a total of few thousand stars simultaneously,with high-speed photometry (). The main scientific goal of the project is the observation of stellar occultations by KBO (Kuiper Belt Objects), with the aim of detecting small (less than diameter) Transneptunian Objects (Lehner et al., 2006). A large amount of data is obtained every night by each telescope, and an automatic data reduction pipeline, using the PSF (Point Spread Function) photometry technique, has produced millions of light curves ready for inspection (Zhang et al., 2013). With the construction of TAOS II (Transneptunian Automated Occultation Survey), the second phase of this project222http://taos2.asiaa.sinica.edu.tw/ has started. It is currently underway at the Observatorio Astronómico Nacional in San Pedro Mártir (Baja California, Mexico). We are currently working to the design of the necessary tools to take full advantage of the resulting data. TAOS II foresees three telescopes that will scan several hundreds of fields mainly on the ecliptic plane, producing data that will be automatically treated to output light curves for more than stars at a high rate (), for a total of over than 300TB of raw images per year. In addition to the transneptunian objects survey, which is the main goal of the TAOS and TAOS II projects, other studies are also being conducted with the photometric variability data: eclipsing binaries, extrasolar planets, and variable stars (Kim et al., 2010).

As part of an ongoing effort to design an efficient data analysis pipeline for the large amount of data expected from the TAOS project, we have implemented a procedure aimed at efficiently detrending the lightcurve of the stars observed. The same procedure can be used to conduct ancillary scientific research using the data previously obtained.
In this paper we present the results of a preliminary analysis of TAOS data aimed at detecting eclipsing binaries, extrasolar planets and variable stars. The analysis makes use of a custom software for lightcurves detrending which combines shell scripts and C++ routines. We also set up a modern web based software, useful for a global inspection of the observed fields and the lightcurve of the stars in the database (Ricci et al., these Proceedings).
0.2 Zipper mode
As the time scale of the occultation events is estimated to be , a peculiar readout mode was set up to achieve high speed imaging with the “common” CCD of TAOS telescopes, which has a readout time of . This method is called “Zipper Mode”333http://taos.asiaa.sinica.edu.tw/high_speed_imaging.php, a caractheristic that will be overrided in the second part of the project. The steps to perform photometry in Zipper Mode can be summarized as follows: 1. expose for ; 2. while the device is still exposing, move for the readout a subsection of 76 rows; 3. read the charges of the 76 rows (it takes a total of ); 4. start next exposure of . Consequently each 76-rows “strip” contains information concerning all the stars of the field, as well as the traces of the stars collected during the displacement of the charges for the readout (see Fig. 1). On each star of the “strip” is applied a pipeline using the PSF (Point Spread Function) photometry technique, obtaining a light curve. The process is repeated for each of the four telescopes.
0.3 Data reduction
The four light curves of each one of the hundreds of stars are stored
in hundreds FITS binary tables, while timing and other metadata, which
are the same for all the stars, are stored in the binary tables of a
separate FITS file.
We extracted the information about the fields observed and those
of the selected stars in two mysql tables.
The goal of this work is to provide a reduction technique which would
allow us to effectively identify and study the following events:
1. exoplanetary transits,
2. GRB afterglows,
3. supernovae,
4. variable and other transient events.
To perform the quick view of the data and inspect the star fields, we
built a web GUI using a web 2.0 approach (also presented in this
conference). For our tests we chose the first run of one of TAOS
fields, namely the number 152, which was observed with three telescopes, and the
100 brightest stars detected.
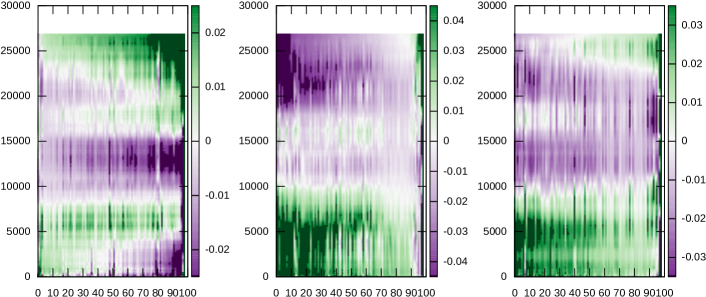
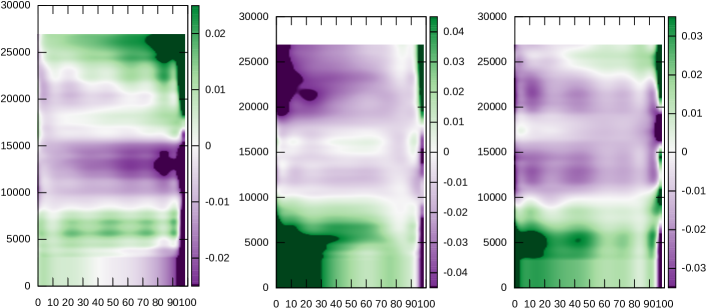
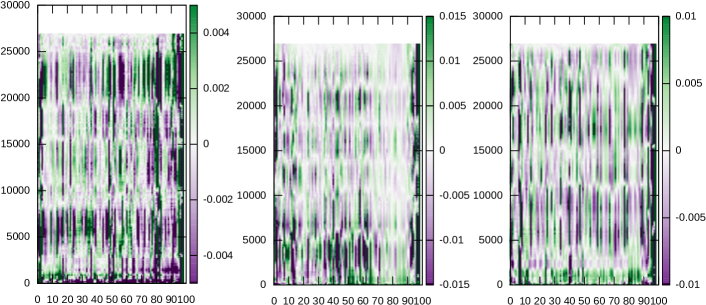
The data are smoothed every 3000 points (5 points per seconds, i.e. 10 minutes) using a moving average, and the mean magnitude of each curve is subtracted. We noticed a common behaviour between curves, different from telescope to telescope, that we ascribe to the variations of sky conditions during the night, and a trend “evolving” some way from light curve to light curve. This trend does not depend from the CCD position and it is very slightly magnitude dependent. We decided to re-order the curves by the value of the average of their last 300 points, for visualisation purposes only. The result is visible in the top three plots of Fig. 2, one for each of the three telescopes used to observe the selected field. We modeled the “evolving” trend with a two-dimensional spline using a fast C++ routine444The routine is part of a suite whose components are also used in the Sadira project (Sprimont et al., these Proceedings), varying the number of knots and the degree of the polynomials to obtain a consistent match. The result can be seen in the three middle plots of Fig. 2. Subtracting the model, we obtain the detrended curves with a scatter of , , and peak-to-valley for each telescope, respectively (see the bottom plots of Fig. 2). The result is efficient, but this the goodness of the fit depends on the curves sorting order.
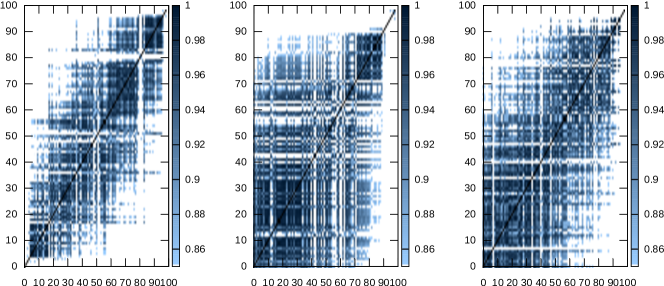
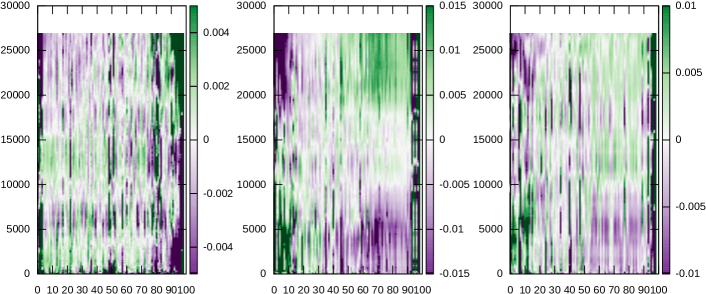
We then took a step back and calculated the correlation factor between each couple of curves. The three correlation matrices are shown in Fig. 3. Moreover, we subtracted to each curve an average of the other curves obtained by weighting each of them by their correlation factor. We obtain a magnitudes scatter similar to that of the previous method (2-d spline): , , and peak-to-valley for each of the three telescopes (see Fig. 4), but in this case the result is sorting-independent. Systematic trends are still present as a second order effect, and the causes are still under investigation.
0.4 Results and Follow-up
The preliminary results of an ongoing analysis involving the light curves of the 100 brightest star selected from a test TAOS field exhibit similar behaviors. In particular correlated trends in the data set are evident. While the causes are under investigation, we are able to remove these effects obtaining magnitude scatters in the range –, depending on the considered telescope.
An automated system to flag peculiar behaviors, such as stellar variability in the fields, is under development. It will represent the first step for the realization of the follow-up system to track interesting events by using San Pedro Mártir facilities.
To this aim we are testing the multichannel photometer RATIR on the telescope and the MEXMAN instrument of the telescope by observing already known exoplanetary transits. This way we will be able to evaluate the capability of these instruments and the limits of the follow-up.
References
- Kim et al. (2010) Kim, D.-W., Protopapas, P., Alcock, C., Byun, Y.-I., Kyeong, J., Lee, B.-C., Wright, N. J., Axelrod, T., Bianco, F. B., Chen, W.-P., Coehlo, N. K., Cook, K. H., Dave, R., King, S.-K., Lee, T., Lehner, M. J., Lin, H.-C., Marshall, S. L., Porrata, R., Rice, J. A., Schwamb, M. E., Wang, J.-H., Wang, S.-Y., Wen, C.-Y., & Zhang, Z.-W. 2010, AJ, 139, 757
- Lehner et al. (2006) Lehner, M. J., Alcock, C., Axelrod, T., Bianco, F., Byun, Y.-I., Chen, W.-P., Cook, K. H., Dave, R., de Pater, I., Giammarco, J., King, S.-K., Lee, T., Lissauer, J., Marshall, S. L., Mondal, S., Nihei, T., Rice, J., Schwamb, M., Wang, A., Wang, S.-Y., Wen, C.-Y., & Zhang, Z.-W. 2006, Astronomische Nachrichten, 327, 814
- Zhang et al. (2013) Zhang, Z.-W., Lehner, M. J., Wang, J.-H., Wen, C.-Y., Wang, S.-Y., King, S.-K., Granados, Á. P., Alcock, C., Axelrod, T., Bianco, F. B., Byun, Y.-I., Chen, W. P., Coehlo, N. K., Cook, K. H., de Pater, I., Kim, D.-W., Lee, T., Lissauer, J. J., Marshall, S. L., Protopapas, P., Rice, J. A., & Schwamb, M. E. 2013, AJ, 146, 14