22email: Marco.Padovani@lupm.univ-montp2.fr 33institutetext: INAF–Osservatorio Astrofisico di Arcetri, Largo E. Fermi 5, 50125 Firenze, Italy
33email: galli@arcetri.astro.it 44institutetext: CEA, IRFU, SAp, Centre de Saclay, 91191 Gif-Sur-Yvette, France
44email: [hennebelle,marc.joos]@cea.fr 55institutetext: École Normale Supérieure de Lyon, CRAL, UMR 5574 du CNRS, Université Lyon I, 46 Allée d’Italie, 69364 Lyon cedex 07, France
55email: benoit.commercon@ens-lyon.fr
The role of cosmic rays on magnetic field diffusion
and the formation of protostellar discs
Abstract
Context. The formation of protostellar discs is severely hampered by magnetic braking, as long as magnetic fields remain frozen in the gas. The latter condition depends on the levels of ionisation that characterise the innermost regions of a collapsing cloud.
Aims. The chemistry of dense cloud cores and, in particular, the ionisation fraction is largely controlled by cosmic rays. The aim of this paper is to evaluate whether the attenuation of the flux of cosmic rays expected in the regions around a forming protostar is sufficient to decouple the field from the gas, thereby influencing the formation of centrifugally supported disc.
Methods. We adopted the method developed in a former study to compute the attenuation of the cosmic-ray flux as a function of the column density and the field strength in clouds threaded by poloidal and toroidal magnetic fields. We applied this formalism to models of low- and high-mass star formation extracted from numerical simulations of gravitational collapse that include rotation and turbulence.
Results. For each model we determine the size of the magnetic decoupling zone, where collapse or rotation motion becomes unaffected by the local magnetic field. In general, we find that decoupling only occurs when the attenuation of cosmic rays is taken into account with respect to a calculation in which the cosmic-ray ionisation rate is kept constant. The extent of the decoupling zone also depends on the dust grain size distribution and is larger if large grains (of radius cm) are formed by compression and coagulation during cloud collapse. The decoupling region disappears for the high-mass case. This is due to magnetic field diffusion caused by turbulence that is not included in the low-mass models.
Conclusions. We conclude that a realistic treatment of cosmic-ray propagation and attenuation during cloud collapse may lead to a value of the resistivity of the gas in the innermost few hundred AU around a forming protostar that is higher than generally assumed. Forthcoming self-consistent calculations should investigate whether this effect is strong enough to effectively decouple the gas from the field and to compute the amount of angular momentum lost by infalling fluid particles when they enter the decoupling zone.
Key Words.:
ISM:cosmic rays –ISM: clouds, magnetic fields1 Introduction
The study of the formation of circumstellar discs around protostars still presents considerable theoretical challenges. Because of the presence of magnetic fields in the parent molecular clouds and cores (Crutcher c12 (2012)), assuming the strict conservation of angular momentum during cloud collapse and star formation is not warranted. In fact, according to recent numerical and analytical studies, the main effect of a magnetic field entrained by a collapsing cloud is to brake any rotational motion, at least as long as the field remains frozen in the gas and the rotation axis of the cloud is close to the mean direction of the field (e.g. see Galli et al. gl06 (2006), Mellon & Li ml08 (2008), Hennebelle & Fromang hf08 (2008)). However, discs around Classes I and II young stellar objects are commonly observed (e.g. Williams & Cieza wc11 (2011), Takakuwa et al. ts12 (2012)), and there is also some evidence of discs around Class 0 objects (Tobin et al. th12 (2012), Murillo et al. mu13 (2013)).
Different mechanisms have been invoked as alleviating the problem of magnetic braking during cloud collapse: (i) non-ideal magnetohydrodynamic (MHD) effects (Shu et al. sg06 (2006), Dapp & Basu db10 (2010), Krasnopolsky et al. kl11 (2011), Braiding & Wardle 2012a ; 2012b ); (ii) misalignment between the main magnetic field direction and the rotation axis (Hennebelle & Ciardi hc09 (2009), Joos et al. jh12 (2012)); (iii) turbulent diffusion of the magnetic field (Seifried et al. sb12 (2012), Santos-Lima et al. sd13 (2013), Joos et al. jh13 (2013)); (iv) flux redistribution driven by the interchange instability (Krasnopolsky et al. kl12 (2012)); and (v) depletion of the infalling envelope anchoring the magnetic field (Mellon & Li ml09 (2009), Machida et al. mi11 (2011)).
Non-ideal MHD effects, namely ambipolar, Hall, and Ohmic diffusion, depend on the abundances of charged species and on their mass and charge. The ionisation fraction, in turn, is controlled by cosmic rays (hereafter CRs) in cloud regions of relatively high column density (visual extinction , McKee m89 (1989)) where star formation takes place. The CR ionisation rate is usually assumed to be equal to a “standard” (constant) value of s-1, often called the “Spitzer” value (Spitzer & Tomasko st68 (1968)). However, CRs interacting with in a molecular cloud lose energy by several processes, mainly by ionisation losses (see Padovani et al. pgg09 (2009), hereafter PGG09). As a consequence, while low-energy CRs ( MeV) are possibly prevented from entering a molecular cloud because of streaming instability (Cesarsky & Völk cv78 (1978)), high-energy CRs are slowed down to energies that are relevant for ionisation (ionisation cross sections for protons and electrons colliding with peak at about 100 keV and 0.1 keV, respectively).
PGG09 show that can decrease by about two orders of magnitude from “diffuse” clouds of column density cm-2 to “dense” clouds and massive envelopes with column densities of cm-2. A similar attenuation can in principle take place during the process of cloud collapse, resulting in a decrease in in the inner region of a core where the formation of a protostellar disc is expected to occur. A further attenuation is predicted by the toroidal field component generated by rotation that increases the particles’ path length and enhances the losses by magnetic mirroring (Padovani & Galli pg11 (2011), hereafter PG11). A reduced CR ionisation rate results in a more efficient ambipolar diffusion, which may help to alleviate the magnetic braking problem (Mellon & Li ml09 (2009)). The aim of this paper is to evaluate how variations in can affect the resistivity of the gas, and, eventually, how CRs influence the dynamics of collapse and the formation of a circumstellar disc.
A full treatment of this problem, in which the propagation of CRs is computed self-consistently with the evolution of density and magnetic field, following at the same time the formation and destruction of chemical species, would be prohibitively time-consuming from a numerical point of view. Our approach is therefore a simpler one. First, (a) we sacrifice the self-consistency by taking snapshots at particular evolutionary times of magnetic field configurations and density distributions from ideal MHD simulations that do not include any resistivity of the gas. Second, (b) we propagate CRs in these configurations, and compute the spatial distribution of the CR ionisation rate. Then (c) we build a simplified chemical model (that can be used as a fast subroutine in any dynamical code) to approximately evaluate the chemical composition at each spatial position using as input the distribution of CR ionisation rates determined at the previous step. Finally, (d) we compute the microscopic resistivities (ambipolar, Hall, and Ohmic) and compare the time scale of magnetic field diffusion to the dynamical time scale at each point in the model to determine the region of magnetic decoupling, where . In this region, the dynamics of the gas is unimpeded by magnetic forces, and whatever angular momentum is carried by fluid particles crossing its border, it will be conserved in its interior. In particular, centrifugally supported discs can form inside this region (but not outside). Clearly, the assumption of ideal MHD on which the simulations are based becomes invalid (by definition) inside the decoupling region. In this sense, our calculation is not fully self-consistent. However, our aims in this preliminary investigation are: first, to show whether the extent of the decoupling region can be sufficiently large to allow the formation of a realistic disc (at least AU in radius); second, to compare the size of this region obtained with the accurate treatment of CR attenuation with column density and magnetic field developed in our previous studies and with a constant value of , as usually assumed.
The paper is organised as follows. In Section 2, we provide a description of the model of CR propagation as well as of the numerical simulations adopted. In Section 3 we describe the basic features of the chemical code that we employed to compute the ionisation fractions, exploring the effect of different grain size distributions on abundances. In Section 4 we calculate the diffusion coefficients, and, in Section 5, we use them to calculate the corresponding diffusion time scales. Finally in Section 6 we summarise our conclusions. A full description of the chemical code is given in Appendix A. The dependence of the diffusion coefficients on the grain size distribution is examined in detail in Appendix B. Finally, in Appendix C we describe the contribution to the total diffusion time due to the different diffusion processes.
2 Description of the models
PG11 showed that the magnetic fields of dense molecular cloud cores (modelled as equilibrium configurations) can influence the penetration and propagation of CRs from the intercloud medium to the core centre, affecting the spatial distribution of the ionisation rate. In fact, since charged particles spiral around field lines, CRs propagating in complex magnetic configuration “see” a higher column density than particles moving on straight trajectories, and therefore suffer larger energy losses. In addition, Padovani et al. (phg13 (2013), hereafter PHG13) found that the mirroring effect becomes stronger when the toroidal field component is larger than about 40% of the total field, in the central AU where density is higher than cm-3. This makes the CR ionisation rate, (hereafter we refer specifically to the ionisation of H2), to drop well below s-1 down to about s-1, roughly equal to the ionisation level arising from the decay of long- and short-lived radionuclides within protoplanetary discs (Umebayashi & Nakano un81 (1981), Cleeves et al. cabv13 (2013)). PHG13 performed a numerical study of the propagation of CRs in collapsing clouds using several snapshots of numerical simulations, adopting the formalism developed in PG11. They found that the value of can be orders of magnitude lower than the standard “Spitzer” value in the inner region of a core where the formation of a protostellar disc is expected to take place. From their numerical results, they derived an approximate analytical expression to compute the CR ionisation rate taking both column density and magnetic field effects into account. This formula provides a fast and efficient way to calculate the distribution of that can be employed to estimate the ionisation fractions of charged particles in order to determine the diffusion coefficients.
In the following, we compute the distribution of for three different configurations obtained from numerical simulations performed with the AMR code RAMSES111RAMSES simulations were analysed using PyMSES (Labadens et al. lc11 (2011)). (Teyssier t02 (2002), Fromang et al. fh06 (2006)) with the goal to compute the diffusion time scales in the collapse region. The first two cases are low-mass models from Joos et al. (jh12 (2012)), while the third one represents a high-mass model from Commerçon et al. (in prep.). Table 1 summarises the parameters. We assumed the dependence of on column density given by model in PHG13 (see their Fig. 1). This model is obtained by adopting the CR interstellar proton and electron spectra presented in Webber (w98 (1998)) and Strong et al. (sm00 (2000)), respectively.
| Case | ||||||
|---|---|---|---|---|---|---|
| [rad] | [kyr] | |||||
| 5 | 0 | 0.824 | 1 | – | – | |
| 5 | /2 | 10.756 | 1 | 0.46 | 0.28 | |
| no initial rotation | 6.000 | 100 | 1.24a | 0.87a |
a This value refers to the densest fragment formed.
2.1 Low-mass models
Models and have been already used by PHG13 to calculate maps of the CR ionisation rate (see their Figs. 7 and 10) and they represent two extreme situations: one snapshot taken at the beginning of the simulation and one at the end ( and , respectively). These ideal MHD numerical simulations describe the collapse of a rotating core with initial mass of and a density profile given by a modified power-law,
| (1) |
where cm-3 and pc according to observations (André et al. awt00 (2000), Belloche et al. ba02 (2002)). The ratio of thermal-to-gravitational energy is about 0.25 and the ratio of rotational-to-gravitational energy ratio is about 0.03. Model is a parallel rotator, i.e. the rotation axis is aligned to the magnetic axis, defined as the average direction of the field (). No rotationally supported disc has formed at the time of this particular snapshot ( kyr after the formation of the first Larson’s core). In this case, decreases to values of s-1 in the inner AU radius (see Fig. 7 in PHG13). Model is a perpendicular rotator () and a late-time configuration ( kyr), showing a keplerian disc perpendicular to the rotation axis. Here drops to very low values, down to s-1 in the inner few tens of AU and it is lower than s-1 in a region of about 200 AU radius (see Fig. 10 in PHG13). Clearly, at these low levels, CRs compete with short-lived radionuclides in determining the ionisation fraction (see e.g. Cleeves et al. cabv13 (2013)).
2.2 High-mass model
Model has similar initial conditions as in Commerçon et al. (chh11 (2011)). It consists in a uniform temperature ( K) dense core, with the same density profile shape as in models and ( cm-3, pc, and a factor of 10 in density contrast between the centre and the border of the sphere). The turbulent-to-gravitational energy ratio is about 0.2, corresponding to an initial Mach number of 7, and the thermal-to-gravitational energy ratio is about 0.01. Following Hennebelle et al. (hc11 (2011)) and Commerçon et al. (chh11 (2011)), we apply initial perturbations to the velocity field only to account for initial turbulence in the core, which is not driven at large scales after the start of the calculations. There is no global initial rotation in the model, namely the angular momentum is built from the initial velocity fluctuations. The initial magnetic field is aligned with the -axis and its intensity is proportional to the column density through the cloud.
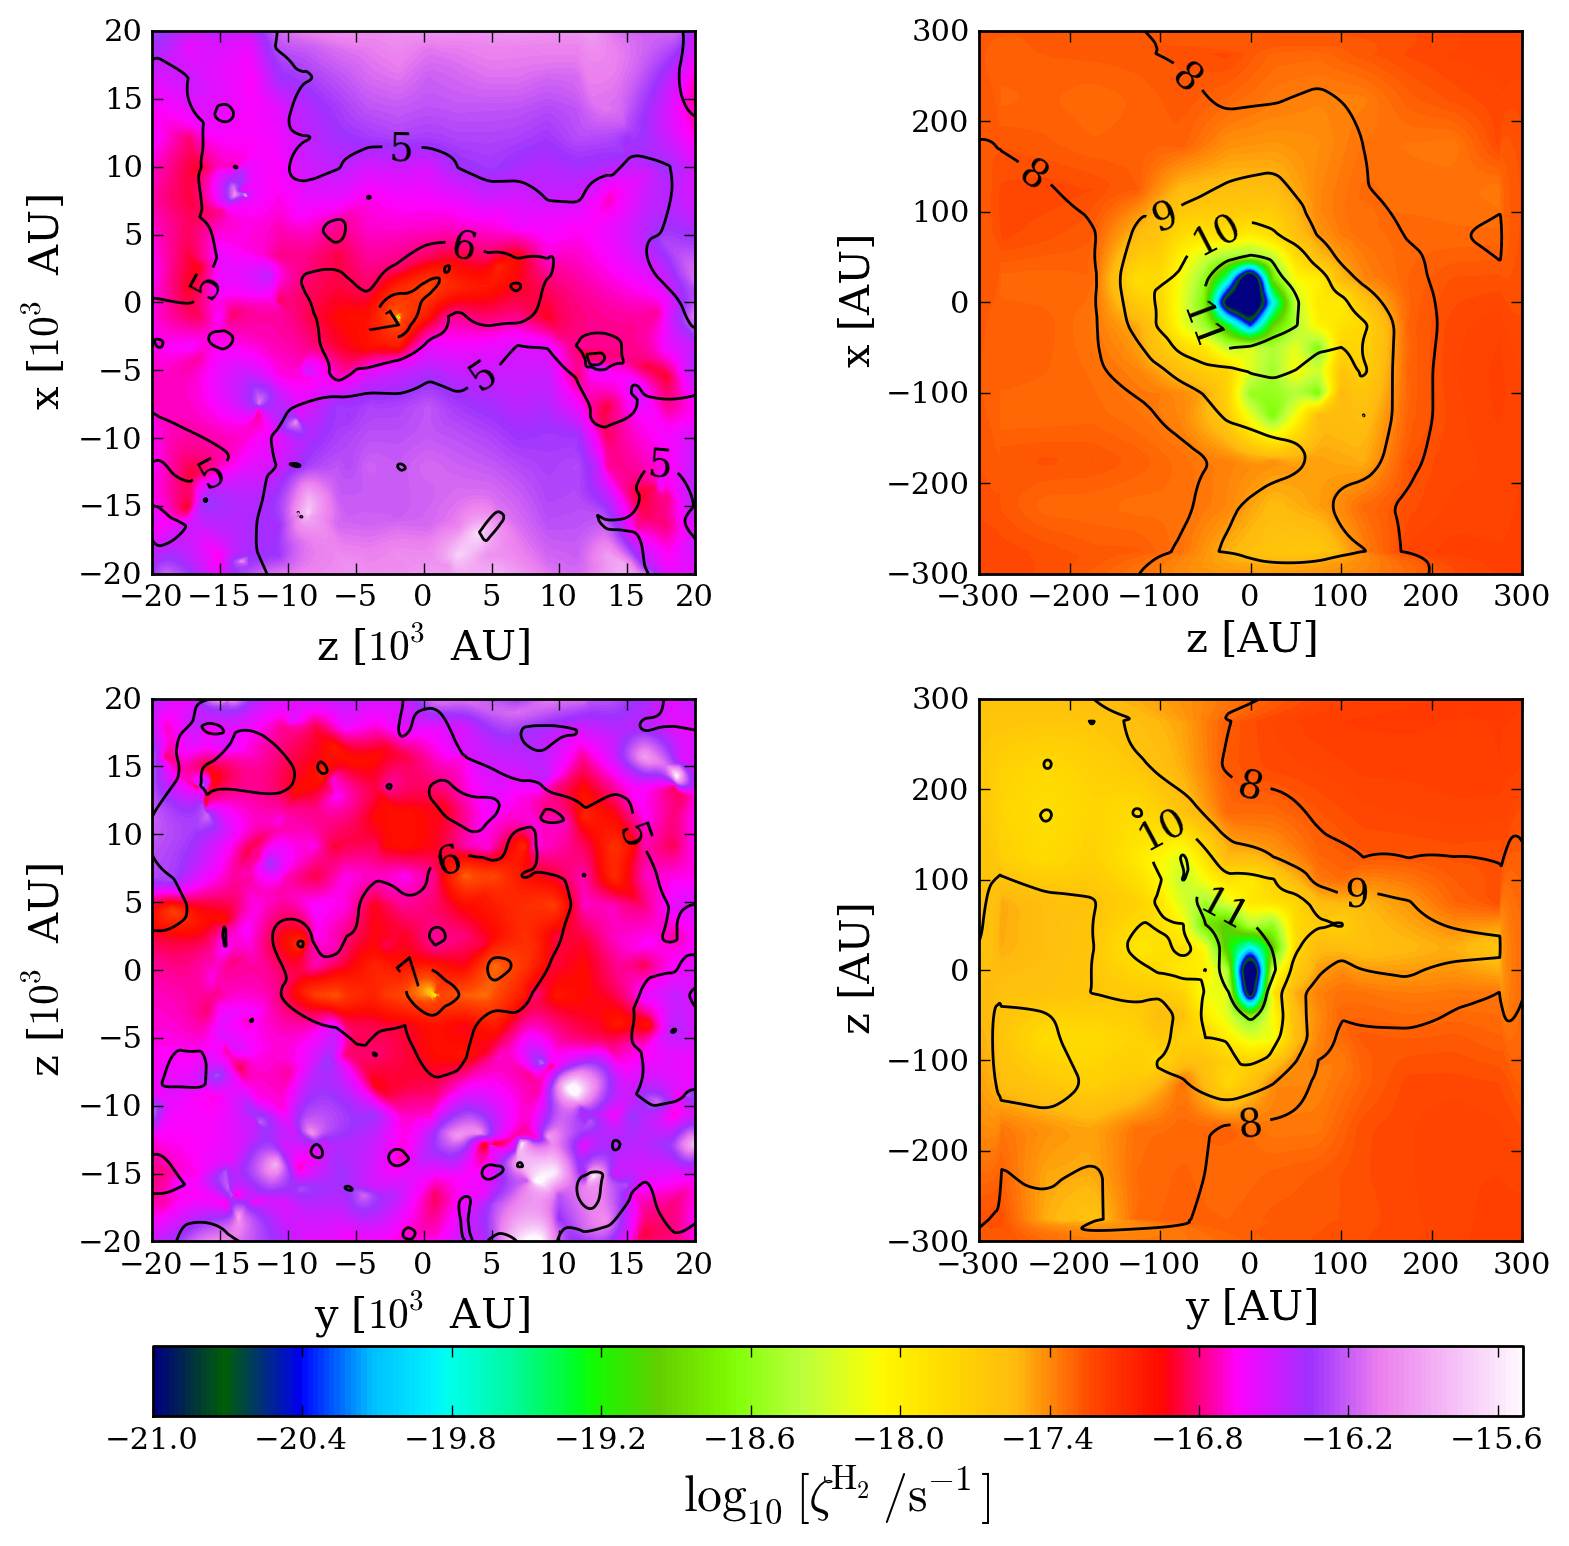
In the following we focus on the densest fragment formed in the calculations whose properties are summarised in Table 1 and we discuss the results only for the plane, since it is close to the disc plane. As model , model shows s-1 in the inner few tens of AU, but in the latter case the region with s-1 is even larger, with a mean radius of 150 AU. At a radius of 300 AU increases only to up to s-1 , while at the same radius model has already reached CR ionisation rate values larger than s-1. This can be explained by noting the larger extent of the region with high density in the high-mass case with respect to the low-mass cases (see Fig. 1).
3 Abundances of charged species
To compute the ionisation fraction we adopt a “minimal” chemical network (a simplified version of more extensive networks, like e.g. in Umebayashi & Nakano 1990) that computes the steady-state abundance of , , a typical molecular ion H+ (e.g. HCO+), a typical “metal” ion (e.g. Mg+), electrons and dust grains as a function of the H2 density, temperature and CR ionisation rate at each spatial position in our models. For each species , the abundance is given by . Neutral hydrogen is assumed to be in the form of , namely . The fraction of charged vs. neutral grains is computed in a simplified way: if the density of electrons is higher than the density of grains, all grains are assumed to carry one electron; otherwise, the fraction of negatively charged grains is determined by charge balance with the positively charged species, and the residual number of grains is assumed to be neutral. Positively charged grains as well as multiple charged grains are ignored for simplicity. A detailed description of the chemical network adopted and a summary of the reactions included is given in Appendix A.
As a benchmark test, we compared our results with those obtained with the publicly available code ASTROCHEM222http://smaret.github.io/astrochem/, that includes about a thousand of reactions, finding comparable results within a factor of 2 to 5. The use of our simplified code is justified by the fact that it allows the calculation of the ionisation fractions for each point of our models, in about 0.7 ms on average against about 20 s needed by ASTROCHEM. Thus, our minimal chemical network, combined with the fitting formula given by Eqs. (19)–(24) of PHG13 to compute , is an effective tool to rapidly compute the fractional abundances and diffusion coefficients at each time step in non-ideal MHD simulations.
3.1 Effects of the grain size distribution
Grains play a decisive role in determining the degree of coupling between the gas and the magnetic field. In fact, the electrical resistivity of the gas depends on the abundance and the size distribution of charged grains: larger grains have a smaller Hall parameter (see Sect. 4) than smaller grains, and therefore are less coupled to the magnetic field. To cover all possible situations, we run our chemical model for three different grain size distribution. In particular, we fix the maximum size, cm (Nakano et al. nn02 (2002)), while we vary the minimum grain size: cm, representative of large grains formed by compression and coagulation during the collapse (Flower et al. fp05 (2005)); cm, the minimum grain radius of a MRN size distribution (Mathis et al. mrn77 (1977)) that gives the same grain opacity found by Flower et al. (fp05 (2005)); and cm, a typical size for very small grains.
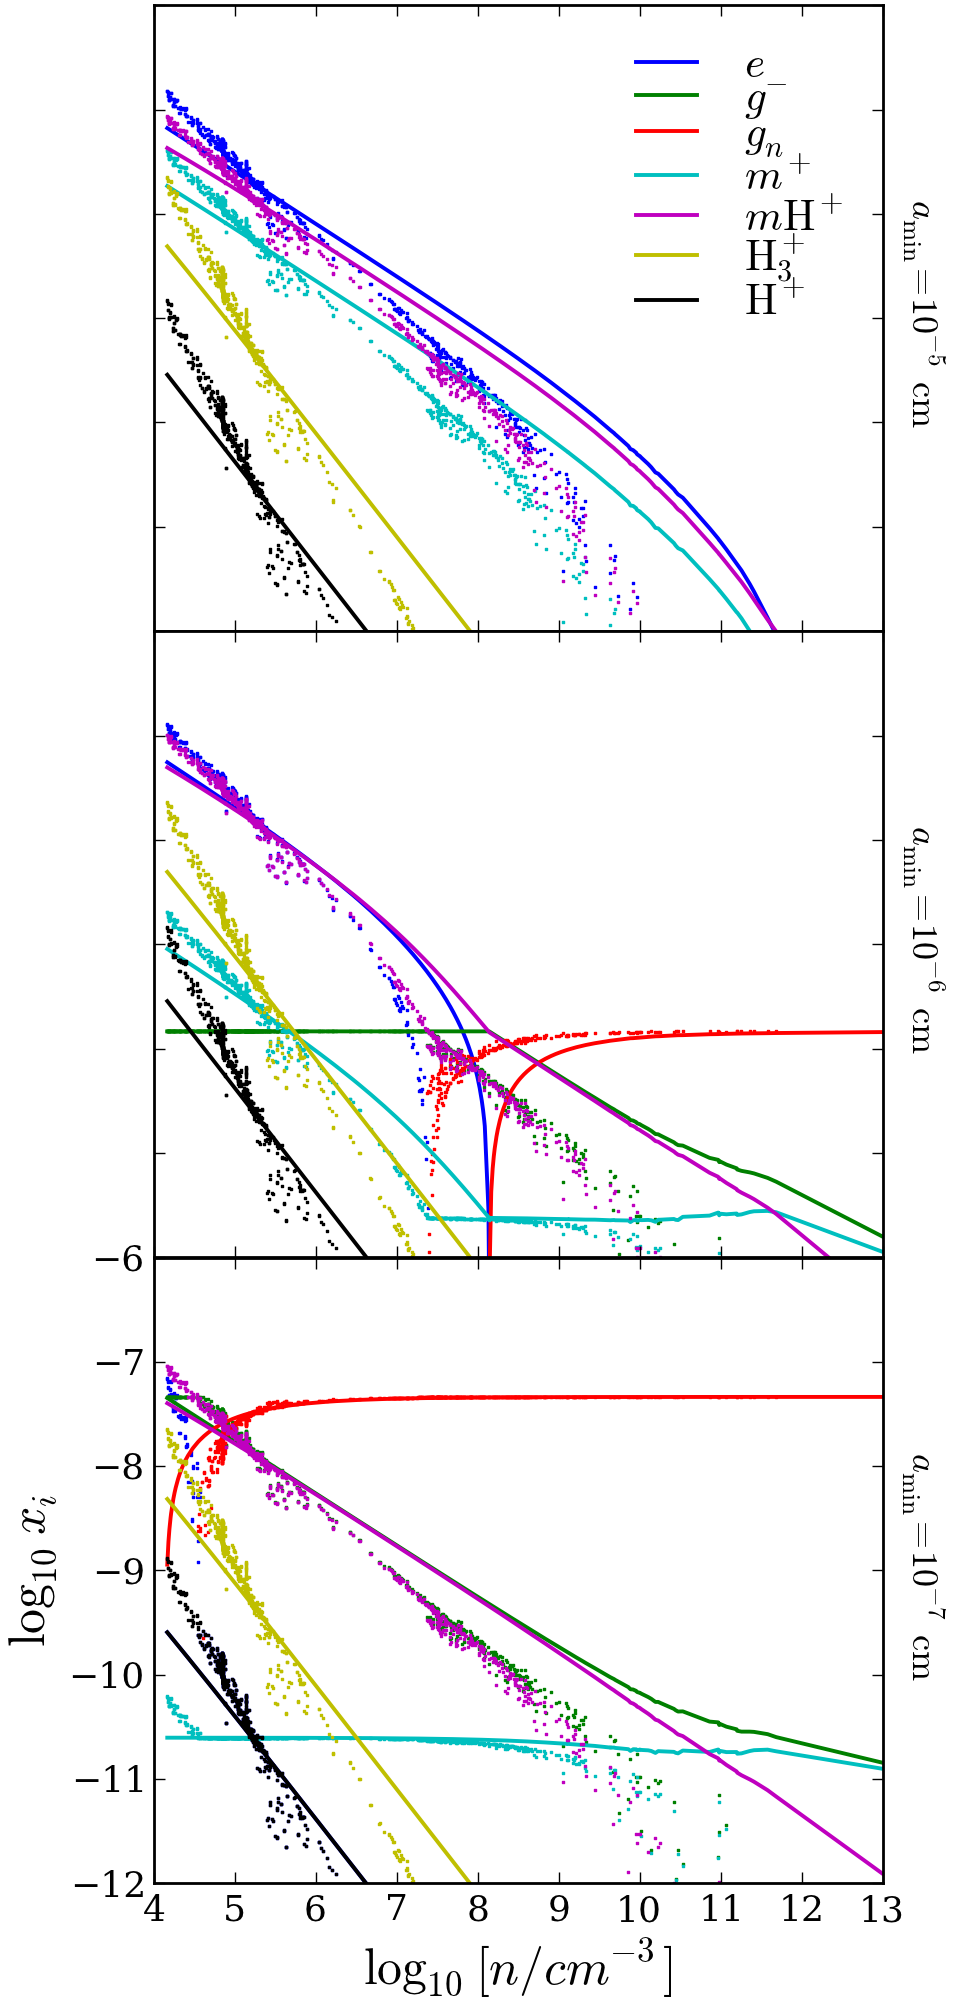
In Fig. 2 we compare the abundances computed with our minimal chemical network assuming a constant s-1 (hereafter “constant-”) with those obtained from the spatially-resolved values of computed by PHG13 (hereafter “variable-”). The comparison is shown only for the model (models and give similar results). As a general remark, independently of , the variable- model gives larger abundances of charged species than the constant- model at cm-3. Conversely, at higher densities, abundances from the variable- model are well below those resulting from the constant- model. This happens because the variable- model is higher than the constant- at cm-3, while it quickly decreases below s-1 at higher densities.
3.2 Dependence of chemical abundances on
The relation between densities of charged species and neutrals is usually expressed in the form
| (2) |
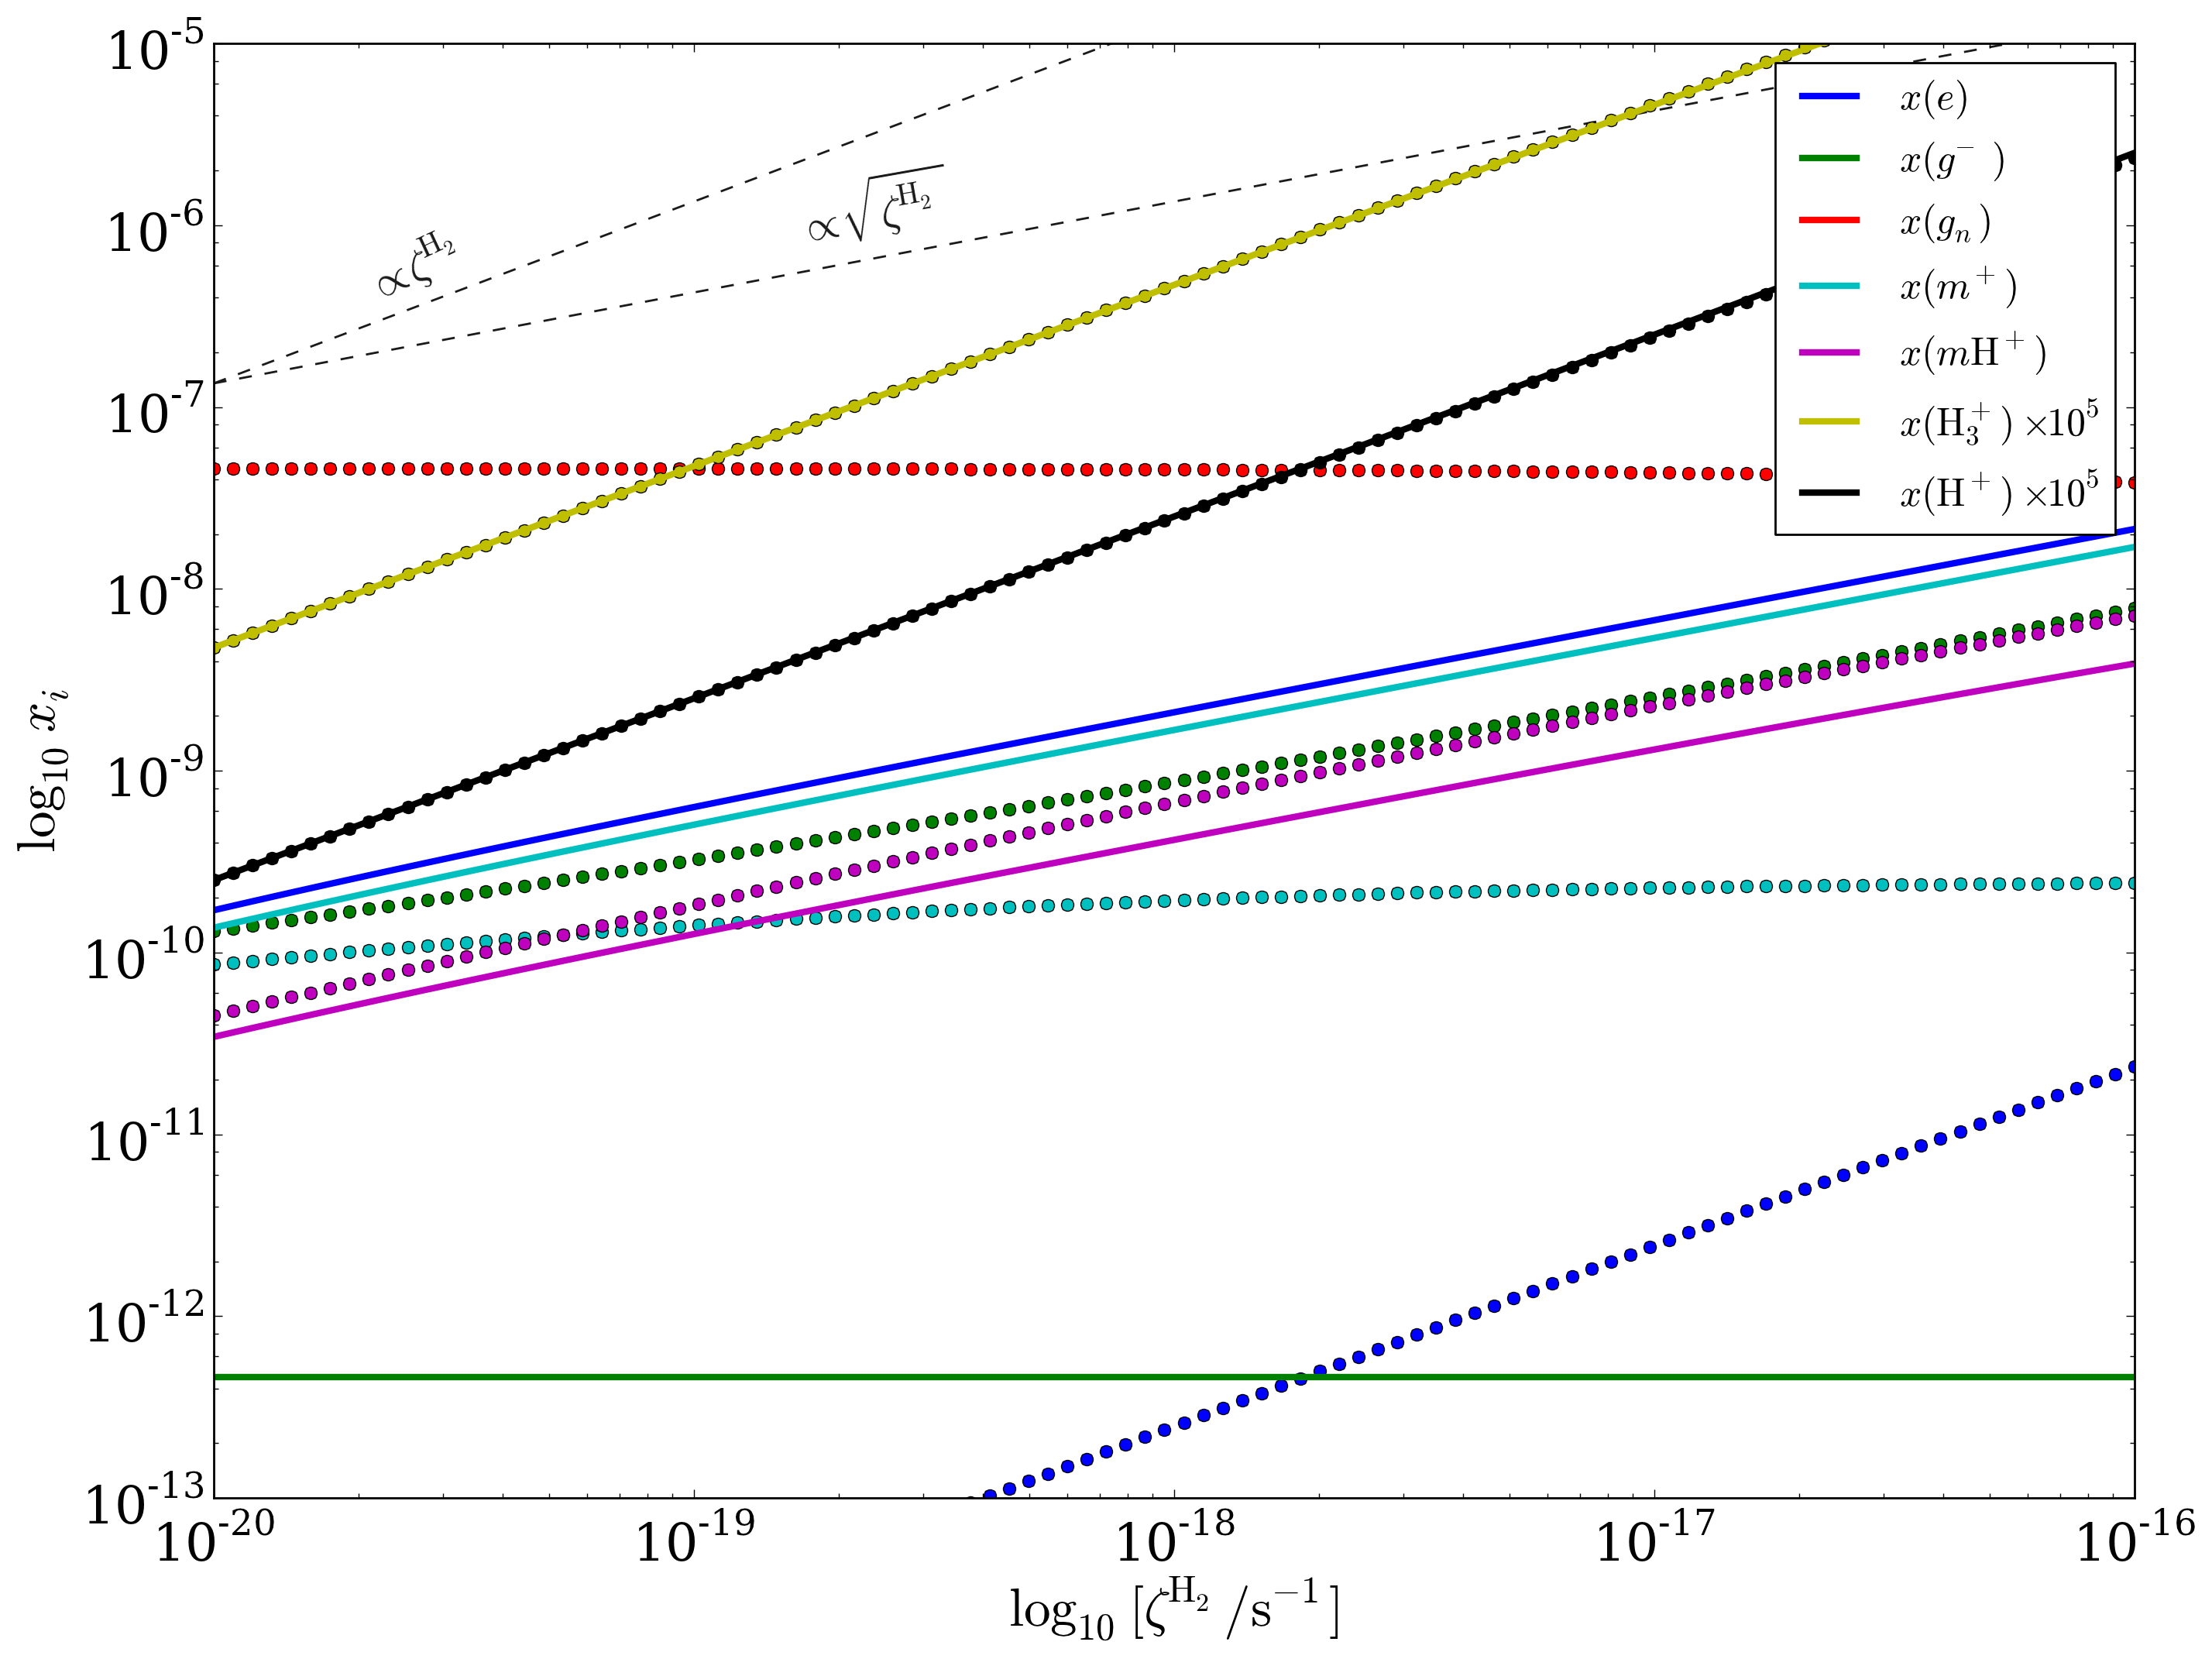
with (e.g. see Ciolek & Mouschovias cm94 (1994, 1995)). However, can differ from depending on the grain size (except for molecular ions). Fig. 3 shows the dependence of the chemical species computed with our minimal model as a function of . As shown by the Figure, in the case of large grains the abundance of electrons and metal ions follows Eq. (2) with , while negatively charged grains are independent of . For small grain size increases towards 1 and for electrons and negative grains, respectively, whereas metal ions become independent of . It is worth noting that in the case of strong depletion, and are the most abundant species and both and are proportional to irrespective of grain size and density.
4 Diffusion coefficients
The electrical resistivity of a plasma is a measure of the ability of the magnetic field and the charges attached to it to move (diffuse) with respect to the neutrals and/or other charges. In the weakly ionised gas that characterise dense cores, the resistivity is dominated by ambipolar diffusion, a process by which charged particles develop a drift velocity with respect to the neutral component, and the Lorentz force acting on the charges is conveyed to the neutral gas through collisions.
For each charged species in a sea of neutrals (molecular hydrogen), the parameter gauging the relative importance of the Lorentz and drag forces is the Hall parameter (e.g. Wardle & Ng wn99 (1999)) defined by
| (3) |
where and are the mass and the charge of the species , respectively, and is the molecular weight for the assumed fractional abundances of and He. The momentum transfer rate coefficients have been parameterised as a function of temperature and relative speed in Pinto & Galli (pg08 (2008)).
Drifts of charged species with respect to neutrals determines different regimes for the magnetic diffusivity. The induction equation then becomes
where is the fluid velocity and the magnetic field vector. Ambipolar, Hall, and Ohmic resistivities (, , and , respectively) can be written as a function of the parallel (), Pedersen () and Hall () conductivities (e.g. see Wardle w07 (2007), Pinto et al. pgb08 (2008))
| (5) | |||||
| (6) | |||||
| (7) |
which are defined by
| (8) | |||||
| (9) | |||||
| (10) |
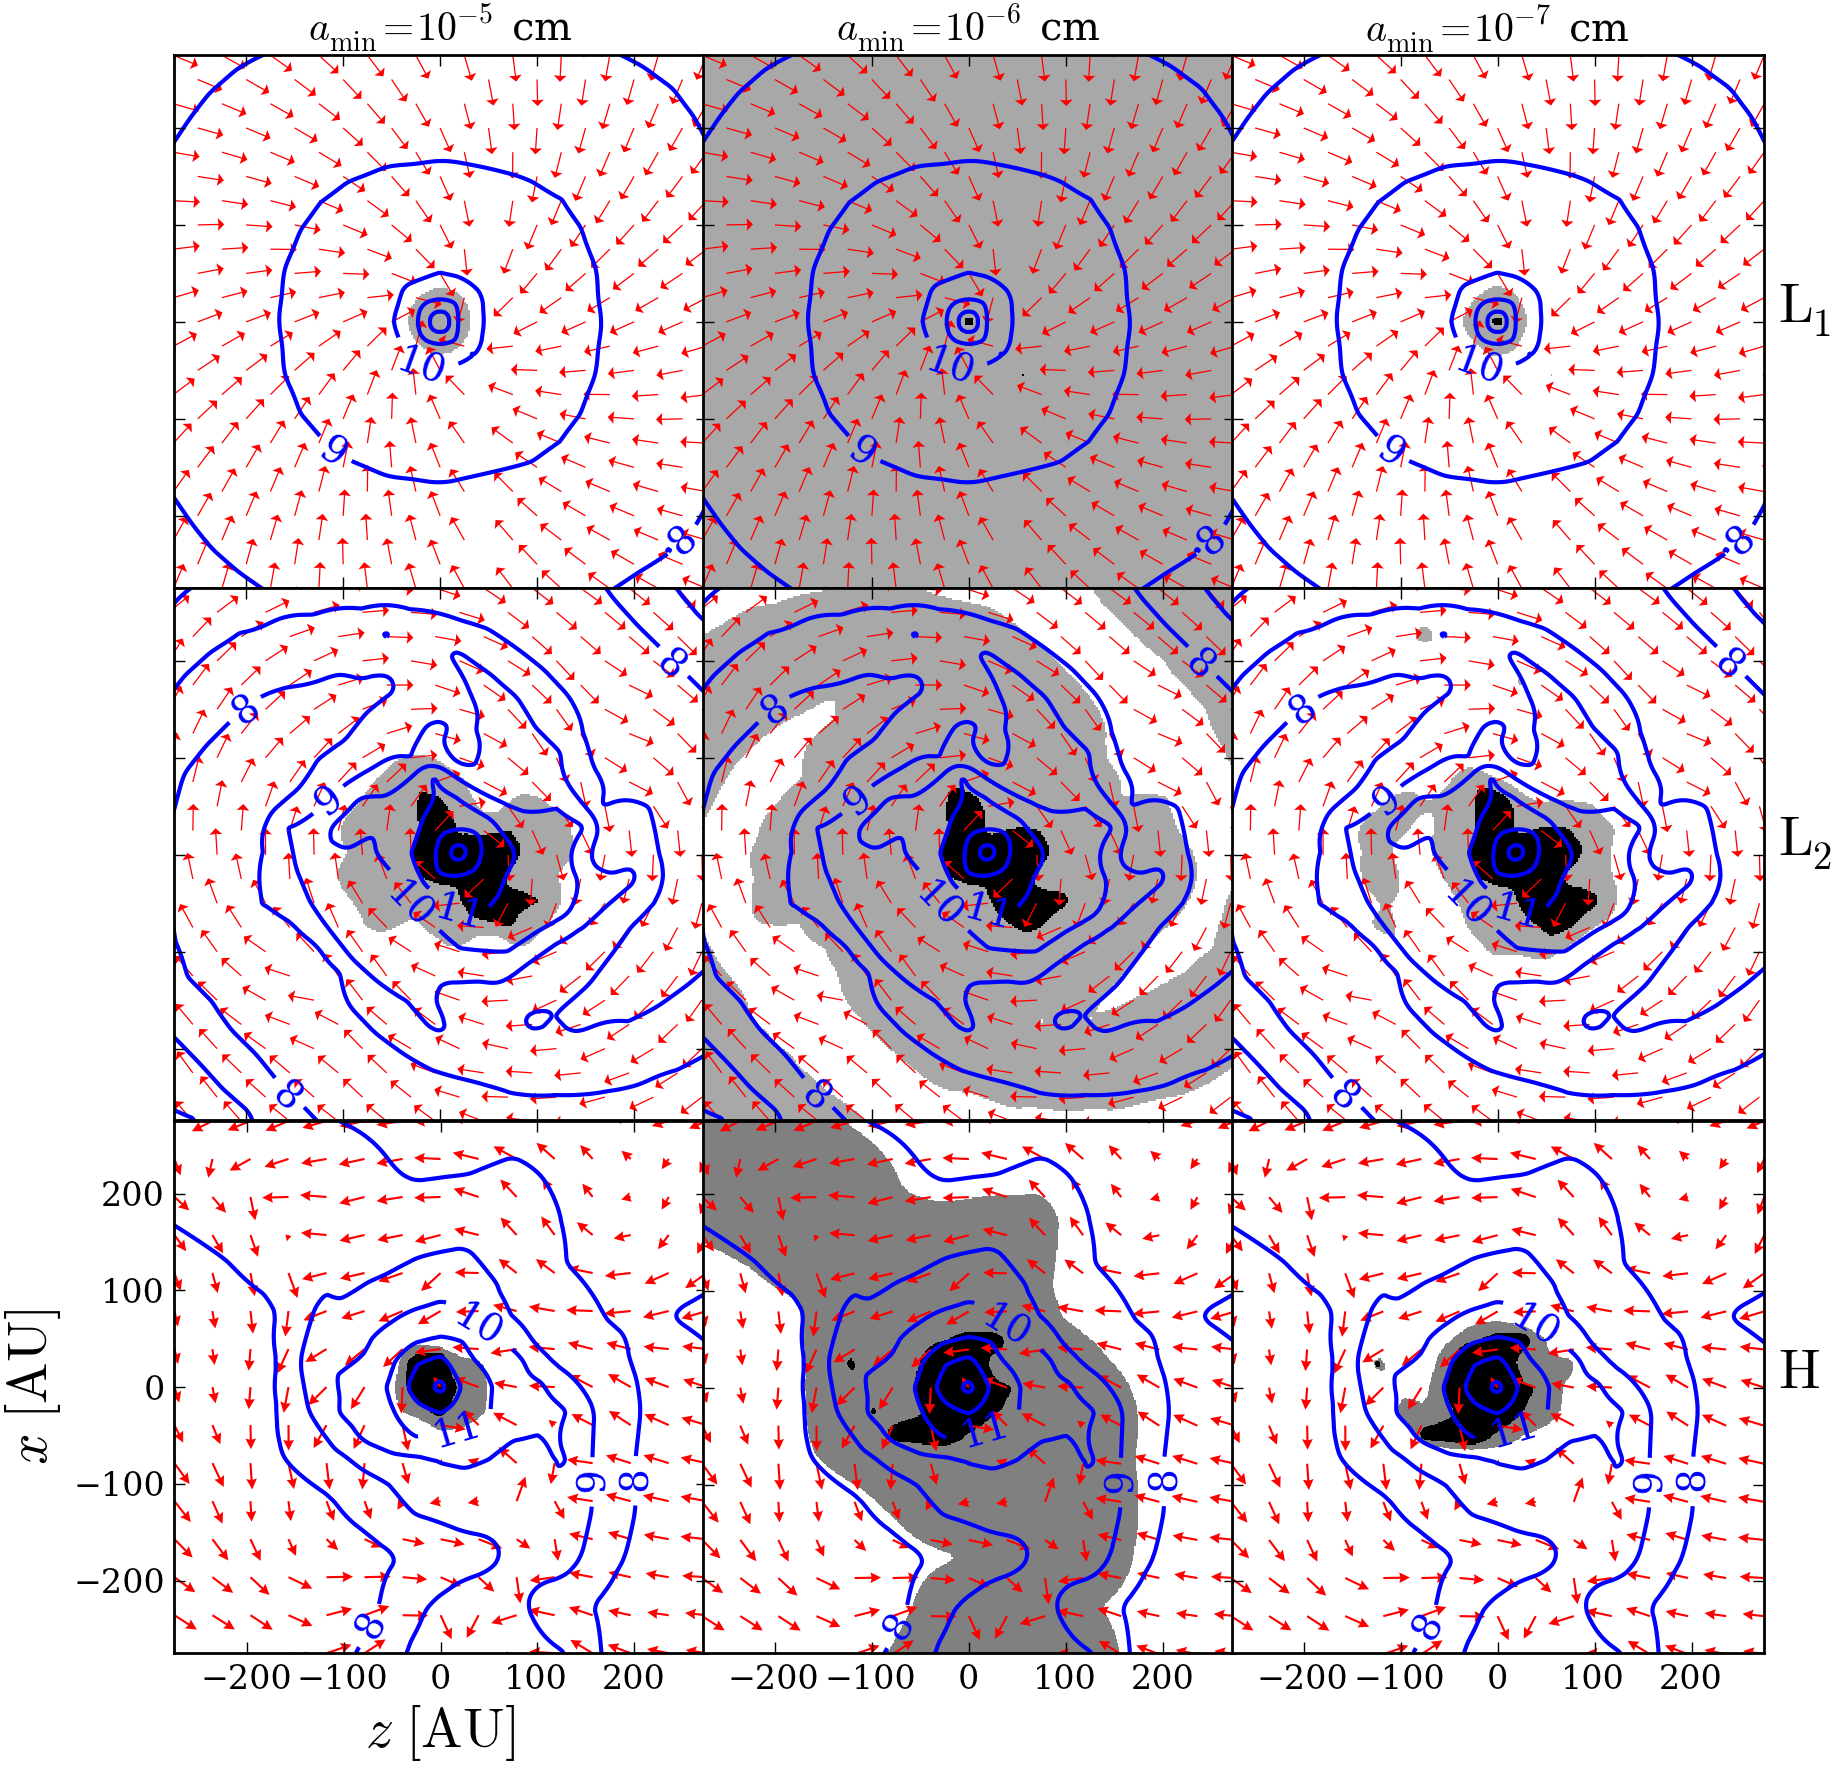
In general, the ambipolar resistivity term controls diffusion in low density regions ( cm-3), whereas Hall diffusion dominates at intermediate densities ( cm cm-3) and Ohmic dissipation sets in at even higher densities ( cm-3), see Umebayashi & Nakano (un81 (1981)). However, the extent to which a diffusion process dominates over the others hinges on several factors, one of which is the assumed grain size distribution. To show this effect, we computed the ionisation fractions using the values of for the three models (, , and ) and we compared the spatial distribution of the corresponding resistivities varying . Background colours in Fig. 4 show the predominant diffusion mechanism. The distributions with and cm lead to similar results, independently on the distribution of . This can be explained by looking at the trend of the different resistivity contributions as a function of the grain size and (see Appendix B). In fact, the ambipolar diffusion term does not increase monotonically with grain radius but, at densities of cm-3, it shows an absolute minimum around cm, while the Hall term continues to grow. At the highest densities the Ohmic term prevails, except for model . The Hall term can play an important role down to densities of about cm-3 for cm.
5 Diffusion time scales
The drift velocity of the magnetic field can be represented by the velocity of the charged species, which are frozen with field lines, with respect to neutrals. From the comparison of this velocity with the fluid velocity, it is possible to assess the degree of diffusion of the field and then to estimate the size of the region where gas and magnetic field are decoupled. In principle, a more direct estimate of the reduction of magnetic braking resulting from a decrease in the CR ionisation rate would come from a comparison between the magnetic braking time with the dynamical time of the flow. However, a simple estimate of the former is not straightforward, as it depends crucially on the field morphology, strength, and relative orientation of the average field direction and the cloud’s angular momentum. For this reason, we prefer to present a comparison, at each spatial position at a given time step, between the diffusion time of the field and the dynamical time of the flow as defined in the following.
The magnetic field drift velocity can be written as a function of resistivities (Nakano et al. nn02 (2002)), allowing to isolate the ambipolar (AD), Hall (H), and Ohmic (O) contributions, namely
| (11) |
where
| (12) | |||||
| (13) | |||||
| (14) |
and
| (15) |
where is the current density. Thus, the diffusion time of the magnetic field, , can be written as a function of the time scales associated to the three diffusion processes,
| (16) |
where () and a typical length scale of the region (in the following at each point we take equal to the distance from the density peak). The diffusion time of the magnetic field can then be compared to the time scale of evolution of the fluid (for example, Nakano et al. nn02 (2002) compare to the free-fall time of a spherical homogeneous cloud). In this work we define the dynamical time scale of the cloud as , where is the fluid velocity, including both infall and rotation. In regions where the magnetic field is partially decoupled and therefore has less influence on the gas dynamics while, if , diffusion is not efficient enough and the magnetic field remains well coupled to the gas. To stress the importance of properly taking the propagation of CRs inside a molecular cloud into account, we also compare the dynamical time with the diffusion time computed in the constant- case assuming s-1 (hereafter ), and in the variable- case, taking from PHG13 (hereafter .
5.1 Low-mass models
Figure 5 shows contours of diffusion and dynamical time scales for the aligned rotator model . Although the disc is not formed at this early stage ( kyr), for cm in the variable- case the magnetic diffusion time becomes shorter than the dynamical time in a central region with a radius of about 20 AU. For smaller grains, is always larger than and no decoupling zone is formed. The diffusion time computed in the constant- case is about one order of magnitude longer. Even at later times ( kyr), Joos et al. (jh12 (2012)) find no disc formation for this aligned rotator simulation. However, the low ionisation rate found by PHG13 in a small central region of density higher than cm-3 (see their Fig. 8) can presumably promote the formation of a centrifugally supported disc via enhanced Ohmic and Hall diffusion, at least in the case of large grains.
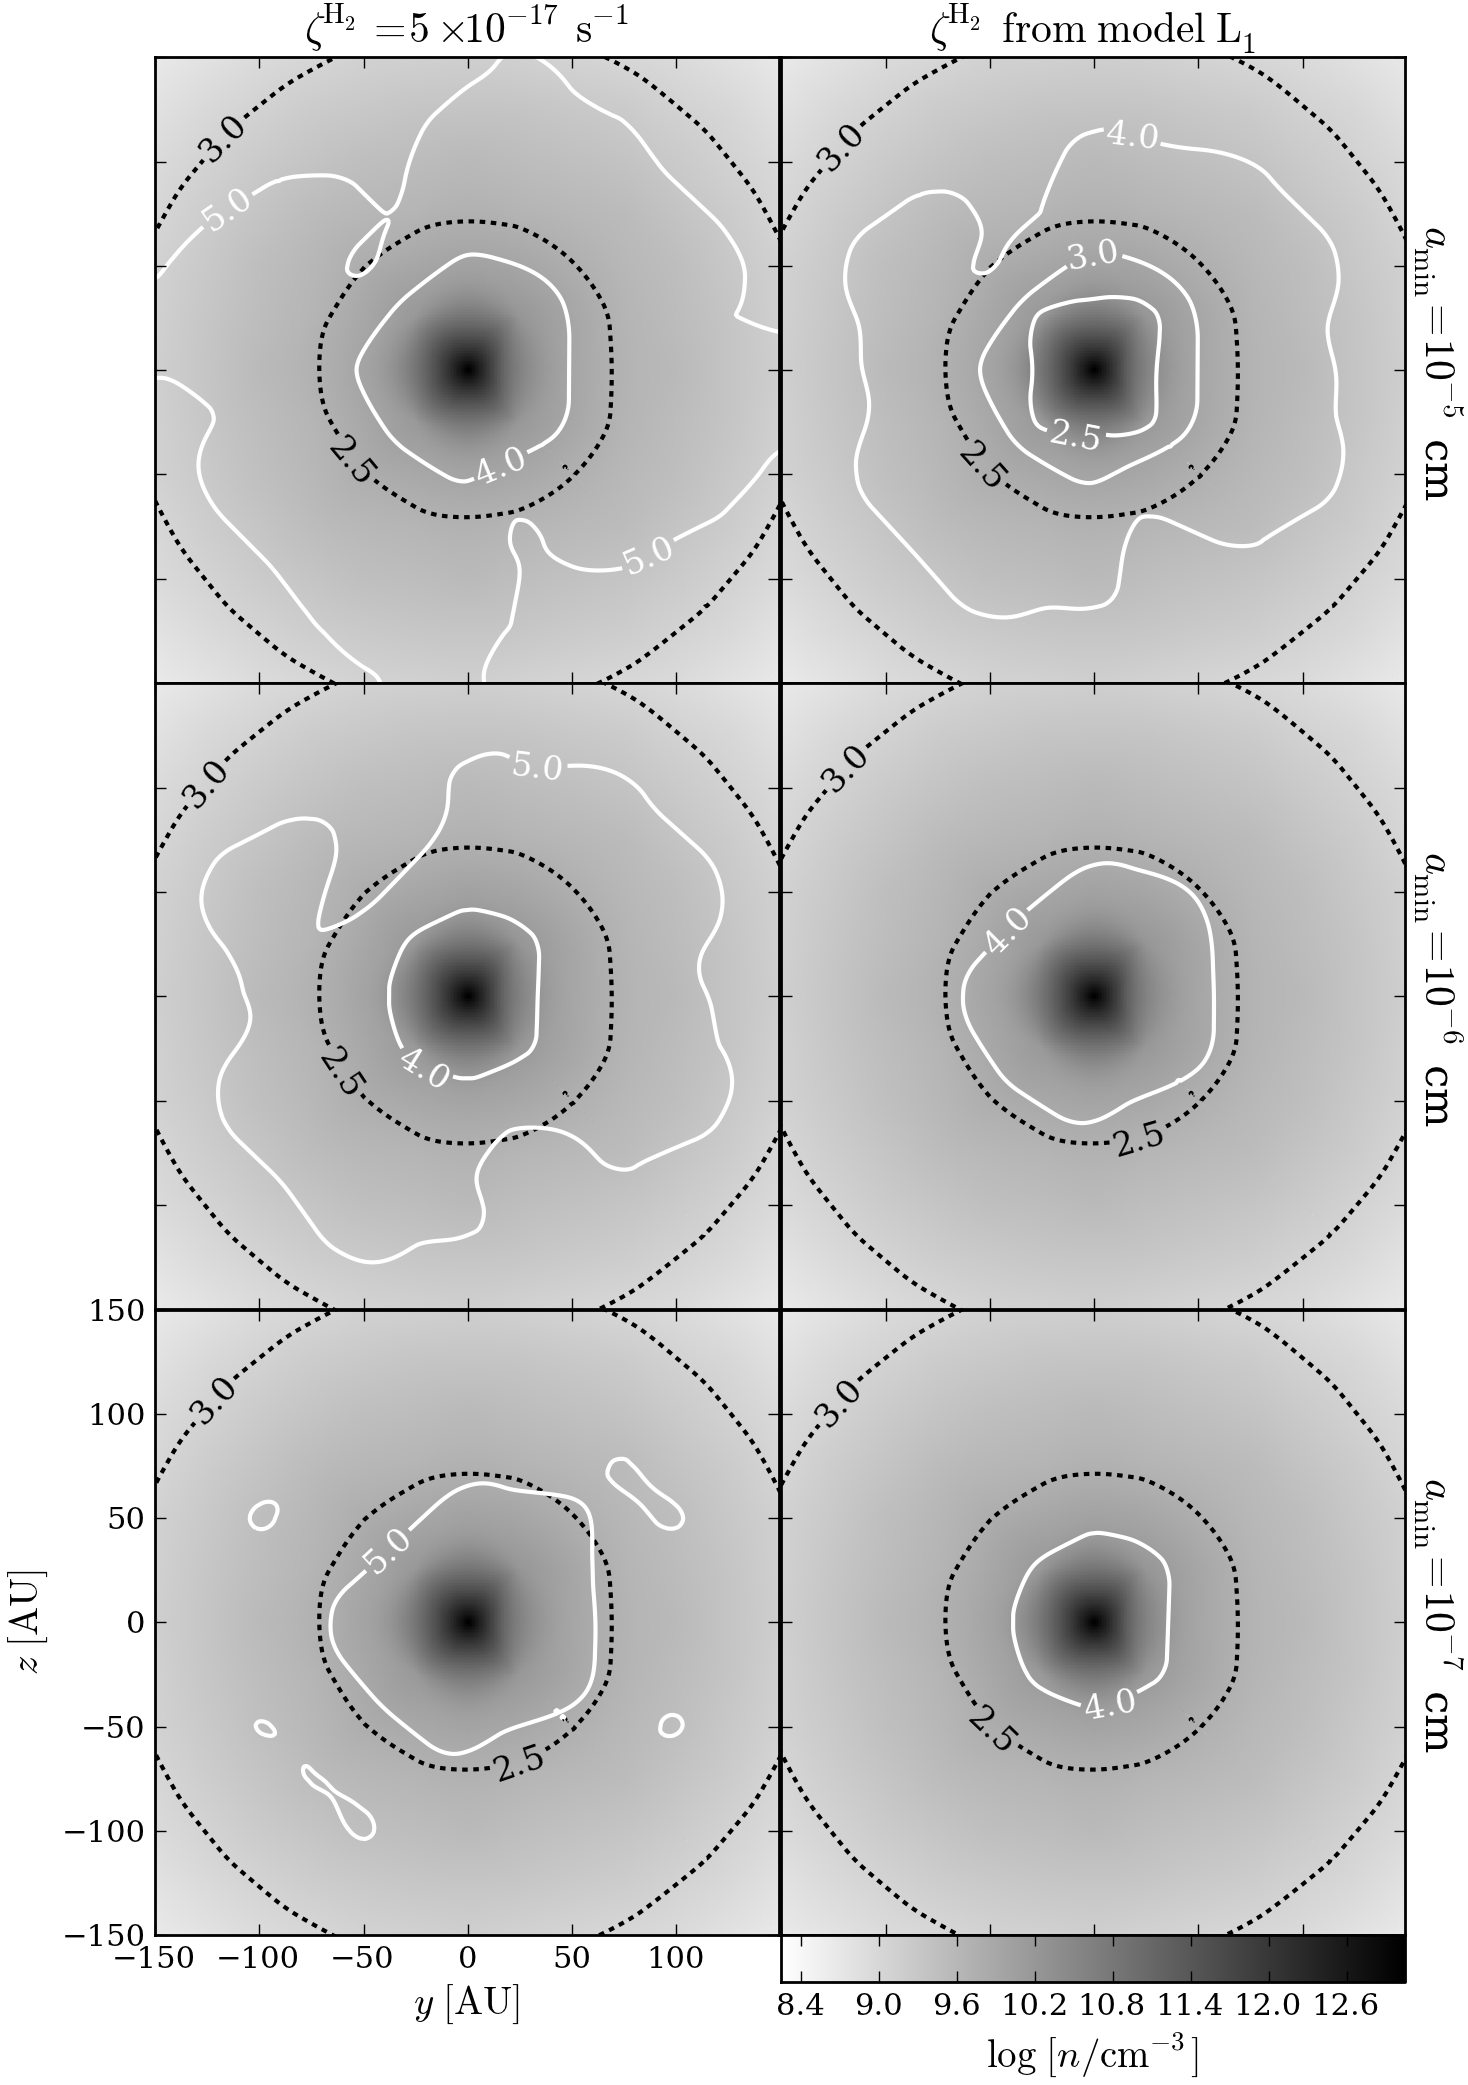
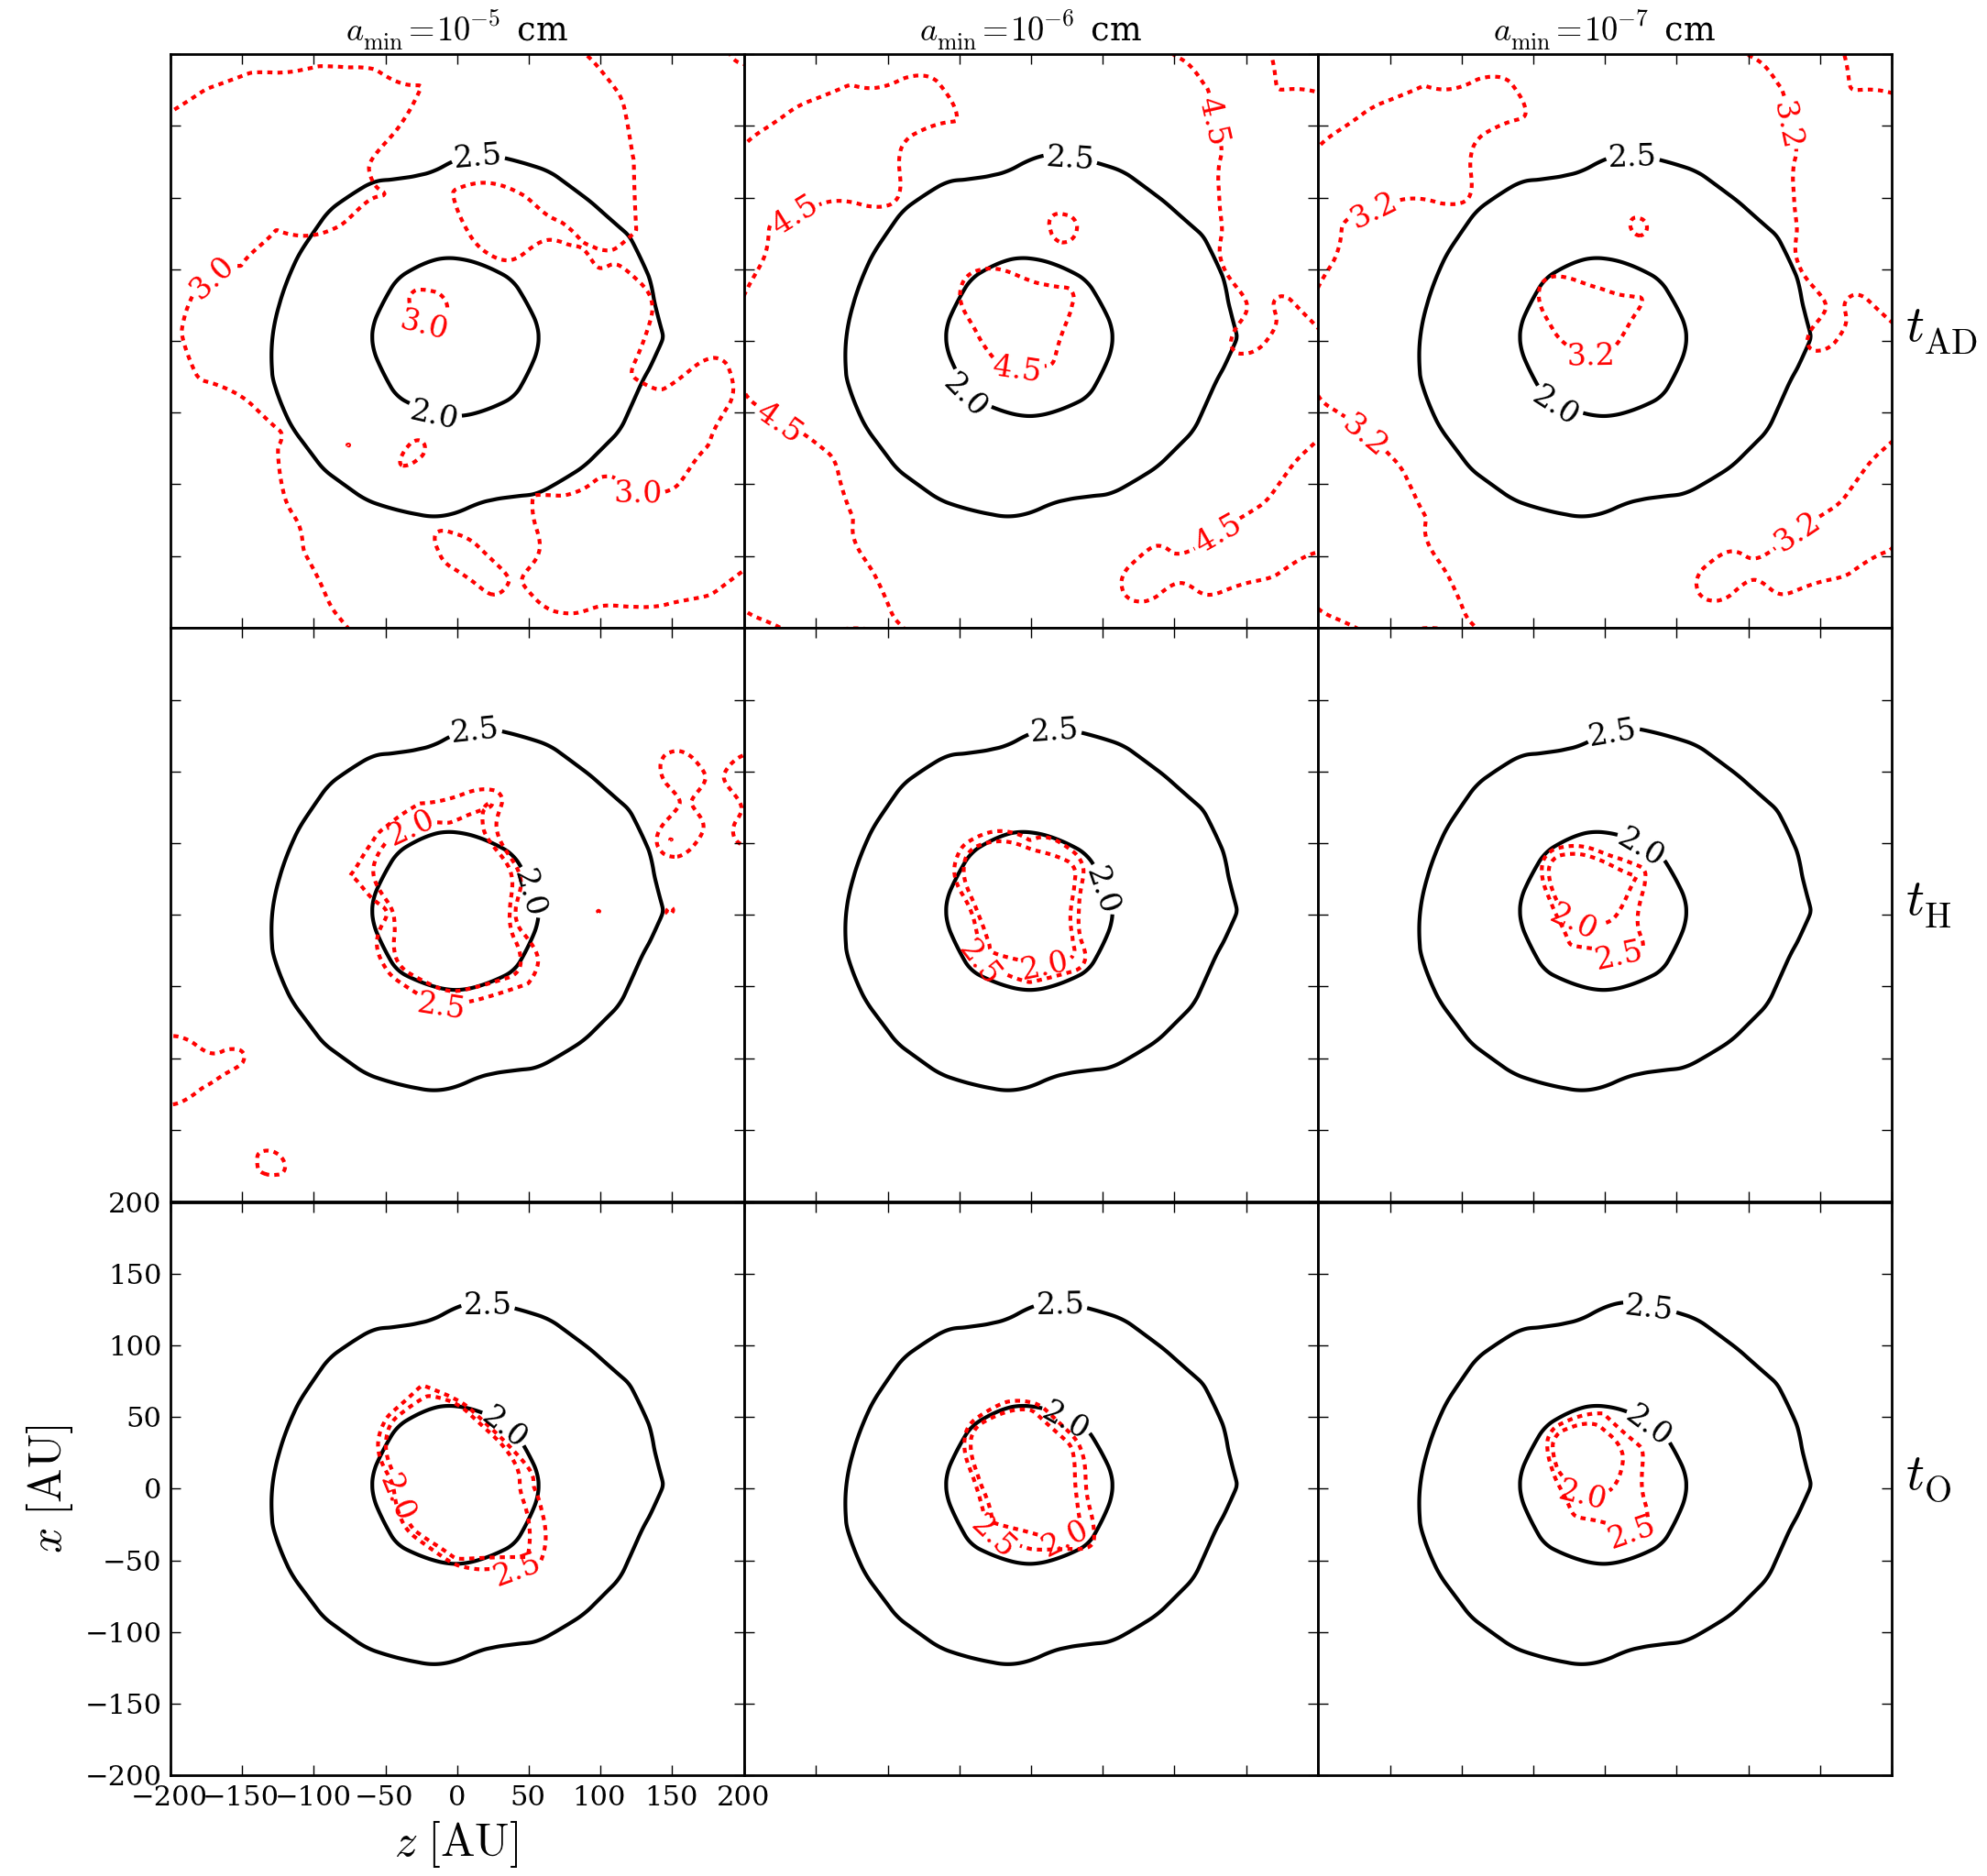
A more interesting case is shown by the model (Fig. 6), where a protostellar disc of radius AU has formed. While is always larger than , is lower than inside a decoupling zone whose size depends on . Magnetic decoupling is favoured by large grains ( cm) that are expected to form by coagulation of smaller grains during the collapse. In particular, the lower left panel shows that in the inner region with a radius of about 50 AU the gas experiences collapse while the magnetic field diffuses. The region of decoupling shrinks with decreasing , but even with the smallest cm the decoupling occurs inside a region of about 20 AU of radius. This comparison definitely proves that CRs play a crucial role in determining the protostellar collapse time scale. In fact, the correct evaluation of the CR ionisation rate as a function of density and magnetic field allows the diffusion time to decrease up to three order of magnitudes. In Appendix C we also show separately the contribution to resulting from ambipolar, Hall, and Ohmic diffusion, respectively.
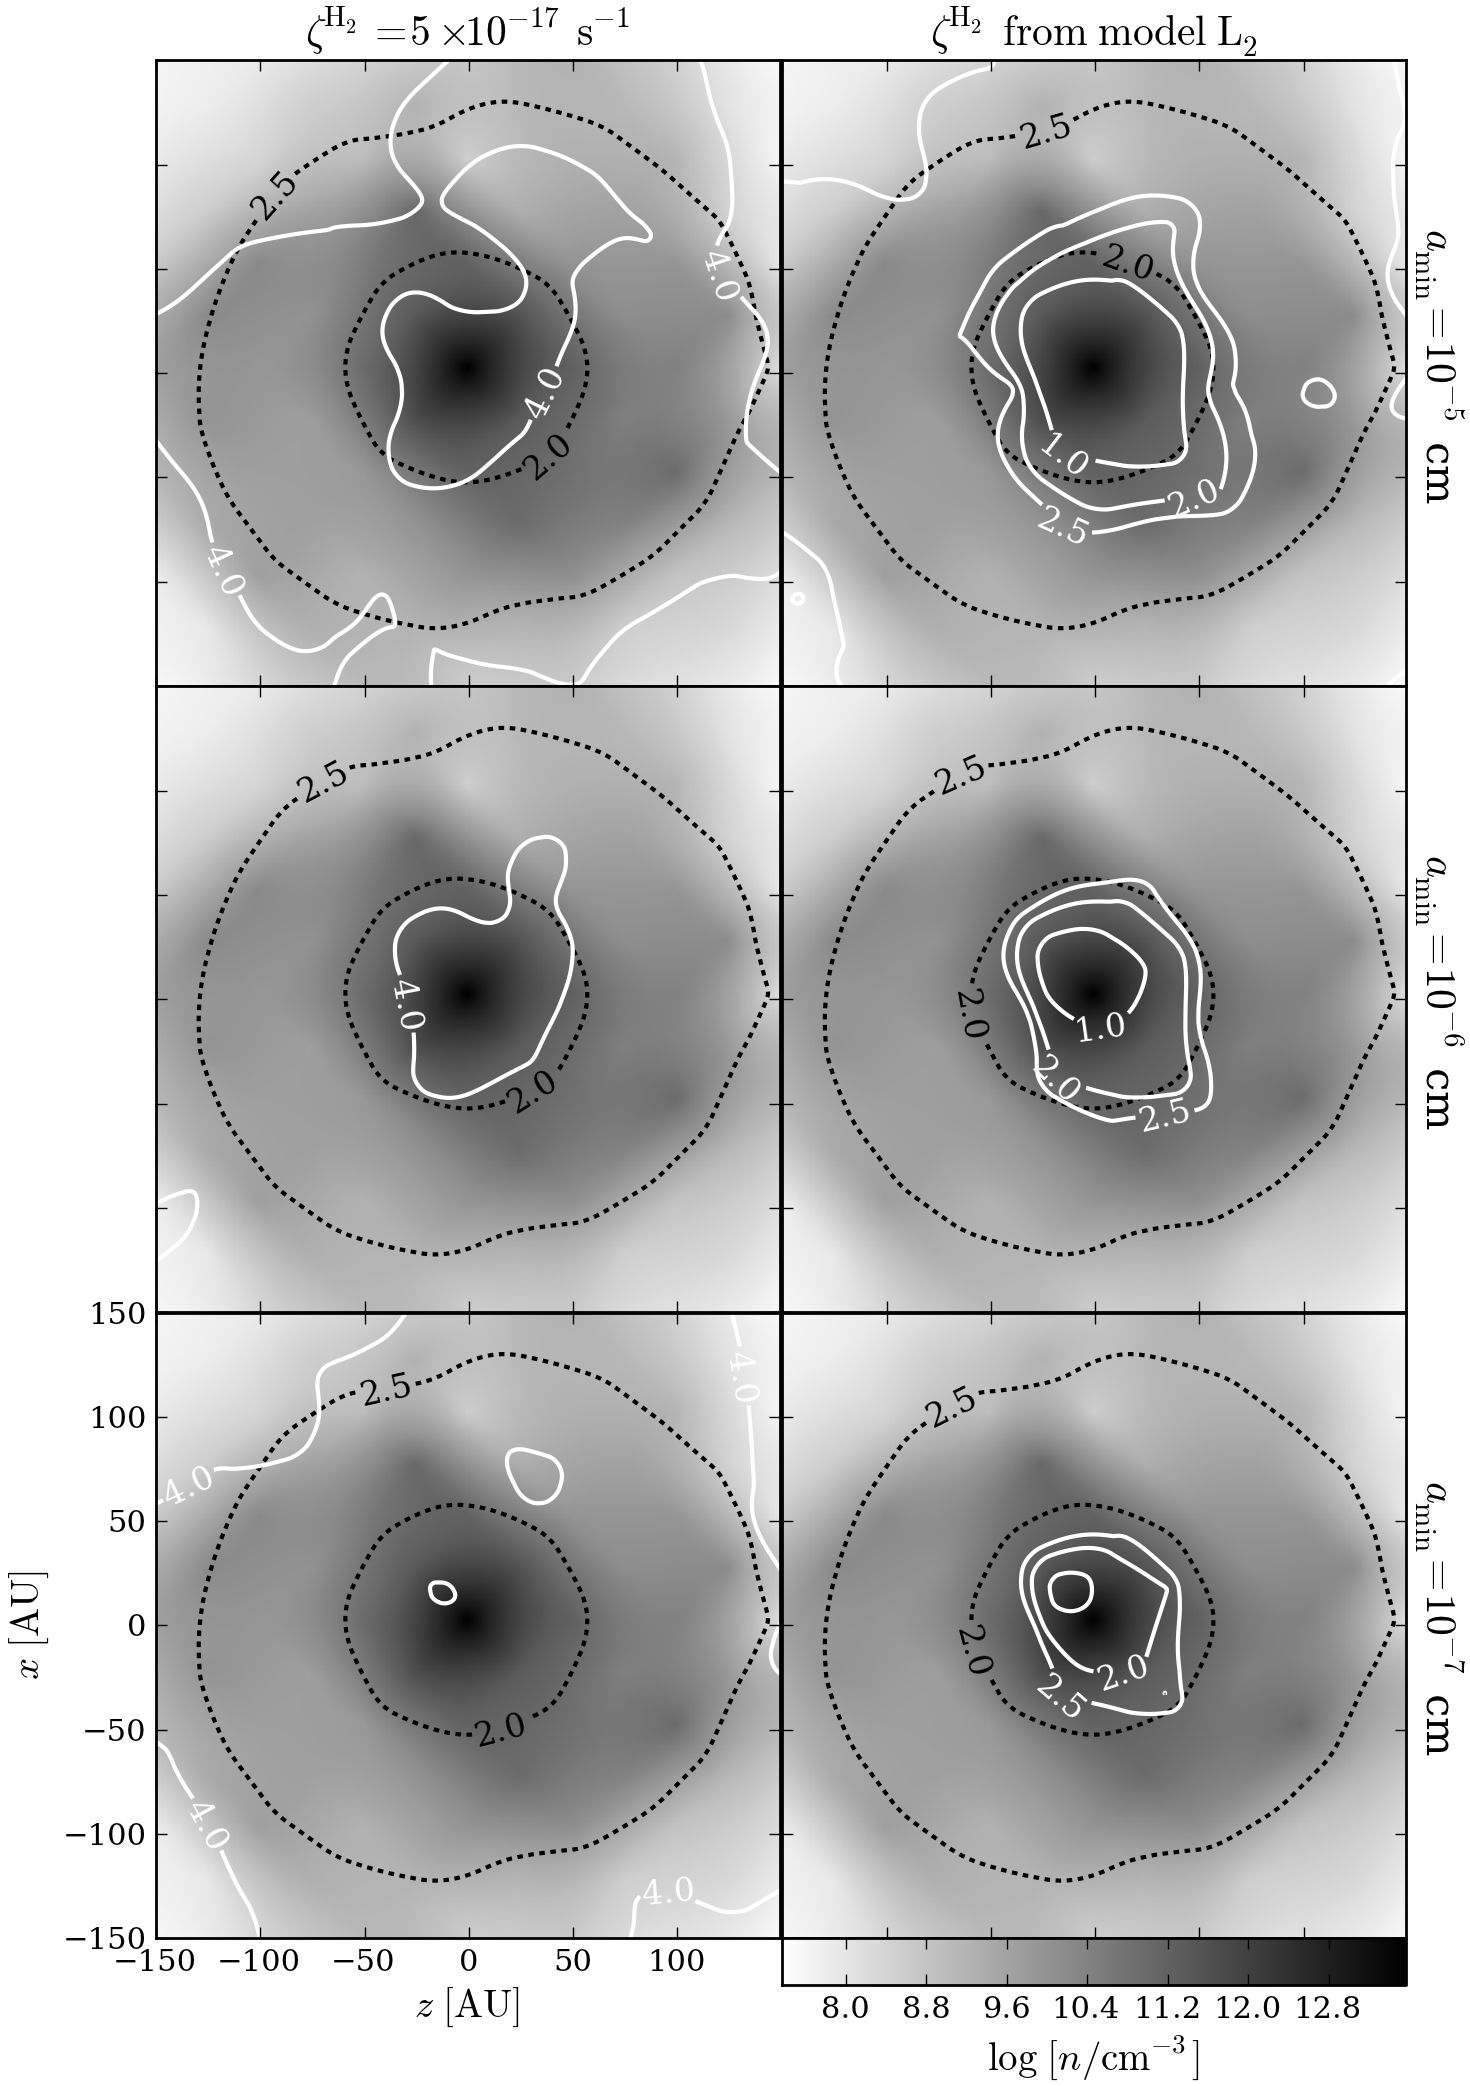
5.2 High-mass model
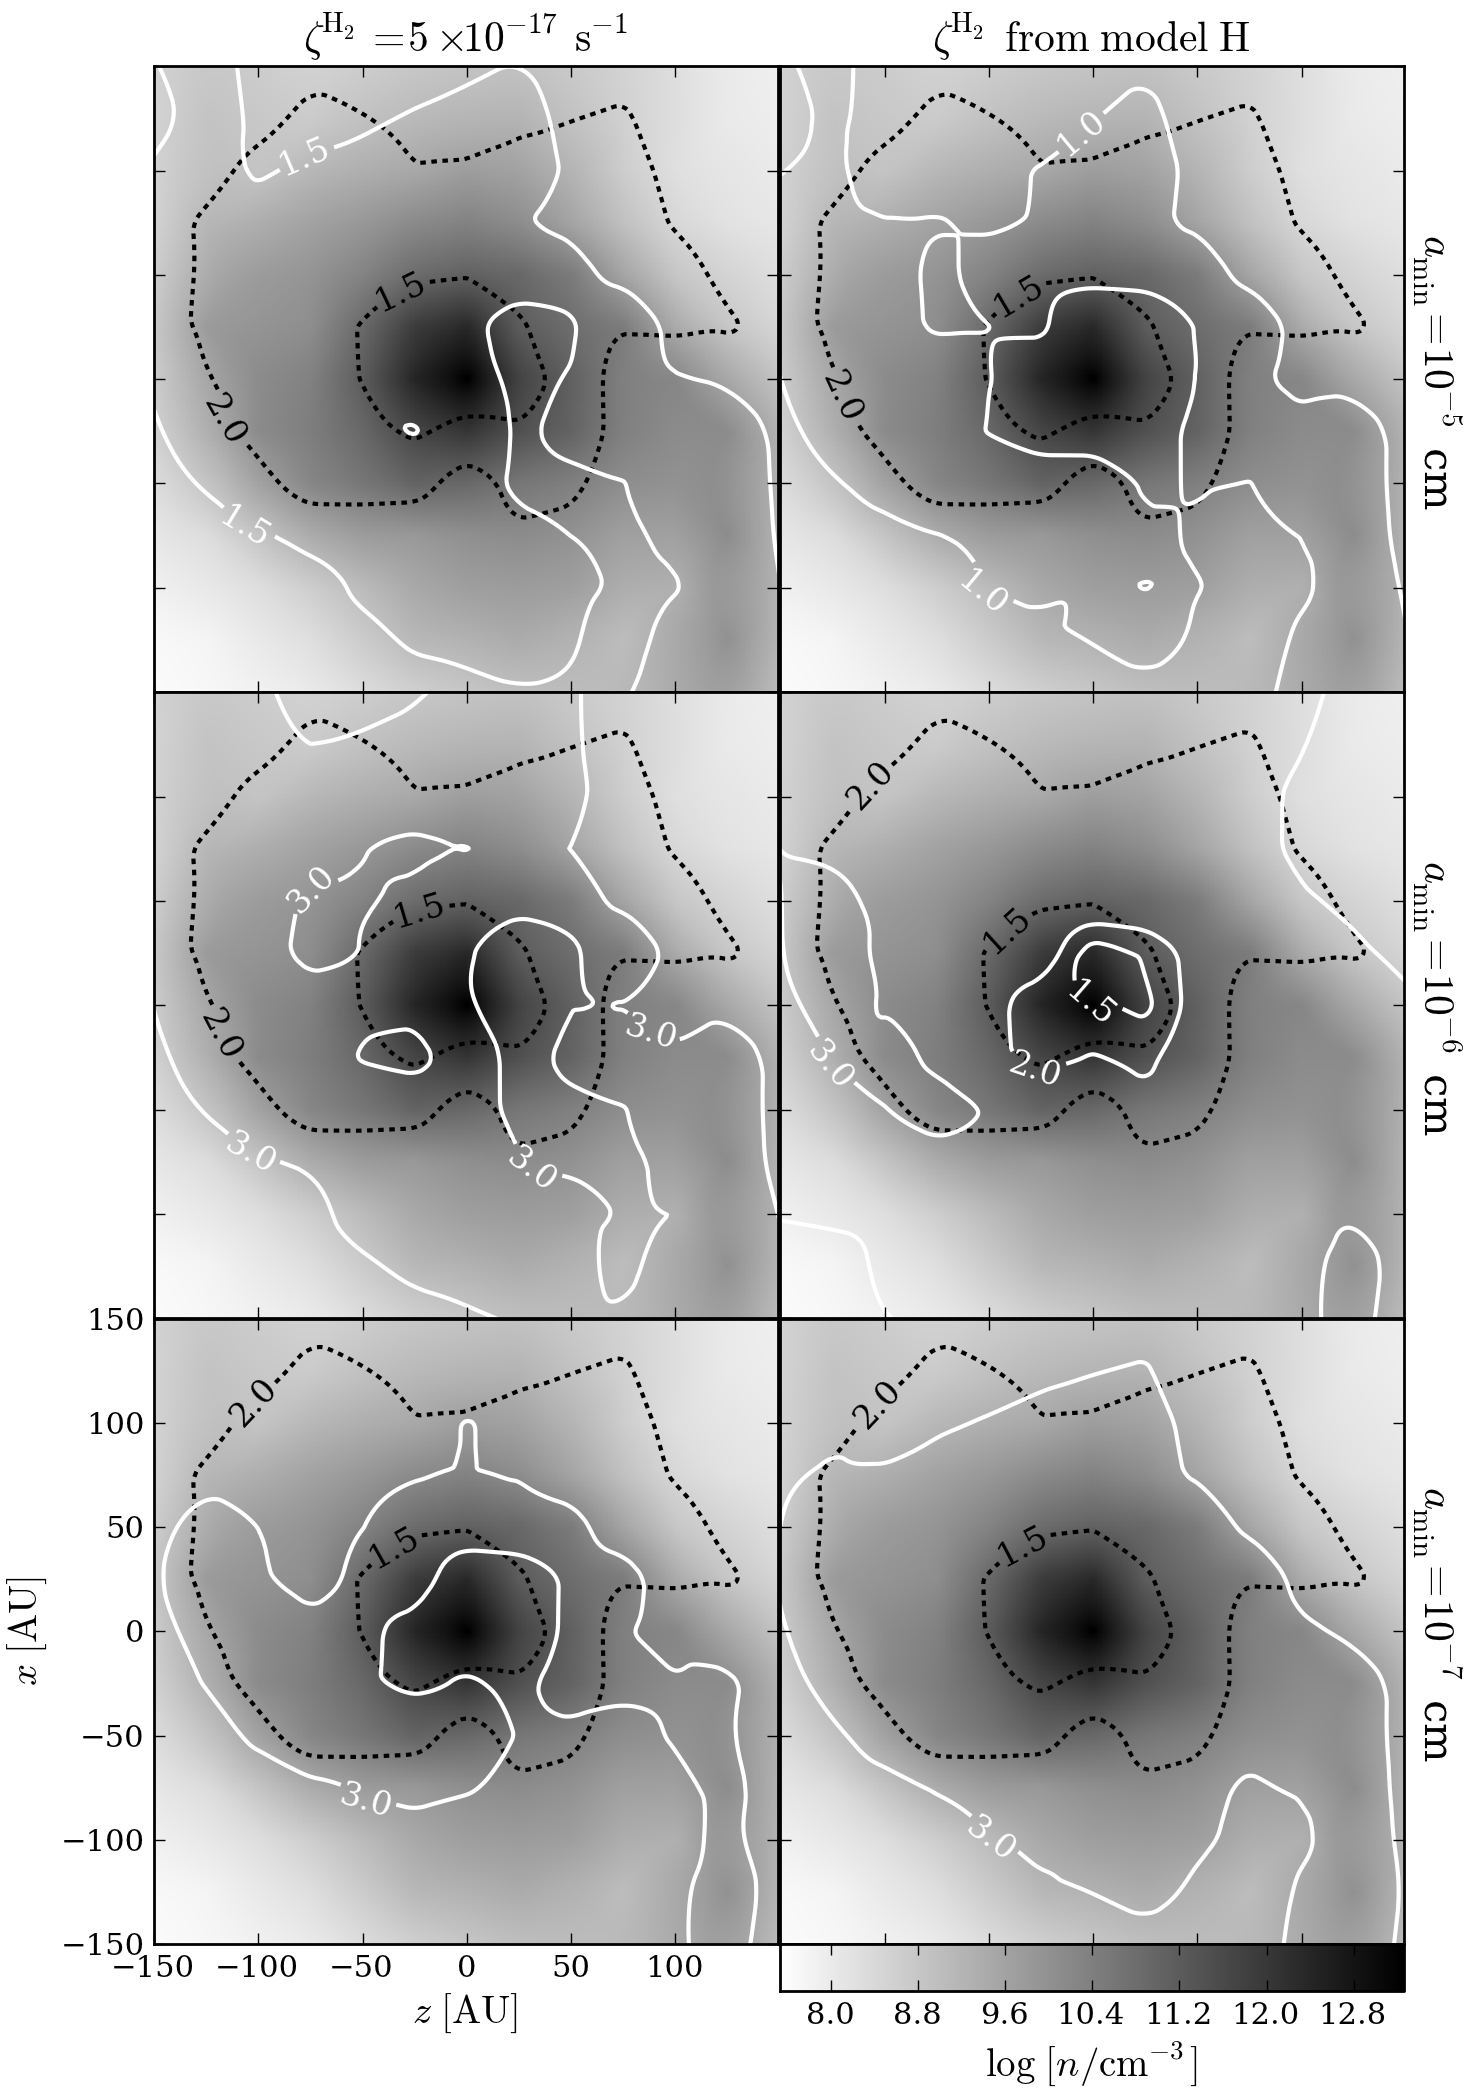
The high-mass case (Fig. 7) shows a similar behaviour to model , but in the case of cm, the decoupling between gas and field is allowed in a even larger region, of about 100 AU of radius where both and are lower than . Decreasing the grain size, the region of decoupling becomes narrower and vanishes for cm. The lack of a decoupling region in this high-mass case is at variance with the low-mass case discussed in the previous Section. This depends on the field diffusing faster in the high-mass case owing to the turbulent nature of the flow, as already stressed by Hennebelle et al. (hc11 (2011)), Joos et al. (jh13 (2013)). This diffusion is largely due to numerical effects associated to the finite spatial resolution of the simulation. This “numerical” field diffusion results in a reduced strength of the magnetic field with respect to the (non-turbulent) low-mass case, and this in turn makes the microscopic resistivity smaller (especially ambipolar diffusion, which is proportional to ). In this case, the microscopic resistivity is not sufficient to produce a significant decoupling region. Of course, if turbulence actually affects the field diffusion, the microscopic resistivity is not relevant.
6 Conclusions
In this paper we investigated the role of CRs in the formation of protostellar discs, using the results of PHG13 to evaluate CR ionisation rate in collapsing low-mass clouds accounting for both column density and magnetic effects. We developed a simple chemical code based on a minimal set of reactions to calculate, at each position in space at any given time, the abundances of the charged species, the corresponding electric resistivities, and the times scales associated to the main magnetic diffusion processes (ambipolar, Hall, and Ohmic). We applied this formalism to selected snapshots of numerical MHD simulations of the collapse of low- and high-mass clouds. Comparing the magnetic diffusion and the dynamical time scale, we determined the extent of the area where the gas is dynamically decoupled from the field. Inside this region, field freezing is invalid, and magnetic braking is ineffective.
We performed our calculations in two cases: assuming a spatially uniform CR ionisation rate of s-1, and adopting the formalism of PHG13 to evaluate the attenuation of CRs in a magnetised cloud. We found that the ionisation fraction is significantly lower in the second case, and therefore the coupling with the magnetic field is weaker than usually assumed in the central region of a collapsing cloud. In particular:
-
1.
For model , a late-time snapshot of the collapse of a low-mass cloud with mean magnetic field perpendicular to the rotation axis, a decoupling zone of radius of AU around the central protostar is found in the case of variable , but not when is assumed constant. This size compares well with the size of protostellar discs. This stresses the importance of accounting for CR attenuation when computing ionisation fractions.
-
2.
No decoupling zone is found in model , an early time snapshot of the collapse of a low-mass cloud with aligned field and rotation axis. In this model, the time scale of field diffusion remains longer than the dynamical time scale everywhere, either for a uniform or attenuated CR ionisation rate. In this case, the relatively modest increase in the density and field strength by compression are insufficient to attenuate the CR flux to levels low enough to produce significant decoupling.
-
3.
A decoupling zone of size AU is also found in the case of model , a snapshot from a typical high-mass collapse simulation. However, its size becomes smaller for smaller grains, and disappears altogether for grains smaller than cm.
Although the models adopted do not represent a time sequence, they nevertheless suggest that a decrease in the ionisation and/or an increase in the resistivity occurs in the innermost region of a cloud some time after the onset of collapse, but not earlier. In fact, the conditions for a substantial increase in the magnetic diffusion time are that the field is considerably twisted (compare the late-time misaligned model to the early-time aligned model ) and that dust grains had time to grow by coagulation (compare the upper and lower panels of Figs. 5–7). It is tempting to speculate that large, 100 AU-size discs are only allowed to form at a later stage when the powerful magnetic brake on the infalling gas has been relieved by either (or a combination) of these effects.
Other results of our study are:
-
1.
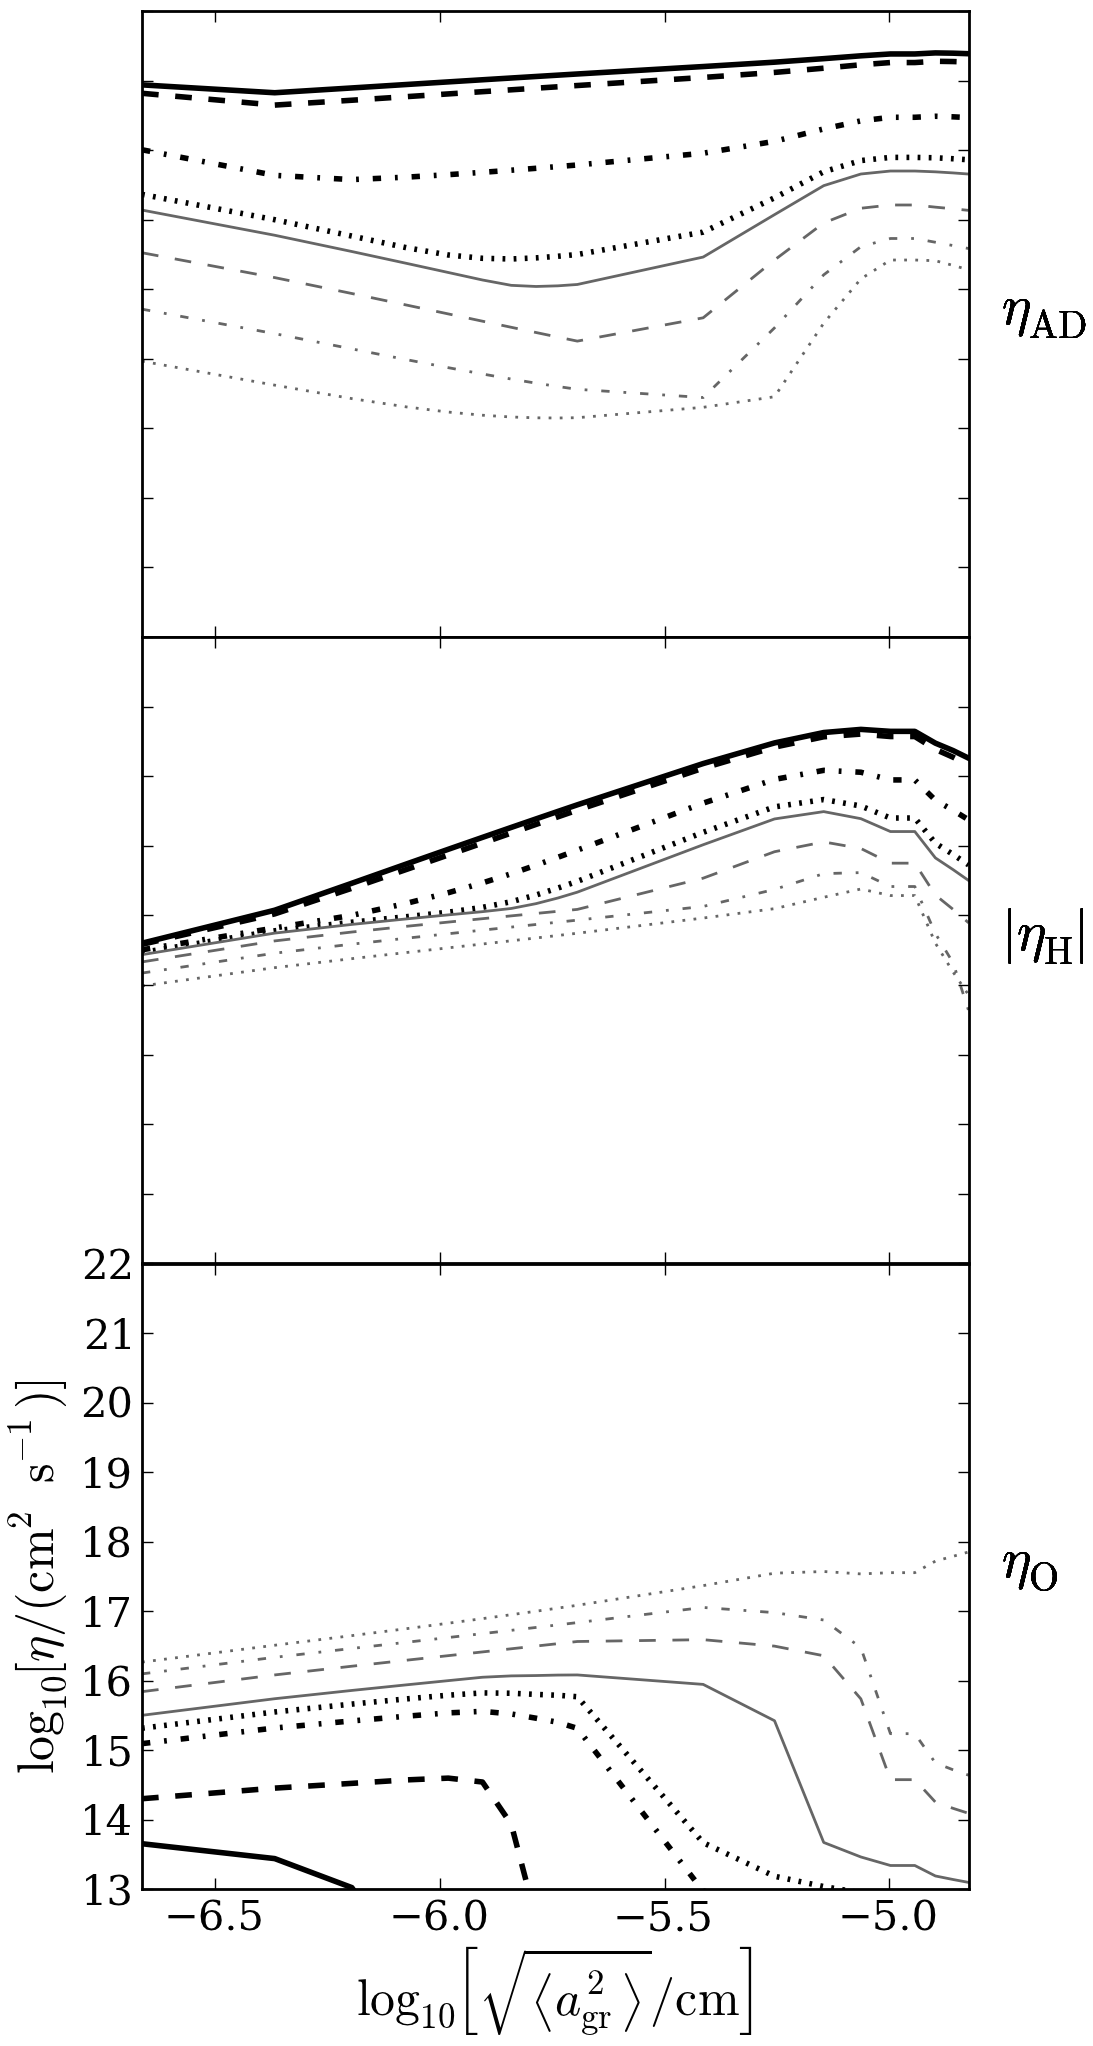
The dominant diffusion processes are ambipolar and Hall diffusion, with Ohmic resistivity becoming important only at the highest densities reached in our models ( cm-3), where is a factor of few larger than and , (see black regions in Fig. 4). In general, ambipolar and Hall diffusion are comparable over the innermost few hundred AU around a forming protostar. Thus, Hall diffusion should not be neglected in non-ideal MHD collapse calculations. However, the region where a diffusion process dominates over the others depends sensitively on the grain size distribution. In fact, while Hall and Ohmic resistivities have a monotonic dependence on the grain size (all else being equal), ambipolar diffusion has a minimum for a mean grain radius of about cm especially at high densities.
-
2.
In general, the size of the decoupling zone decreases for smaller grain size. The maximum grain size assumed here, ( cm), is likely a realistic value for the condition expected in disc-forming regions, where larger grains are predicted to form by compression and coagulation of smaller grains. Both Models and , referring to low- and high-mass cases, respectively, predict the formation of a protostellar disc, but for model the decoupling region disappears for smaller grains ( cm), since the magnetic field becomes weaker.
-
3.
The dependence of the fractional abundances of charged species on the CR ionisation rate may differ from the usually assumed dependence. Our minimal chemical model shows that depending on the grain size distribution, the abundance of several species can scale as or become independent on , and in general the dependence is not the same for all charged species. Thus, care should be taken when the ionisation fraction is scaled with the CR flux.
To summarise, we demonstrated that a correct treatment of CR propagation can explain the occurrence of a decoupling region between gas and magnetic field that in turn affects the disc formation. We emphasise, however, that our calculations are not strictly self-consistent, because we computed microscopic resistivities using the density and magnetic field strength obtained from ideal MHD simulations. If diffusion processes were included self-consistently in the numerical simulation itself, the line twisting would be presumably reduced. This would attenuate the effect of cosmic-ray mirroring, and the decrease in would not be so strong as found in this paper. In this sense, our study should be considered a proof of concept showing how a correct evaluation of can affect the protostellar disc formation.
Acknowledgements.
MP and PH acknowledge the financial support of the Agence National pour la Recherche (ANR) through the COSMIS project. MP and DG also acknowledge the support of the CNRS-INAF PICS project “Pulsar wind nebulae, supernova remnants and the origin of cosmic rays”. This work has been carried out thanks to the support of the OCEVU Labex (ANR-11-LABX-0060) and the A*MIDEX project (ANR-11-IDEX-0001-02) funded by the “Investissements d’Avenir” French government programme managed by the ANR.Appendix A Chemical model
In this Appendix we describe the “minimal” chemical model introduced in Sect. 3 to compute the ionisation fraction. The charged species considered are , , molecular ions H+ (e.g. HCO+), “metal” ions (e.g. Mg+), electrons , and negatively charged dust grains, whereas the neutral species are H2, heavy molecules (e.g. CO), metal atoms , (e.g. Mg) and neutral grains. Charged and neutral grains are collectively indicated as . We indicate with the abundance of each species with respect to H2. The abundance of the neutral species is fixed. In particular, we assume and . All rate coefficients are estimated at K.
A.1 Minimal chemical network
Protons are produced by CR ionisation of H2 at a rate , with (Shah & Gilbody sg82 (1982)). They are mainly destroyed by charge transfer (CT) with molecules (at a rate cm3 s-1) and by recombination on grains (at a rate , see Eq. A.1)
| (17) |
The formation of is driven by CR ionisation of at a rate , while destruction is due to CT with heavy molecules, dissociative recombination (DR, at a rate cm3 s-1), and recombination on grains
| (18) |
The formation of molecular ions H+ occurs by CT of and heavy molecules, while destruction occurs by DR and recombination on grains
| (19) |
Metal ions are formed by CT with and , and destroyed by recombination with free electrons and on grains
| (20) |
Note that CT with metal atoms can be neglected with respect to DR if .
Dust grains are assumed to be negatively charged (charge ) or neutral. The total number density of grains is obtained from the MRN size distribution (Mathis et al. mrn77 (1977))
| (21) |
between a minimum () and a maximum () grain radius (see also Sect. 3.2). The normalisation constant is obtained by imposing that the mass density of grains is equal to a fraction of the gas density. We assume that grains are spherical and have density g cm-3 (Flower et al. fp05 (2005)). For we obtain
| (22) |
Under these assumptions, the number density of grains is
| (23) |
and is strongly dependent on .
The coefficient of recombination of positive ions on negatively charged grains was computed by Draine & Sutin (ds87 (1987)) assuming the MRN size distribution,
where is a numerical coefficient equal to for an –H+ plasma and for a heavy-ion plasma. For simplicity, we adopt the same value of for all positively charged ions, assuming a typical ion mass . The actual value of is larger by a factor 5 and 3 for H+ and H, respectively.
A.2 Evaluation of the ionisation fractions
The equation of charge neutrality is
| (25) |
Equations (17), (18), (19), and (20) then become
| (26) |
| (27) |
| (28) |
| (29) |
where we have defined
| (30) |
Thus, the equation of charge neutrality
| (31) |
becomes
| (32) |
We solve Eq. (32) as a cubic equation for assuming that all grains have charge . When becomes negative, we set and we solve Eq. (32) for .
Appendix B Dependence of diffusion coefficients on grain radius
In this Appendix we compute the resistivities using Eqs. (5)–(7) varying the minimum radius of the grain size distribution and fixing the H2 density to evaluate the sensitivity of the diffusive terms to the grain size. For the magnetic field strength we assume G (Crutcher c99 (1999)), in order to be independent on specific models. The MRN size distribution given by Eq. (21) implies that the mean value of the square of the grain radius weighted on the grain distribution (namely the quantity that enters the equation for the momentum transfer rate coefficients), defined by
| (33) |
is close to . We vary the minimum grain radius between to cm, fixing cm. This corresponds to values of ranging from to cm. Figure 8 shows that the coefficient of ambipolar diffusion is not monotonic with the grain radius but presents an absolute minimum at larger radii with increasing H2 densities. On the other hand, the Hall term increases with the grain radius for any value of , starting to decrease only at very large grain size ( cm). Finally, the Ohmic resistivity becomes important at high densities ( cm-3) and increases monotonically with grain size.
Appendix C Contributions to the diffusion time of the magnetic field
For the sake of completeness, in Fig. 9 we show separately the diffusion time for ambipolar, Hall, and Ohmic diffusion computed with from model . As expected, at the high densities reached in the disc region, ambipolar diffusion time is more than one order of magnitude larger than the dynamical time scale. On the contrary, Hall and Ohmic diffusion times are comparable and lower than the dynamical time scale in a region whose radius decreases from about 50 AU to 25 AU with decreasing minimum grain size. This is another way to say that gas-magnetic field decoupling is due to Hall and Ohmic diffusion at densities higher than cm-3.
References
- (1) André, P., Ward-Thompson, D. & Barsony, M. 2000, Protostars and Planets IV, 59
- (2) Belloche, A., André, P., Despois, D. & Blinder, S. 2002, A&A, 393, 927
- (3) Braiding, C. R. & Wardle, M. 2012a, MNRAS, 422, 261
- (4) Braiding, C. R. & Wardle, M. 2012b, MNRAS, 427, 3188
- (5) Bodenheimer, P. 1995, ARA&A, 33, 199
- (6) Cesarsky, C. J. & Völk, H. J. 1978, A&A, 70, 367
- (7) Ciolek, G. E; & Mouschovias, T. Ch. 1994, ApJ, 425, 142
- (8) Ciolek, G. E; & Mouschovias, T. Ch. 1995, ApJ, 454, 194
- (9) Cleeves, L. I., Adams, F. C., Bergin, E. A., & Visser, R. 2013, ApJ, 777, 28
- (10) Commerçon, B., Hennebelle, P. & Henning, T. 2011, A&A, 530, 13
- (11) Crutcher, R. M. 1999, ApJ, 520, 706
- (12) Crutcher, R. M. 2012, ARA&A, 50, 29
- (13) Dapp, W. B. & Basu, S. 2010, A&A, 521 256
- (14) Draine, B. T. & Sutin, B. 1987, ApJ, 320, 803
- (15) Flower, D. R., Pineau des Forêts, G. & Walmsley, C. M. 2005, A&A, 436, 933
- (16) Fromang, S., Hennebelle, P. & Teyssier, R. 2006, A&A, 457, 371
- (17) Galli, D., Lizano, S., Shu, F. H. & Allen, A. 2006, ApJ, 647, 374
- (18) Hennebelle, P. & Fromang, S. 2008, A&A, 477, 9
- (19) Hennebelle, P. & Ciardi, A. 2009, A&A, 506, L29
- (20) Hennebelle, P., Commerçon, B., Joos, M., Klessen, R. S., Krumholz, M. et al. 2011, A&A, 528, A72
- (21) Joos, M., Hennebelle, P. & Ciardi, A. 2012 A&A, 543, 128
- (22) Joos, M., Hennebelle, P., Ciardi, A. & Fromang, S. 2013 A&A, 554, A17
- (23) Krasnopolsky, R., Li, Z.-Y. & Shang, H. 2011 ApJ, 733, 54
- (24) Krasnopolsky, R., Li, Z.-Y. & Shang, H. et al. 2012 ApJ, 757, 77
- (25) Labadens, M., Chapon, D., Pomaréde, D. & Teyssier, R. 2011, ADASS XXI Proceedings, 461, 837
- (26) Machida, M. N., Inutsuka, S.-I. & Matsumoto, T. 2011, PASJ, 63, 555
- (27) Mathis, J. S., Rumpl, W. & Nordsieck, K. H. 1977, ApJ, 217, 425
- (28) McKee, C. F. 1989, ApJ, 345, 782
- (29) Mellon, R. R. & Li, Z.-H. 2008, ApJ, 681, 1356
- (30) Mellon, R. R. & Li, Z.-H. 2009, ApJ, 698, 922
- (31) Mestel, L. & Spitzer, L., Jr. 1963, MNRAS, 116, 503
- (32) Murillo, N. M., Lai, S.-P., Bruderer, S., Harsono, D., & van Dishoeck, E. F. 2013, A&A, 560, A103
- (33) Nakano, T., Nishi, R. & Umebayashi, T. 2002, ApJ, 573, 199
- (34) Padovani, M., Galli, D. & Glassgold, A. E. 2009, A&A, 501, 619 (PGG09)
- (35) Padovani, M. & Galli, D. 2011, A&A, 530, A109 (PG11)
- (36) Padovani, M., Hennebelle, P. & Galli, D. 2013, A&A, 560, A114 (PHG13)
- (37) Pinto, C., Galli, D. & Bacciotti, F. 2008, A&A, 484, 1
- (38) Pinto, C. & Galli, D. 2008, A&A, 484, 17
- (39) Santos-Lima, R., de Gouveia Dal Pino, E. M. & Lazarian, A. 2013, MNRAS, 429, 3371
- (40) Seifried, D., Banerjee, R., Pudritz, R. E. et al. 2012, MNRAS, 423, 40
- (41) Shah, M. B. & Gilbody, H. B. 1982, J. Phys. B, 15, 3441
- (42) Shu, F. H., Galli, D., Lizano, S. & Cai, M. 2006, ApJ, 647, 382
- (43) Spitzer, L. & Tomasko, M. G. 1968, ApJ, 152, 971
- (44) Strong, A. W., Moskalenko, I. V., Reimer, O. 2000, ApJ, 537, 763
- (45) Takakuwa, S., Saito, M., Lim, J., Saigo, K., Sridharan, T. K. et al. 2012, ApJ, 754, 52
- (46) Teyssier, R. 2002, A&A, 385, 337
- (47) Tobin, J. J., Hartmann, L., Chiang, H.-F., Wilner, D. J., Looney, L. W. et al. 2012, Nature, 492, 83
- (48) Umebayashi, T. & Nakano, T. 1981, PASJ, 33, 617
- (49) Umebayashi, T. & Nakano, T. 1990, MNRAS, 243, 103
- (50) Wardle, M. & Ng, C. 1999, MNRAS, 303, 239
- (51) Wardle, M. 2007, Ap&SS, 311, 35
- (52) Webber, W. R. 1998, ApJ, 506, 329
- (53) Williams, J. P. & Cieza, L. A. 2011, ARA&A, 49, 67