Herschel Far-Infrared Photometry of the Swift Burst Alert Telescope Active Galactic Nuclei Sample of the Local Universe. I. PACS Observations††thanks: Herschel is an ESA space observatory with science instruments provided by European-led Principal Investigator consortia and with important participation from NASA.
Abstract
Far-Infrared (FIR) photometry from the the Photodetector Array Camera and Spectrometer (PACS) on the Herschel Space Observatory is presented for 313 nearby, hard X-ray selected galaxies from the 58-month Swift Burst Alert Telescope (BAT) Active Galactic catalog. The present data do not distinguish between the FIR luminosity distributions at 70 and 160 for Seyfert 1 and Seyfert 2 galaxies. This result suggests that if the FIR emission is from the nuclear obscuring material surrounding the accretion disk, then it emits isotropically, independent of orientation. Alternatively, a significant fraction of the 70 and 160 could be from star formation, independent of AGN type. Using a non-parametric test for partial correlation with censored data, we find a statistically significant correlation between the AGN intrinsic power (in the 14-195 keV band ) and the FIR emission at 70 and 160 for Seyfert 1 galaxies. We find no correlation between the 14-195 keV and FIR luminosities in Seyfert 2 galaxies. The observed correlations suggest two possible scenarios: (i) if we assume that the FIR luminosity is a good tracer of star formation, then there is a connection between star formation and the AGN at sub-kiloparsec scales, or (ii) dust heated by the AGN has a statistically significant contribution to the FIR emission. Using a Spearman rank-order analysis, the 14-195 keV luminosities for the Seyfert 1 and 2 galaxies are weakly statistically correlated with the F70/F160 ratios.
1 Introduction
In the past few years there has been an incredible amount of information regarding the infrared view of our dusty Universe. With the advent of very successful space missions such as Spitzer (Werner et al., 2004), NASA’s Wide-field Infrared Survey Explorer (WISE, Wright et al., 2010), AKARI (Murakami et al., 2007), Plank (Planck Collaboration et al., 2011) and Herschel (Pilbratt et al., 2010), the mid-infrared (MIR) and far-infrared (FIR) is beginning to provide a unique perspective into the evolution of galaxies via dust-based star formation rate (SFR) indicators. However, these SFR indicators are not free from systematic uncertainties primarily due to the nature of dust in the galaxy by trapping the starlight and re-emitting (a fraction) in the infrared. Because of this, each MIR and FIR band can be associated with a different dust component, different spatial distributions and different stellar age populations (see Kennicutt & Evans, 2012, for a review). For these reasons, monochromatic infrared emission may be restricted, as a reliable SFR indicator, to large samples of galaxies for statistically significant studies (e.g., Calzetti et al., 2010). On the other hand, SFR indicators that rely on the total FIR emission are subject to uncertainties because they are very susceptible to the shape of the MIR to FIR spectral energy distribution (e.g., Kennicutt, 1998). Despite these considerations and given the plethora of new and more sensitive infrared surveys, these SFR metrics are widely used. However, little consideration is given to the possible contribution from dust heated by a non-stellar ionization source, i.e., the active galactic nucleus (AGN) in the center of the galaxy.
Following the unified model of AGN (where the various types are explained solely by a viewing angle difference; see Antonucci, 1993, for details), the hot accretion disk around the galaxies supermassive black hole is surrounded by a dusty, molecular torus. In recent years, there has been considerable effort to characterize the nature of this obscuring material both theoretically and observationally. Several models have been proposed to explain the observed and inferred properties of the torus, including a smooth, continuous, geometrically and optically thick dusty torus (Krolik & Begelman, 1988; Beckert & Duschl, 2004; Fritz et al., 2006), full radiative transfer clumpy torus models (e.g., Nenkova et al., 2008a; Schartmann et al., 2008; Mor et al., 2009; Hönig & Kishimoto, 2010; Stalevski et al., 2012) and clumpy winds structures originating from the accretion disk (e.g., Elitzur & Shlosman, 2006). However, within their uncertainties (e.g., size of the torus, inclination, dust distribution function, etc), almost all these models predict some (non-negligible) torus contribution at the MIR and FIR wavelengths where dust-based SFRs are commonly used under the assumption that the FIR luminosity is attributed solely to star formation (e.g., Fritz et al., 2006; Mullaney et al., 2011). Thus, it is of the utmost importance to determine the AGN contribution to the FIR emission.
To investigate the AGN contribution to the FIR emission, it is important to start with a complete and unbiased sample of local AGN at 0.05, where we can use Herschel’s unique angular resolution to spatially resolve the FIR emission. Given its high energy band selection, 14 to 195 keV, the Swift/Burst Alert Telescope (BAT) survey of AGN represents such a sample, because it is unbiased to Compton thin AGN, e.g., sources with Hydrogen column densities of less than a few times . In addition, the BAT AGN survey is not sensitive to stellar activity in the host galaxy, because star formation has a negligible contribution at these hard X-ray energies. Thus, the BAT sample can provide a unique perspective into the AGN and star formation contributions at the FIR wavelengths, where the dusty torus and the current star formation are the competing effects to heat the dust. For this purpose, we performed a statistical study of the correlations between the FIR luminosities observed by the Herschel observatory and the hard X-ray luminosities for more than 300 local BAT AGN. In Section 2-3 we present details on the sample selection, Herschel Observations and data processing. Section 4 shows the FIR properties of the BAT sample. Section 5 discusses the observed correlations between the hard X-ray and FIR emission. In Section 6 we present the FIR colors of the BAT sample and their implications for some of the FIR predictions of torus models. Section 7 shows the comparison for the FIR colors between the BAT AGN and normal, star forming galaxies. Finally, Section 8 lists the main conclusions of this work. In order to calculate luminosities we assumed a flat universe with a Hubble constant Ho = 71 km s-1 Mpc-1, = 0.73, and = 0.27, with redshift values taken from NASA’s ExtraGalactic Database (NED), except for sources with redshift values 0.01, where distances are taken from The Extragalactic Distance Database (EDD; Tully, 1988; Tully et al., 2009).
2 Sample
The sample presented in this work was selected from the the low-redshift () 58-month Swift-BAT survey with a median redshift of 0.025111http://swift.gsfc.nasa.gov/results/bs58mon/. The 58-month Swift-BAT is an almost uniform hard X-ray all-sky survey and reaches a flux level of 1.110-11 ergs sec-1 cm-2 over 50% of the sky and 1.4810-11 ergs sec-1 cm-2 over 90% of the sky (Baumgartner et al., 2013). Source identifications are based primarily on the X-ray imaging data and a correlation with optical images and catalogs. In some cases, the identifications are based on positional coincidences with previously known AGN. The main advantage of the BAT AGN sample is that the selection process is completely independent of optical, IR or radio properties of the host galaxy. Our final sample of galaxies includes 149 Seyfert 1 galaxies (1/1.2/1.5), 157 Seyfert 2 galaxies (1.8/1.9/2.0), 6 LINERs and 1 unclassified Seyfert galaxy, ESO 464-G016 (Véron-Cetty & Véron, 2010). One must note that some of the Seyfert galaxies have dual classifications, see Table 1. For the purpose of grouping galaxies through the rest of the paper, we take the Seyfert classification as the primary type.
3 Observations and Data Processing
The 58-month BAT sample was observed by the Photodetector Array Camera and Spectrometer (PACS, Poglitsch et al., 2010) on the Herschel Space Observatory. The vast majority of the BAT AGN presented in this work are from our cycle 1 open-time program (OT1_rmushot_1, PI: R. Mushotzky) with a total of 291 sources. For the sake of completeness we included 22 BAT sources from different programs publicly available from the Herschel science archive (HSA), see Table 1 for details. From this the total number of BAT AGN sources in our sample is 313. For the sources obtained through our OT1 program the PACS imaging for the blue 70 (60-85 ) and red 160 (130-210 ) band was obtained simultaneously in scan mode along two scan map position angles at 70 and 110 degrees. Each orientation angle was scanned with a medium scan speed of 20″ s-1, 2 scan legs of 3.0′ length with 5.0″ scan leg separation and a repetition factor of 1. The total time per observation was 52 s. From our OT1 program the galaxies II SZ 010, Mrk 290, PG 2304+042 and Mrk 841 have a different configuration with 10 scan legs of 3.0′ length with 4.0″ scan leg separation and a repetition factor of 1 with a total time per observation of 276 s.
For the PACS data reduction we use the Herschel Interactive Processing Environment (HIPE, Ott, 2010) version 8.0. The “Level 0” observations (raw data) were processed through the standard pipeline procedure to convert from Level 0 to Level 1 data. This procedure includes the extraction of the calibration tree needed for the data processing, correction for electronic crosstalk, application of the flat-field correction and finally deglitching and conversion from Volts to Jy/pixel. In order to correct for bolometer drift (low frequency noise), both thermal and non-thermal (uncorrelated noise), and to create the final maps from the Level 1 data, we used the algorithm implemented in Scanamorphos (v19.0, Roussel, 2013), which makes use of the redundancy built in the observations to derive the brightness drifts. Because of this, Scanamorphos is independent of any pre-defined noise model because it relies on the fact that each portion of the sky is scanned by multiple bolometers at different times. All final maps have a pixel size of 1/4 of the point spread function (PSF) full width at half-maximum (FWHM), i.e., 1.4″ at 70 and 2.85″ at 160 . Scanamorphos also produces an error and weight map. The error map is defined as the error on the mean brightness in each pixel. It is built using the weighted variance because weights are used for the projection of the final map. The error map does not include any error propagation associated with the different steps performed on the pipeline. On the other hand, the weighted map is built by co-adding the weights and is normalized by the average of the weights. See Figure 10 of the Appendix for a sample of the final maps. All the images are available in electronic form in the on-line version. At the median redshift for the sample, 1″ represents 500 pc. Hence, for example, PACS 70 PSF will sample about 2.8 kpc at 0.025.
PACS fluxes are measured using a combination of circular and elliptical apertures for sources that are visually identified as point-like (and/or relatively point-like) and extended sources, respectively. The apertures are chosen by eye to contain all of the observed emission at each wavelength. In addition, background subtraction is performed locally with a circular or elliptical annulus around the source. For point-like sources the background annulus was set to be 20″ to 25″ and 24″ to 28″ in radius for the blue and red camera, respectively. For extended sources, the background annulus was set to encompass a clean, uncontaminated sky region close to the source. Table 1 shows the different aperture sizes used in this work.
Aperture corrections are applied to the background subtracted fluxes. For point-like sources we applied the correction outlined in Table 15 of the technical report PICC-ME-TN-037222https://nhscdmz2.ipac.caltech.edu/sc/uploads/Pacs/PSF_aperture_corrections_FM6.txt. To derive aperture corrections for extended sources we used higher resolution images from Spitzer/IRAC 8.0 and measured the total flux with the same aperture employed for the PACS analysis. Then we convolved the same image with the right kernel to bring it to the PACS resolution333http://dirty.as.arizona.edu/ kgordon/mips/conv_psfs/conv_psfs.html (Gordon et al., 2008) and remeasured the flux in the same aperture. The ratio of the unconvolved to the convolved (the same PSF as the Herschel PACS) flux is used as an estimate of the aperture correction. From the list of extended sources, there are 53 BAT AGN sources with Spitzer/IRAC 8.0 images available through The Spitzer Enhanced Imaging Products archive. For these sources we find the aperture corrections to be very small, with values not greater than 1.03 () and with a mean value very close to unity. Therefore, for large, extended sources without higher resolution images, we apply no correction, so we added a 3% flux uncertainty. Caution must be taken, because aperture corrections derived from this empirical method assume that the spatial distribution is the same at PACS (FIR) and IRAC (MIR) wavelengths.
The total uncertainty for the integrated photometry is a combination of the error on the mean brightness in each pixel added in quadrature within the source aperture (the error map produced by Scanamorphos), the standard deviation of all the pixels in the background aperture and the PACS photometer flux calibration accuracy. In some cases, the dominant source of error is due to background fluctuations especially in sources contaminated by cirrus (see Table 1); however, almost all of our sources have a clean, flat extragalactic field. The PACS calibration uncertainties are , ∼5%, according to Version 2.4 of the PACS Observer’s Manual444http://herschel.esac.esa.int/Docs/PACS/html/pacs_om.html. Finally, we take as an upper-limit five times the total uncertainty for the integrated photometry (5). Table 1 presents the spatially integrated flux densities for all 313 galaxies for PACS blue and red photometric bands. The tabulated flux densities include aperture corrections. No reddening and color corrections have been applied to the data in Table 1. From this, 295 and 260 sources are detected by PACS at 70 and 160 , implying a detection rate of 94% and 83%, respectively. Only two sources, namely, MCG-01-09-045 and UGC03995A, are detected at PACS 160 with no detections at 70 .
To investigate the nature of the 16 undetected sources in both PACS bands, we used values from the WISE All-sky source catalog555http://irsa.ipac.caltech.edu/Missions/wise.html at 3.4, 4.6, 12, and 22 to construct the AGN spectral energy distribution (SED) between 3.4 and 160 for the BAT sample. From this, we compared mean and median SEDs for the entire sample with those from the PACS undetected sources. The upper panel in Figure 1 shows a comparison between the SEDs of the sources with detections in both PACS bands and the undetected PACS sources (the individual SED’s of the BAT AGN are normalized to the flux in the WISE 22 band). It can be seen that the undetected sources are characterized by a flatter infrared SED than that for the entire sample. Note that the entire sample was detected by WISE, except for Mrk 3. For the WISE fluxes, we selected the magnitude measured with profile-fitting photometry for sources flagged by WISE as point-sources, and for extended sources, we selected the magnitude measured via elliptical aperture photometry which are measured using areas that are scaled from the 2MASS Extended Source Catalog morphologies (Skrutskie et al., 2006). In addition, we inspected the low-resolution MIR spectra of 6 PACS undetected sources observed by Spitzer (lower panel in Figure1). We retrieved the low-resolution MIR spectra for these sources, namely, ESO121-IG028, Mrk352, Mrk50, PG2304+042, SBS1301+540 and UM614, via the Cornell atlas of Spitzer/IRS sources (Lebouteiller et al., 2011). From this comparison it is clear that, on average, these sources show a systematic decrease in their MIR emission towards longer wavelengths, . Moreover, the low-resolution MIR spectra show no strong star formation features (e.g., polycyclic aromatic hydrocarbon emission). Overall, these results suggest that PACS undetected BAT AGN reside in cold dust depleted systems with no active star formation. We define this group of objects as X-ray Bright Far-infrared Faint sources (XBFF). A more detailed analysis of the BAT SEDs and the nature of the XBFF sources will be presented in subsequent papers in the BAT Herschel series.
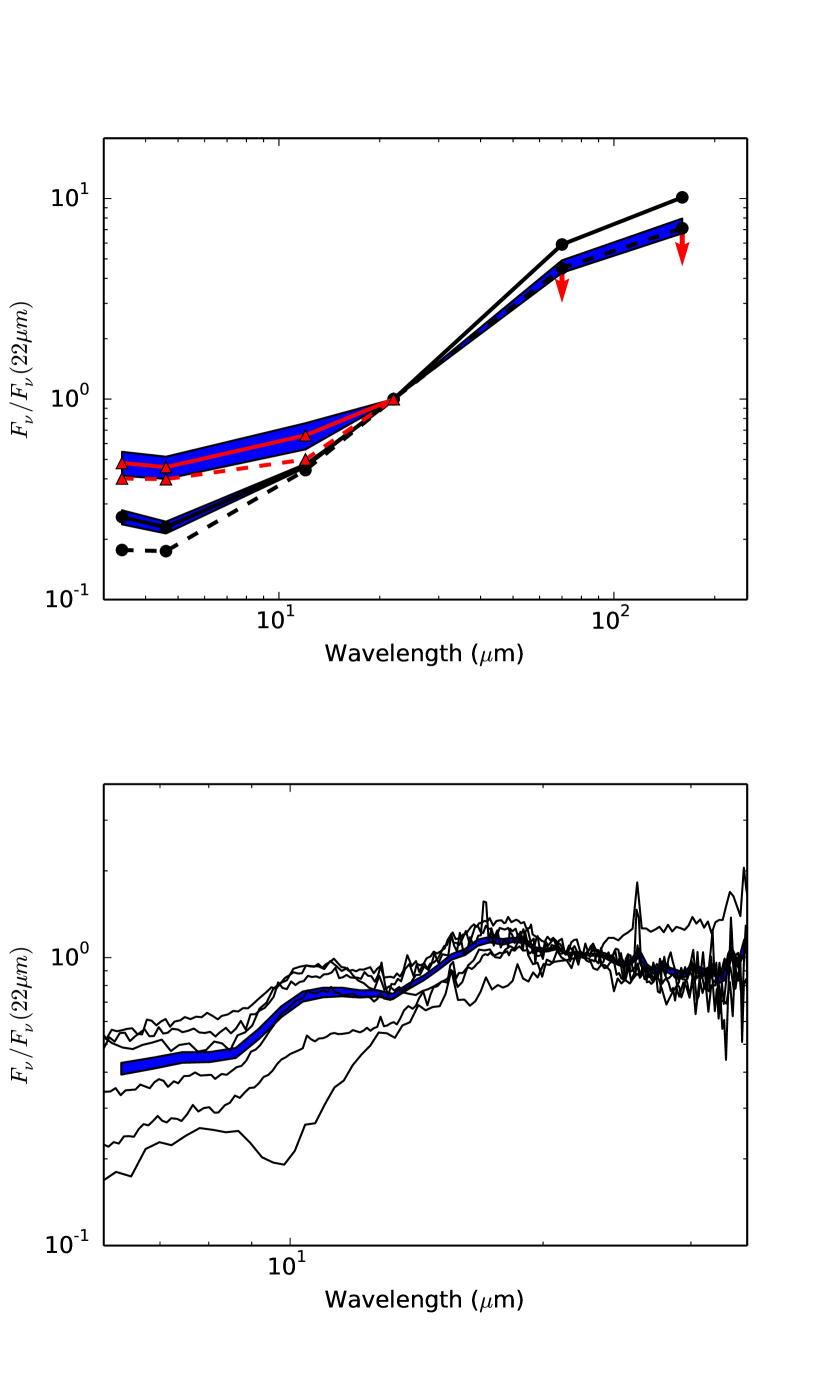
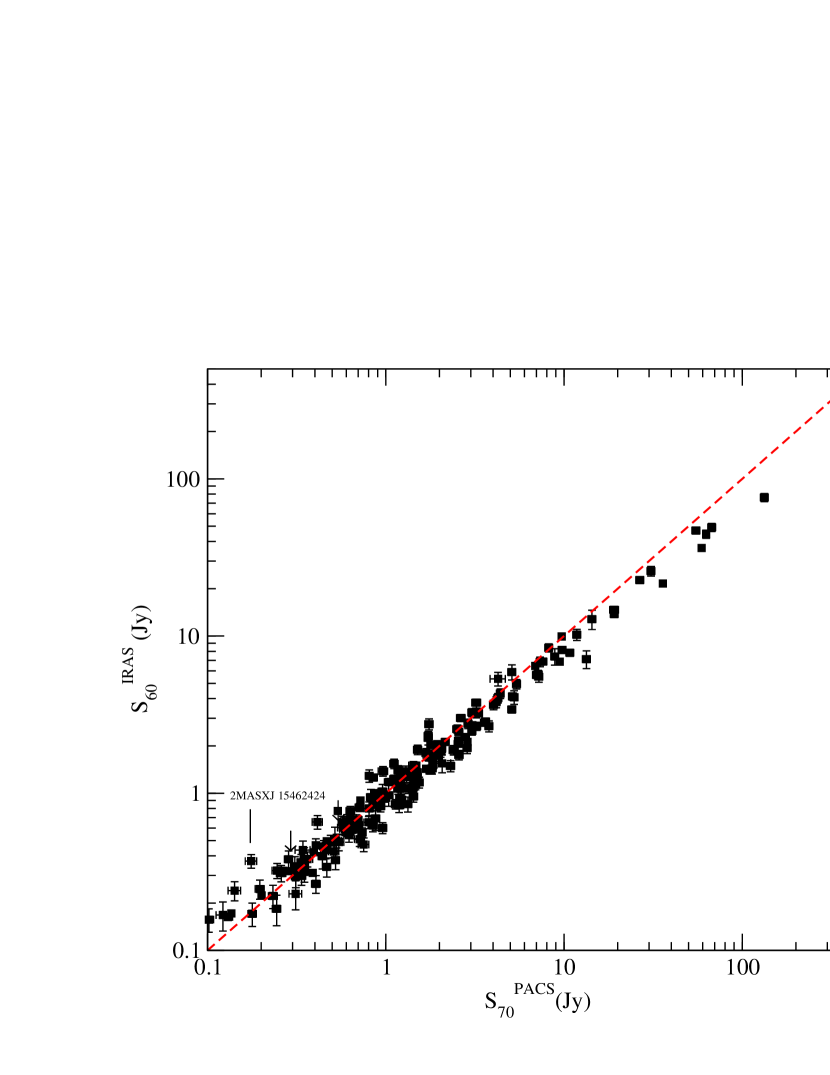
Figure 2 shows the comparison between the PACS 70 measurements and observations from the Infrared Astronomical Satellite at 60 (IRAS, Neugebauer et al., 1984). Note that in most cases, given PACS better photometric sensitivity, it was not possible to find IRAS fluxes for all galaxies in the sample. In total, 205 sources from the BAT sample had IRAS detections at 60 , mainly from the IRAS Faint Source Catalog for faint point sources (Moshir et al., 1990), the Point Source Catalog (V2.0, Helou & Walker, 1988) and the catalog of large optical galaxies (Rice et al., 1988). From this comparison, we found very good agreement between the PACS and IRAS fluxes with S60 density fluxes (IRAS) slightly below the 1:1 line, as expected (an increasing flux density at wavelengths shorter than the FIR peak, Dale et al., 2001; Dale & Helou, 2002; Draine & Li, 2007; Casey, 2012; Dale et al., 2012). The good correlation between the fluxes suggests that the size of our aperture photometry extractions encompass the FIR emission from the galaxy, because the beam size used for the IRAS catalog is larger, approximately 1′ at 60 , than the majority of the aperture sizes used in this work. This result is corroborated by the spatial analysis presented in Mushotzky et al. (2014), where we show that in the majority of the BAT sources, the bulk of the FIR radiation is point-like at the spatial resolution of Herschel (a median value of 2 kpc FWHM). Note that some of the brightest sources in our sample, e.g., Centaurus A, are extended; thus, the point source extraction from IRAS, even at 1′ resolution, underpredicts the flux at 60 . On the other hand, there may be contamination from a neighboring source that lies within IRAS bigger aperture, therby, overpredicting the flux at 60 . For example, there is an IR bright companion source (GALEXASC J154634.12+692844.7) at 56.4″ from 2MASXJ15462424+6929102 (see Figure 2).
| Name | RA | DEC | Distance | Type | 70 | 160 | BAT | Aperture | Aperture | Program |
|---|---|---|---|---|---|---|---|---|---|---|
| (J2000.0) | (J2000.0) | Mpc | Jy | Jy | BAT | 70 | 160 | ID | ||
| (1) | (2) | (3) | (4) | (5) | (6) | (7) | (8) | (9) | (10) | (11) |
| Mrk 335 | 00 06 19.5 | +20 12 10 | 111.10 | Sy 1.2 | 0.309 0.016 | 0.150 0.010 | 18.43 | 12 | 22 | 2 |
| 2MASX J00253292+6821442 | 00 25 32.9 | +68 21 44 | 51.15 | Sy 2 | 0.290 0.015 | 0.303 0.024 | 18.24 | 12 | 22 | 1 |
| CGCG 535-012 | 00 36 21.0 | +45 39 54 | 208.70 | Sy 1.2 | 0.145 0.011 | 0.177 | 15.58 | 12 | 22 | 1 |
| NGC 235A | 00 42 52.8 | -23 32 28 | 95.51 | Sy 1 | 2.337 0.123 | 2.613 0.173 | 47.65 | 12 | 22 | 1 |
| MCG-02-02-095 | 00 43 08.8 | -11 36 04 | 80.87 | Sy 2 | 0.081 0.008 | 0.196 | 8.95 | 5.5 | 10.5 | 1 |
| Mrk 348bbThere is at least one neighboring source inside the PACS field of view. In this case, we removed the neighboring source and selected an aperture that contains only the emission from the BAT source. | 00 48 47.1 | +31 57 25 | 64.24 | Sy 2 | 0.808 0.041 | 0.995 0.050 | 156.04 | 12 | 22 | 3 |
| MCG+05-03-013 | 00 51 35.0 | +29 24 05 | 156.12 | Sy 1 | 0.825 0.046 | 1.890 0.166 | 9.81 | 14 | 24 | 1 |
| Mrk 352 | 00 59 53.3 | +31 49 37 | 63.50 | Sy 1 | 0.080 | 0.089 | 29.98 | 12 | 22 | 1 |
| ESO 195-IG021NED03 | 01 00 35.0 | -47 52 04 | 211.44 | Sy 1.8 | 0.411 0.021 | 0.824 0.106 | 16.30 | 12 | 22 | 1 |
| MCG-07-03-007 | 01 05 26.8 | -42 12 58 | 129.16 | Sy 2 | 0.313 0.017 | 0.457 0.029 | 11.97 | 12 | 22 | 1 |
| 2MASX J01064523+0638015 | 01 06 45.3 | +06 38 02 | 178.71 | Sy 2 | 0.150 0.011 | 0.097 | 15.45 | 12 | 22 | 1 |
| 2MASX J01073963-1139117 | 01 07 39.6 | -11 39 12 | 207.86 | Sy 2 | 0.491 0.033 | 0.715 0.060 | 10.48 | 12 | 22 | 1 |
| NGC 424 | 01 11 27.6 | -38 05 00 | 50.14 | Sy 2 | 1.687 0.089 | 1.602 0.144 | 20.72 | 12 | 22 | 1 |
| Mrk 975 | 01 13 51.0 | +13 16 18 | 217.74 | Sy 1 | 0.806 0.050 | 1.279 0.068 | 16.54 | 12 | 22 | 1 |
| IC 1657 | 01 14 07.0 | -32 39 03 | 50.95 | Sy 2 | 2.895 0.145 | 3.950 0.198 | 14.32 | 80 33 18 | 80 33 18 | 1 |
| Fairall 9bbThere is at least one neighboring source inside the PACS field of view. In this case, we removed the neighboring source and selected an aperture that contains only the emission from the BAT source. | 01 23 45.8 | -58 48 21 | 205.85 | Sy 1 | 0.532 0.039 | 0.611 0.038 | 49.46 | 12 | 18 | 1 |
| NGC 526A | 01 23 54.4 | -35 03 56 | 81.86 | Sy 1.5 | 0.201 0.013 | 0.291 0.031 | 63.25 | 12 | 22 | 1 |
| NGC 513 | 01 24 26.9 | +33 47 58 | 83.80 | Sy 2 | 2.862 0.146 | 4.143 0.211 | 20.35 | 18 | 22 | 1 |
| Mrk 359 | 01 27 32.6 | +19 10 44 | 74.42 | Sy 1.5 | 1.468 0.078 | 1.473 0.107 | 13.32 | 12 | 22 | 1 |
| MCG-03-04-072 | 01 28 06.7 | -18 48 31 | 201.25 | Sy 1 | 0.115 0.009 | 0.225 0.017 | 19.74 | 12 | 22 | 1 |
| ESO 244-IG030 | 01 29 51.2 | -42 19 35 | 110.27 | Sy 2 | 1.425 0.075 | 2.207 0.116 | 8.86 | 50 22 36 | 50 22 36 | 1 |
| ESO 297-018bbThere is at least one neighboring source inside the PACS field of view. In this case, we removed the neighboring source and selected an aperture that contains only the emission from the BAT source. | 01 38 37.2 | -40 00 41 | 108.64 | Sy 2 | 0.681 0.037 | 1.838 0.094 | 68.66 | 145 17 20 | 145 17 20 | 1 |
| MCG-01-05-047 | 01 52 49.0 | -03 26 49 | 73.60 | Sy 2 | 2.403 0.135 | 6.131 0.312 | 22.86 | 340 19 63 | 340 19 63 | 1 |
| UGC 01479 | 02 00 19.1 | +24 28 25 | 70.30 | Sy 2 | 1.748 0.090 | 2.665 0.135 | 14.36 | 0 21 32 | 0 21 32 | 1 |
| NGC 788 | 02 01 06.4 | -06 48 56 | 58.06 | Sy 2 | 0.518 0.027 | 0.516 0.027 | 80.13 | 12 | 22 | 1 |
| Mrk 1018 | 02 06 16.0 | -00 17 29 | 185.16 | Sy 1.5 | 0.068 0.012 | 0.115 0.015 | 32.97 | 5.5 | 10.5 | 1 |
| LEDA 138501 | 02 09 34.3 | +52 26 33 | 215.77 | Sy 1 | 0.083 | 0.085 | 51.28 | 12 | 22 | 1 |
| ESO 197-G027 | 02 10 52.5 | -49 41 55 | 210.72 | Sy 2 | 0.736 0.038 | 1.561 0.085 | 7.88 | 14 | 22 | 1 |
| Mrk 590 | 02 14 33.6 | -00 46 00 | 113.73 | Sy 1.2 | 0.545 0.036 | 1.877 0.111 | 16.66 | 12 | 22 | 1 |
| NGC 931 | 02 28 14.5 | +31 18 42 | 71.24 | Sy 1.5 | 2.521 0.143 | 5.331 0.273 | 60.55 | 70 30 67 | 70 30 67 | 1 |
| IC 1816 | 02 31 51.0 | -36 40 19 | 72.51 | Sy 1.8 | 1.782 0.099 | 2.781 0.154 | 19.25 | 22 | 22 | 1 |
| NGC 985 | 02 34 37.8 | -08 47 15 | 188.35 | Sy 1 | 1.296 0.070 | 1.866 0.100 | 31.90 | 85 25 30 | 85 25 30 | 1 |
| ESO 198-024 | 02 38 19.7 | -52 11 33 | 198.99 | Sy 1 | 0.106 0.012 | 0.110 | 29.56 | 12 | 22 | 1 |
| NGC 1052 | 02 41 04.8 | -08 15 21 | 19.48 | Sy 2 | 0.855 0.048 | 0.799 0.083 | 29.46 | 12 | 22 | 1 |
| Mrk 595 | 02 41 34.9 | +07 11 14 | 116.36 | Sy 1.5 | 0.389 0.020 | 0.521 0.033 | 10.86 | 12 | 22 | 1 |
| ESO 479-G031 | 02 44 47.7 | -24 30 50 | 101.19 | L | 0.086 0.011 | 0.152 | 9.05 | 5.5 | 10.5 | 1 |
| HB 890241+622 | 02 44 57.7 | +62 28 07 | 192.21 | Sy 1 | 0.538 0.027 | 0.362 0.024 | 90.54 | 12 | 22 | 1 |
| NGC 1106 | 02 50 40.5 | +41 40 17 | 61.79 | Sy 2 | 1.112 0.058 | 1.737 0.123 | 18.58 | 12 | 22 | 1 |
| 2MFGC 02280 | 02 50 42.6 | +54 42 18 | 64.76 | Sy 2 | 1.541 0.081 | 2.063 0.137 | 27.07 | 12 | 22 | 1 |
| NGC 1125bbThere is at least one neighboring source inside the PACS field of view. In this case, we removed the neighboring source and selected an aperture that contains only the emission from the BAT source. | 02 51 40.3 | -16 39 04 | 46.56 | Sy 2 | 3.224 0.164 | 2.376 0.163 | 17.43 | 18 | 24 | 1 |
| MCG-02-08-014 | 02 52 23.4 | -08 30 37 | 71.67 | Sy 2 | 0.337 0.019 | 0.541 0.041 | 26.07 | 12 | 22 | 1 |
| ESO 417-G006 | 02 56 21.5 | -32 11 08 | 69.68 | Sy 2 | 0.244 0.013 | 0.142 0.027 | 30.66 | 12 | 22 | 1 |
| MCG-02-08-038 | 03 00 04.3 | -10 49 29 | 141.14 | Sy 1 | 0.126 0.010 | 0.340 0.028 | 17.63 | 5.5 | 50 19 30 | 1 |
| NGC 1194 | 03 03 49.1 | -01 06 13 | 58.03 | Sy 1 | 0.633 0.034 | 0.473 0.025 | 36.58 | 12 | 22 | 1 |
| ESO 031-G008 | 03 07 35.3 | -72 50 03 | 119.17 | Sy 1.2 | 0.069 0.005 | 0.259 | 12.43 | 5.5 | 10.5 | 1 |
| MCG+00-09-042 | 03 17 02.2 | +01 15 18 | 102.22 | Sy 2 / L | 3.793 0.192 | 4.155 0.241 | 13.27 | 12 | 22 | 1 |
| IRAS 03219+4031 | 03 25 13.2 | +40 41 55 | 209.07 | Sy 2 | 1.306 0.069 | 1.171 0.088 | 19.41 | 14 | 22 | 1 |
| 2MASX J03305218+0538253 | 03 30 52.2 | +05 38 26 | 201.25 | Sy 1 | 0.222 0.016 | 0.130 0.020 | 11.02 | 5.5 | 10.5 | 1 |
| MCG-01-09-045 | 03 31 23.0 | -05 08 30 | 54.69 | Sy 2 | 0.133 | 0.367 0.025 | 12.75 | 12 | 22 | 1 |
| NGC 1365 | 03 33 36.4 | -36 08 25 | 17.93 | Sy 1.8 | 133.097 6.656 | 217.359 10.871 | 64.07 | 30 139 213 | 30 185 336 | 3 |
| 2MASX J03342453-1513402bbThere is at least one neighboring source inside the PACS field of view. In this case, we removed the neighboring source and selected an aperture that contains only the emission from the BAT source. | 03 34 24.5 | -15 13 40 | 151.59 | Sy 1.5 | 0.610 0.039 | 0.974 0.079 | 12.46 | 12 | 22 | 1 |
| ESO 548-G081 | 03 42 03.7 | -21 14 39 | 61.84 | Sy 1 | 0.960 0.051 | 2.181 0.132 | 44.46 | 18 | 22 | 1 |
| LCRS B034324.7-394349bbThere is at least one neighboring source inside the PACS field of view. In this case, we removed the neighboring source and selected an aperture that contains only the emission from the BAT source. | 03 45 12.5 | -39 34 29 | 186.73 | Sy 1 | 0.142 0.011 | 0.224 0.023 | 10.36 | 5.5 | 10.5 | 1 |
| 2MASX J03502377-5018354bbThere is at least one neighboring source inside the PACS field of view. In this case, we removed the neighboring source and selected an aperture that contains only the emission from the BAT source. | 03 50 23.8 | -50 18 36 | 158.52 | Sy 2 | 0.395 0.027 | 0.471 0.032 | 20.89 | 12 | 10.5 | 1 |
| 2MASX J03534246+3714077 | 03 53 42.5 | +37 14 07 | 79.90 | Sy 2 | 0.817 0.046 | 1.128 0.087 | 15.33 | 12 | 22 | 1 |
| 2MASX J03540948+0249307 | 03 54 09.5 | +02 49 31 | 156.32 | Sy 1 | 0.183 0.012 | 0.198 | 12.85 | 5.5 | 10.5 | 1 |
| ESO 549-G049 | 04 02 25.7 | -18 02 51 | 113.32 | Sy 2 / L | 3.629 0.188 | 5.131 0.262 | 25.16 | 18 | 22 | 1 |
| IRAS 04124-0803 | 04 14 52.7 | -07 55 40 | 165.97 | Sy 1 | 0.657 0.049 | 0.439 0.024 | 21.00 | 12 | 22 | 1 |
| 3C 111 | 04 18 21.3 | +38 01 36 | 212.59 | Sy 1 | 0.266 0.017 | 0.532 0.062 | 116.80 | 12 | 22 | 1 |
| ESO 157-G023bbThere is at least one neighboring source inside the PACS field of view. In this case, we removed the neighboring source and selected an aperture that contains only the emission from the BAT source. | 04 22 24.2 | -56 13 33 | 190.09 | Sy 2 | 0.082 0.007 | 0.588 0.034 | 21.20 | 5.5 | 150 17 28 | 1 |
| 2MASX J04234080+0408017bbThere is at least one neighboring source inside the PACS field of view. In this case, we removed the neighboring source and selected an aperture that contains only the emission from the BAT source. | 04 23 40.8 | +04 08 02 | 196.73 | Sy 2 | 0.574 0.038 | 0.502 0.028 | 23.88 | 12 | 10.5 | 1 |
| 3C 120 | 04 33 11.1 | +05 21 16 | 143.01 | Sy 1 | 1.368 0.070 | 1.639 0.102 | 94.36 | 12 | 22 | 1 |
| Mrk 618 | 04 36 22.2 | -10 22 34 | 154.31 | Sy 1 | 3.036 0.166 | 3.244 0.195 | 17.75 | 18 | 28 | 1 |
| MCG-02-12-050bbThere is at least one neighboring source inside the PACS field of view. In this case, we removed the neighboring source and selected an aperture that contains only the emission from the BAT source. | 04 38 14.2 | -10 47 45 | 157.89 | Sy 1.2 | 0.603 0.042 | 1.376 0.076 | 18.97 | 40 19 23 | 40 19 23 | 1 |
| 1RXS J044154.5-082639 | 04 41 54.1 | -08 26 34 | 192.21 | Sy 1 | 0.176 0.012 | 0.149 0.024 | 10.21 | 12 | 22 | 1 |
| UGC 03142 | 04 43 46.8 | +28 58 19 | 93.00 | Sy 1 | 1.227 0.068 | 2.659 0.161 | 45.54 | 35 | 35 | 1 |
| 2MASX J04440903+2813003 | 04 44 09.0 | +28 13 01 | 48.00 | Sy 2 | 1.224 0.069 | 2.411 0.340 | 52.95 | 12 | 22 | 1 |
| MCG-01-13-025 | 04 51 41.5 | -03 48 33 | 67.96 | Sy 1.2 | 0.092 0.008 | 0.160 0.030 | 31.11 | 5.5 | 10.5 | 1 |
| 1RXS J045205.0+493248 | 04 52 05.0 | +49 32 45 | 125.26 | Sy 1 | 0.354 0.021 | 0.785 0.086 | 63.16 | 12 | 22 | 1 |
| CGCG 420-015 | 04 53 25.8 | +04 03 42 | 126.98 | Sy 2 | 0.648 0.034 | 0.684 0.061 | 28.14 | 12 | 22 | 1 |
| ESO 033-G002 | 04 55 59.0 | -75 32 28 | 77.52 | Sy 2 | 0.697 0.038 | 0.689 0.083 | 21.26 | 12 | 22 | 1 |
| 2MASX J05020903+0331499 | 05 02 09.0 | +03 31 50 | 68.37 | Sy 1 | 0.084 0.010 | 0.183 | 15.31 | 12 | 22 | 1 |
| 2MASX J05054575-2351139 | 05 05 45.7 | -23 51 14 | 152.05 | Sy 2 / HII | 0.179 0.011 | 0.142 0.025 | 60.85 | 12 | 22 | 1 |
| CGCG 468-002NED01bbThere is at least one neighboring source inside the PACS field of view. In this case, we removed the neighboring source and selected an aperture that contains only the emission from the BAT source. | 05 08 19.7 | +17 21 48 | 74.94 | Sy 2 | 2.323 0.119 | 2.378 0.143 | 26.03 | 12 | 12 | 1 |
| IRAS 05078+1626 | 05 10 45.5 | +16 29 56 | 76.56 | Sy 1.5 | 1.175 0.061 | 0.727 0.090 | 90.61 | 12 | 22 | 1 |
| ESO 553-G022 | 05 11 57.8 | -18 29 38 | 183.56 | Sy 2 | 0.082 0.010 | 0.309 0.036 | 13.72 | 12 | 22 | 1 |
| ARK 120 | 05 16 11.4 | -00 08 59 | 141.69 | Sy 1 | 0.685 0.039 | 1.176 0.097 | 69.95 | 12 | 22 | 1 |
| MCG-02-14-009 | 05 16 21.2 | -10 33 41 | 122.84 | Sy 1 | 0.343 0.033 | 0.813 0.060 | 13.58 | 12 | 22 | 1 |
| ESO 362-18 | 05 19 35.8 | -32 39 28 | 53.07 | Sy 1.5 | 1.426 0.073 | 1.923 0.098 | 49.31 | 25 | 25 | 1 |
| PICTOR A | 05 19 49.7 | -45 46 44 | 152.12 | Sy 1 / L | 0.130 0.011 | 0.305 0.023 | 38.59 | 12 | 22 | 1 |
| 2MASX J05240693-1210087bbThere is at least one neighboring source inside the PACS field of view. In this case, we removed the neighboring source and selected an aperture that contains only the emission from the BAT source. | 05 24 06.5 | -12 10 00 | 214.86 | Sy 1 | 0.330 0.021 | 0.261 0.021 | 18.34 | 5.5 | 10.5 | 1 |
| ESO 553-G043 | 05 26 27.3 | -21 17 12 | 119.77 | Sy 2 | 0.122 0.010 | 0.114 | 13.85 | 12 | 22 | 1 |
| NGC 2110 | 05 52 11.4 | -07 27 22 | 35.60 | Sy 2 | 5.141 0.261 | 5.227 0.267 | 319.13 | 18 | 22 | 1 |
| MCG+08-11-011 | 05 54 53.6 | +46 26 22 | 87.90 | Sy 1.5 | 2.639 0.142 | 3.467 0.178 | 133.44 | 0 25 54 | 0 34 58 | 1 |
| 2MASX J05580206-3820043 | 05 58 02.0 | -38 20 05 | 146.83 | Sy 1 | 0.246 0.016 | 0.199 | 29.27 | 5.5 | 10.5 | 1 |
| IRAS 05589+2828 | 06 02 10.7 | +28 28 22 | 142.97 | Sy 1 | 0.959 0.055 | 0.813 0.094 | 65.19 | 12 | 22 | 1 |
| ESO 005-G004 | 06 05 41.6 | -86 37 55 | 22.40 | Sy 2 | 7.616 0.387 | 22.206 1.111 | 33.60 | 95 11 56 | 95 26 79 | 1 |
| Mrk 3 | 06 15 36.3 | 71 02 15 | 57.70 | Sy 2 | 3.220 0.183 | 2.530 0.166 | 135.71 | 38 | 38 | 7 |
| ESO 121-IG028bbThere is at least one neighboring source inside the PACS field of view. In this case, we removed the neighboring source and selected an aperture that contains only the emission from the BAT source. | 06 23 45.6 | -60 58 44 | 176.55 | Sy 2 | 0.075 | 0.233 | 28.12 | 12 | 22 | 1 |
| ESO 426-G002 | 06 23 46.4 | -32 13 00 | 96.39 | Sy 2 | 0.196 0.011 | 0.146 0.022 | 24.36 | 5.5 | 10.5 | 1 |
| 6dF J0626586-370559 | 06 26 58.6 | -37 05 59 | 167.57 | Sy 1.5 | 0.209 0.013 | 0.442 0.032 | 11.69 | 12 | 22 | 1 |
| VII Zw 073 | 06 30 25.6 | +63 40 41 | 180.20 | Sy 2 | 2.056 0.104 | 1.804 0.138 | 11.14 | 12 | 22 | 1 |
| UGC 03478 | 06 32 47.2 | +63 40 25 | 54.46 | Sy 1.2 | 1.465 0.077 | 3.824 0.197 | 10.13 | 50 27 41 | 50 27 41 | 1 |
| ESO 490-IG026 | 06 40 11.7 | -25 53 43 | 106.99 | Sy 1.2 | 1.975 0.102 | 1.604 0.103 | 37.42 | 12 | 22 | 1 |
| 2MASX J06411806+3249313 | 06 41 18.0 | +32 49 32 | 205.78 | Sy 2 | 0.087 0.009 | 0.053 | 35.08 | 12 | 22 | 1 |
| Mrk 6bbThere is at least one neighboring source inside the PACS field of view. In this case, we removed the neighboring source and selected an aperture that contains only the emission from the BAT source. | 06 52 12.3 | +74 25 37 | 80.62 | Sy 1.5 | 1.043 0.061 | 0.942 0.071 | 60.60 | 12 | 18 | 1 |
| UGC 03601 | 06 55 49.5 | +40 00 01 | 73.28 | Sy 1.5 | 0.367 0.020 | 0.719 0.075 | 21.38 | 12 | 22 | 1 |
| 2MASX J06561197-4919499 | 06 56 12.0 | -49 19 50 | 178.71 | Sy 2 | 0.259 0.016 | 0.126 0.023 | 12.17 | 5.5 | 10.5 | 1 |
| MCG+06-16-028 | 07 14 03.9 | +35 16 45 | 67.09 | Sy 2 | 2.549 0.128 | 2.487 0.155 | 16.71 | 12 | 22 | 1 |
| 2MASX J07262635-3554214 | 07 26 26.4 | -35 54 22 | 127.04 | Sy 2 | 1.113 0.059 | 0.700 | 23.35 | 12 | 22aaHigh uncertainty due to cirrus contamination in the PACS field of view | 1 |
| Mrk 79 | 07 42 32.8 | +49 48 35 | 95.34 | Sy 1.2 | 1.431 0.088 | 2.370 0.185 | 46.57 | 22 | 30 | 1 |
| UGC 03995AbbThere is at least one neighboring source inside the PACS field of view. In this case, we removed the neighboring source and selected an aperture that contains only the emission from the BAT source. | 07 44 07.0 | +29 14 57 | 67.60 | Sy 2 | 0.093 | 1.915 0.097 | 16.98 | 12 | 22 | 1 |
| Mrk 10 | 07 47 29.1 | +60 56 01 | 126.38 | Sy 1.2 | 0.713 0.040 | 1.973 0.101 | 14.80 | 130 21 31 | 130 26 37 | 1 |
| 2MASS J07594181-3843560 | 07 59 41.7 | -38 43 57 | 174.22 | Sy 1.2 | 0.046 0.007 | 0.121 | 50.64 | 5.5 | 10.5 | 1 |
| 2MASX J07595347+2323241 | 07 59 53.5 | +23 23 24 | 126.06 | Sy 2 | 2.311 0.120 | 4.943 0.250 | 34.54 | 18 | 22 | 1 |
| IC 0486 | 08 00 21.0 | +26 36 49 | 115.89 | Sy 1 | 0.989 0.062 | 1.483 0.089 | 32.16 | 14 | 22 | 1 |
| ESO 209-G012 | 08 01 58.0 | -49 46 42 | 176.44 | Sy 1.5 | 1.039 0.058 | 2.077 0.107 | 21.27 | 28 | 28 | 1 |
| 2MASX J08032736+0841523 | 08 03 27.4 | +08 41 52 | 204.87 | Sy 1 | 0.079 | 0.112 | 17.32 | 12 | 22 | 1 |
| Mrk 1210 | 08 04 05.9 | +05 06 50 | 57.60 | Sy 2 | 1.510 0.078 | 0.914 0.089 | 54.44 | 12 | 22 | 1 |
| MCG+02-21-013 | 08 04 46.4 | +10 46 36 | 149.34 | Sy 2 | 0.713 0.046 | 1.701 0.103 | 15.22 | 12 | 22 | 1 |
| Fairall 272bbThere is at least one neighboring source inside the PACS field of view. In this case, we removed the neighboring source and selected an aperture that contains only the emission from the BAT source. | 08 23 01.1 | -04 56 05 | 93.70 | Sy 2 | 0.798 0.044 | 1.222 0.071 | 46.43 | 12 | 22 | 1 |
| Fairall 1146 | 08 38 30.8 | -35 59 33 | 136.66 | Sy 1.5 | 1.219 0.068 | 1.407 0.090 | 28.91 | 14 | 22 | 1 |
| MCG+11-11-032 | 08 55 12.5 | +64 23 46 | 157.45 | Sy 2 | 0.113 0.008 | 0.317 0.020 | 17.71 | 12 | 22 | 1 |
| NGC 2655 | 08 55 37.7 | +78 13 23 | 24.40 | Sy 2 | 1.830 0.093 | 2.862 0.147 | 13.44 | 14 | 24 | 1 |
| Mrk 18 | 09 01 58.4 | +60 09 06 | 47.23 | Sy 2 | 2.565 0.133 | 2.409 0.170 | 12.21 | 12 | 22 | 1 |
| 2MASX J09023729-4813339 | 09 02 37.3 | -48 13 34 | 170.18 | Sy 1 | 0.092 0.010 | 0.801 | 29.41 | 12 | 22aaHigh uncertainty due to cirrus contamination in the PACS field of view | 1 |
| 2MASX J09043699+5536025 | 09 04 36.9 | +55 36 03 | 161.42 | Sy 1 | 0.181 0.010 | 0.130 | 15.20 | 12 | 22 | 1 |
| Mrk 704 | 09 18 26.0 | +16 18 19 | 126.29 | Sy 1.5 | 0.336 0.018 | 0.253 0.027 | 33.09 | 12 | 22 | 1 |
| SBS 0915+556bbThere is at least one neighboring source inside the PACS field of view. In this case, we removed the neighboring source and selected an aperture that contains only the emission from the BAT source. | 09 19 13.2 | +55 27 55 | 216.68 | Sy 2 | 0.098 0.013 | 0.075 | 8.13 | 5.5 | 10.5 | 1 |
| IC 2461 | 09 19 58.0 | +37 11 29 | 54.18 | Sy 1.9 | 1.446 0.075 | 3.244 0.164 | 19.91 | 48 40 15 | 48 40 15 | 1 |
| MCG-01-24-012bbThere is at least one neighboring source inside the PACS field of view. In this case, we removed the neighboring source and selected an aperture that contains only the emission from the BAT source. | 09 20 46.2 | -08 03 22 | 84.24 | Sy 2 | 0.572 0.031 | 1.091 0.136 | 40.82 | 5.5 | 34 | 1 |
| MCG+04-22-042 | 09 23 43.0 | +22 54 33 | 140.08 | Sy 1.2 | 0.131 0.012 | 0.399 0.027 | 39.86 | 5.5 | 0 16 28 | 1 |
| 2MASX J09235371-3141305 | 09 23 53.7 | -31 41 31 | 184.85 | Sy 1.9 | 0.110 0.007 | 0.163 | 19.16 | 12 | 22 | 1 |
| 2MASX J09254750+6927532 | 09 25 47.5 | +69 27 53 | 169.73 | Sy 1 | 0.086 0.009 | 0.200 | 9.23 | 5.5 | 10.5 | 1 |
| NGC 2885 | 09 27 18.5 | +23 01 12 | 113.43 | Sy 1 | 0.233 0.013 | 0.648 0.057 | 15.91 | 12 | 22 | 1 |
| CGCG 312-012 | 09 29 37.9 | +62 32 39 | 110.33 | Sy 2 | 0.071 0.006 | 0.189 0.027 | 9.04 | 12 | 22 | 1 |
| ESO 565-G019bbThere is at least one neighboring source inside the PACS field of view. In this case, we removed the neighboring source and selected an aperture that contains only the emission from the BAT source. | 09 34 43.6 | -21 55 40 | 69.65 | Sy 2 | 3.045 0.155 | 3.029 0.154 | 20.68 | 18 | 18 | 1 |
| 2MASX J09360622-6548336bbThere is at least one neighboring source inside the PACS field of view. In this case, we removed the neighboring source and selected an aperture that contains only the emission from the BAT source. | 09 36 06.3 | -65 48 33 | 170.72 | Sy 1.8 | 0.074 | 0.118 | 12.97 | 12 | 22 | 1 |
| CGCG 122-055 | 09 42 04.8 | +23 41 07 | 91.76 | Sy 1 | 0.651 0.040 | 0.572 0.039 | 13.76 | 12 | 22 | 1 |
| NGC 2992bbThere is at least one neighboring source inside the PACS field of view. In this case, we removed the neighboring source and selected an aperture that contains only the emission from the BAT source. | 09 45 42.1 | -14 19 35 | 31.60 | Sy 2 | 9.456 0.480 | 12.119 0.755 | 26.89 | 35 | 60 | 3 |
| MCG-05-23-016 | 09 47 40.2 | -30 56 55 | 36.10 | Sy 2 | 1.454 0.074 | 0.477 0.031 | 201.30 | 12 | 22 | 1 |
| NGC 3035 | 09 51 55.0 | -06 49 23 | 62.03 | Sy 1.8 | 0.803 0.049 | 2.633 0.134 | 19.32 | 144 31 42 | 144 31 42 | 1 |
| NGC 3081 | 09 59 29.5 | -22 49 35 | 32.50 | Sy 2 | 2.657 0.134 | 3.992 0.202 | 83.17 | 80 35 49 | 80 35 49 | 3 |
| 2MASX J09594263-3112581 | 09 59 42.6 | -31 12 58 | 160.78 | Sy 1 | 0.282 0.018 | 0.270 0.027 | 17.24 | 12 | 22 | 1 |
| NGC 3079 | 10 01 57.8 | +55 40 47 | 19.13 | Sy 2 | 62.729 2.155 | 98.058 4.778 | 33.03 | 170 34 113 | 170 34 113 | 1 |
| ESO 499-G041 | 10 05 55.4 | -23 03 25 | 54.67 | Sy 1.5 | 0.540 0.028 | 0.940 0.137 | 14.63 | 12 | 22 | 1 |
| ESO 263-G013 | 10 09 48.2 | -42 48 40 | 145.35 | Sy 2 | 0.165 0.011 | 0.196 | 35.35 | 5.5 | 10.5 | 1 |
| ESO 374-G044 | 10 13 19.9 | -35 58 58 | 122.84 | Sy 2 | 0.285 0.015 | 0.326 0.032 | 20.07 | 12 | 22 | 1 |
| ARK 241 | 10 21 40.2 | -03 27 14 | 178.01 | Sy 1 | 0.081 0.005 | 0.178 | 20.41 | 12 | 22 | 1 |
| NGC 3227 | 10 23 30.6 | +19 51 54 | 20.85 | Sy 1.5 | 10.781 0.544 | 21.675 1.091 | 109.94 | 152 64 87 | 152 64 87 | 5 |
| NGC 3281 | 10 31 52.1 | -34 51 13 | 45.45 | Sy 2 | 7.342 0.369 | 7.006 0.361 | 86.41 | 24 | 45 | 3 |
| 2MASX J10402231-4625264 | 10 40 22.5 | -46 25 26 | 102.93 | Sy 2 | 1.202 0.064 | 1.407 0.105 | 24.93 | 12 | 22 | 1 |
| SDSS J104326.47+110524.2 | 10 43 26.5 | +11 05 24 | 208.41 | Sy 1 | 0.058 0.010 | 0.140 | 14.17 | 12 | 22 | 1 |
| MCG+12-10-067 | 10 44 08.5 | +70 24 19 | 145.53 | Sy 2 | 0.869 0.046 | 1.908 0.099 | 12.88 | 15 19 32 | 15 19 32 | 1 |
| MCG+06-24-008 | 10 44 49.0 | +38 10 52 | 111.52 | Sy 1.9 | 0.752 0.051 | 1.850 0.104 | 13.98 | 14 | 22 | 1 |
| UGC 05881 | 10 46 42.5 | +25 55 54 | 88.36 | Sy 2 | 1.891 0.096 | 2.002 0.128 | 19.31 | 12 | 22 | 1 |
| NGC 3393 | 10 48 23.5 | -25 09 43 | 53.34 | Sy 2 | 1.731 0.088 | 3.780 0.196 | 25.98 | 18 | 55 | 1 |
| Mrk 417 | 10 49 30.9 | +22 57 52 | 141.88 | Sy 2 | 0.132 0.008 | 0.118 0.020 | 32.40 | 5.5 | 10.5 | 1 |
| NGC 3431 | 10 51 15.0 | -17 00 29 | 75.01 | Sy 2 | 0.665 0.051 | 1.745 0.098 | 22.43 | 130 17 39 | 130 17 39 | 1 |
| Mrk 728 | 11 01 01.8 | +11 02 49 | 154.74 | Sy 1.9 | 0.046 0.005 | 0.062 | 13.72 | 5.5 | 10.5 | 1 |
| NGC 3516 | 11 06 47.5 | +72 34 07 | 38.90 | Sy 1.5 | 1.804 0.092 | 1.196 0.090 | 118.34 | 12 | 22 | 1 |
| IC 2637 | 11 13 49.7 | +09 35 11 | 126.27 | Sy 1.5 | 2.576 0.136 | 4.187 0.221 | 12.39 | 18 | 22 | 1 |
| ARP 151 | 11 25 36.2 | +54 22 57 | 90.54 | Sy 1 | 0.048 | 0.070 | 19.57 | 5.5 | 10.5 | 1 |
| ESO 439-G009bbThere is at least one neighboring source inside the PACS field of view. In this case, we removed the neighboring source and selected an aperture that contains only the emission from the BAT source. | 11 27 23.4 | -29 15 27 | 102.78 | Sy 2 | 0.600 0.044 | 1.486 0.078 | 6.71 | 102 19 24 | 102 19 24 | 1 |
| NGC 3718 | 11 32 34.9 | +53 04 05 | 17.00 | L | 0.632 0.051 | 3.709 0.240 | 12.09 | 14 | 130 23 100 | 1 |
| IC 2921 | 11 32 49.3 | +10 17 47 | 192.38 | Sy 1 | 0.090 0.011 | 0.172 | 15.64 | 5.5 | 10.5 | 1 |
| Mrk 739E | 11 36 29.4 | +21 35 46 | 128.42 | Sy 1 | 1.683 0.085 | 3.130 0.179 | 13.19 | 14 | 22 | 1 |
| IGR J11366-6002 | 11 36 42.0 | -60 03 07 | 59.77 | Sy 2 / L | 1.142 0.059 | 1.587 0.090 | 20.69 | 12 | 22 | 1 |
| NGC 3783 | 11 39 01.8 | -37 44 19 | 38.50 | Sy 1 | 3.046 0.157 | 4.491 0.270 | 181.11 | 40 | 40 | 3 |
| NGC 3786bbThere is at least one neighboring source inside the PACS field of view. In this case, we removed the neighboring source and selected an aperture that contains only the emission from the BAT source. | 11 39 42.6 | +31 54 33 | 46.18 | Sy 1.8 | 2.190 0.205 | 3.138 0.454 | 18.02 | 60 19 29 | 60 19 29 | 1 |
| KUG 1141+371 | 11 44 29.9 | +36 53 09 | 165.52 | Sy 1 | 0.045 0.009 | 0.098 | 15.38 | 5.5 | 10.5 | 1 |
| UGC 06728 | 11 45 16.0 | +79 40 53 | 27.70 | Sy 1.2 | 0.104 0.008 | 0.087 | 27.20 | 12 | 22 | 1 |
| 2MASX J11454045-1827149 | 11 45 40.5 | -18 27 16 | 142.74 | Sy 1 | 0.312 0.026 | 0.339 0.024 | 53.26 | 12 | 22 | 1 |
| MCG+05-28-032bbThere is at least one neighboring source inside the PACS field of view. In this case, we removed the neighboring source and selected an aperture that contains only the emission from the BAT source. | 11 48 45.9 | +29 38 28 | 98.95 | L | 0.876 0.049 | 1.381 0.121 | 24.48 | 12 | 22 | 1 |
| MCG-01-30-041 | 11 52 38.2 | -05 12 26 | 80.63 | Sy 1.8 | 1.497 0.077 | 1.751 0.124 | 14.02 | 12 | 22 | 1 |
| 2MASX J12005792+0648226 | 12 00 57.9 | +06 48 23 | 156.52 | Sy 2 | 0.522 0.027 | 0.917 0.060 | 21.18 | 12 | 22 | 1 |
| Mrk 1310 | 12 01 14.4 | -03 40 41 | 83.87 | Sy 1 | 0.137 0.011 | 0.268 0.026 | 11.32 | 12 | 22 | 1 |
| LEDA 38038 | 12 02 47.6 | -53 50 08 | 120.69 | Sy 2 | 1.951 0.102 | 1.413 0.126 | 48.02 | 12 | 22 | 1 |
| NGC 4051 | 12 03 09.6 | +44 31 53 | 14.58 | Sy 1.5 | 13.365 0.675 | 38.655 1.943 | 39.54 | 120 104 133 | 120 104 133 | 5 |
| ARK 347 | 12 04 29.7 | +20 18 58 | 96.46 | Sy 2 | 0.365 0.019 | 0.497 0.030 | 29.48 | 12 | 22 | 1 |
| UGC 07064bbThere is at least one neighboring source inside the PACS field of view. In this case, we removed the neighboring source and selected an aperture that contains only the emission from the BAT source. | 12 04 43.3 | +31 10 38 | 107.64 | Sy 1.9 | 1.749 0.092 | 3.089 0.175 | 13.27 | 14 | 22 | 1 |
| NGC 4102 | 12 06 23.0 | +52 42 40 | 20.38 | L | 55.005 2.751 | 54.194 2.710 | 27.90 | 35 45 55 | 35 45 55 | 1 |
| Mrk 198 | 12 09 14.1 | +47 03 30 | 104.23 | Sy 2 | 0.846 0.050 | 1.025 0.065 | 22.22 | 12 | 22 | 1 |
| NGC 4138 | 12 09 29.8 | +43 41 07 | 15.57 | Sy 1.9 | 2.063 0.129 | 5.537 0.459 | 30.00 | 147 32 45 | 147 32 45 | 1 |
| NGC 4151bbThere is at least one neighboring source inside the PACS field of view. In this case, we removed the neighboring source and selected an aperture that contains only the emission from the BAT source. | 12 10 32.6 | +39 24 21 | 9.90 | Sy 1.5 | 6.889 0.354 | 9.055 0.460 | 538.93 | 135 64 96 | 135 64 96 | 4 |
| KUG 1208+386 | 12 10 44.3 | +38 20 10 | 97.97 | Sy 1 | 0.195 0.014 | 0.163 | 20.69 | 5.5 | 10.5 | 1 |
| NGC 4180 | 12 13 03.0 | +07 02 20 | 40.08 | Sy 2 | 5.250 0.264 | 8.980 0.451 | 16.66 | 40 29 39 | 40 29 39 | 1 |
| NGC 4235 | 12 17 09.9 | +07 11 30 | 24.97 | Sy 1 | 0.349 0.018 | 0.823 0.130 | 32.45 | 12 | 22 | 1 |
| Mrk 202 | 12 17 55.0 | +58 39 35 | 90.21 | Sy 1 | 0.197 0.012 | 0.295 0.024 | 8.07 | 12 | 22 | 1 |
| Mrk 766 | 12 18 26.5 | +29 48 46 | 55.15 | Sy 1.5 | 4.259 0.216 | 2.941 0.192 | 21.67 | 12 | 22 | 1 |
| MESSIER 106 | 12 18 57.5 | +47 18 14 | 7.44 | Sy 1.9 / L | 35.872 0.761 | 105.177 2.314 | 22.00 | 160 158 376 | 160 158 376 | 3 |
| Mrk 50 | 12 23 24.1 | +02 40 45 | 100.78 | Sy 1 | 0.055 | 0.142 | 22.62 | 12 | 22 | 1 |
| NGC 4388 | 12 25 46.7 | +12 39 44 | 21.37 | Sy 2 | 11.796 0.594 | 18.588 0.933 | 277.38 | 92 44 78 | 92 44 78 | 5 |
| 2MASX J12313717-4758019 | 12 31 37.2 | -47 58 02 | 119.31 | Sy 1 | 1.507 0.079 | 1.955 0.119 | 15.52 | 12 | 22 | 1 |
| 2MASX J12335145-2103448 | 12 33 51.4 | -21 03 45 | 99.04 | Sy 1 | 0.349 0.018 | 0.286 0.028 | 9.89 | 12 | 22 | 1 |
| NGC 4507 | 12 35 36.6 | -39 54 33 | 50.30 | Sy 2 | 4.392 0.221 | 4.677 0.241 | 188.11 | 35 | 35 | 1 |
| ESO 506-G027 | 12 38 54.6 | -27 18 28 | 107.75 | Sy 2 | 0.529 0.036 | 1.219 0.066 | 93.94 | 12 | 76 17 37 | 1 |
| LEDA 170194bbThere is at least one neighboring source inside the PACS field of view. In this case, we removed the neighboring source and selected an aperture that contains only the emission from the BAT source. | 12 39 06.3 | -16 10 47 | 159.33 | Sy 2 | 0.373 0.022 | 0.638 0.046 | 41.15 | 12 | 22 | 1 |
| Mrk 653 | 12 39 51.7 | +34 58 30 | 188.01 | Sy 2 | 0.136 0.009 | 0.412 0.025 | 9.00 | 12 | 22 | 1 |
| WKK 1263 | 12 41 25.7 | -57 50 04 | 105.15 | Sy 1.5 | 0.728 0.040 | 1.005 0.089 | 46.66 | 12 | 22 | 1 |
| NGC 4619 | 12 41 44.5 | +35 03 46 | 99.35 | Sy 1 | 1.339 0.072 | 3.236 0.165 | 7.02 | 0 27 33 | 0 27 33 | 1 |
| 2MASX J12475784-5829599bbThere is at least one neighboring source inside the PACS field of view. In this case, we removed the neighboring source and selected an aperture that contains only the emission from the BAT source. | 12 47 57.8 | -58 30 00 | 120.84 | Sy 1.9 | 0.093 | 0.081 | 9.56 | 12 | 22 | 1 |
| NGC 4748 | 12 52 12.5 | -13 24 53 | 62.49 | Sy 1 | 1.437 0.073 | 2.416 0.137 | 13.78 | 12 | 22 | 1 |
| MCG-01-33-063 | 13 00 19.1 | -08 05 15 | 113.32 | Sy 2 | 0.302 0.027 | 1.160 0.062 | 10.32 | 350 9 23 | 350 15 33 | 1 |
| SBS 1301+540 | 13 03 59.5 | +53 47 30 | 129.23 | Sy 1 | 0.151 | 0.085 | 32.61 | 12 | 22 | 1 |
| NGC 4941 | 13 04 13.1 | -05 33 06 | 18.22 | Sy 2 | 0.965 0.058 | 3.955 0.216 | 20.45 | 12 | 16 41 71 | 1 |
| NGC 4939 | 13 04 14.4 | -10 20 23 | 44.16 | Sy 2 | 1.938 0.123 | 7.000 0.379 | 24.85 | 0 49 72 | 0 49 72 | 1 |
| ESO 323-077 | 13 06 26.1 | -40 24 53 | 64.15 | Sy 1.2 | 7.017 0.354 | 7.531 0.455 | 33.06 | 12 | 22 | 1 |
| NGC 4992 | 13 09 05.6 | +11 38 03 | 108.25 | Sy 2 | 0.180 0.010 | 0.548 0.047 | 53.47 | 5.5 | 0 21 30 | 1 |
| II SZ 010 | 13 13 05.8 | -11 07 42 | 148.60 | Sy 1 | 0.085 0.006 | 0.125 0.013 | 15.20 | 12 | 22 | 1 |
| NGC 5033 | 13 13 27.5 | +36 35 38 | 19.64 | Sy 1.9 | 19.133 0.959 | 50.152 2.534 | 5.52 | 170 31 68 | 170 54 83 | 1 |
| UGC 08327NED02bbThere is at least one neighboring source inside the PACS field of view. In this case, we removed the neighboring source and selected an aperture that contains only the emission from the BAT source. | 13 15 17.3 | +44 24 26 | 158.79 | Sy 2 | 1.483 0.077 | 0.884 0.092 | 17.08 | 12 | 18 | 1 |
| NGC 5106bbThere is at least one neighboring source inside the PACS field of view. In this case, we removed the neighboring source and selected an aperture that contains only the emission from the BAT source. | 13 20 59.6 | +08 58 42 | 138.27 | L | 2.872 0.153 | 5.005 0.258 | 13.97 | 18 | 22 | 1 |
| MCG-03-34-064 | 13 22 24.5 | -16 43 42 | 70.76 | Sy 1.8 | 5.099 0.257 | 3.444 0.198 | 30.53 | 12 | 22 | 1 |
| Centaurus A | 13 25 27.6 | -43 01 09 | 3.66 | Sy 2 | 400.576 20.031 | 732.884 36.647 | 1388.99 | 123 100 261 | 100 146 367 | 4 |
| ESO 509-G038 | 13 31 13.9 | -25 24 10 | 111.91 | Sy 1 | 0.441 0.023 | 0.732 0.079 | 14.24 | 12 | 22 | 1 |
| ESO 383-18 | 13 33 26.1 | -34 00 53 | 52.93 | Sy 2 | 0.654 0.041 | 0.753 0.070 | 18.87 | 12 | 22 | 1 |
| ESO 509-IG066NED01bbThere is at least one neighboring source inside the PACS field of view. In this case, we removed the neighboring source and selected an aperture that contains only the emission from the BAT source. | 13 34 39.6 | -23 26 48 | 148.78 | Sy 2 | 0.883 0.048 | 1.656 0.154 | 18.18 | 10 | 26 | 1 |
| NGC 5231 | 13 35 48.2 | +02 59 56 | 93.46 | Sy 2 | 0.702 0.039 | 1.771 0.125 | 15.62 | 12 | 22 | 1 |
| MCG-06-30-015 | 13 35 53.7 | -34 17 44 | 32.90 | Sy 1.2 | 1.205 0.063 | 0.762 0.068 | 63.33 | 12 | 22 | 1 |
| NGC 5252 | 13 38 16.0 | +04 32 33 | 98.77 | Sy 1.9 | 0.341 0.023 | 0.298 0.030 | 115.48 | 12 | 22 | 1 |
| 2MASX J13411287-1438407 | 13 41 12.9 | -14 38 41 | 182.26 | Sy 1 | 0.132 0.009 | 0.198 0.022 | 24.07 | 12 | 16 | 1 |
| NGC 5273 | 13 42 08.3 | +35 39 15 | 15.96 | Sy 1.9 | 0.721 0.040 | 0.705 0.063 | 13.91 | 12 | 22 | 1 |
| CGCG 102-048 | 13 44 15.7 | +19 34 00 | 116.73 | Sy 1.9 | 0.052 0.008 | 0.147 | 19.51 | 5.5 | 10.5 | 1 |
| NGC 5290 | 13 45 19.2 | +41 42 45 | 34.98 | Sy 2 | 2.071 0.240 | 7.339 1.290 | 19.17 | 272 19 76 | 272 19 76 | 1 |
| 4U 1344-60 | 13 47 36.0 | -60 37 04 | 54.94 | Sy 1.5 | 2.040 0.116 | 1.923 | 107.52 | 12 | 22aaHigh uncertainty due to cirrus contamination in the PACS field of view | 1 |
| IC 4329A | 13 49 19.3 | -30 18 34 | 68.65 | Sy 1.2 | 1.797 0.095 | 0.968 0.121 | 290.49 | 12 | 22 | 1 |
| UM 614 | 13 49 52.8 | +02 04 45 | 141.64 | Sy 1 | 0.061 | 0.103 | 16.18 | 12 | 22 | 1 |
| 2MASX J13512953-1813468 | 13 51 29.5 | -18 13 47 | 52.09 | Sy 1 | 0.076 | 0.079 | 17.88 | 12 | 22 | 1 |
| Mrk 279bbThere is at least one neighboring source inside the PACS field of view. In this case, we removed the neighboring source and selected an aperture that contains only the emission from the BAT source. | 13 53 03.4 | +69 18 30 | 131.67 | Sy 1.5 | 0.852 0.044 | 0.822 0.073 | 39.20 | 12 | 22 | 1 |
| ESO 578-G009 | 13 56 36.7 | -19 31 45 | 151.96 | Sy 1 | 0.318 0.030 | 0.999 0.075 | 16.90 | 18 | 22 | 1 |
| 2MASX J14080674-3023537 | 14 08 06.8 | -30 23 54 | 100.88 | Sy 1.5 | 0.043 | 0.134 | 17.19 | 12 | 22 | 1 |
| NGC 5506 | 14 13 14.9 | -03 12 27 | 23.83 | Sy 1.9 | 8.214 0.414 | 6.768 0.352 | 241.03 | 93 26 57 | 93 26 57 | 3 |
| NGC 5548 | 14 17 59.5 | +25 08 12 | 73.51 | Sy 1.5 | 1.173 0.064 | 1.494 0.098 | 78.64 | 12 | 22 | 1 |
| ESO 511-G030 | 14 19 22.4 | -26 38 41 | 96.21 | Sy 1 | 0.405 0.010 | 2.021 0.132 | 39.88 | 160 34 54 | 160 34 54 | 1 |
| NGC 5610 | 14 24 22.9 | +24 36 51 | 72.26 | Sy 2 | 5.419 0.275 | 6.219 0.315 | 19.21 | 270 23 34 | 270 23 34 | 1 |
| NGC 5674 | 14 33 52.2 | +05 27 30 | 107.35 | Sy 1.9 | 1.819 0.098 | 3.940 0.202 | 15.97 | 0 34 39 | 0 34 39 | 1 |
| NGC 5683 | 14 34 52.4 | +48 39 43 | 157.31 | Sy 1 | 0.097 0.010 | 0.169 | 12.27 | 5.5 | 10.5 | 1 |
| Mrk 817 | 14 36 22.1 | +58 47 39 | 136.11 | Sy 1.5 | 2.159 0.110 | 1.706 0.154 | 25.91 | 12 | 22 | 1 |
| Mrk 477bbThere is at least one neighboring source inside the PACS field of view. In this case, we removed the neighboring source and selected an aperture that contains only the emission from the BAT source. | 14 40 38.1 | +53 30 16 | 164.03 | Sy 1 | 1.307 0.070 | 0.735 0.047 | 14.40 | 12 | 10.5 | 1 |
| NGC 5728 | 14 42 23.9 | -17 15 11 | 30.57 | Sy 2 | 9.758 0.489 | 13.717 0.687 | 88.63 | 30 38 75 | 30 38 75 | 3 |
| WKK 4374 | 14 51 33.1 | -55 40 38 | 77.09 | Sy 2 | 0.277 0.019 | 0.763 | 40.84 | 12 | 22aaHigh uncertainty due to cirrus contamination in the PACS field of view | 1 |
| 2MASX J14530794+2554327 | 14 53 07.9 | +25 54 33 | 203.52 | Sy 1 | 0.131 | 0.129 | 24.01 | 12 | 22 | 1 |
| WKK 4438 | 14 55 17.4 | -51 34 15 | 68.42 | Sy 1 | 0.858 0.056 | 1.592 0.158 | 21.51 | 14 | 22 | 1 |
| IC 4518AbbThere is at least one neighboring source inside the PACS field of view. In this case, we removed the neighboring source and selected an aperture that contains only the emission from the BAT source. | 14 57 41.2 | -43 07 56 | 69.55 | Sy 2 | 5.209 0.261 | 5.011 0.251 | 27.75 | 14 | 14 | 1 |
| Mrk 841 | 15 04 01.2 | +10 26 16 | 158.20 | Sy 1 | 0.448 0.023 | 0.182 0.014 | 35.57 | 12 | 22 | 1 |
| Mrk 1392 | 15 05 56.6 | +03 42 26 | 156.92 | Sy 1 | 0.364 0.026 | 0.936 0.063 | 19.01 | 12 | 22 | 1 |
| 2MASX J15064412+0351444 | 15 06 44.1 | +03 51 44 | 163.91 | Sy 2 | 0.064 0.006 | 0.148 | 15.67 | 5.5 | 10.5 | 1 |
| 2MASX J15115979-2119015 | 15 11 59.8 | -21 19 02 | 194.95 | Sy 1 | 1.846 0.094 | 1.572 0.122 | 31.30 | 12 | 22 | 1 |
| NGC 5899 | 15 15 03.2 | +42 02 59 | 38.08 | Sy 2 | 5.097 0.262 | 13.193 0.665 | 20.08 | 21 31 69 | 21 31 69 | 1 |
| CGCG 319-007bbThere is at least one neighboring source inside the PACS field of view. In this case, we removed the neighboring source and selected an aperture that contains only the emission from the BAT source. | 15 19 33.7 | +65 35 59 | 192.21 | Sy 1.9 | 0.345 0.022 | 0.760 0.068 | 13.23 | 12 | 22 | 1 |
| MCG-01-40-001 | 15 33 20.7 | -08 42 02 | 97.60 | Sy 2 | 2.056 0.108 | 2.425 0.125 | 32.72 | 78 21 40 | 78 21 40 | 1 |
| Mrk 290 | 15 35 52.4 | +57 54 09 | 127.80 | Sy 1 | 0.178 0.010 | 0.116 0.008 | 23.31 | 12 | 22 | 1 |
| 2MASX J15462424+6929102bbThere is at least one neighboring source inside the PACS field of view. In this case, we removed the neighboring source and selected an aperture that contains only the emission from the BAT source. | 15 46 24.3 | +69 29 10 | 162.52 | Sy 1.9 | 0.176 0.013 | 0.097 0.019 | 13.94 | 5.5 | 10.5 | 1 |
| NGC 5995 | 15 48 25.0 | -13 45 28 | 108.50 | Sy 2 | 4.025 0.202 | 5.399 0.273 | 43.66 | 30 | 30 | 1 |
| WKK 6092 | 16 11 51.4 | -60 37 55 | 66.85 | Sy 1 | 0.196 0.014 | 0.058 | 32.15 | 12 | 22 | 1 |
| WKK 6471 | 16 18 36.4 | -59 27 17 | 150.20 | Sy 1 | 0.084 0.008 | 0.519 0.054 | 21.36 | 12 | 22 | 1 |
| CGCG 367-009 | 16 19 19.3 | +81 02 48 | 102.90 | Sy 2 | 0.059 0.007 | 0.154 0.029 | 22.71 | 5.5 | 10.5 | 1 |
| Mrk 885 | 16 29 48.3 | +67 22 42 | 109.09 | Sy 1 | 0.406 0.023 | 1.002 0.085 | 13.96 | 12 | 22 | 1 |
| ESO 137-34 | 16 35 14.1 | -58 04 48 | 32.95 | Sy 2 | 2.793 0.150 | 6.220 0.386 | 28.19 | 53 | 53 | 1 |
| 2MASX J16481523-3035037 | 16 48 15.3 | -30 35 04 | 134.10 | Sy 1 | 0.096 0.008 | 0.136 | 45.69 | 12 | 22 | 1 |
| LEDA 214543 | 16 50 42.7 | +04 36 18 | 138.79 | Sy 2 | 0.118 0.008 | 0.326 0.022 | 24.49 | 12 | 22 | 1 |
| UGC 10593 | 16 52 18.9 | +55 54 20 | 125.92 | Sy 2 | 0.510 0.035 | 0.917 0.064 | 15.15 | 12 | 22 | 1 |
| NGC 6221 | 16 52 46.1 | -59 13 07 | 12.34 | Sy 2 | 59.107 2.976 | 83.425 6.715 | 20.16 | 175 72 103 | 175 72 103 | 1 |
| NGC 6240 | 16 52 58.9 | +02 24 03 | 105.37 | Sy 2 | 26.621 1.358 | 20.233 1.028 | 72.21 | 24 | 24 | 6 |
| NGC 6300 | 17 16 59.5 | -62 49 14 | 15.06 | Sy 2 | 19.113 1.091 | 44.229 2.621 | 99.43 | 120 73 90 | 120 73 90 | 1 |
| ARP 102B | 17 19 14.5 | +48 58 49 | 103.99 | Sy 1 / L | 0.103 0.009 | 0.133 | 18.20 | 5.5 | 10.5 | 1 |
| AX J1737.4-2907 | 17 37 28.4 | -29 08 03 | 91.89 | Sy 1 | 0.451 0.029 | 0.617 | 115.86 | 12 | 22aaHigh uncertainty due to cirrus contamination in the PACS field of view | 1 |
| ESO 139-G012 | 17 37 39.1 | -59 56 27 | 72.83 | Sy 2 | 0.414 0.027 | 2.704 0.142 | 22.55 | 12 | 30 41 58 | 1 |
| 2E1739.1-1210 | 17 41 55.3 | -12 11 57 | 160.78 | Sy 1 | 0.561 0.028 | 0.781 0.114 | 44.50 | 12 | 22 | 1 |
| CGCG 300-062 | 17 43 17.4 | +62 50 21 | 142.96 | Sy 2 | 0.102 0.006 | 0.286 0.021 | 10.08 | 12 | 22 | 1 |
| 2MASS J17485512-3254521 | 17 48 55.1 | -32 54 52 | 85.79 | Sy 1 | 0.140 | 0.240 | 36.66 | 12 | 22 | 1 |
| NGC 6552 | 18 00 07.3 | +66 36 54 | 114.20 | Sy 2 | 2.574 0.132 | 2.188 0.143 | 19.19 | 12 | 22 | 1 |
| 2MASXI J1802473-145454 | 18 02 47.3 | -14 54 55 | 14.40 | Sy 1 | 1.203 0.063 | 1.872 0.229 | 40.33 | 12 | 22 | 1 |
| UGC 11185NED02bbThere is at least one neighboring source inside the PACS field of view. In this case, we removed the neighboring source and selected an aperture that contains only the emission from the BAT source. | 18 16 11.5 | +42 39 37 | 179.63 | Sy 2 | 0.467 0.031 | 0.465 0.027 | 19.22 | 12 | 10.5 | 1 |
| IC 4709 | 18 24 19.4 | -56 22 09 | 72.34 | Sy 2 | 0.592 0.040 | 0.943 0.051 | 42.55 | 0 13 28 | 0 20 50 | 1 |
| Fairall 49 | 18 36 58.3 | -59 24 09 | 85.88 | Sy 2 | 3.318 0.169 | 2.555 0.147 | 14.16 | 12 | 22 | 1 |
| ESO 103-035 | 18 38 20.3 | -65 25 39 | 56.69 | Sy 2 | 1.732 0.088 | 0.551 0.034 | 111.73 | 12 | 22 | 1 |
| Fairall 51 | 18 44 54.0 | -62 21 53 | 60.54 | Sy 1 | 2.032 0.104 | 1.753 0.104 | 40.36 | 12 | 22 | 1 |
| CGCG 341-006 | 18 45 26.2 | +72 11 02 | 202.61 | Sy 2 | 1.135 0.060 | 0.957 0.098 | 11.54 | 12 | 22 | 1 |
| 2MASX J18570768-7828212 | 18 57 07.8 | -78 28 21 | 183.20 | Sy 1 | 0.349 0.019 | 0.356 0.031 | 24.22 | 12 | 22 | 1 |
| CGCG 229-015 | 19 05 25.9 | +42 27 40 | 120.31 | Sy 1 | 0.148 0.009 | 0.270 0.022 | 11.14 | 12 | 22 | 1 |
| ESO 141-G055 | 19 21 14.1 | -58 40 13 | 161.27 | Sy 1 | 0.613 0.041 | 1.310 0.088 | 54.42 | 12 | 22 | 1 |
| 2MASX J19373299-0613046 | 19 37 33.0 | -06 13 05 | 43.65 | Sy 1.5 | 3.588 0.184 | 4.964 0.272 | 23.21 | 18 | 22 | 1 |
| 2MASX J19380437-5109497 | 19 38 04.4 | -51 09 50 | 174.30 | Sy 1.2 | 0.078 0.010 | 0.211 0.024 | 15.05 | 5.5 | 10.5 | 1 |
| NGC 6814 | 19 42 40.6 | -10 19 25 | 22.80 | Sy 1.5 | 7.224 0.370 | 16.265 0.824 | 77.27 | 96 55 58 | 96 55 58 | 1 |
| 2MASX J20005575-1810274 | 20 00 55.7 | -18 10 27 | 161.32 | Sy 1 | 0.886 0.046 | 0.696 0.062 | 20.90 | 12 | 22 | 1 |
| ESO 399-20 | 20 06 57.7 | -34 32 58 | 107.43 | Sy 1 | 0.622 0.040 | 1.441 0.074 | 17.93 | 26 | 26 | 1 |
| NGC 6860 | 20 08 46.9 | -61 06 01 | 63.59 | Sy 1 | 1.431 0.076 | 3.059 0.160 | 53.18 | 22 | 26 | 3 |
| 2MASX J20101740+4800214 | 20 10 17.4 | +48 00 21 | 110.41 | Sy 2 | 0.198 0.012 | 0.352 0.033 | 13.26 | 12 | 22 | 1 |
| 2MASX J20183871+4041003 | 20 18 38.7 | +40 41 00 | 61.50 | Sy 2 | 0.371 | 0.611 | 28.47 | 12aaHigh uncertainty due to cirrus contamination in the PACS field of view | 22aaHigh uncertainty due to cirrus contamination in the PACS field of view | 1 |
| II Zw 083 | 20 26 55.9 | -02 16 39 | 125.89 | Sy 2 | 1.162 0.061 | 1.306 0.098 | 12.59 | 12 | 22 | 1 |
| MCG+04-48-002bbThere is at least one neighboring source inside the PACS field of view. In this case, we removed the neighboring source and selected an aperture that contains only the emission from the BAT source. | 20 28 35.1 | +25 44 00 | 59.34 | Sy 2 | 9.698 0.486 | 10.445 0.524 | 77.79 | 60 22 33 | 60 22 33 | 1 |
| Mrk 509 | 20 44 09.7 | -10 43 25 | 149.18 | Sy 1.2 | 1.501 0.078 | 1.230 0.088 | 96.16 | 12 | 22 | 1 |
| IC 5063 | 20 52 02.3 | -57 04 08 | 48.35 | Sy 2 | 4.266 0.419 | 3.603 0.280 | 72.57 | 120 27 44 | 120 39 69 | 3 |
| ESO 464-G016 | 21 02 23.8 | -28 10 29 | 157.89 | AGN | 0.466 0.024 | 0.524 0.028 | 14.10 | 12 | 22 | 1 |
| 2MASX J21090996-0940147 | 21 09 10.0 | -09 40 15 | 114.30 | Sy 1.2 / L | 0.307 0.018 | 0.229 0.030 | 19.75 | 12 | 22 | 1 |
| SWIFT J212745.6+565636 | 21 27 44.9 | +56 56 40 | 62.79 | Sy 1 | 0.156 0.010 | 0.050 | 37.27 | 12 | 22 | 1 |
| 6dF J2132022-334254bbThere is at least one neighboring source inside the PACS field of view. In this case, we removed the neighboring source and selected an aperture that contains only the emission from the BAT source. | 21 32 02.2 | -33 42 54 | 129.56 | Sy 1 | 0.079 0.007 | 0.082 | 42.69 | 5.5 | 10.5 | 1 |
| 2MASX J21355399+4728217 | 21 35 54.0 | +47 28 22 | 107.65 | Sy 1 | 0.518 0.037 | 0.749 0.100 | 22.24 | 12 | 22 | 1 |
| CGCG 493-002 | 21 38 33.4 | +32 05 06 | 106.77 | Sy 1.5 | 0.426 0.045 | 0.419 0.025 | 17.92 | 12 | 22 | 1 |
| NGC 7172 | 22 02 01.9 | -31 52 11 | 33.90 | Sy 2 | 7.148 0.362 | 12.693 0.641 | 170.93 | 98 29 63 | 98 29 63 | 5 |
| NGC 7213 | 22 09 16.3 | -47 10 00 | 22.00 | Sy 1.5 | 3.237 0.165 | 7.961 0.401 | 42.10 | 50 | 50 | 1 |
| MCG+02-57-002 | 22 23 45.0 | +11 50 09 | 125.26 | Sy 1.5 | 0.539 0.027 | 0.667 0.081 | 14.18 | 12 | 22 | 1 |
| MCG+06-49-019 | 22 27 05.8 | +36 21 42 | 91.58 | Sy 2 | 0.142 0.013 | 0.517 0.039 | 19.77 | 5.5 | 80 17 28 | 1 |
| ESO 533-G050 | 22 34 49.8 | -25 40 37 | 114.00 | Sy 2 | 0.103 0.015 | 0.398 0.029 | 13.55 | 5.5 | 20 18 29 | 1 |
| MCG+01-57-016 | 22 40 17.0 | +08 03 14 | 107.53 | Sy 1.8 | 0.936 0.051 | 0.966 0.108 | 16.64 | 12 | 22 | 1 |
| UGC 12237 | 22 54 19.7 | +11 46 57 | 122.05 | Sy 2 | 0.640 0.040 | 1.083 0.068 | 17.11 | 90 19 52 | 90 19 52 | 1 |
| UGC 12282 | 22 58 55.5 | +40 55 53 | 72.71 | Sy 1.9 | 1.189 0.071 | 3.685 0.189 | 19.20 | 186 18 49 | 186 18 49 | 1 |
| KAZ 320 | 22 59 32.9 | +24 55 06 | 149.64 | Sy 1 | 0.366 0.020 | 0.308 0.029 | 24.97 | 12 | 22 | 1 |
| NGC 7465 | 23 02 01.0 | +15 57 53 | 27.20 | L | 4.169 0.211 | 4.715 0.241 | 14.56 | 12 | 22 | 1 |
| NGC 7469bbThere is at least one neighboring source inside the PACS field of view. In this case, we removed the neighboring source and selected an aperture that contains only the emission from the BAT source. | 23 03 15.6 | +08 52 26 | 69.79 | Sy 1.2 | 30.770 1.540 | 26.935 1.499 | 66.74 | 18 | 40 | 3 |
| Mrk 926 | 23 04 43.5 | -08 41 09 | 205.15 | Sy 1.5 | 0.606 0.033 | 0.713 0.067 | 113.89 | 12 | 22 | 1 |
| NGC 7479 | 23 04 56.7 | +12 19 22 | 33.85 | Sy 2 / L | 14.341 0.723 | 25.989 1.307 | 20.36 | 40 53 86 | 40 82 88 | 1 |
| PG 2304+042bbThere is at least one neighboring source inside the PACS field of view. In this case, we removed the neighboring source and selected an aperture that contains only the emission from the BAT source. | 23 07 02.9 | +04 32 57 | 183.20 | Sy 1 | 0.025 | 0.028 | 15.00 | 12 | 22 | 1 |
| NGC 7582 | 23 18 23.5 | -42 22 14 | 20.62 | Sy 2 | 67.409 3.393 | 77.261 3.967 | 80.65 | 156 61 123 | 156 61 123 | 5 |
| NGC 7603 | 23 18 56.6 | +00 14 38 | 127.57 | Sy 1.5 | 1.331 0.070 | 2.639 0.136 | 50.22 | 12 | 22 | 1 |
| LCRS B232242.2-384320 | 23 25 24.2 | -38 26 49 | 155.87 | Sy 1 | 0.644 0.037 | 1.339 0.077 | 14.97 | 12 | 22 | 1 |
| 2MASX J23272195+1524375 | 23 27 22.0 | +15 24 37 | 199.97 | Sy 1 | 0.135 0.009 | 0.247 0.024 | 10.52 | 12 | 22 | 1 |
| NGC 7679 | 23 28 46.7 | +03 30 41 | 73.35 | Sy 2 | 8.875 0.446 | 9.002 0.458 | 15.12 | 18 | 22 | 1 |
| IGR J23308+7120 | 23 30 37.7 | +71 22 46 | 160.69 | Sy 2 | 0.379 0.028 | 0.810 0.057 | 11.13 | 12 | 22 | 1 |
| PKS 2331-240 | 23 33 55.2 | -23 43 41 | 208.95 | Sy 2 | 0.142 0.010 | 0.341 0.025 | 15.30 | 12 | 22 | 1 |
| UGC 12741 | 23 41 55.5 | +30 34 54 | 74.68 | Sy 2 | 0.461 0.029 | 1.078 0.075 | 19.76 | 12 | 22 | 1 |
Note. — Column 1: galaxy name. Column 2-3: coordinates. Column 4: luminosity distance in Mpc. To calculate the distance we assumed a universe with a Hubble constant Ho = 71 km s–1 Mpc–1, = 0.73, and = 0.27, with redshift values taken from NASA’s ExtraGalactic Database (NED), except for sources with redshift values of z 0.01 where distances are taken from The Extragalactic Distance Database (EDD, Tully, 1988; Tully et al., 2009). Column 5: Galaxy type from Baumgartner et al. (2013), Seyfert galaxies (Sy), LINERs (L) and ESO 464-G016 (AGN, unclassified Seyfert galaxy Véron-Cetty & Véron, 2010). Column 6-7: PACS flux densities. Column 8: BAT fluxes in units of 10-12 ergs s-1 cm-2 computed in the 14-195 keV band. Column 9-10. Aperture size in arcsec for PACS 70 and 160. For elliptical apertures there are three different values, the position angle (o) of the aperture’s major axis measured from West to North and, the minor and major diameter in arcsec. For point-like sources with flux densities fainter than 500 mJy we adopted smaller apertures as recommended by the NASA Herschel Science Center. Column 11: Herschel program ID, (1) OT1_rmushotz_1, (2) OT1_lho_1, (3) GT1_msanchez_2, (4) KPGT_cwilso01_1, (5) GT1_lspinogl_2, (6) KPGT_esturm_1, (7) OT2_aalonsoh_2.
4 Far-Infrared Properties of the BAT sample
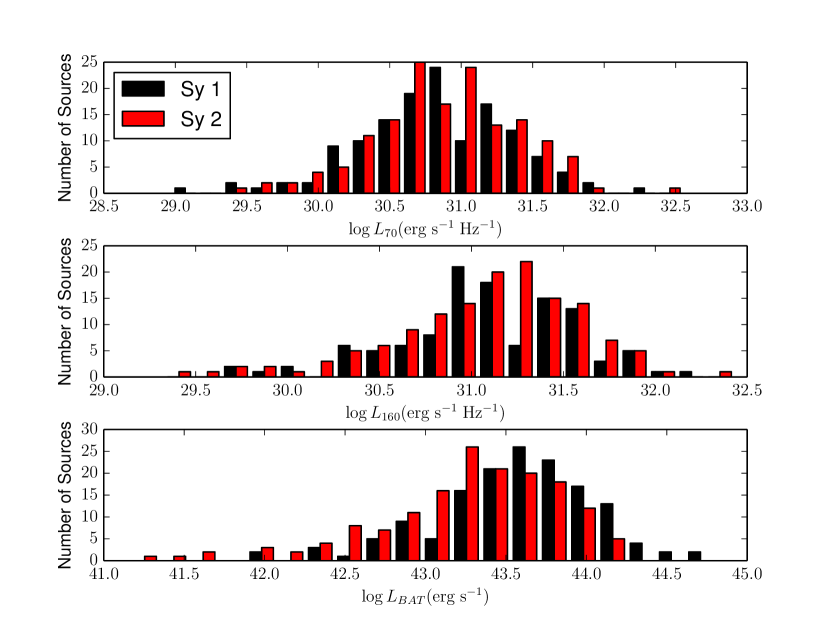
Figure 3 presents the histograms comparing the 70 , 160 and BAT 14-195 keV luminosities of the Seyfert 1 and Seyfert 2 galaxies. We performed a Kolmogorov-Smirnov (K-S) test on the detected sources to determine whether the BAT Seyfert 1 and 2 galaxy populations are drawn from the same parent distribution. A K-S probability value of less than 5 is the probability that two samples drawn from the same parent population would differ this much 5 of the time, i.e., that they are statistically different. A strong level of significance is obtained for values smaller than 1 (e.g., Press et al., 1992; Bevington & Robinson, 2003). The number of sources, mean values, standard deviations and the K-S probability of the null hypothesis for the sample are presented in Table 2. The K-S test for the luminosity distribution at 70 returns a 70.0 probability of the null hypothesis (i.e., the Seyfert 1 and Seyfert 2 galaxy populations are not distinguished by the present data). Similarly, the K-S null probability for the luminosity distribution at 160 is 52.0. A similar situation for the Seyfert galaxies in the BAT sample has also been found in the luminosities of MIR narrow emission lines (Weaver et al., 2010) and of optical, reddening-corrected emission lines (Winter et al., 2010).
Caution must be taken when applying statistical tests to data sets that contain non-detections (upper limits), or “censored” data points. In order to deal with these problems, we used the Astronomy SURVival analysis software package ASURV Rev 1.2 (Isobe et al., 1986; Lavalley et al., 1992). We performed statistical two-sample tests and found that the luminosity distribution at 70 returns a 23.8 probability when using Gehan’s Generalized Wilcoxon test, in other words, two samples drawn from the same parent population would differ this much 23.8 of the time. This result is in agreement, within the statistical significance, with the K-S test on the detected sources. On the other hand, the luminosity distribution at 160 returns a Gehan’s Generalized Wilcoxon test probability of 5.3. A similar two-sample test for censored data, the Peto-Prentice generalized Wilcoxon test, returns a probability of only 4.2 that the Seyfert 1’s and 2’s populations at 160 are drawn from the same parent population. Thus, the luminosity distributions of the Seyfert 1 and 2 galaxy populations at 160 differ at a weak but possibly statistically significant level when non-detections are included in the analysis. From this we find that Seyfert 2 galaxies have a very slightly higher mean luminosity at 160 , L (erg s-1 Hz-1), than Seyfert 1 galaxies, L (erg s-1 Hz-1). By comparison, the six sources uniquely identified as LINERs in our sample have mean luminosities at 70 and 160 of L (erg s-1 Hz-1) and L (erg s-1 Hz-1), respectively, thus different to Seyfert 1 and Seyfert 2 galaxies. The number of sources with detected and “censored” data points and the Gehan’s Generalized Wilcoxon test probability of the null hypothesis for the sample are presented in Table 2. In addition, Table 2 also shows the mean value for the entire sample of Seyfert 1 and 2 galaxies (including detections and non-detections) based on the Kaplan-Meier estimator with randomly censored data (Kaplan & Meier, 1958).
The similar FIR luminosities in these two types of Seyfert galaxies implies that radiation at these wavelengths is roughly isotropic, e.g., independent of orientation. This result suggests two plausible scenarios: (i) star formation is isotropic, and hence the FIR luminosities of Seyfert 1 and 2 galaxies would be indistinguishable and/or (ii) the AGN torus is isotropic at FIR wavelengths. In the former scenario, we find that a large number of BAT sources are point-like in the PACS 70 images, implying a compact FIR nucleus of less than 6″(which typically encompasses regions of less than a couple of kpc). Thus, if star formation is the culprit of most of the FIR emission, then it has to happen in a very compact, nuclear region suggesting a connection between the AGN and the nuclear cold molecular gas (see Mushotzky et al., 2014). The latter scenario is in agreement with some theoretical calculations of the dusty, obscuring material surrounding the accretion disk that predict a similar shape for the FIR part of the SED for both types of galaxy populations (e.g., Kennicutt et al., 2003; Stalevski et al., 2012). Note that some torus models predict an angle dependence on the FIR luminosity, with Seyfert 1 galaxies having higher luminosities than Seyfert 2 galaxies (e.g., Fritz et al., 2006). Thus, in order to match the observed FIR part of the SED, predictions from these models require an extra contribution from a circumnuclear starburst in edge-on systems. In general, much of the light would have its origin in star formation.
On the other hand, the 14-195 keV X-ray luminosities (Figure 3), bottom panel) are statistically different between the Seyfert types with a K-S test probability of 8.0 , e.g, two samples drawn from the same parent population would differ this much 8.0 of the time. We find that Seyfert 2 galaxies have, on average, smaller luminosities, L (erg s-1), than Seyfert 1 galaxies with L (erg s-1), in agreement with previous results (Meléndez et al., 2008a; Winter et al., 2009; Weaver et al., 2010; Burlon et al., 2011; Ichikawa et al., 2012). This result suggests two possible scenarios: (1) Compton down scattering, even in the high energy 14-195 keV band, for some of the Seyfert 2 galaxies may be important in reducing the observed flux (e.g., Ikeda et al., 2009; Murphy & Yaqoob, 2009), or (2) the statistical differences between absorbed (Seyfert 2s) and unabsorbed (Seyfert 1s) AGN are more fundamental with absorbed AGN being intrinsically less luminous than unabsorbed AGN in agreement with previous studies (e.g., Cowie et al., 2003; Steffen et al., 2003; Ueda et al., 2003; Barger et al., 2005; La Franca et al., 2005; Hasinger et al., 2005; Burlon et al., 2011). Regarding the former scenario, one must consider that there is no observational evidence of a dominant population of Compton thick (CT) AGN in the BAT survey (e.g., Burlon et al., 2011). Moreover, the fraction of CT objects in deep hard X-ray surveys has been estimated with some precision to be only 17 (e.g., Bassani et al., 2013).
The latter scenario, an intrinsic difference between the luminosities of Seyfert types, is supported by the difference in the luminosity break found in the luminosity function between the two classes of objects for the BAT sample, with absorbed AGN having (on average) lower luminosities than unabsorbed AGN (e.g., Burlon et al., 2011). Overall, this scenario provides a test for the basic predictions from the unified model of AGN in which the intrinsic AGN luminosity should be independent of obscuration; that is, one must consider a model where the physical properties of the dusty, molecular torus change as a function of the intrinsic properties of the AGN central engine, e.g., accretion rate, power, etc (e.g., Lawrence, 1991). For the purpose of this paper, we shall consider both scenarios as plausible and discuss their implications in the context of the FIR emission of AGN.
| Observable | Measurements | Mean | Standard | Measurements | Mean | Standard | |
|---|---|---|---|---|---|---|---|
| Available | Deviation | Available | Deviation | ||||
| (1) | (2) | (3) | (4) | (5) | (6) | (7) | (8) |
| (Seyfert 1) | (Seyfert 2) | ||||||
| L70µm | 137 | 30.83 | 0.05 | 151 | 30.88 | 0.04 | 7.0 |
| L160µm | 113 | 31.08 | 0.04 | 141 | 31.07 | 0.05 | 5.2 |
| LBAT | 149 | 43.56 | 0.04 | 157 | 43.26 | 0.05 | 8.0 |
| L70µm/L160µm | 113 | 0.81 | 0.43 | 139 | 0.77 | 0.47 | 5.4 |
| Statistical Analysis (censored data) | |||||||
| L70µmaa The mean values and standard deviations are given by the Kaplan-Meier estimator. The two-sample test probability is given by Gehan’s Generalized Wilcoxon test. | 149 (12) | 30.73 | 0.05 | 157 (6) | 30.84 | 0.04 | 2.4 |
| L160µmaa The mean values and standard deviations are given by the Kaplan-Meier estimator. The two-sample test probability is given by Gehan’s Generalized Wilcoxon test. | 149 (36) | 30.72 | 0.08 | 157 (16) | 30.98 | 0.05 | 5.0 |
Note. — Column 1: the observed data used for the correlation analysis. Column 2: number of Seyfert 1 galaxies used for the correlation analysis. Column 3: mean value for Seyfert 1 galaxies. Column 4: standard deviation for Seyfert 1 galaxies. Columns (5), (6) and (7) are the same as columns (2), (3) and (4) but for Seyfert 2 galaxies. Column (8): the K-S test null probability for the detected data points and Gehan’s Generalised Wilcoxon test probability when upper limits are considered. In order to calculate the mean value and standard deviations with “censored” data points (number of sources with upper limits in parentheses), we used the Kaplan-Meier estimator with randomly censored data (Kaplan & Meier, 1958).
5 Far-Infrared and Hard X-ray Correlations
As we mentioned before, FIR emission is widely used as a probe of star formation. However, it is clear that if the AGN has some contribution at FIR wavelengths, then one must correct these SFR indicators accordingly. Figure 4 shows 14-195 keV luminosities versus the 70 or 160 luminosity. Due to redshift effects, luminosity–luminosity plots will almost always show some correlation. So, we used a non-parametric test for partial correlation with censored data (Akritas & Siebert, 1996) in order to exclude the redshift effect. From this we find that the 14-195 keV luminosities are statistically correlated with the FIR luminosities in the Seyfert 1 galaxies with a partial Kendall =0.201 and a probability of at 70 , and =0.116 and at 160 . We find no statistically significant correlation between the 14-195 keV and FIR luminosities in the Seyfert 2 galaxies; in other words, the 14-195 keV and FIR luminosity distributions are independent (see Table 3 for details). In order to test whether these correlations are dependent on the BAT luminosity, we used the partial Kendall test in two different groups: sources with () and () for Seyfert 1 (Seyfert 2) galaxies. For Seyfert 1 galaxies at 70 , we find =0.189 and (), and =0.258 and (). Similarly, at 160 we find =0.117 and (), and =0.226 and (). Again, we find no statistically significant correlation between the 14-195 keV and FIR luminosities in the Seyfert 2 galaxies within the luminosity groups (see Table 3 for details). Note that in the Seyfert 1 galaxies the FIR-X-ray correlations get stronger for the most X-ray luminous objects suggesting that the AGN contribution overwhelms the SF contribution at high luminosities.
| vs | ||||||
|---|---|---|---|---|---|---|
| (1) | (2) | (3) | (4) | (5) | (6) | (7) |
| (Seyfert 1) | (Seyfert 2) | |||||
| LBAT - L70 | 0.201 | 0.044 | 5.3 | 0.076 | 0.041 | 6.4 |
| LBAT - L160 | 0.116 | 0.043 | 6.7 | -0.005 | 0.042 | 9.1 |
| LBAT - L70 | 0.189 | 0.050 | 1.6 | 0.063 | 0.045 | 1.6 |
| LBAT - L160 | 0.117 | 0.049 | 1.8 | -0.007 | 0.046 | 8.7 |
| LBAT - L70 | 0.258 | 0.119 | 3.0 | 0.004 | 0.090 | 9.6 |
| LBAT - L160 | 0.226 | 0.100 | 2.3 | 0.009 | 0.096 | 9.2 |
| W/O CT | ||||||
| LBAT - L70 | 0.065 | 0.043 | 1.2 | |||
| LBAT - L160 | -0.014 | 0.044 | 7.5 | |||
| W/O CT and Candidates for CT | ||||||
| LBAT - L70 | 0.084 | 0.048 | 8.0 | |||
| LBAT - L160 | -0.019 | 0.049 | 9.6 | |||
Note. — Column 1: log X and log Y represent the independent and dependent variables, respectively. Column 2: is the Kendall’s coefficient for partial correlation with censored data for Seyfert 1 galaxies. Column 3: is the calculated variance for Seyfert 1 galaxies. Column 4: is the associated null probability for Kendall for Seyfert 1 galaxies. Columns (5), (6) and (7) are the same as columns (2), (3) and (4) but for Seyfert 2 galaxies. We also show the correlation analysis for the sample of Seyfert 2 galaxies when Compton Thick (CT, Table 5) sources are excluded (W/O CT) and, when CT and candidates for CT are excluded (W/O CT and Candidates for CT, see Table 5 and 6).
Overall, for the Seyfert 1 galaxies, we find a better correlation at 70 than at 160 . This result is in agreement with previous works where the correlations between 14-195 keV luminosities and different monochromatic infrared luminosities get weaker at longer wavelengths where the contribution from star formation might be greater. For example, the tightest and most significant correlations are found between the 14-195 keV luminosities and the 9,12 and 18 emission (e.g., Gandhi et al., 2009; Matsuta et al., 2012; Ichikawa et al., 2012), and the correlations get less significant at longer FIR wavelengths (e.g., Meléndez et al., 2008b; Nenkova et al., 2008b; Matsuta et al., 2012; Ichikawa et al., 2012). However, this is the first time that a weak but possibly statistically significant correlation between the intrinsic power of the AGN and the FIR emission at 160 has been found. These results suggest two possible scenarios: (1) if we assume that the FIR luminosity is a good tracer of star formation (e.g., Calzetti et al., 2010), then there is a connection between star formation and the AGN at sub-kiloparsec scales (e.g., Mushotzky et al., 2014), or (2) dust heated by the AGN has a statistically significant contribution to the FIR emission at 70 and 160µm. In the latter scenario, SFR indicators that rely on FIR emission, either through the individual infrared bands (Calzetti et al., 2010) or the total FIR emission (8–1000 , Kennicutt, 1998), need to consider the AGN contribution in their predictions. Note that in order to increase the FIR emission predicted from the outer (and colder) regions of many torus models (AGN contribution), one could use any combination of free parameters, such as an increase of the torus radius with a constant optical depth, a flatter radial density profile and/or an edge-on orientation (e.g., Nenkova et al., 2008b; Stalevski et al., 2012). Within these parameters (uncertainties), smooth, continuous torus models seem to be able to predict higher FIR fluxes than clumpy torus calculations (with a broader range of SED shapes); however, clumpy models provide a better match to the MIR portion of the SED (e.g., Mullaney et al., 2011).
In addition, Figure 4 shows different linear regression methods applied to the sample (see Table 4 for values). In order to test the effect of the upper limits in our sample, we estimated the linear regression coefficients using the EM (expectation-maximization) algorithm with censored data (Isobe et al., 1986) and an ordinary least-square regression of the dependent variable, Y, against the independent variable X, (OLS) without the inclusion of censored data (only detections). Both methods show a good agreement, within their uncertainties, suggesting that the non-detections in our sample do not significantly change the results. However, it is not clear that the FIR luminosity is a direct consequence of the BAT luminosity; thus, a bisector method may be more appropriate to investigate the underlying functional relationship between the hard X-ray and FIR luminosities (Isobe et al., 1990). From this we find a nearly linear relationship between the AGN and PACS monochromatic luminosities, with Seyfert 1 and Seyfert 2 galaxies having similar slopes within the given uncertainties. Overall, these values are in agreement with the slopes found by Matsuta et al. (2012) between the 14-195 keV and 90 luminosities.
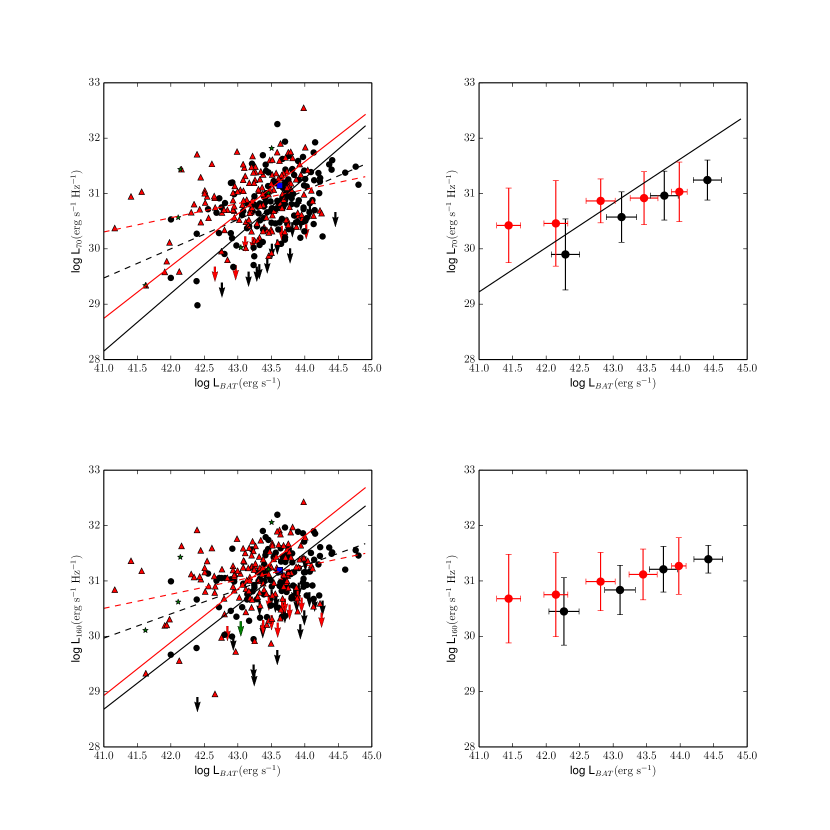
| vs | 11 m and b represent the regression coefficient (slope) and regression constant (intercept), respectively. | 11 m and b represent the regression coefficient (slope) and regression constant (intercept), respectively. | 11 m and b represent the regression coefficient (slope) and regression constant (intercept), respectively. | |||
|---|---|---|---|---|---|---|
| m | b | m | b | m | b | |
| (1) | (2) | (3) | (4) | |||
| Seyfert 1 Galaxies: | ||||||
| LBAT - L70 | 0.54 0.09 | 7.45 3.79 | 0.52 0.08 | 8.14 3.70 | 1.04 0.07 | -14.60 2.87 |
| LBAT - L160 | 0.45 0.11 | 11.06 4.74 | 0.44 0.08 | 11.95 3.51 | 0.94 0.06 | -9.88 2.74 |
| Seyfert 2 Galaxies: | ||||||
| LBAT - L70 | 0.26 0.07 | 19.83 3.22 | 0.25 0.08 | 20.13 3.64 | 0.94 0.04 | -9.96 1.84 |
| LBAT - L160 | 0.13 0.08 | 25.30 3.33 | 0.25 0.09 | 20.32 4.06 | 0.96 0.05 | -10.52 2.09 |
Note. — Column 1: log X and log Y represent the independent and dependent variables, respectively. Column 2: linear regression coefficients using the EM algorithm with censored data (upper limits). Column 3: ordinary least-square regression of the dependent variable, Y, against the independent variable X, OLS(Y—X) without the inclusion of censored data. Column 4: OLS bisector method without censored data which treat the variables symmetrically. See Isobe et al. (1990) for a review of all the methods.
Included as well in Figure 4 is the relation between and for AGN dominated sources from Netzer (2009) (black line in upper right panel). In order to compare this relation with our sample, we assumed a mean ratio of , as derived from the PACS-IRAS comparison presented in Figure 2, and a constant ratio of 10.5 to transfer the 14-195 keV luminosity to bolometric luminosity (Winter et al., 2012). Overall, the Netzer (2009) relationship for AGN dominated sources is in fair agreement with the mean values of our sample, and it extends linearly over our range of X-ray luminosities. Note that systems above this straight line may be dominated by star formation in the host galaxy resulting in the flatter slope observed in Seyfert 2 galaxies at low BAT luminosities, erg s-1 (or erg s-1). This luminosity is smaller, by a factor of 3, than the turnover value found by Rosario et al. (2012) for local AGN, (erg s-1), however, Seyfert 1 galaxies show no turnover over our range of X-ray luminosities. Netzer (2009) suggested a time evolution scenario to explain the versus linear correlation, where the galaxy transitions from a pure starburst to a powerful composite starburst-AGN and, finally, to a weak composite starburst-AGN phase. In this scenario, after a long star formation period, some of the cold gas is funneled to the center of the galaxy and feeds the black hole, resulting in a short period of intense AGN and stellar activity with high star formation and accretion rate. This stage is characterized by sources rising and moving horizontally above the straight line in the right upper panel in Figure 4. As the cold gas supply diminishes, both the star formation and the central AGN fade in parallel and fall below the straight line (see Figure 14 in Netzer, 2009). Interestingly, this scenario may suggest an analogous evolutionary connection between the Seyfert 1 and Seyfert 2 branches in our L70 versus LBAT comparison. Here Seyfert 2 galaxies, dominated by star formation, are above the straight line. As they evolve in time, they reach their maximum AGN and star formation activity until the Seyfert 1 and Seyfert 2 galaxy branches grow together at high star formation, L70, and AGN luminosity, LBAT. As the supply of cold gas is reduced, the AGN and star formation luminosity fade together below the straight line, evolving into the observed Seyfert 1 galaxy branch. Note that the slope of the Netzer (2009) relationship () is in good agreement with our values derived from the bisector method whereas the OLS slopes are much flatter.
5.1 Seyfert 2 Galaxies
In the previous section, we proposed two scenarios to explain the statistical differences in the 14-195 keV luminosity distribution between Seyfert 1 and Seyfert 2 galaxies: the effect of Compton scattering in the Seyfert 2 population, or that Seyfert 2 galaxies are intrinsically less luminous than Seyfert 1 galaxies. In the following discussion, we will investigate the effect of these scenarios in the FIR and hard X-ray relationship in order to find the culprit for the lack of correlation between the 14-195 keV and FIR luminosities in Seyfert 2 galaxies. In the former scenario, if Compton scattering in the 14-195 keV band is important, then the more heavily obscured sources are responsible for breaking the intrinsic correlation between the FIR and the hard X-ray by reducing the X-ray flux and, perhaps, increasing the FIR emission. This scenario is in agreement with the lack of a correlation found between the 14-195 keV luminosities and the AKARI infrared luminosities at 90 in CT AGN for the the 22-month BAT survey (Matsuta et al., 2012). Moreover, in this sample, Seyfert 2 galaxies are correlated if CT AGN are excluded. In order to test the effect of high X-ray column densities on the FIR and X-ray correlations, we have compiled published values for the X-ray column densities of Seyfert 2 galaxies in our sample (see Tueller et al., 2008; Winter et al., 2009; Burlon et al., 2011; Vasudevan et al., 2013, and references therein). From this we found that 106 out of 157 Seyfert 2 galaxies have published X-ray column densities with 18 sources having high X-ray column densities, (see Table 5). We use the same partial correlation analysis as before and find that, even when excluding the CT sources presented in Table 5, there is no statistically significant correlation between the 14-195 keV and FIR luminosities (70 and 160 ) in Seyfert 2 galaxies when the influence of distance is excluded (see Table3).
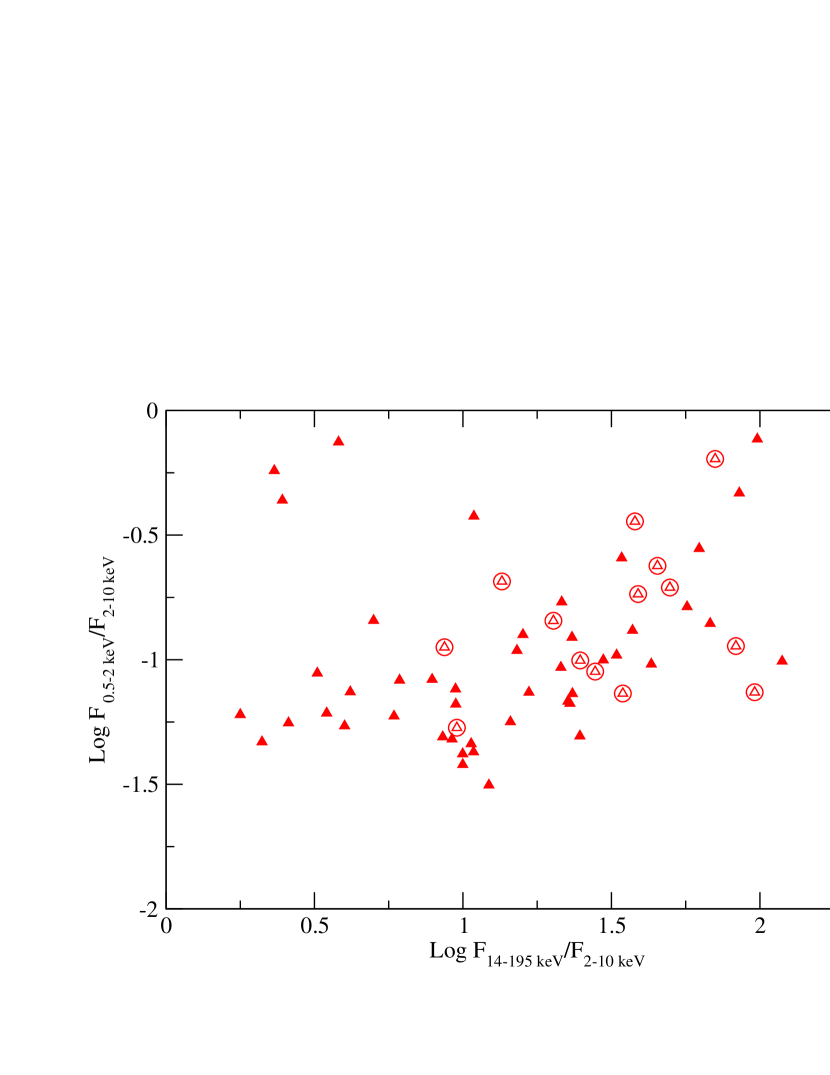
As we mentioned before, the fraction of CT AGN in deep hard X-ray surveys is (Bassani et al., 2013). This fraction of CT AGN is in agreement with the value derived from the northern Galactic cap of the 58-month BAT catalog, where they found that up to 15% of their sample could be CT (Vasudevan et al., 2013). Since we identified only 18 CT candidates in our sample, this suggests that there may be some heavily obscured Seyfert 2 galaxies that are unaccounted for. In order to have an estimate of the X-ray column density for the sources without published values (51 out of 157), we used a simple color-color diagram initially presented in Winter et al. (2008), and later in Winter et al. (2009). Figure 5 shows the soft/medium (0.5-2 keV flux/2-10 keV flux) and the hard/medium (14-195 keV flux/2-10 keV flux) ratios for the 51 Seyfert 2 galaxies without published X-ray column densities. Fluxes for the soft (0.5-2 keV) and medium (2-10 keV) X-ray were taken from the seven year Swift-XRT point source catalog (D’Elia et al., 2013). In the diagram we also show the position for the CT sources in our sample (open red triangles-circles). It is clear from this comparison that our CT sources are located in the same branch of heavily obscured sources which extends towards the upper right side of the diagram (see Figure 3 in Winter et al., 2009). We find that the vast majority of the CT sources have hard/medium flux ratios, 14-195 keV flux/2-10 keV flux 10; thus this is a simple approximation for identifying heavily obscured or CT candidates. We apply this criteria to identify heavily obscured sources from our sample of Seyfert 2 galaxies, in particular, those sources without published column densities. Overall, we find 26 sources with hard/medium ratios greater than 10, indicative of high column densities (see Table 6 for details). We performed a partial correlation analysis in our Seyfert 2 population after excluding the CT sources (Table 5) and our candidates of heavily obscured Seyfert 2 galaxies without published X-ray column densities (Table 6). We find that there is no statistically significant correlation between the 14-195 keV and FIR luminosities (70 and 160 ) in Seyfert 2 galaxies when the influence of distance is excluded (see Table3). These results suggest that Compton scattering in the BAT band is not responsible for the lack of a correlation between the hard X-ray and FIR luminosities.
| Name | Reference | |
|---|---|---|
| (1) | (2) | (3) |
| CGCG 420-015 | 1.46 | (1) |
| ESO 005-G004 | 1.01 | (2) |
| ESO 137-G034 | 1.5 | (3) |
| MCG-01-30-041 | 1.45 | (4) |
| Mrk 3 | 1.36 | (5) |
| Mrk 417 | 1.20 | (4) |
| NGC 424 | 1.00 | (6) |
| NGC 1365 | 4.00 | (7) |
| NGC 3079 | 5.40 | (6) |
| NGC 3281 | 2.00 | (8) |
| NGC 3393 | 4.50 | (6) |
| NGC 4939 | 10.00 | (9) |
| NGC 4941 | 1.32 | (4) |
| NGC 5728 | 1.39 | (10) |
| NGC 6240 | 1.83 | (6) |
| NGC 6552 | 1.00 | (11) |
| NGC 7582 | 1.10 | (6) |
| UGC 05881 | 2.45 | (4) |
Note. — Column 1: galaxy name. Column 2: X-ray absorbing column density. Column 3: references for the column density. (1) Severgnini et al. (2011); (2) Ueda et al. (2007); (3) Malizia et al. (2009); (4) Vasudevan et al. (2013); (5) Bianchi et al. (2005); (6) (Burlon et al., 2011); (7) Risaliti et al. (2009); (8) Vignali & Comastri (2002); (9) Maiolino et al. (1998); (10) Comastri et al. (2010); (11) Bassani et al. (1999)
On the other hand, if Seyfert 2 galaxies are intrinsically less luminous than Seyfert 1 galaxies, then the lack of a correlation suggests that the FIR-X-ray connection is luminosity dependent. In this scenario, low luminosity AGN show little or no relationship between the AGN and the FIR luminosity, because the latter is dominated by dust heated primarily by the stellar activity in the host galaxy (e.g., Rosario et al., 2012). At higher luminosities (where the AGN dominate), dust heated by the AGN becomes non-negligible, thereby, creating the correlation between the intrinsic power of the AGN and the FIR (e.g., Netzer, 2009; Rosario et al., 2012).
| Name | ||
|---|---|---|
| (1) | (2) | (3) |
| 2MASX J01064523+0638015 | 10.66 | 0.05 |
| 2MASX J01073963-1139117 | 22.57 | 0.07 |
| 2MASX J04234080+0408017 | 32.92 | 0.10 |
| 2MASX J06411806+3249313 | 10.86 | 0.04 |
| 2MASX J06561197-4919499 | 56.87 | 0.16 |
| 2MASX J07262635-3554214 | 21.36 | 0.09 |
| 2MASX J09360622-6548336 | 15.92 | 0.13 |
| 2MASX J20101740+4800214 | 24.76 | 0.05 |
| 2MFGC 02280 | 118.83 | 0.10 |
| CGCG 102-048 | 43.07 | 0.10 |
| CGCG 312-012 | 16.68 | 0.07 |
| ESO 244-IG030 | 21.50 | 0.17 |
| ESO 374-G044 | 14.45 | 0.06 |
| ESO 439-G009 | 34.23 | 0.26 |
| ESO 565-G019 | 23.37 | 0.07 |
| II Zw 083 | 15.20 | 0.11 |
| MCG-07-03-007 | 68.01 | 0.14 |
| MCG+02-21-013 | 29.70 | 0.10 |
| MCG+06-16-028 | 85.26 | 0.47 |
| MCG+06-49-019 | 10.88 | 0.38 |
| MCG+11-11-032 | 12.23 | 0.03 |
| NGC 1106 | 98.05 | 0.77 |
| NGC 1125 | 62.47 | 0.28 |
| SBS 0915+556 | 23.30 | 0.12 |
| UGC 01479 | 22.92 | 0.07 |
| VII Zw 073 | 37.26 | 0.13 |
Note. — Column 1: galaxy name. Column 2: the soft/medium (0.5-2 keV flux/2-10 keV flux). Column 3: the hard/medium (14-195 keV flux/2-10 keV flux). Fluxes for the soft (0.5-2 keV) and medium (2-10 keV) X-ray were taken from the seven year Swift-XRT point source catalog (D’Elia et al., 2013)
6 The Far-Infrared Colors of the BAT sample
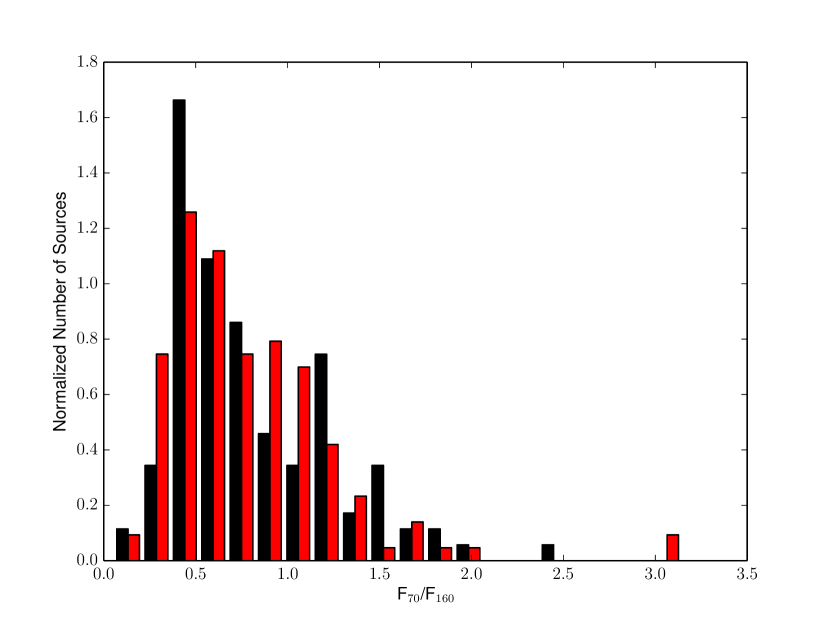
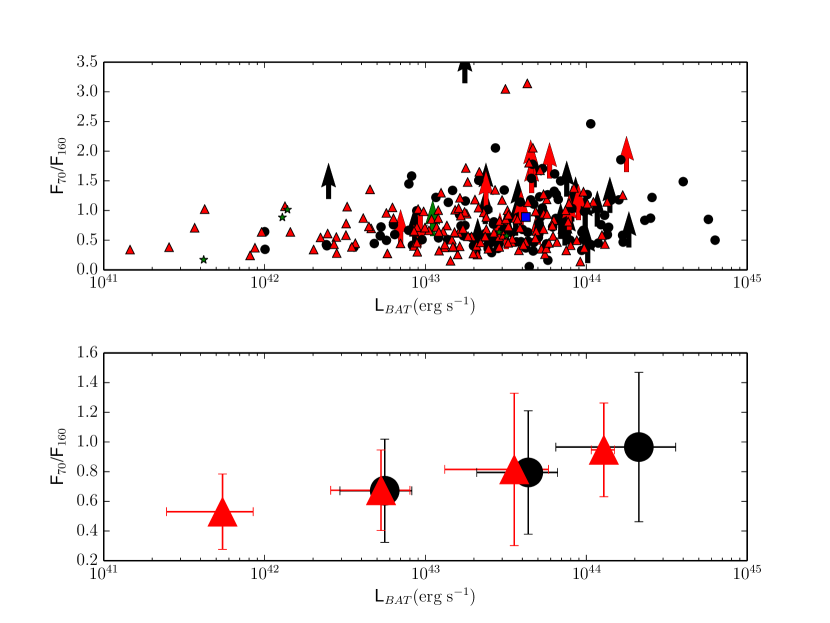
Typically, FIR emission from galaxies peakes between 100 - 160 . Thus, the F70/F100 versus F100/F160 can be used to trace the peak of the galaxy SED (e.g., Rémy-Ruyer et al., 2013). However, in the absence of 100 observations the F70/F160 ratio may still provide useful information regarding the peak of the FIR SED and the dust properties. Figure 6 shows the distribution of this ratios for between Seyfert 1 and Seyfert 2 galaxies in the BAT sample. The K-S test null probability is 53.5 which indicates that the two galaxy populations have similar FIR colors, in agreement with the statistical similarities between the monochromatic luminosities at 70 and 160 (see Table 2).
Figure 7 shows the F70/F160 ratio versus the intrinsic X-ray luminosity of the AGN. We find a trend of increasing F70/F160 with BAT luminosity. Our analysis reveals a weak but statistically significant correlation with a generalized Spearman rank-order correlation coefficient and probability (with censored data), , for Seyfert 1 galaxies and a similar correlation for Seyfert 2 galaxies with , . This result implies that there may be a dust grain distribution with a warm (nuclear) dust component, heated by the very energetic environment in the proximity of the AGN (with a strong contribution to the 70 continuum), and a colder dust component farther out in the outer regions of the AGN torus and/or the host galaxy (the primary contributor to the 160 continuum). In order to investigate the AGN contribution to the FIR colors, we compared our observed colors with predictions from three different torus models: the smooth, continuous torus from Fritz et al. (2006)666http://users.ugent.be/ jfritz/jfhp/TORUS.html and the clumpy torus models from Hönig & Kishimoto (2010)777http://www.sungrazer.org/CAT3D.html and Stalevski et al. (2012) (“smooth”, “two-phase” and “clumps-only”)888https://sites.google.com/site/skirtorus/home. We find that there is no region in parameter space (input parameters for the different models) that can reproduce F70/F160 ratios less than unity. In addition, the vast majority of the BAT AGN (74% of all the sources with detections in both FIR bands) have F70/F160 ratios less than unity.
All these models, on average, overpredict the F70/F160 ratios by at least a factor of 2-3 (Fritz et al., 2006; Hönig & Kishimoto, 2010) and as much as a factor of 20 (Fritz et al., 2006; Stalevski et al., 2012) (see Figure 8). Continuous models with a torus full-opening angle of (covering factor, Fritz et al., 2006) can reproduce the most extreme sources in our sample at the high end of the observed FIR color distribution with F70/F, namely Mrk 841, MCG-05-23-016 and ESO 103-035. Note that the observed BAT FIR SED is the combined effect from the AGN (non-thermal) and a stellar (thermal) radiation field. Therefore, it is not unexpected for the torus models to underpredict the observed FIR part of the SED without an extra stellar component (see discussion in Section 4). However, the weak but probably statistically significant correlation between the intrinsic power of the AGN and the FIR emission in Seyfert 1 galaxies suggests that there is a subset of the BAT AGN in which the FIR emission is dominated by the non-stellar contribution (AGN). This population includes AGN dominated sources with weak or no signatures of star formation at other wavelengths (e.g., Hönig et al., 2014). Therefore, the previous results suggest that current torus models may underpredict the intrinsic AGN emission at 160 , relative to the 70 , by having a steeper FIR SED.
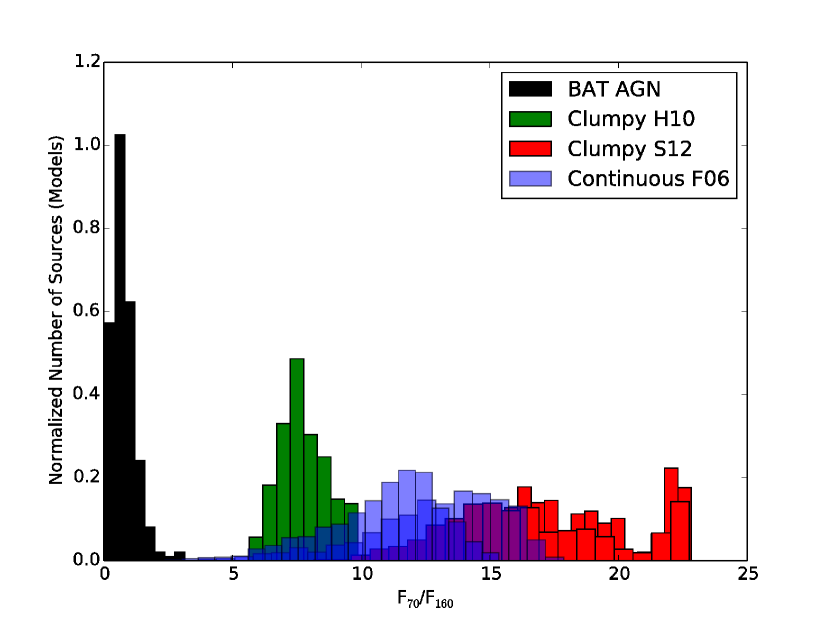
7 Comparison with Normal Galaxies
The F70/F160 ratio provides useful information when comparing with other samples of galaxies. Figure 9 shows the F70/F160 distribution between the BAT AGN, the Key Insights on Nearby Galaxies: a Far-Infrared Survey with Herschel (KINGFISH) sample of nearby galaxies (Dale et al., 2012) and the dwarf galaxy survey (DGS) (Rémy-Ruyer et al., 2013). The KINGFISH sample is an imaging and spectroscopic survey of 61 nearby (d 30 Mpc) galaxies draw mainly from the Spitzer Infrared Nearby Galaxies Survey (SINGS; see Kennicutt et al., 2003, for details). The KINGFISH sample covers a wide range of galaxy properties and local interstellar medium environments found in the nearby Universe. The Herschel DGS is a photometric and spectroscopic sample of dwarf galaxies in the local universe chosen to cover a wide range of physical conditions, including a wide range of metallicities (Madden et al., 2013).
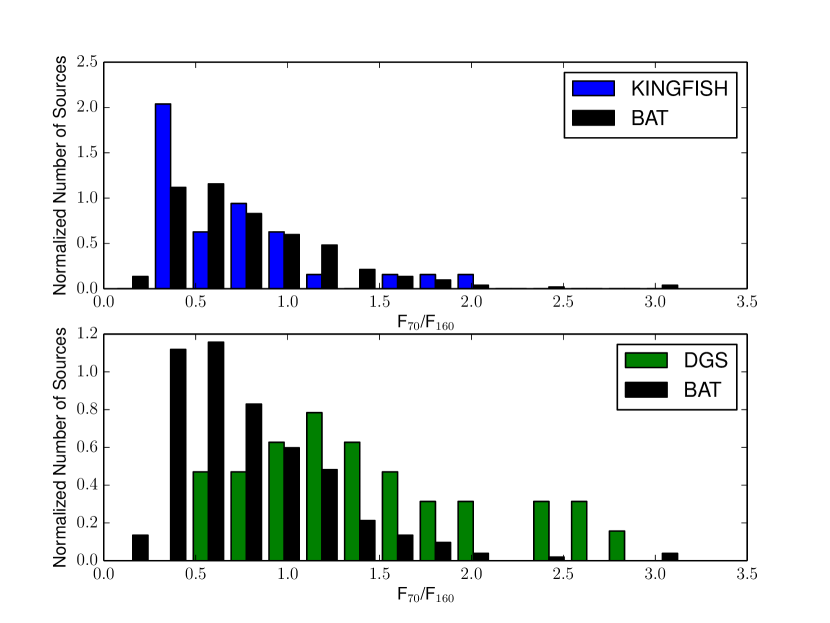
For the KINGFISH sample, we selected only the “normal” galaxies, e.g., the non-AGN galaxies as classified by their optical spectra (Moustakas et al., 2010). Conversely, for the comparison we included all BAT AGN. From Figure 9 it is clear that the BAT AGN and the KINGFISH normal galaxies span a similar range of values with a K-S null probability of 31, in other words, the BAT AGN FIR colors are statistically indistinguishibles from those in normal galaxies. On the other hand, the FIR colors for the BAT AGN are statistically different than those in the DGS sample with a K-S test null probability of 0.0 . The majority of the BAT AGN and KINGFISH galaxies have F70 F160 corresponding to colder dust, whereas most of the dwarf galaxies peak at shorter wavelengths, F70/F, suggesting a warmer dust due to the harder radiation field illuminating the environment surrounding young stars. Note that F70/F160 is also sensitive to metallicity, in that the lower metallicity galaxies have warmer dust than that found in their metal-rich counterparts (Rémy-Ruyer et al., 2013).
8 Conclusions
We present FIR flux densities and maps for 313 hard X-ray selected AGN from the low-redshift () 58-month Swift-BAT survey in two PACS bands at 70 and 160 . Of the 313 sources, 94% and 83% are detected in the FIR by PACS at 70 and 160 , respectively. From our analysis we find the following:
(1) Using the K-S test the FIR luminosity distributions at 70 and 160 for the Seyfert 1 and Seyfert 2 galaxies are indistinguishable from one another. This result suggests that the FIR emission is isotropic, e.g., independent of orientation. We propose two different interpretations for the isotropic nature of the FIR emission: (i) star formation, which is isotropic, and/or (ii) some AGN torus models predict isotropy at FIR wavelengths. Regarding the former scenario, if star formation dominates the FIR emission, then it has to happen in a very compact, nuclear region, suggesting a connection between the AGN and the nuclear cold molecular gas (see Mushotzky et al., 2014). In the latter scenario, torus models predict a similar shape for the FIR part of the SED for both types of Seyferts (e.g., Kennicutt et al., 2003; Stalevski et al., 2012). However, some torus models predict an angle dependence on the FIR luminosity with Seyfert 1 galaxies having higher luminosities than Seyfert 2 galaxies. For these models, star formation would also be needed (e.g., Fritz et al., 2006)
Using the two-sample test for censored data, the 160 luminosity distributions between Seyfert galaxies may be distinguishable at a weak but possibly statistically significant level. By including the non-detections, the Seyfert 2 galaxies are found to have a very slightly higher mean luminosity than the Seyfert 1 galaxies. If the FIR emission is a good probe of star formation, then this result suggests that Seyfert 2 galaxies have a slightly higher SFR than Seyfert 1 galaxies, which could imply a time-dependent evolutionary scenario, where the AGN are more obscured when the SFRs are at their higher values (see discussion in Section 5).
(2) A K-S test on the present data shows that the 14-195 keV luminosity distributions are statistically different between Seyfert 1 (unabsorbed) and Seyfert 2 (absorbed) galaxies. Our analysis suggests that the statistical differences between AGN types are fundamental, with absorbed AGN intrinsically less luminous than unabsorbed AGN. This scenario is supported by the difference in the luminosity function between the two types of Seyferts for the BAT sample, with absorbed AGN having, on average, lower luminosities than unabsorbed AGN (e.g., Cowie et al., 2003; Steffen et al., 2003; Ueda et al., 2003; Barger et al., 2005; La Franca et al., 2005; Hasinger et al., 2005; Burlon et al., 2011). Overall, this is a challenge for the basic predictions from the unified model of AGN, where the intrinsic AGN luminosity should be independent of obscuration. Thus, one must consider a luminosity-dependent unified model of AGN (e.g., Barger et al., 2005).
(3) Using a non-parametric test for partial correlation with censored data, we find a statistically significant correlation between the AGN intrinsic power (BAT luminosity) and the FIR emission at 70 and 160 in Seyfert 1 galaxies. We find a better correlation between the BAT and PACS luminosities at 70 than at 160 . The correlation is also stronger for the most X-ray luminous objects. The observed correlations suggest two possible scenarios: (i) if we assume that the FIR luminosity is a good tracer of star formation, then there is a connection between star formation and the AGN at sub-kiloparsec scales, and/or (ii) dust heated by the AGN has a statistically significant contribution to the FIR emission. Regarding the former scenario, and given the fact that the majority of the BAT sources have their FIR fluxes dominated by a point source located at the nucleus, one needs to consider that star formation has to happen in a very compact, nuclear region (Mushotzky et al., 2014). In the latter, SFR indicators that rely on FIR emission, either through the individual infrared bands (Calzetti et al., 2010) or the total FIR emission (8–1000 , Kennicutt, 1998), need to consider the AGN contribution in their predictions. However, all torus models studied in the present work underpredict the amount of cold dust (from the outer regions of the torus) needed to match the observations; thus, a stellar component may still be required.
(4) A non-parametric test for partial correlation with censored data reveals that there is no statistically significant correlation between the 14-195 keV and FIR luminosities in Seyfert 2 galaxies when the influence of the distance is excluded. The results presented in this paper support a scenario in which Seyfert 2 galaxies are intrinsically less luminous than Seyfert 1 galaxies suggesting that the FIR-X-ray connection is luminosity dependent. In other words, in low luminosity AGN (Seyfert 2 galaxies), the FIR may be dominated by dust heated primarily by the stellar activity in the host galaxy (e.g., Rosario et al., 2012), while at higher luminosities (Seyfert 1 galaxies) the contribution from dust heated by the AGN overwhelms the star formation contribution, thereby, creating the correlation between the intrinsic power of the AGN and the FIR.
(5) Using a K-S test, the distributions of the F70/F160 ratios for the Seyfert 1 and 2 galaxies are indistinguishable from one another. They are also indistinguishable from those of normal star forming galaxies. In general, we find that the vast majority of the BAT AGN (74% of all sources with a detection in both FIR bands) have F70/F160 ratios less than unity. Assuming that the FIR is dominated by star formation, these results are in agreement with the isotropic nature of the star formation emission. However, one must consider that the weak but statistically significant correlation between the intrinsic power of the AGN and the FIR emission suggests that there must be an underlying population of BAT AGN in which the FIR emission is dominated by the non-stellar contribution (the AGN torus). This population includes AGN dominated sources with weak or no signatures of star formation at other wavelengths, e.g., Mrk 3 (e.g., Sales et al., 2014). Nonetheless, when comparing with predictions from different torus models, we find that there is no region in parameter space (input parameters for the different models) that can reproduce F70/F160 ratios less than unity. All these models, on average, overpredict the F70/F160 ratios by at least a factor of 2-3 (Fritz et al., 2006; Hönig & Kishimoto, 2010) and by as much as a factor of 20 (Fritz et al., 2006; Stalevski et al., 2012). Continuous models with a torus full-opening angle of (covering factor, Fritz et al., 2006) can only reproduce the most extreme sources at the high end of the observed FIR colors distribution with F70/F, namely Mrk 841, MCG-05-23-016 and ESO 103-035. Thus, current torus models may underpredict the AGN emission at 160 (colder dust) relative to 70 with a steeper FIR SED.
(6) Using a Spearman rank-order analysis, the 14-195 keV luminosities for the Seyfert 1 and 2 galaxies are weakly statistically correlated with the F70/F160 ratios. This result suggests two possible interpretations: (i) a time-evolutionary sequence, as discussed in Section 5, where SFRs are higher in the more X-ray luminous sources, producing a trend of increasing AGN luminosity and FIR temperature, and/or (ii) the existence of a dust grain distribution with a warm (nuclear) dust component, heated by the very energetic environment in the proximity of the AGN (with a strong contribution to the 70 continuum), and a colder dust component farther out in the outer regions of the AGN torus and/or the host galaxy (the primary contribution to the 160 continuum).
Appendix A Herschel PACS images
Figure 10 shows the PACS Scanamorphos images for the BAT sample. The images are displayed with an inverse hyperbolic sine scaling (Lupton et al., 1999). All the images are presented in their native resolution and pixel size, 1.4 and 2.85″/pixel at 70 and 160µm, respectively. The beam size at each wavelength is indicated by a black filled circle at the bottom left of each panel. The angular size of each panel is 2.2′2.2′. North is up, and East is left for all the images. Figures 10.1–1.105 are available in the online version of the Journal.
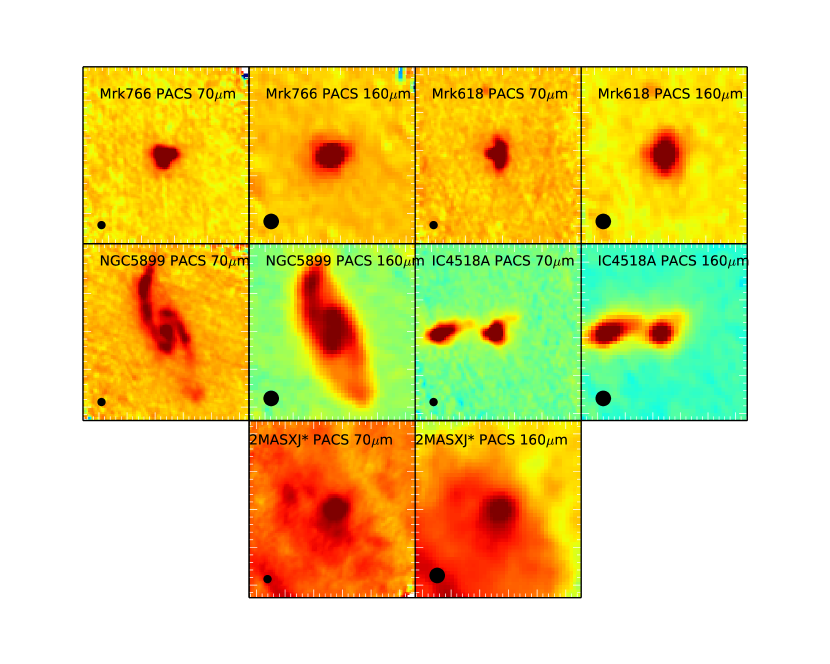
References
- Akritas & Siebert (1996) Akritas, M. G., & Siebert, J. 1996, MNRAS, 278, 919
- Antonucci (1993) Antonucci, R. 1993, ARA&A, 31, 473
- Barger et al. (2005) Barger, A. J., Cowie, L. L., Mushotzky, R. F., Yang, Y., Wang, W.-H., Steffen, A. T., & Capak, P. 2005, AJ, 129, 578
- Bassani et al. (1999) Bassani, L., Dadina, M., Maiolino, R., Salvati, M., Risaliti, G., della Ceca, R., Matt, G., & Zamorani, G. 1999, ApJS, 121, 473
- Bassani et al. (2013) Bassani, L., Molina, M., Malizia, A., Panessa, F., Landi, R., Bazzano, A., Ubertini, P., Bird, A. J., & Stephen, J. B. 2013, ArXiv e-prints
- Baumgartner et al. (2013) Baumgartner, W. H., Tueller, J., Markwardt, C. B., Skinner, G. K., Barthelmy, S., Mushotzky, R. F., Evans, P. A., & Gehrels, N. 2013, ApJS, 207, 19
- Beckert & Duschl (2004) Beckert, T., & Duschl, W. J. 2004, A&A, 426, 445
- Bevington & Robinson (2003) Bevington, P. R., & Robinson, D. K. 2003, Data reduction and error analysis for the physical sciences
- Bianchi et al. (2005) Bianchi, S., Miniutti, G., Fabian, A. C., & Iwasawa, K. 2005, MNRAS, 360, 380
- Burlon et al. (2011) Burlon, D., Ajello, M., Greiner, J., Comastri, A., Merloni, A., & Gehrels, N. 2011, ApJ, 728, 58
- Calzetti et al. (2010) Calzetti, D., Wu, S.-Y., Hong, S., Kennicutt, R. C., Lee, J. C., Dale, D. A., Engelbracht, C. W., van Zee, L., Draine, B. T., Hao, C.-N., Gordon, K. D., Moustakas, J., Murphy, E. J., Regan, M., Begum, A., Block, M., Dalcanton, J., Funes, J., Gil de Paz, A., Johnson, B., Sakai, S., Skillman, E., Walter, F., Weisz, D., Williams, B., & Wu, Y. 2010, ApJ, 714, 1256
- Casey (2012) Casey, C. M. 2012, MNRAS, 425, 3094
- Comastri et al. (2010) Comastri, A., Iwasawa, K., Gilli, R., Vignali, C., Ranalli, P., Matt, G., & Fiore, F. 2010, ApJ, 717, 787
- Cowie et al. (2003) Cowie, L. L., Barger, A. J., Bautz, M. W., Brandt, W. N., & Garmire, G. P. 2003, ApJ, 584, L57
- Dale et al. (2012) Dale, D. A., Aniano, G., Engelbracht, C. W., Hinz, J. L., Krause, O., Montiel, E. J., Roussel, H., Appleton, P. N., Armus, L., Beirão, P., Bolatto, A. D., Brandl, B. R., Calzetti, D., Crocker, A. F., Croxall, K. V., Draine, B. T., Galametz, M., Gordon, K. D., Groves, B. A., Hao, C.-N., Helou, G., Hunt, L. K., Johnson, B. D., Kennicutt, R. C., Koda, J., Leroy, A. K., Li, Y., Meidt, S. E., Miller, A. E., Murphy, E. J., Rahman, N., Rix, H.-W., Sandstrom, K. M., Sauvage, M., Schinnerer, E., Skibba, R. A., Smith, J.-D. T., Tabatabaei, F. S., Walter, F., Wilson, C. D., Wolfire, M. G., & Zibetti, S. 2012, ApJ, 745, 95
- Dale & Helou (2002) Dale, D. A., & Helou, G. 2002, ApJ, 576, 159
- Dale et al. (2001) Dale, D. A., Helou, G., Contursi, A., Silbermann, N. A., & Kolhatkar, S. 2001, ApJ, 549, 215
- D’Elia et al. (2013) D’Elia, V., Perri, M., Puccetti, S., Capalbi, M., Giommi, P., Burrows, D. N., Campana, S., Tagliaferri, G., Cusumano, G., Evans, P., Gehrels, N., Kennea, J., Moretti, A., Nousek, J. A., Osborne, J. P., Romano, P., & Stratta, G. 2013, A&A, 551, A142
- Draine & Li (2007) Draine, B. T., & Li, A. 2007, ApJ, 657, 810
- Elitzur & Shlosman (2006) Elitzur, M., & Shlosman, I. 2006, ApJ, 648, L101
- Fritz et al. (2006) Fritz, J., Franceschini, A., & Hatziminaoglou, E. 2006, MNRAS, 366, 767
- Gandhi et al. (2009) Gandhi, P., Horst, H., Smette, A., Hönig, S., Comastri, A., Gilli, R., Vignali, C., & Duschl, W. 2009, A&A, 502, 457
- Gordon et al. (2008) Gordon, K. D., Engelbracht, C. W., Rieke, G. H., Misselt, K. A., Smith, J.-D. T., & Kennicutt, Jr., R. C. 2008, ApJ, 682, 336
- Hasinger et al. (2005) Hasinger, G., Miyaji, T., & Schmidt, M. 2005, A&A, 441, 417
- Helou & Walker (1988) Helou, G., & Walker, D. W., eds. 1988, Infrared astronomical satellite (IRAS) catalogs and atlases. Volume 7: The small scale structure catalog, Vol. 7
- Hönig et al. (2014) Hönig, S. F., Gandhi, P., Asmus, D., Mushotzky, R. F., Antonucci, R., Ueda, Y., & Ichikawa, K. 2014, MNRAS, 438, 647
- Hönig & Kishimoto (2010) Hönig, S. F., & Kishimoto, M. 2010, A&A, 523, A27
- Ichikawa et al. (2012) Ichikawa, K., Ueda, Y., Terashima, Y., Oyabu, S., Gandhi, P., Matsuta, K., & Nakagawa, T. 2012, ApJ, 754, 45
- Ikeda et al. (2009) Ikeda, S., Awaki, H., & Terashima, Y. 2009, ApJ, 692, 608
- Isobe et al. (1990) Isobe, T., Feigelson, E. D., Akritas, M. G., & Babu, G. J. 1990, ApJ, 364, 104
- Isobe et al. (1986) Isobe, T., Feigelson, E. D., & Nelson, P. I. 1986, ApJ, 306, 490
- Kaplan & Meier (1958) Kaplan, E. L., & Meier, P. 1958, Journal of the American Statistical Association, 53, 457
- Kennicutt & Evans (2012) Kennicutt, R. C., & Evans, N. J. 2012, ARA&A, 50, 531
- Kennicutt (1998) Kennicutt, Jr., R. C. 1998, ARA&A, 36, 189
- Kennicutt et al. (2003) Kennicutt, Jr., R. C., Armus, L., Bendo, G., Calzetti, D., Dale, D. A., Draine, B. T., Engelbracht, C. W., Gordon, K. D., Grauer, A. D., Helou, G., Hollenbach, D. J., Jarrett, T. H., Kewley, L. J., Leitherer, C., Li, A., Malhotra, S., Regan, M. W., Rieke, G. H., Rieke, M. J., Roussel, H., Smith, J.-D. T., Thornley, M. D., & Walter, F. 2003, PASP, 115, 928
- Krolik & Begelman (1988) Krolik, J. H., & Begelman, M. C. 1988, ApJ, 329, 702
- La Franca et al. (2005) La Franca, F., Fiore, F., Comastri, A., Perola, G. C., Sacchi, N., Brusa, M., Cocchia, F., Feruglio, C., Matt, G., Vignali, C., Carangelo, N., Ciliegi, P., Lamastra, A., Maiolino, R., Mignoli, M., Molendi, S., & Puccetti, S. 2005, ApJ, 635, 864
- Lavalley et al. (1992) Lavalley, M., Isobe, T., & Feigelson, E. 1992, in Astronomical Society of the Pacific Conference Series, Vol. 25, Astronomical Data Analysis Software and Systems I, ed. D. M. Worrall, C. Biemesderfer, & J. Barnes, 245
- Lawrence (1991) Lawrence, A. 1991, MNRAS, 252, 586
- Lebouteiller et al. (2011) Lebouteiller, V., Barry, D. J., Spoon, H. W. W., Bernard-Salas, J., Sloan, G. C., Houck, J. R., & Weedman, D. W. 2011, ApJS, 196, 8
- Lupton et al. (1999) Lupton, R. H., Gunn, J. E., & Szalay, A. S. 1999, AJ, 118, 1406
- Madden et al. (2013) Madden, S. C., Rémy-Ruyer, A., Galametz, M., Cormier, D., Lebouteiller, V., Galliano, F., Hony, S., Bendo, G. J., Smith, M. W. L., Pohlen, M., Roussel, H., Sauvage, M., Wu, R., Sturm, E., Poglitsch, A., Contursi, A., Doublier, V., Baes, M., Barlow, M. J., Boselli, A., Boquien, M., Carlson, L. R., Ciesla, L., Cooray, A., Cortese, L., de Looze, I., Irwin, J. A., Isaak, K., Kamenetzky, J., Karczewski, O. Ł., Lu, N., MacHattie, J. A., O”Halloran, B., Parkin, T. J., Rangwala, N., Schirm, M. R. P., Schulz, B., Spinoglio, L., Vaccari, M., Wilson, C. D., & Wozniak, H. 2013, PASP, 125, 600
- Maiolino et al. (1998) Maiolino, R., Salvati, M., Bassani, L., Dadina, M., della Ceca, R., Matt, G., Risaliti, G., & Zamorani, G. 1998, A&A, 338, 781
- Malizia et al. (2009) Malizia, A., Bassani, L., Panessa, F., de Rosa, A., & Bird, A. J. 2009, MNRAS, 394, L121
- Matsuta et al. (2012) Matsuta, K., Gandhi, P., Dotani, T., Nakagawa, T., Isobe, N., Ueda, Y., Ichikawa, K., Terashima, Y., Oyabu, S., Yamamura, I., & Stawarz, Ł. 2012, ApJ, 753, 104
- Meléndez et al. (2008a) Meléndez, M., Kraemer, S. B., Armentrout, B. K., Deo, R. P., Crenshaw, D. M., Schmitt, H. R., Mushotzky, R. F., Tueller, J., Markwardt, C. B., & Winter, L. 2008a, ApJ, 682, 94
- Meléndez et al. (2008b) Meléndez, M., Kraemer, S. B., Schmitt, H. R., Crenshaw, D. M., Deo, R. P., Mushotzky, R. F., & Bruhweiler, F. C. 2008b, ApJ, 689, 95
- Mor et al. (2009) Mor, R., Netzer, H., & Elitzur, M. 2009, ApJ, 705, 298
- Moshir et al. (1990) Moshir, M., Kopan, G., Conrow, T., McCallon, H., Hacking, P., Gregorich, D., Rohrbach, G., Melnyk, M., Rice, W., Fullmer, L., White, J., & Chester, T. 1990, in Bulletin of the American Astronomical Society, Vol. 22, Bulletin of the American Astronomical Society, 1325
- Moustakas et al. (2010) Moustakas, J., Kennicutt, Jr., R. C., Tremonti, C. A., Dale, D. A., Smith, J.-D. T., & Calzetti, D. 2010, ApJS, 190, 233
- Mullaney et al. (2011) Mullaney, J. R., Alexander, D. M., Goulding, A. D., & Hickox, R. C. 2011, MNRAS, 414, 1082
- Murakami et al. (2007) Murakami, H., Baba, H., Barthel, P., Clements, D. L., Cohen, M., Doi, Y., Enya, K., Figueredo, E., Fujishiro, N., Fujiwara, H., Fujiwara, M., Garcia-Lario, P., Goto, T., Hasegawa, S., Hibi, Y., Hirao, T., Hiromoto, N., Hong, S. S., Imai, K., Ishigaki, M., Ishiguro, M., Ishihara, D., Ita, Y., Jeong, W.-S., Jeong, K. S., Kaneda, H., Kataza, H., Kawada, M., Kawai, T., Kawamura, A., Kessler, M. F., Kester, D., Kii, T., Kim, D. C., Kim, W., Kobayashi, H., Koo, B. C., Kwon, S. M., Lee, H. M., Lorente, R., Makiuti, S., Matsuhara, H., Matsumoto, T., Matsuo, H., Matsuura, S., Müller, T. G., Murakami, N., Nagata, H., Nakagawa, T., Naoi, T., Narita, M., Noda, M., Oh, S. H., Ohnishi, A., Ohyama, Y., Okada, Y., Okuda, H., Oliver, S., Onaka, T., Ootsubo, T., Oyabu, S., Pak, S., Park, Y.-S., Pearson, C. P., Rowan-Robinson, M., Saito, T., Sakon, I., Salama, A., Sato, S., Savage, R. S., Serjeant, S., Shibai, H., Shirahata, M., Sohn, J., Suzuki, T., Takagi, T., Takahashi, H., Tanabé, T., Takeuchi, T. T., Takita, S., Thomson, M., Uemizu, K., Ueno, M., Usui, F., Verdugo, E., Wada, T., Wang, L., Watabe, T., Watarai, H., White, G. J., Yamamura, I., Yamauchi, C., & Yasuda, A. 2007, PASJ, 59, 369
- Murphy & Yaqoob (2009) Murphy, K. D., & Yaqoob, T. 2009, MNRAS, 397, 1549
- Mushotzky et al. (2014) Mushotzky, R. F., Shimizu, T. T., Meléndez, M., & Koss, M. 2014, ApJ, 781, L34
- Nenkova et al. (2008a) Nenkova, M., Sirocky, M. M., Ivezić, Ž., & Elitzur, M. 2008a, ApJ, 685, 147
- Nenkova et al. (2008b) Nenkova, M., Sirocky, M. M., Nikutta, R., Ivezić, Ž., & Elitzur, M. 2008b, ApJ, 685, 160
- Netzer (2009) Netzer, H. 2009, MNRAS, 399, 1907
- Neugebauer et al. (1984) Neugebauer, G., Habing, H. J., van Duinen, R., Aumann, H. H., Baud, B., Beichman, C. A., Beintema, D. A., Boggess, N., Clegg, P. E., de Jong, T., Emerson, J. P., Gautier, T. N., Gillett, F. C., Harris, S., Hauser, M. G., Houck, J. R., Jennings, R. E., Low, F. J., Marsden, P. L., Miley, G., Olnon, F. M., Pottasch, S. R., Raimond, E., Rowan-Robinson, M., Soifer, B. T., Walker, R. G., Wesselius, P. R., & Young, E. 1984, ApJ, 278, L1
- Ott (2010) Ott, S. 2010, in Astronomical Society of the Pacific Conference Series, Vol. 434, Astronomical Data Analysis Software and Systems XIX, ed. Y. Mizumoto, K.-I. Morita, & M. Ohishi, 139
- Pilbratt et al. (2010) Pilbratt, G. L., Riedinger, J. R., Passvogel, T., Crone, G., Doyle, D., Gageur, U., Heras, A. M., Jewell, C., Metcalfe, L., Ott, S., & Schmidt, M. 2010, A&A, 518, L1
- Planck Collaboration et al. (2011) Planck Collaboration, Ade, P. A. R., Aghanim, N., Arnaud, M., Ashdown, M., Aumont, J., Baccigalupi, C., Baker, M., Balbi, A., Banday, A. J., & et al. 2011, A&A, 536, A1
- Poglitsch et al. (2010) Poglitsch, A., Waelkens, C., Geis, N., Feuchtgruber, H., Vandenbussche, B., Rodriguez, L., Krause, O., Renotte, E., van Hoof, C., Saraceno, P., Cepa, J., Kerschbaum, F., Agnèse, P., Ali, B., Altieri, B., Andreani, P., Augueres, J.-L., Balog, Z., Barl, L., Bauer, O. H., Belbachir, N., Benedettini, M., Billot, N., Boulade, O., Bischof, H., Blommaert, J., Callut, E., Cara, C., Cerulli, R., Cesarsky, D., Contursi, A., Creten, Y., De Meester, W., Doublier, V., Doumayrou, E., Duband, L., Exter, K., Genzel, R., Gillis, J.-M., Grözinger, U., Henning, T., Herreros, J., Huygen, R., Inguscio, M., Jakob, G., Jamar, C., Jean, C., de Jong, J., Katterloher, R., Kiss, C., Klaas, U., Lemke, D., Lutz, D., Madden, S., Marquet, B., Martignac, J., Mazy, A., Merken, P., Montfort, F., Morbidelli, L., Müller, T., Nielbock, M., Okumura, K., Orfei, R., Ottensamer, R., Pezzuto, S., Popesso, P., Putzeys, J., Regibo, S., Reveret, V., Royer, P., Sauvage, M., Schreiber, J., Stegmaier, J., Schmitt, D., Schubert, J., Sturm, E., Thiel, M., Tofani, G., Vavrek, R., Wetzstein, M., Wieprecht, E., & Wiezorrek, E. 2010, A&A, 518, L2
- Press et al. (1992) Press, W. H., Teukolsky, S. A., Vetterling, W. T., & Flannery, B. P. 1992, Numerical recipes in FORTRAN. The art of scientific computing
- Rémy-Ruyer et al. (2013) Rémy-Ruyer, A., Madden, S. C., Galliano, F., Hony, S., Sauvage, M., Bendo, G. J., Roussel, H., Pohlen, M., Smith, M. W. L., Galametz, M., Cormier, D., Lebouteiller, V., Wu, R., Baes, M., Barlow, M. J., Boquien, M., Boselli, A., Ciesla, L., De Looze, I., Karczewski, O. Ł., Panuzzo, P., Spinoglio, L., Vaccari, M., & Wilson, C. D. 2013, A&A, 557, A95
- Rice et al. (1988) Rice, W., Lonsdale, C. J., Soifer, B. T., Neugebauer, G., Kopan, E. L., Lloyd, L. A., de Jong, T., & Habing, H. J. 1988, ApJS, 68, 91
- Risaliti et al. (2009) Risaliti, G., Braito, V., Laparola, V., Bianchi, S., Elvis, M., Fabbiano, G., Maiolino, R., Matt, G., Reeves, J., Salvati, M., & Wang, J. 2009, ApJ, 705, L1
- Rosario et al. (2012) Rosario, D. J., Santini, P., Lutz, D., Shao, L., Maiolino, R., Alexander, D. M., Altieri, B., Andreani, P., Aussel, H., Bauer, F. E., Berta, S., Bongiovanni, A., Brandt, W. N., Brusa, M., Cepa, J., Cimatti, A., Cox, T. J., Daddi, E., Elbaz, D., Fontana, A., Förster Schreiber, N. M., Genzel, R., Grazian, A., Le Floch, E., Magnelli, B., Mainieri, V., Netzer, H., Nordon, R., Pérez Garcia, I., Poglitsch, A., Popesso, P., Pozzi, F., Riguccini, L., Rodighiero, G., Salvato, M., Sanchez-Portal, M., Sturm, E., Tacconi, L. J., Valtchanov, I., & Wuyts, S. 2012, A&A, 545, A45
- Roussel (2013) Roussel, H. 2013, PASP, 125, 1126
- Sales et al. (2014) Sales, D. A., Ruschel-Dutra, D., Pastoriza, M. G., Riffel, R., & Winge, C. 2014, MNRAS, 441, 630
- Schartmann et al. (2008) Schartmann, M., Meisenheimer, K., Camenzind, M., Wolf, S., Tristram, K. R. W., & Henning, T. 2008, A&A, 482, 67
- Severgnini et al. (2011) Severgnini, P., Caccianiga, A., Della Ceca, R., Braito, V., Vignali, C., La Parola, V., & Moretti, A. 2011, A&A, 525, A38
- Skrutskie et al. (2006) Skrutskie, M. F., Cutri, R. M., Stiening, R., Weinberg, M. D., Schneider, S., Carpenter, J. M., Beichman, C., Capps, R., Chester, T., Elias, J., Huchra, J., Liebert, J., Lonsdale, C., Monet, D. G., Price, S., Seitzer, P., Jarrett, T., Kirkpatrick, J. D., Gizis, J. E., Howard, E., Evans, T., Fowler, J., Fullmer, L., Hurt, R., Light, R., Kopan, E. L., Marsh, K. A., McCallon, H. L., Tam, R., Van Dyk, S., & Wheelock, S. 2006, AJ, 131, 1163
- Stalevski et al. (2012) Stalevski, M., Fritz, J., Baes, M., Nakos, T., & Popović, L. Č. 2012, MNRAS, 420, 2756
- Steffen et al. (2003) Steffen, A. T., Barger, A. J., Cowie, L. L., Mushotzky, R. F., & Yang, Y. 2003, ApJ, 596, L23
- Tueller et al. (2008) Tueller, J., Mushotzky, R. F., Barthelmy, S., Cannizzo, J. K., Gehrels, N., Markwardt, C. B., Skinner, G. K., & Winter, L. M. 2008, ApJ, 681, 113
- Tully (1988) Tully, R. B. 1988, Nearby galaxies catalog
- Tully et al. (2009) Tully, R. B., Rizzi, L., Shaya, E. J., Courtois, H. M., Makarov, D. I., & Jacobs, B. A. 2009, AJ, 138, 323
- Ueda et al. (2003) Ueda, Y., Akiyama, M., Ohta, K., & Miyaji, T. 2003, ApJ, 598, 886
- Ueda et al. (2007) Ueda, Y., Eguchi, S., Terashima, Y., Mushotzky, R., Tueller, J., Markwardt, C., Gehrels, N., Hashimoto, Y., & Potter, S. 2007, ApJ, 664, L79
- Vasudevan et al. (2013) Vasudevan, R. V., Brandt, W. N., Mushotzky, R. F., Winter, L. M., Baumgartner, W. H., Shimizu, T. T., Schneider, D. P., & Nousek, J. 2013, ApJ, 763, 111
- Véron-Cetty & Véron (2010) Véron-Cetty, M.-P., & Véron, P. 2010, A&A, 518, A10
- Vignali & Comastri (2002) Vignali, C., & Comastri, A. 2002, A&A, 381, 834
- Weaver et al. (2010) Weaver, K. A., Meléndez, M., Mushotzky, R. F., Kraemer, S., Engle, K., Malumuth, E., Tueller, J., Markwardt, C., Berghea, C. T., Dudik, R. P., Winter, L. M., & Armus, L. 2010, ApJ, 716, 1151
- Werner et al. (2004) Werner, M. W., Roellig, T. L., Low, F. J., Rieke, G. H., Rieke, M., Hoffmann, W. F., Young, E., Houck, J. R., Brandl, B., Fazio, G. G., Hora, J. L., Gehrz, R. D., Helou, G., Soifer, B. T., Stauffer, J., Keene, J., Eisenhardt, P., Gallagher, D., Gautier, T. N., Irace, W., Lawrence, C. R., Simmons, L., Van Cleve, J. E., Jura, M., Wright, E. L., & Cruikshank, D. P. 2004, ApJS, 154, 1
- Winter et al. (2010) Winter, L. M., Lewis, K. T., Koss, M., Veilleux, S., Keeney, B., & Mushotzky, R. F. 2010, ApJ, 710, 503
- Winter et al. (2009) Winter, L. M., Mushotzky, R. F., Reynolds, C. S., & Tueller, J. 2009, ApJ, 690, 1322
- Winter et al. (2008) Winter, L. M., Mushotzky, R. F., Tueller, J., & Markwardt, C. 2008, ApJ, 674, 686
- Winter et al. (2012) Winter, L. M., Veilleux, S., McKernan, B., & Kallman, T. R. 2012, ApJ, 745, 107
- Wright et al. (2010) Wright, E. L., Eisenhardt, P. R. M., Mainzer, A. K., Ressler, M. E., Cutri, R. M., Jarrett, T., Kirkpatrick, J. D., Padgett, D., McMillan, R. S., Skrutskie, M., Stanford, S. A., Cohen, M., Walker, R. G., Mather, J. C., Leisawitz, D., Gautier, III, T. N., McLean, I., Benford, D., Lonsdale, C. J., Blain, A., Mendez, B., Irace, W. R., Duval, V., Liu, F., Royer, D., Heinrichsen, I., Howard, J., Shannon, M., Kendall, M., Walsh, A. L., Larsen, M., Cardon, J. G., Schick, S., Schwalm, M., Abid, M., Fabinsky, B., Naes, L., & Tsai, C.-W. 2010, AJ, 140, 1868