Benford Analysis: A useful paradigm for spectroscopic analysis
Abstract
Benford’s law is a statistical inference to predict the frequency of significant digits in naturally occurring numerical databases. In such databases this law predicts a higher occurrence of the digit 1 in the most significant place and decreasing occurrences to other larger digits. Although counter-intuitive at first sight, Benford’s law has seen applications in a wide variety of fields like physics, earth-science, biology, finance etc. In this work, we have explored the use of Benford’s law for various spectroscopic applications. Although, we use NMR signals as our databases, the methods described here may also be extended to other spectroscopic techniques. In particular, with the help of Benford analysis, we demonstrate the detection of weak NMR signals and spectral corrections. We also explore a potential application of Benford analysis in the image-processing of MRI data.
pacs:
03.67.Lx, 03.67.Ac, 03.65.Wj, 03.65.TaI Introduction :
Benford’s law is an empirical law, which applies to many of the naturally occurring numerical datasets benford . It predicts the frequency of various digits in the most significant place in such datasets. It is natural to expect that the frequency of digits 1 to 9 in the most significant place is nearly uniform, unless the entries in the dataset are biased to one or more digits due to a constrained range of the entries. For example, in a typical NMR spectrum normalized between 0 and 1, one might expect a uniform distribution of digits 1 to 9 in the most significant place. On the contrary, the Benford’s law predicts a higher occurrence of the digit ‘1’ in the most significant place, compared to other higher digits, whose occurrence decreases progressively. This non-uniform occurrence of digits in the most significant place was first observed by Simon Newcomb newcomb in 1881. However, Newcomb’s article failed to gain recognition due to a lack of mathematical structure. This empirical law was rediscovered by Frank Benford benford in 1938, who presented it with a mathematical formulation, which states that in a given dataset, the probability of the first significant digit ‘’ is given by :
| (1) |
This probability distribution, known as Benford’s law, predicts an occurrence as high as 30.1% for the digit ‘1’ in the most significant place, whereas a mere 4.6% for the digit 9.
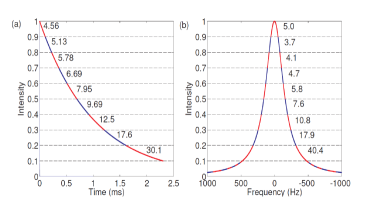
Benford’s law arises from the fact that the numbering-system (be it decimal, octal, or hexadecimal) consists of mere ratios whereas many processes occurring in nature behave like a geometric progression benford . The linear numbering-system may have its own advantages, but various natural phenomena such as the Maxwell-Boltzmann distribution of thermal energy, pH values of solutions, charging/discharging of capacitor, Newton’s law of cooling, decay of a radioactive nuclei - all occur in exponents. In order to provide a simple illustration of Benford’s law, we consider an exponentially decaying signal. Such signals are versatile, including the time-domain free-induction decay (FID) of a single NMR transition. Figure 1(a) displays such a digitized signal, and also marks the time-intervals at which digits 1 to 9 occur in the most significant place. The percentage of the total occurrence of each digit is also shown in the figure. This distribution is in excellent agreement with the expression 1. Let us now consider the frequency-domain signal which is frequently used in spectroscopic analysis. Figure 1(b) displays the real part of the Fourier transform of the time-domain signal shown in Figure 1(a). Such an absorptive Lorentzian line-shape is commonly found in high-resolution NMR spectroscopy. We again notice an overall agreement of the distribution of most significant digits with the Benford’s law.
Such datasets following Benford’s law also emerge from a plethora of sources ranging from astrophysical Astrophysical1 , geographical geographical , biological neural ; biology2 ; aerobiological , seismographic seismic , to financial topics stockmarket ; financial1 . In the past, inspecting violations of Benford’s law have proven to be useful in detecting the cases of tax fraud taxfruad and election fraud electionfraud . Benford’s law has also been applied to study phase transitions in quantum many-body systems ujjwal1 ; ujjwal2 . Recently in another study, the possibility of distinguishing a genuine NMR spectrum from a simulated one using Benford analysis has also been investigated gaurav .
In this article, we explore the use of Benford’s law for various spectroscopic applications, specifically in NMR. In particular, we present some useful techniques pertaining to spectroscopic peak detection, phase correction, and baseline correction. Firstly, we describe the methodology of Benford analysis. Then in the next section, we demonstrate three applications in NMR spectral analysis (i) the detection of weak solute peaks which are overridden by strong solvent peaks in 1D and 2D NMR, (ii) simultaneous correction of zeroth order and first order phase errors in NMR spectra, and (iii) a technique for baseline correction. Moreover, we show that the Benford analysis of an MRI image might be helpful in highlighting its key areas. Finally we conclude in the last section.
II Methodology of Benford Analysis
We shall describe here the general procedure adopted for performing Benford analysis. Firstly, the signs of the data entries are removed by taking their absolutes. To remove a bias towards any particular digit(s) arising from a limited data-range , the dataset is rescaled between 0 and 1, by using the transformation ujjwal2
| (2) |
The distribution of digits in the most significant place is now extracted. In order to quantify the amount of agreement between the observed distribution with the expected distribution , we define ‘Benford Goodness Parameter’ (BGP) as geographical
| (3) |
An ideal Benford distribution corresponds to a value of BGP = 100, whereas the datasets encountered in real life may take lower or even negative values.
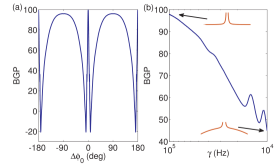
Now we describe the dependency of BGP on certain spectral parameters which form the basis for some interesting applications in spectroscopy: (i) The BGP values depend on the spectral line-shapes and not on their relative intensities. (ii) As illustrated in Figure 2(a), the BGP value depends on the phase of the spectral line. For a given Lorentzian spectral line, maximum BGP is displayed when it is perfectly absorptive (). (iii) The BGP value also depends on the baseline. This fact is illustrated in Figure 2(b). Here a Lorentzian peak is placed on a Gaussian base line, wherein is the frequency and is the width parameter. Clearly, the BGP increases as the baseline becomes flatter. In the following we utilize these properties of BGP to detect weak NMR peaks as well as to rectify the phase errors and base-line artefacts in NMR spectra.
So far we have considered only one spectral line, while many spectral lines are encountered in a typical NMR signal. In such situations, it is helpful to consider a ‘bin’ formed by a smaller section of the data set and compute its BGP. A set of BGP values are then obtained after systematically moving the bin over the entire dataset. We can then plot the BGP values versus the bin centers. We refer to this procedure as Scanning Benford Analysis (SBA). The mean of the BGP values thus obtained captures the lineshapes at all parts of the spectrum, and therefore is a measure of an overall spectral quality. Since a typical NMR signal consists of tens of thousands of data points, each bin can accommodate hundreds of data points required for an effective Benford analysis. In the case of a two-dimensional dataset, we may consider rectangular bins and shift them systematically all over the dataset, to obtain a 2D-SBA plot. In the following, we describe some applications of Benford analysis in NMR spectroscopy.
III Applications in NMR Spectroscopy:
III.1 Detection of weak peaks
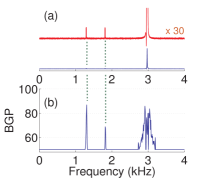
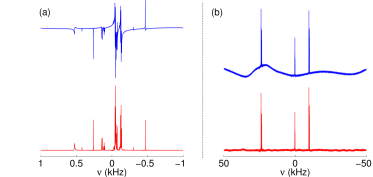
As previously mentioned, BGP values are not dependent on the relative intensities of the spectral lines. This is advantageous for detecting weak solute peaks overridden by a strong solvent peak. To illustrate this fact, we chose a two-spin system (4-Hydroxybenzoic acid, 9.5 mg) dissolved in D2O (500 l) and H2O (50 l). The 1H NMR signal obtained with 1 degree pulse-angle is shown in Figure 3(a). As is evident, the strong water signal easily dominates over the solute signals. Here the intensities of the solute peaks are about of that of the solvent peak, and therefore are hardly visible in the lower trace of Figure 3(a). The SBA curve for this NMR spectrum is also shown in Figure 3(b). The SBA curve was calculated from the frequency domain signal using bins each with 1000 data points shifted by 100 points throughout the spectrum. For simplicity, we have truncated the SBA curve for BGP values below 50. Interestingly, the positions of the peaks in the SBA plot matches fairly well with those in the NMR spectrum. Further, the relative intensities of the solute peaks compared to the solvent peak have also improved by about two orders of magnitude. The fine splitting of the solvent peak in the SBA plot is mainly due to the non-Lorentzian line-shape of the solvent peak (as can be observed in Figure 3(a)). While the resolution of the SBA curve is limited, the sensitivity has improved significantly. This way, SBA curves can help in identifying weak peaks in the presence of strong peaks.
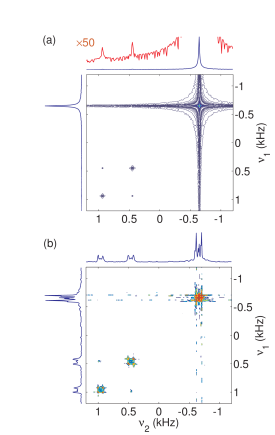
We also illustrate the usefulness of the above procedure in multidimensional NMR using a two-dimensional gradient COSY (G-COSY) spectrum of the same sample (4-Hydroxybenzoic acid). The 1H-1H 2D spectrum and its projections are shown in Figure 4(a). The intensities of the solute diagonal-peaks are about of that of the solvent peak. We perform a 2D-SBA of the frequency-domain spectrum by using square bins each containing data points. The resulting 2D-SBA plot and its projections on either axis are shown in Figure 4(b). Again, we clearly see that the Benford analysis has given significant emphasis to the weak solute peaks such that they appear comparable to the solvent peak and even the cross-peaks are also clearly visible in the SBA plot. However, the fine structures in both the solvent and the solute peaks are artefacts of SBA and may not carry spectroscopic information.
III.2 Correction of Phase Errors
The mismatch between the phase of the observed magnetization and the receiver phase may lead to zeroth-order phase errors resulting in non-absorptive lineshapes. Further, the unavoidable delay (dead-time) introduced while switching a spectrometer from transmitter mode to receiver mode, or certain deliberate delays after the detection pulse result in first-order phase errors. In such cases, it is necessary to carry out a post-processing to rectify all the phase errors. The sensitivity of BGP for the phase errors illustrated in Figure 2(a) may be exploited for phase correction of NMR spectrum. The procedure involves carrying out SBA of the distorted spectrum and computing the mean BGP over all the bins. The phase correction is modelled in the form , where is the frequency coordinate, and the optimum values of zeroth-order () and first-order () corrections can be determined by maximizing the mean BGP. Figure 5(a) illustrates the successful simultaneous correction of both zeroth and first order phase errors using an automated procedure described above.
III.3 Correction of Baseline Errors
Often the sharp high-resolution NMR spectra of solute molecules appear mounted on broad background spectrum arising either from solid impurities or from the sample tube itself. The broad humps can have arbitrary shapes and may interfere with quantitative spectral analysis. In such cases, it is desirable to suppress the broad features using post-processing. The standard way of correcting the baseline involves modelling the baseline using a suitable model function (polynomial or Fourier series), and subtracting the model function from the distorted spectrum to obtain a flat baseline. The challenging part in this method is distinguishing the genuine NMR peaks from the baseline features. Here, we describe a procedure for the baseline correction of an NMR spectrum using Benford analysis. The method is based on the sensitivity of BGP on the baseline shape as illustrated in Figure 2(b). The procedure involves generating a set of spline model-functions (in-built in MATLAB) corresponding to different number of sampling points on the spectrum. After subtracting these model-functions from the distorted spectrum, we obtain a set of candidate spectra. Performing SBA of each of the candidate spectra, and then choosing the one with maximum mean-BGP, we obtain the spectrum corresponding to the best baseline. Figure 5(b) illustrates the baseline correction using an automated procedure as described above. The main advantage of this method over certain other methods is in omitting the requirement of manual identification of baseline.
IV Benford Analysis of 2D Images
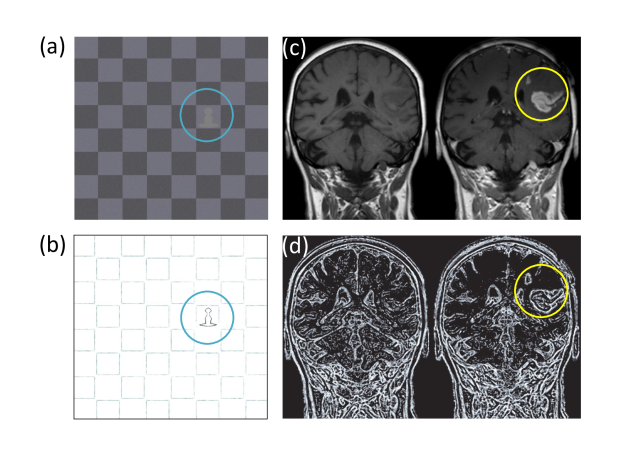
The SBA methods introduced for processing 2D-NMR spectra can also be applied to process other 2D images. To study the effect of 2D-SBA processing, we use a noisy chess-board image shown in Figure 6(a). The corresponding 2D-SBA plot of this image, obtained with a bin-size of data-points, is shown in Figure 6(b). Here we can notice two important aspects of 2D-SBA profiles. Firstly, the Benford analysis clearly identifies the outlines in the image and can therefore be used for edge-detection. Secondly, the weak internal features, like a faint pawn, can become significantly prominent in the 2D-SBA plot. This is analogous to the detection of weak NMR peaks in 1D-SBA and 2D-SBA described in the previous section. These properties of 2D-SBA can be exploited in processing many types of images including MRI. Figure 6(c) displays the MRI of human brain before (left) and after (right) introducing a contrast agent wiki . The corresponding 2D-SBA profiles are displayed in Figure 6(d). As expected, the latter images show clear outlines of all the features in (c) as well as clearly mark-out the part highlighted by the contrast agent. Such complementary images may prove helpful in diagnosis.
V Conclusions
The Benford’s law predicts the distribution of digits 1 to 9 in the most significant place in a numerical database. Although it is hard to conceptualize the role of this distribution in such a wide variety of databases, it brings out several interesting applications. In this work we explored some potential applications in the analysis of spectroscopic data, particularly NMR data. We found that by using a scanning Benford analysis it is possible to detect weak peaks subdued by neighbouring strong peaks. We demonstrated this fact by applying the Benford analysis on both 1D and 2D NMR spectra. The resolution of the scanning analysis is limited by the size of the bins, and the resulting data also lacks the quantitative information on the relative intensities. Nevertheless, such analysis may be useful for high-throughput scanning of solutes with low-concentration. We also demonstrated that the sensitivity of the Benford goodness parameter on the Lorentzian line-shape can be exploited in phase-correction as well as baseline correction. In principle, the same property can also be used in NMR spectrometers for automated field homogenization. Then we extended the Benford analysis to 2D images including an MRI image. We found that the Benford analysis is not only capable of detecting outlines of various features in an image but also is capable of highlighting faint portions of an image. We believe that the Benford analysis can open-up new vistas in spectroscopic analysis.
VI Acknowledgements
The authors acknowledge Ujjwal Sen and Aditi Sen, of HRI, Allahabad, and Anil Kumar of IISc, Bangalore, for suggesting to carry out Benford analysis of NMR databases. This work was partly supported by DST project SR/S2/LOP-0017/2009.
References
- (1) F. Benford. The law of anomalous numbers. Proc. of A. phil. Society, 78(4):551–572, Mar 1938.
- (2) S. Newcomb. Note on the frequency of use of the different digits in natural numbers. A. J. of Math., 4(1):39–40, 1881.
- (3) M. A. Moret, V. de Senna, M. G. Pereira, and G. F. Zebende. Newcomb-benford law in astrophysical sources. International Journal of Modern Physics C, 17:1597–1604, Jun 2006.
- (4) M Sambridge, Hrvoje Tkalčić, and A Jackson. Benford’s law in the natural sciences. Geophysical research letters, 37(22), 2010.
- (5) Bruce Busta and Randy Weinberg. Using benford’s law and neural networks as a review procedure. Managerial Auditing Journal, 13(6):356–366, 1998.
- (6) José Luis Hernández Cáceres, Jorge Luis Pollo García, CM Martínez Ortiz, and Luis García Domínguez. First digit distribution in some biological data sets. possible explanations for departures from benford’s law. Electronic Journal of Biomedicine, 1:27–35, 2008.
- (7) Silvia Docampo, María del Mar Trigo, María Jesús Aira, Baltasar Cabezudo, and Antonio Flores-Moya. Benford’s law applied to aerobiological data and its potential as a quality control tool. Aerobiologia, 25(4):275–283, 2009.
- (8) Gianluca Sottili, Danilo M Palladino, Biagio Giaccio, and Paolo Messina. Benford’s law in time series analysis of seismic clusters. Mathematical Geosciences, 44(5):619–634, 2012.
- (9) Marc JK De Ceuster, Geert Dhaene, and Tom Schatteman. On the hypothesis of psychological barriers in stock markets and benford’s law. Journal of Empirical Finance, 5(3):263–279, 1998.
- (10) Cindy Durtschi, William Hillison, and Carl Pacini. The effective use of benford’s law to assist in detecting fraud in accounting data. Journal of forensic accounting, 5(1):17–34, 2004.
- (11) CPA Bruce Busta and Richard Sundheim. Detecting manipulated tax returns with the use of benford’s law. Center for Business Research, 95:106–94, 1992.
- (12) Joseph Deckert, Mikhail Myagkov, and Peter C Ordeshook. The irrelevance of benford’s law for detecting fraud in elections. Caltech/MIT Voting Technology ProjectWorking Paper, (9), 2010.
- (13) Aditi Sen De and Ujjwal Sen. Benford’s law detects quantum phase transitions similarly as earthquakes. EPL (Europhysics Letters), 95(5):50008, 2011.
- (14) Ameya Deepak Rane, Utkarsh Mishra, Anindya Biswas, Aditi Sen De, and Ujjwal Sen. Benford’s law gives better scale exponents in phase transitions of quantum xy models. arXiv preprint arXiv:1405.2744, 2014.
- (15) Gaurav Bhole, Abhishek Shukla, and TS Mahesh. Benford distributions in nmr. arXiv preprint arXiv:1406.7077, 2014.
- (16) Wikipedia. Mri contrast agent — wikipedia, the free encyclopedia, 2014. [Online; accessed 11-August-2014].