APASS Landolt-Sloan BVgri photometry of RAVE stars.
I. Data, effective temperatures and reddenings
Abstract
We provide APASS photometry in the Landolt and Sloan bands for all the 425,743 stars included in the latest 4th RAVE Data Release. The internal accuracy of the APASS photometry of RAVE stars, expressed as error of the mean of data obtained and separately calibrated over a median of 4 distinct observing epochs and distributed between 2009 and 2013, is 0.013, 0.012, 0.012, 0.014 and 0.021 mag for ,,, and band, respectively. The equally high external accuracy of APASS photometry has been verified on secondary Landolt and Sloan photometric standard stars not involved in the APASS calibration process, and on a large body of literature data on field and cluster stars, confirming the absence of offsets and trends. Compared with the Carlsberg Meridian Catalog (CMC-15), APASS astrometry of RAVE stars is accurate to a median value of 0.098 arcsec. Brightness distribution functions for the RAVE stars have been derived in all bands. APASS photometry of RAVE stars, augmented by 2MASS infrared data, has been fitted to a densely populated synthetic photometric library designed to widely explore in temperature, surface gravity, metallicity and reddening. Resulting and , computed over a range of options, are provided and discussed, and will be kept updated in response to future APASS and RAVE data releases. In the process it is found that the reddening caused by an homogeneous slab of dust, extending for 140 pc on either side of the Galactic plane and responsible for =0.0360.002 at the galactic poles, is a suitable approximation of the actual reddening encountered at Galactic latitudes 25∘.
1 Introduction
RAVE (RAdial Velocity Experiment) is a digital spectroscopic survey of stars in the nominal magnitude interval , distributed over the whole southern sky. Spectra have been recorded over the 8400-8800 Å range, at an average resolving power 6500, with the AAO (Australian Astronomical Observatory) UK Schmidt telescope feeding light to a spectrograph via the 6-degree Field (6dF) 150 fiber positioner. The primary science driver of the survey is the investigation of the structure and evolution of the Milky Way through the determination of radial velocities, chemistries, temperatures, and gravities for a large number of stars. The survey data releases (Steinmetz et al., 2006; Zwitter et al., 2008; Siebert et al., 2011) have followed an incremental scheme, with the last Data Release N.4 (DR4 Kordopatis et al., 2013) covering 482 194 spectra for 425 743 individual stars. RAVE data have so far directly supported about fifty refereed papers.
Accurate photometry, based on bands spanning the optical and near infrared wavelength ranges, is an essential support to spectroscopic surveys like RAVE. Such photometry provides, among other things: () the brightness distribution functions of the survey targets, () the effective temperature, useful per se or as a prior to the spectroscopic determination of atmospheric parameters, () the reddening, () the observed brightness against which to derive the distance modulus () to the survey targets, () the color discriminant to segregate single normal stars from binaries and peculiar stars, and () when multi-epoch photometry is available, information on the target intrinsic variability. So far, only limited photometric information in the optical has been available for RAVE stars, as reviewed below. The goal of this paper is to provide accurate multi-band optical photometry for all RAVE stars and to combine it with near-IR 2MASS photometry.
A total of 251 626 RAVE DR4 stars have a match in the Tycho-2 , catalog. Unfortunately, the Tycho-2 photometric errors rapidly degrade toward the faint survey limit, and over the range of brightness of the bulk of RAVE stars, Tycho-2 data (especially the band) are virtually useless. The median value of quoted Tycho-2 errors for RAVE stars is and mag, for a combined which is far larger than the reddening affecting the majority of RAVE stars, or larger than the color spread corresponding to the combined uncertainty in the RAVE atmospheric parameters (, , [M/H]).
A greater number of RAVE DR4 stars, 407 061 in total, have a counterpart in the DENIS ,, catalog. DENIS and photometry is of limited precision, the median value on RAVE stars being =0.07 and =0.07 mag (three times worst that corresponding 2MASS values), with on the combined color index ( for 2MASS). Such an uncertainty on the color index corresponds to an uncertainty of 15% in the effective temperature of a red giant star or 0.20 mag in , spoiling DENIS , photometry of any practical value in supporting RAVE survey. DENIS photometry, even if reported to a greater precision (a median of mag on RAVE stars), is affected by saturation problems for bright RAVE targets, setting in at undocumented different levels of brightness depending on the location on the sky (cf. Kordopatis et al., 2013). Furthermore, the transmission profile of DENIS band is not accurately known, and thus the observed complex offset from Landolt’s and Cousins’ standard stars cannot be safely compensated for during modeling and analysis of the data.

A further source of photometry for a consistent fraction of RAVE stars is the band data obtained as a by-product during the astrometric operation of the Carlsberg Meridian Circle in La Palma, covering the sky between declinations . The final Carlsberg Meridian Circle data release, CMC-15 of 2013, contains counterparts to 228 805 RAVE DR4 stars. The original CMC observations did not include a second photometric band, necessary for the transformation from the local to the standard system, which was achieved by importing in the process the bluer color () from Tycho-2 catalog. The median value of the CMC-15 reported internal error on band data for RAVE DR4 stars is 0.026 mag. The CMC-15 band data will be further considered in sect. 2.5.
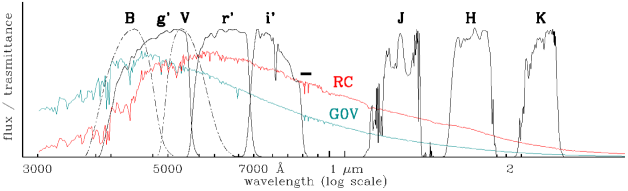
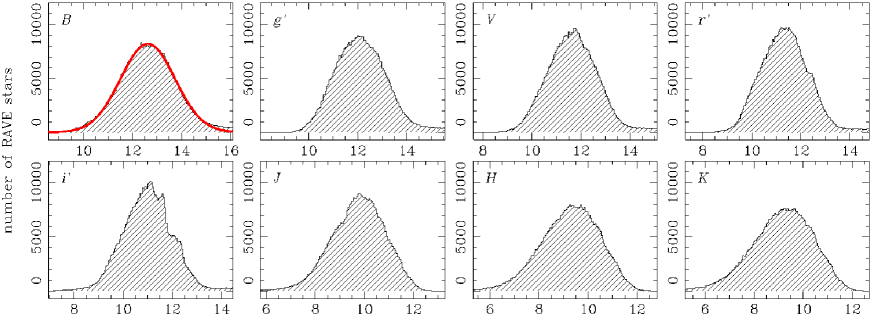
On the near-IR side, 2MASS , , and magnitudes are available for all RAVE DR4 stars. The median value of the quoted errors for RAVE stars is =0.024, =0.025, =0.023 mag, much better than for the corresponding DENIS bands. However, even if 2MASS ,, data are available for all RAVE stars, and they are of reasonable accuracy, nevertheless they map the Rayleigh-Jeans tail of the energy distributions of typical RAVE stars (cf. Figure 1), which provides only a limited leverage in term of diagnostic capability. In fact, the 1090 percentile interval in the color distribution of RAVE stars corresponds to just mag.
The aim of the present paper is to provide accurate photometry for all RAVE DR4 stars in the Landolt , and Sloan ,, photometric bands, as obtained during the APASS survey (Aavso Photometric All-Sky Survey; Henden & Munari, 2014; Henden et al., 2014). Combining with 2MASS ,, data in the infrared, APASS photometric bands encompass the majority of the energy distribution of typical RAVE stars, as shown schematically in Figure 1. The plan of this paper is first to present the APASS data on RAVE stars and test their photometric and astrometric quality. Photometric degeneracy between temperature and reddening is then discussed, and a simple model for galactic extinction is introduced and its parameters calibrated against APASS+2MASS data for standard stars. Photometric temperatures are derived, first for a set of standard stars to assess their accuracy, and then for the whole body of RAVE stars. These photometric temperatures are compared with those derived spectroscopically, and the result discussed. Finally, the reddening is derived for all RAVE DR4 stars both from unconstrained fit as well as fixing the atmospheric parameters to the values derived by RAVE spectra.
Among the goals of future papers in this series, there will be the derivation of a Galactic 3D map for the interstellar reddening here derived for RAVE DR4 stars, the photometric characterization of RAVE DR4 peculiar stars, the study of the photometric variability of RAVE DR4 peculiar stars by accessing the individual epoch photometric data, the use of supplementary observations in the , and filters, and extension to brighter magnitudes than the current APASS saturation limits.
2 The data
2.1 The APASS survey
The photometric data of RAVE stars discussed in this paper have been obtained as part of the ongoing APASS survey (Henden & Munari, 2014; Henden et al., 2014). The all-sky APASS survey is carried out to fill the gap existing between the completeness limit of the all-sky Tycho-2 survey () and the saturation limit () of planned or already operating near-IR and optical photometric surveys like SDSS, PanSTARRS, LSST, SkyMapper, VISTA, VST, etc. APASS results are already used as the photometric source catalog for the US Naval Observatory CCD Astrograph Catalog (UCAC-4), and for the Harvard College DASCH program (which is scanning the Harvard plate stacks and measuring the magnitude of all detected stars).
The APASS photometric survey covers the whole sky, from Pole to Pole, with ongoing observations from CTIO (Chile), for the southern hemisphere, and New Mexico for the northern counterpart. At both sites, a pair of twin remotely controlled, small telescopes obtain simultaneous CCD observations during dark- and grey-Moon time over five optical bands: , (tied to the equatorial standards of Landolt, 2009) and ,, bands (tied to the 158 primary standards given by Smith et al. (2002), that define the Sloan photometric system). The telescopes are 20-cm f/3.6 astrographs feeding Apogee U16m cameras (4 array, 9 m pixels), that cover a field 2.9 deg wide with a 2.6 arcsec/pix plate factor. The photometric filters are of the dielectric multi-layer type and are produced by Astrodon. Transmission curves and photometric performances of Astrodon filters are discussed and compared to more conventional types of photometric filters in Munari et al. (2012) and Munari & Moretti (2012). On average 80 fields are observed per night at each APASS location, 20 of them being standard fields (Landolt, Sloan) well distributed in time and airmass.
The APASS observations are obtained with fixed exposure times (different and optimized for each photometric band), set to detect =17 stars at S/N=5 on a single exposure. Stars brighter than =10 may saturate under optimal seeing conditions. APASS has also recently begun using the bright-Moon periods to obtain shorter exposure observations in order to push the saturation limit upward to 7.5 mag stars, and to observe also in the band at 1.035 m (defined by Hillenbrand et al., 2002; Sharon et al., 2010) and Sloan , bands.
2.2 Astrometric matching
The astrometric matching to the APASS catalog has been performed by taking position and proper motions of RAVE stars as listed in DR4 and projecting them to the 2013 APASS epoch. The matching radius has been set to 3.0 arcsec. All 425 743 RAVE DR4 stars turned out to have their APASS counterpart.
As a test on the accuracy of APASS astrometry (which is calibrated against UCAC-4), we have searched the final CMC-15 release (2013) of the Carlsberg Meridian Catalog for the positions of RAVE stars and computed the separation between the APASS and Carlsberg positions (equinox J2000, individual epochs varying from 1999 to 2005). Their distribution is presented in Figure 2. It has its peak at a separation of 0.072 arcsec and the median at 0.098 arcsec, confirming the high astrometric accuracy of APASS products.
2.3 Internal photometric accuracy
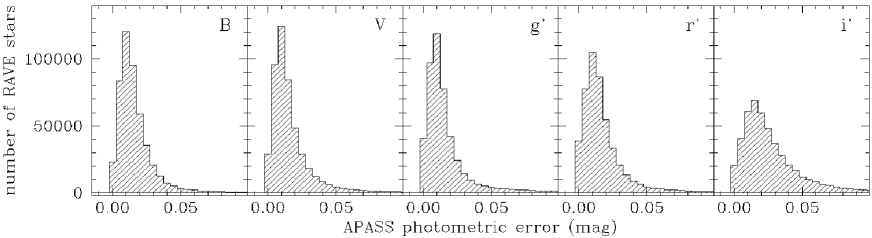
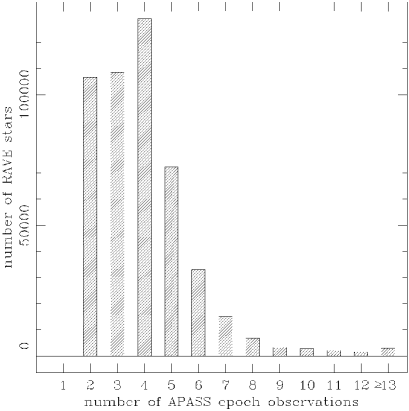
Each APASS observing night is independently calibrated in all-sky mode against the Landolt and Sloan standards observed that same night over a large range of airmass. The photometric quality of a given night can be evaluated only a posteriori during the data reduction process, and only data obtained during photometric nights are used to build the APASS catalog. The difference in magnitude for data on the same stars obtained in separate nights (usually months apart), is therefore a reliable estimate of the total internal errors affecting APASS photometry. Their distribution for RAVE stars is presented in Figure 3, and the distribution of RAVE stars as function of the number of epoch APASS observations is given in Figure 4 (on average, a RAVE star has been observed on 4 independent epochs by APASS, and none at less than 2 epochs). The errors corresponding to the tails of the distributions in Figure 3 are actually an over-estimate of the true internal photometric errors. In fact, in building Figure 3 all stars are treated as non-variable, but as shown by the Hipparcos satellite about 10% of all stars it observed did show a variability of at least 0.01 mag amplitude. Median values of the error distributions in Fig. 3, and the corresponding 2MASS values are:
| (1) | |||||
where the larger value for the band (compared to ,, and bands) is mainly due to the variable intensity of the strong telluric absorptions present over its pass-band. By the time the final products of APASS survey will be released and the number of observing epochs doubled, the above errors are expected to reduce by %.
2.4 Saturation limits
A necessary test is to evaluate at what magnitude saturation sets in (because of the fixed exposure time over the whole sky), and therefore to place a safe upper brightness limit to the use of APASS data to model properties of RAVE stars. The test is carried out in Figure 5, where the tabular value of 245 Landolt primary standards is compared to that derived by APASS (which obviously uses only non-saturated Landolt standards to perform its calibration). Note that APASS uses the same 14-arcsec diameter digital aperture that matched the Landolt 14-arcsec photoelectric photometer aperture, so any neighboring star included in Landolt’s aperture is also included in the APASS photometry. Figure 5 shows that most of the , observations are unsaturated up to 9.5 mag, but excellent seeing can cause this limit to shift down to 10.0 mag. A similar exercise for Sloan 158 primary standards shows that band is unsaturated up to 9.0 mag, the band up to 9.5 mag, while the limit for the band is 10.0 mag. These results perfectly match those independently derived, from a different and independent set of APASS data, during the search for and the characterization of RR Lyr variables potentially associated with the Aquarius stream (Munari et al., 2014), a Galactic stream originating from a disrupting globular cluster that was first identified on RAVE data (Williams et al., 2011; Wylie de Boer et al., 2012).
To have a safe margin in all bands and for all stars, we will limit the analysis in the rest of this paper to stars with an APASS magnitude in the ,,, bands and in (only 1.8% of the total number of RAVE DR4 stars is consequently ignored in the following). As mentioned in the introduction, APASS is currently using the bright Moon nights to perform a shallower parallel survey aiming to push the saturation limit up to 7.5 mag stars. The APASS data for the brighter RAVE stars will be investigated when ready, thus later in this series of papers.
2.5 External photometric accuracy
Even if the small internal errors already make APASS the most accurate all-sky, multi-band photometric survey in the optical wavelength range, what really matters are the external errors. To estimate them, we compare APASS data to available literature. We begin with photometric standard stars not used in the calibration of APASS data (to avoid circular arguments), and then move to consider field and cluster stars.
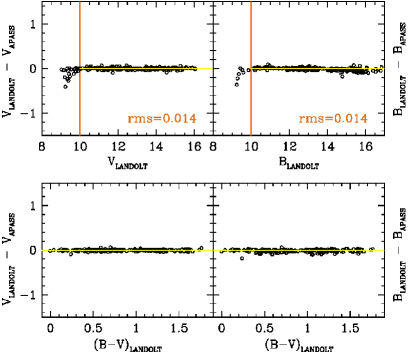
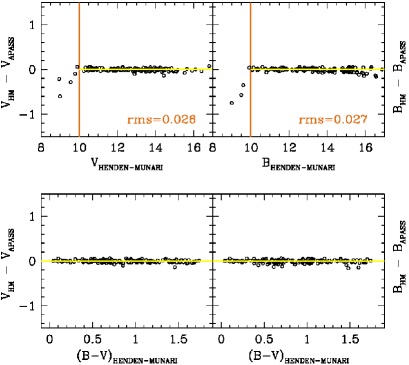
Henden & Munari (2000, 2001, 2006) have calibrated a series of secondary Landolt standards in 81 low galactic latitude fields. These secondary standards are not used to calibrate APASS data, which relies only on the primary Landolt equatorial standards. The comparison with Henden and Munari secondary standards is carried out in Figure 6. It shows no offsets or trends with APASS , photometry, and confirms 10.0 mag as the saturation limit for the survey. The rms of APASS data on these secondary standards is somewhat larger than on the Landolt primary standards used for the photometric calibration. A reason is the large crowding affecting the low galactic fields where the Henden & Munari secondary standards are located, while Landolt standards are primarely high galactic latitude stars well isolated from neighbours.
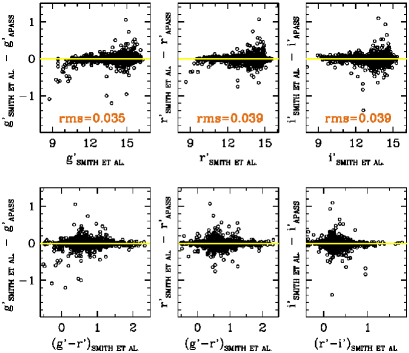
In addition to the primary 158 photometric standards for the Sloan system, Smith et al. (2002) also published a list of additional 2988 secondary standards. These Sloan secondary standards are not used in the APASS calibration, so they constitute an unbiased external consistency check for APASS photometry. The comparison is carried out in Figure 7, and it shows again no offset and no trend. The larger scatter is most likely due to the larger 24-arcsec digital aperture used by Smith et al. Their 158 primary standards were mostly also Landolt standards with no nearby neighbors, but the 2988 secondary standards may not have been so carefully selected.
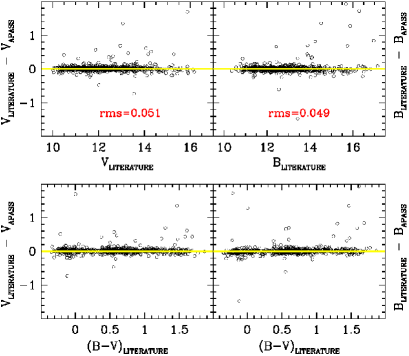
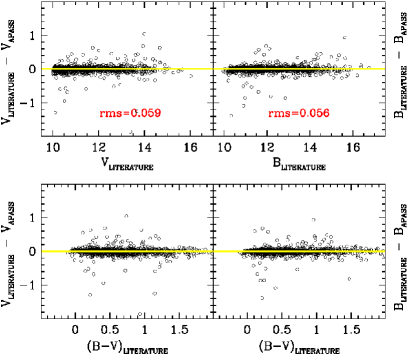
While there are no large sets of stars in the RAVE brightness range that were measured by different authors in the ,, Sloan bands, the Johnson , bands have extensive coverage. A relevant source of data is the Catalog of Mean UBV Data (Cat-UBV for short), critically assembled from existing literature by Mermilliod & Mermilliod (1994) during the work leading to the compilation of the Hipparcos Input Catalog. It covers 103 108 stars with measurements spread over 693 different source papers (27 803 stars rely on only one observation from only one source). Figure 8 presents the comparison for the 723 field stars fainter than 10.0 mag in both and which are in common between Cat-UBV and APASS, and for which Cat-UBV averages over at least two distinct data sources. Figure 9 presents a similar comparison for 1073 stars that are members of clusters. What is relevant in these two figures is the absence of offsets and trends in both the magnitude zero-points and their color dependences. The outliers in both figures are almost entirely stars with only one observation from just two independent sources. The rms values in Figures 8 and 9 are somewhat larger than for the comparisons carried out in Figures 5-7. There are various possible causes for this, such as () the presence of unrecognized low-amplitude variable stars, () the mainly photoelectric origin of Cat-UBV data (in photoelectric photometry all the light entering the generously large aperture of the photometer - usually tens of arcsec - is measured, thus the target together with faint field stars; while in CCD photometry the stars are isolated from the background and measured individually. Perhaps not incidentally, data for members of open cluster appear more dispersed in Figure 9 than data for field stars in Figure 8), and () the many different variants over which independent authors - whose data were entered into Cat-UBV - tried to replicate the Johnson’s bands, Landolt’s bands being just one of such variants (a comprehensive discussion of the realisation of the Johnson’s system and the difficulties of reproducing it with instrumentation that changed with time, is given for example in Bessell (1990), in the books by Golay (1974) and Straižys (1995), and the two volumes of the Asiago Database on Photometric Systems by Moro & Munari (2000), and Fiorucci & Munari (2003).
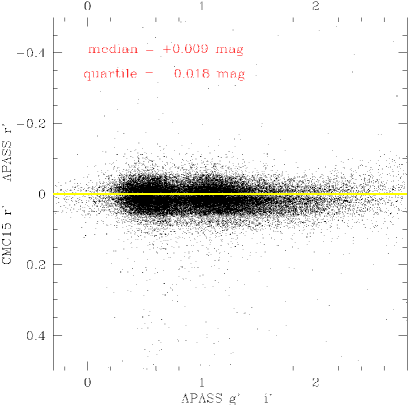
The comparison between the CMC-15 and APASS magnitudes for the 228 805 RAVE DR4 stars in common is presented in Figure 10. There is no trend with color, a minor systematic offset of just 0.009 mag, and a tight concentration of points with the quartile of the distribution amounting to only 0.018 mag. Considering the uncertainties of the photometry included in CMC-15 mentioned above, this comparison between CMC-15 and APASS magnitudes strongly reinforces mutual confidence in them.
2.6 Distribution in magnitude and over the HR diagram of RAVE stars
The distribution in APASS and 2MASS magnitudes for RAVE DR4 stars is shown in Figure 11, and it is characterized by the following median values (which are not affected by potential saturation problems at the very bright end of the distributions):
| (2) | |||||
The stars for the RAVE input catalog were selected on the basis of their -band magnitude (coming from DENIS, or SuperCOSMOS catalogs, or extrapolated from other sources like Tycho-2), generally within the boundaries . To avoid problems from fiber cross-talk, the targets for any given RAVE observation should span the strictest possible range in magnitude that would still provide enough targets within the field of view to cover all available fibers. This led to grouping the targets in the RAVE input catalog over four distinct ranges in -band magnitude (nominally , , , ). The corresponding tailing of the actual observations is apparent in the segmented distribution affecting the panel of Figure 13. The presence of segmentation in other bands declines with increasing wavelength separation from the band. It is noteworthy that the distribution in band is closely matched by a Gaussian (overplotted) centered on and with mag.
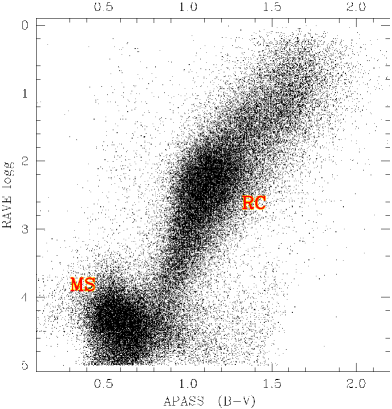
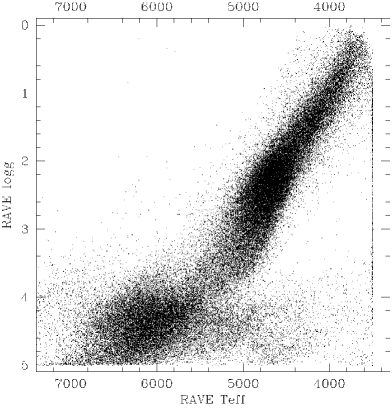
The distribution of RAVE stars over the HR diagram is shown in Figure 12, and is dominated by closer, hotter and higher galactic latitude Main Sequence/Turn-Off stars (the cloud of points centered at , ), and by more distant, cooler and lower galactic latitude RGB and Red Clump stars (the cloud of points centered at , ).
3 Fitting to a synthetic photometric grid
To extract information about the observed stars, we performed a fit of APASS+2MASS photometry against a library of purposefully-built synthetic photometry. The source stellar energy distributions are the atmospheric flux models of Castelli & Kurucz (2003). Their model atmospheres are the basis of the Munari et al. (2005) synthetic spectral atlas, which has been used to derive atmospheric parameters from spectra in RAVE Data Releases 2 and 3. These models have been extensively used in the literature, including the recent work by Bessell & Murphy (2012) on revised passbands and zero points for UBVRI, Hipparcos, and Tycho photometry.
The atmospheric flux models of Castelli & Kurucz (2003) cover, at regular steps, a wide portion of the atmospheric parameter space along the effective temperature (), surface gravity (), and metallicity ([M/H]). Two values of the enhancement in -elements ([/M]) are considered (0.0 and +0.4), while the micro-turbulence is constant at 2 km sec-1. To increase the density of grid points in the range of temperatures covered by the vast majority of RAVE stars, the original atmospheric flux models for K have been parabolic interpolated to K, dex, [M/H]=0.1, and a third value (+0.2) for [/M] has been derived from linear interpolation of source values (0.0 and +0.4). For hotter temperatures (), where less than 1% of all RAVE stars are found, only one interpolated mid-point has been added between the original Castelli & Kurucz (2003) grid points. The atmospheric flux models have then been reddened according to 64 different values of , from 0.0 to 2.0, with a finer step at lower reddenings () that progressively widens with increasing extinction (last two points at and 2.00). Considering the high galactic altitude of RAVE target stars, for the interstellar reddening law we adopted the standard law as formulated by Fitzpatrick (1999). A total of 13 million interpolated and reddened atmospheric flux models were used to build the photometric synthetic library.
The magnitudes in the eight bands of interest (Landolt ,, Sloan ,,, 2MASS ,,) were obtained for all input atmospheric flux models by direct integration:
| (3) |
where I() is the flux distribution of the atmospheric model, and S() is the transmission profile of the given photometric band. The zero-points were set to match the observed values for the primary photometric standard of the Sloan system BD+17.4708111Bohlin and Gilliland (2004b) provided an accurate absolute flux distribution of this star based on HST data, for which there are several published determinations of the atmospheric parameters. The corresponding mean values are K, and [M/H]. An [/Fe]=+0.4 atmospheric flux model for these parameters was obtained by parabolic interpolation from Castelli & Kurucz (2003), and it was reddened by following Ramírez et al. (2006). The zero points in Eq.(2) then follow from the requirement that the computed values match the observed values , , , , (from Fukugita et al., 1996; Smith et al., 2002), and , , (2MASS catalog) for the BD+17.4708 standard.
To derive the best matching atmospheric parameters and reddening, the observed APASS 2MASS ,,,,,,, magnitudes (mag∗) were fitted to the synthetic photometric grid:
| (4) |
where sums over the eight photometric bands and are the individual errors quoted in APASS and 2MASS catalogs. Extensive simulations on synthetic data and analysis of real data on RAVE stars, shows that the great density of points in the matched synthetic photometric library produces minima which are symmetric around their core. To derive the best fit values, we therefore averaged over the five deepest points within the minimum.
4 Temperature-Reddening degeneracy
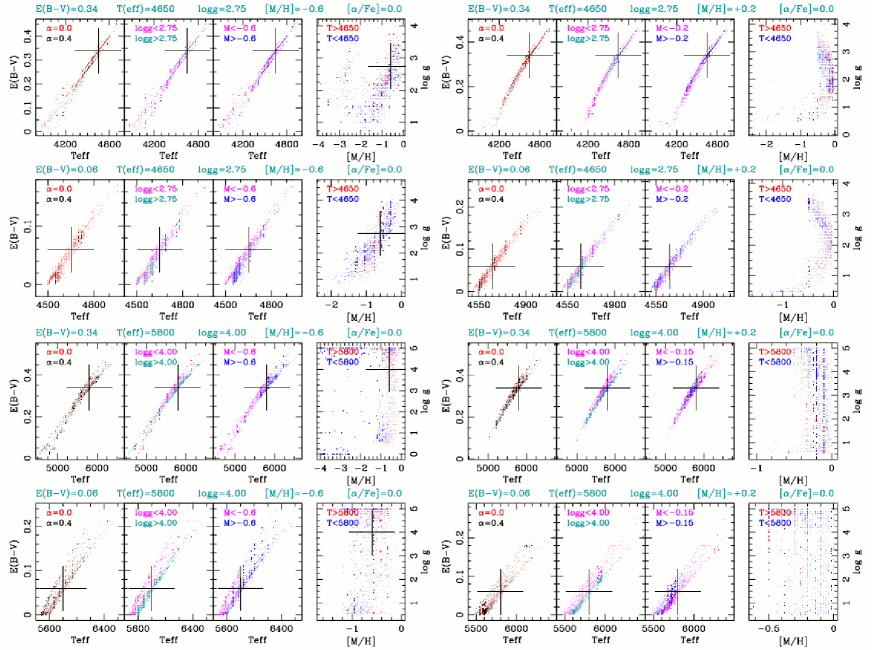
The observed spectral energy distribution of a normal star is primarily dominated by the combined effect of temperature and reddening. The two cannot be fully disentangled from optical+IR photometric data alone. This is demonstrated in Figure 13, where the results of a Monte Carlo simulation are presented. We took the photometry of one atmospheric flux model (from the 13 244 000 entries of the synthetic photometric reference grid described in the previous section), Monte Carlo perturbed it according to a Gaussian distribution of errors (with given by the values in Eq.1), and fitted it back to the photometric reference grid. Figure 13 presents the distribution of the fitting results, on three separate planes to highlight the effect of alpha-enhancement, surface gravity and metallicity, while the last panel on each row shows the surface gravity vs. metallicity correlation.
In the Monte Carlo simulations of Figure 13, we considered two cases, a main sequence/turn-off star ( K, , [/Fe]=0) and a red clump star ( K, , [/Fe]=0), either metal rich ([M/H]=+0.2) and metal poor ([M/H]=0.6), and suffering from or reddening, for a total of eight different combinations. The results of Figure 13 say that broad-band photometry, even if widely distributed in wavelength over the optical and infrared ranges, and of state-of-the-art accuracy, cannot accurately disentangle temperature from reddening, the two are intimately degenerate, and that the possibility to constrain gravity and metallicity is, at best, marginal. This is not surprising, since we have at least five variables (, , , [M/H], [/Fe]) and only eight data points to constrain them (whereas spectra can count on hundreds of absorption lines as inputs). Here we considered the ideal case of fitting synthetic vs. synthetic data. In the real world, with real stars, there are several additional variable factors to further confuse the picture: () a fraction of the real stars are binaries, merging the light of two or more stars of different properties (including the possibility of even different circumstellar reddening, e.g. Allen, 1983), () the cosmic dispersion of real stars (for ex. in chemical partition or micro-turbulence) cannot be accounted for by any synthetic photometric grid, () peculiarities like chromospheric activity (a common feature of young main sequence stars), winds and circumstellar material (frequent in cool giants, yellow supergiants or the hotter stars), or even the latitudinal dependence of colors on fast rotating stars (e.g. Golay, 1974; Bohlin & Gilliland, 2004a), and the () differences in shapes that the wavelength dependence of interstellar reddening can take over the wavelength range of interest (from =2.1 to =5.0, e.g. Cardelli et al., 1989; Fitzpatrick, 1999). These uncertainties are added to the known difficulties of synthetic spectra to accurately reproduce observed ones, expecially at the borders of the explored parameter space.
Below in this paper, we will provide for RAVE stars several different values of temperature and reddening. In addition to those derived by fitting APASS+2MASS data simultaneously for both of them, we’ll also fix the reddening and derive the temperature and conversely fix the temperature and derive the reddening, so to provide the reader with a range of options.
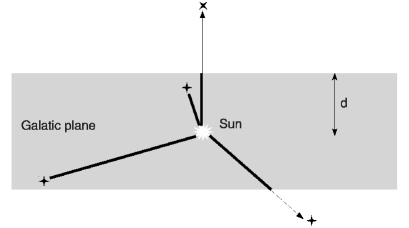
5 Dust model parameterized on standard stars
To derive the temperature once the reddening is fixed, we introduce a simple reddening model. We assume that the low reddening affecting the high Galactic latitude RAVE stars originates from an homogeneous slab of dust, extending symmetrically for parsecs above and below the Galactic plane, with the Sun positioned on the Galactic plane. In this model, sketched in Figure 14, the amount of reddening is directly proportional to the length traversed by the line-of-sight within the dust slab (indicated by the thicker portions of the lines-of-sight in Figure 14). The model is completely defined by the thickness of the slab (), the total reddening at the pole (, the same value for the north and south poles), and the reddening law. We take the reddening law to be the standard =3.1, valid for the diffuse interstellar medium (Savage & Mathis, 1979). Investigation of the actual 3D Galactic reddening map as inferred from APASS+2MASS data for RAVE stars will be carried out elsewhere in this series of papers. It is worth noticing that typical RAVE stars are at high galactic latitudes and at a significant distance from the Sun. Thus most of them lie outside the dust slab, and the distribution of dust within the slab is not important so that we can characterize it with just two numbers, its thickness and its extinction at the poles. Also the presence of the local interstellar bubble around the Sun (e.g. Abt 2011 and references therein) is of little concern here, all RAVE and calibration stars below considered lying similarly well beyond it.
To derive the amount of total reddening at the poles and constrain the thickness of the dust slab, we considered two samples of stars, characterized by having both accurate atmospheric parameters (derived from high resolution, high S/N spectroscopy) and accurate APASS and 2MASS photometry. A first sample comes from Ruchti et al. (2010, 2011a, 2011b), and a second sample is composed of stars from the PASTEL database Soubiran et al. (2010). Distances to these stars were obtained from isochrone fitting as described by Zwitter et al. (2010). These distances are homogeneous with those to RAVE stars computed in the same way (see below). The sample of Ruchti+PASTEL stars with unsaturated APASS+2MASS magnitudes is composed by 242 stars. They are distributed similarly to RAVE stars in terms of temperature and surface gravity: those hotter than 5300 K are generally main sequence objects, while giants dominates at lower temperatures. In both the RAVE survey and the Ruchti+PASTEL sample the number of giants is larger than the main sequence stars. They however differ significantly in metallicity: the median metallicity of Ruchti+PASTEL main sequence stars is 0.85, and 1.41 is that of giants, those of RAVE stars are 0.17 and 0.43, respectively. When unsaturated APASS photometry will be available for stars up to 7.5 mag, it will be possible to include a larger proportion of standard stars of higher metallicity.
The APASS+2MASS data for the stars in the Ruchti+PASTEL sample were subjected to the fitting described in sect.3. A dense grid of values for the thickness of the slab () and the total reddening at the pole () was explored. The photometric temperature derived from the fitting was then compared to the spectroscopic values, and the difference evaluated. The values of and that best represent the Galactic extinction are those that tend to null the trend of with , and that minimize both the median value and the rms of .
![[Uncaptioned image]](/html/1408.5476/assets/x16.png)
A value of and pc are found. It is worth noting that the fitting assumes the reddening affecting the Sloan primary photometric standard BD+17.4708 to be following Ramírez et al. (2006). Any deviation from of the reddening affecting BD+17.4708 should be added to . In the existing literature, various methods have been used to derive (stellar counts and colors, galaxy counts and colors, interstellar polarization). A probably incomplete list of available literature provides the following determinations (in chronological order): =0.023 by Straizys & Kavaliauskaite (1967), 0.029 by Bond et al. (1971), 0.018 by Philip (1973), 0.054 by Holmberg (1974), 0.03 by Appenzeller (1975), 0.048 by Heiles (1976), 0.057 by Knude (1977), 0.00 by Burstein & Heiles (1978), 0.060 by Lynga (1979), 0.024 by Albrecht et al. (1980), 0.04 by Nicolet (1982), 0.048 by de Vaucouleurs & Buta (1983), 0.00 by McFadzean et al. (1983), 0.050 by Eggen (1995), 0.055 by Berdyugin et al. (2001), and 0.043 by Berdyugin et al. (2004). Their mean value is (, and 0.005 as the error of the mean), the same value we found from APASS+2MASS data of Ruchti+PASTEL stars, which reinforces the confidence on the results of the present paper. The value of 140 pc we found for well matches the scale height of the youngest stellar population of the Galaxy with which dust is intimately related.
Future extension of the APASS survey to cover stars up to 7.5 mag brightness will greatly increase the number of nearby spectroscopic standard stars, especially among the main sequence stars, and this will provide a stronger handle to fix and , as well as for investigating differences in the total extinction at the north and south Galactic poles.
6 Results
The photometric temperature and reddening of RAVE stars have been computed according to the procedure described in sect.3 and the results are given in Table 1. The full table is available electronic only via CDS, the electronic edition of this journal and the RAVE web site. The electronic version of the table will be kept updated in response to future RAVE and APASS data releases.
In addition to provide APASS astrometric positions and magnitudes (with their respective errors) for RAVE DR4 stars, Table 1 lists a series of values for the temperature and reddening computed under different conditions, outlined below. Table 1 lists results for 377 379 RAVE spectra (336 644 stars) and does not include the RAVE stars that have been classified as peculiar by Matijevič et al. (2012), which will be studied separately and in conjunction with epoch APASS photometry. For uniformity reasons, Table 1 also does not include the few RAVE stars for which data are missing in one or more of the photometric bands. By slab reddening in Table 1, we mean the reddening produced by the line of sight to the given star traversing an homogeneous slab of interstellar dust, extending by =140 pc on either sides of the Galactic plane (with the Sun centered on it), following the standard law and causing a total mag at both Galactic poles. It is completely defined by the Galactic latitude and the distance to the given star. Finally, RAVE DR4 computed the atmospheric parameters (, and [M/H]) from observed spectra following two different approaches, named kordo and sparv, which are described in Kordopatis et al. (2013) (where preference is given to kordo values) and that are both used in this paper.
The columns of Table 1 provide the following data. Column:
(1) RAVE name;
(2) APASS right ascension (equinox J2000, epoch 2013);
(3) its error (in arcsec);
(4) APASS declination (equinox J2000, epoch 2013);
(5) its error (in arcsec);
(6) number N of independent photometric nights during which the star was
measured by APASS;
(7) mag;
(8) the of the N (column 6) independent measurements;
(9) mag;
(10) the of the N (column 6) independent measurements;
(11) mag;
(12) the of the N (column 6) independent measurements;
(13) mag;
(14) the of the N (column 6) independent measurements;
(15) mag;
(16) the of the N (column 6) independent measurements;
(17) (K) computed by assuming the slab reddening
corresponding to Binney et al. (2014) distance;
(18) its uncertainty (K) expressed as the rms of the five
deepest points within the minimum;
(19) (K) computed by assuming the slab reddening
corresponding to Zwitter et al. (2010) distance;
(20) its uncertainty (K) expressed as the rms of the five
deepest points within the minimum;
(21) (K) computed by assuming the slab reddening
corresponding to Zwitter et al. (2010) distance, and fixing the values of
and [M/H] to “kordo” values from RAVE DR4;
(22) its uncertainty (K) expressed as the rms of the five
deepest points within the minimum;
(23) (K) computed by assuming the slab reddening
corresponding to Zwitter et al. (2010) distance, and fixing the values of
and [M/H] to “sparv” values from RAVE DR4;
(24) its uncertainty (K) expressed as the rms of the five
deepest points within the minimum;
(25) (K) computed by assuming null reddening;
(26) its uncertainty (K) expressed as the rms of the five
deepest points within the minimum;
(27) (K) computed by letting the
to simultaneously fit ;
(28) its uncertainty (K) expressed as the rms of the five
deepest points within the minimum;
(29) slab reddening for Binney et al. (2014) distance;
(30) slab reddening for Zwitter et al. (2010) distance;
(31) (mag) computed by letting the to simultaneously
fit ;
(32) its uncertainty (mag) expressed as the rms of the five deepest
points within the minimum;
(33) (mag) computed by fixing ,
and [M/H] to “kordo” values from RAVE DR4;
(34) its uncertainty (mag) expressed as the rms of the five deepest
points within the minimum;
(35) (mag) computed by fixing , and [M/H] to
“sparv” values from RAVE DR4;
(36) its uncertainty (mag) expressed as the rms of of the five deepest
points within the minimum.
Some remarks to Table 1. The uncertainties of APASS photometry reported in columns 8, 10, 12, 14, and 16 are the of the N independent measurements in that band, so that the error () on the reported magnitude should be computed as . When a ”-” sign precedes the value of , it means that less than N observations have been obtained in that specific band (in performing the procedure above described, we have assumed in such a case, equivalent to assume that only one observation was obtained in that band). When neither a valid Zwitter et al. (2010), nor a Binney et al. (2014) distance exists for a given RAVE star (as for the stars included in the first RAVE Data Release), its distance is set to 0 and consequently the corresponding slab reddening is null. The error in right ascension of APASS positions, expressed in arcsec, already takes into account the declination projection factor.
When 0.0 is listed as the rms of the five deepest points within the minimum for either or , it means these points differ only in the other fitted parameters (e.g. , [M/H], [/Fe]). Unless otherwise indicated (see above), in computing the columns of Table 1 , [M/H], and [/Fe] are let free to be fitted. Given the low sensitivity of broad band photometry to parameters other than and , we refrain from listing the fitting results for , [M/H] and [/Fe]. We plan to reconsider this point at a later time when (1) final APASS products will be released that will further reduce its already excellent photometric errors, (2) extension of APASS toward brighter saturation limits will enable to test the sensitivity to , [M/H] and [/Fe] on a much larger set of well studied standard stars than currently available (the vast majority of them are brighter than 10 mag).
7 Discussion
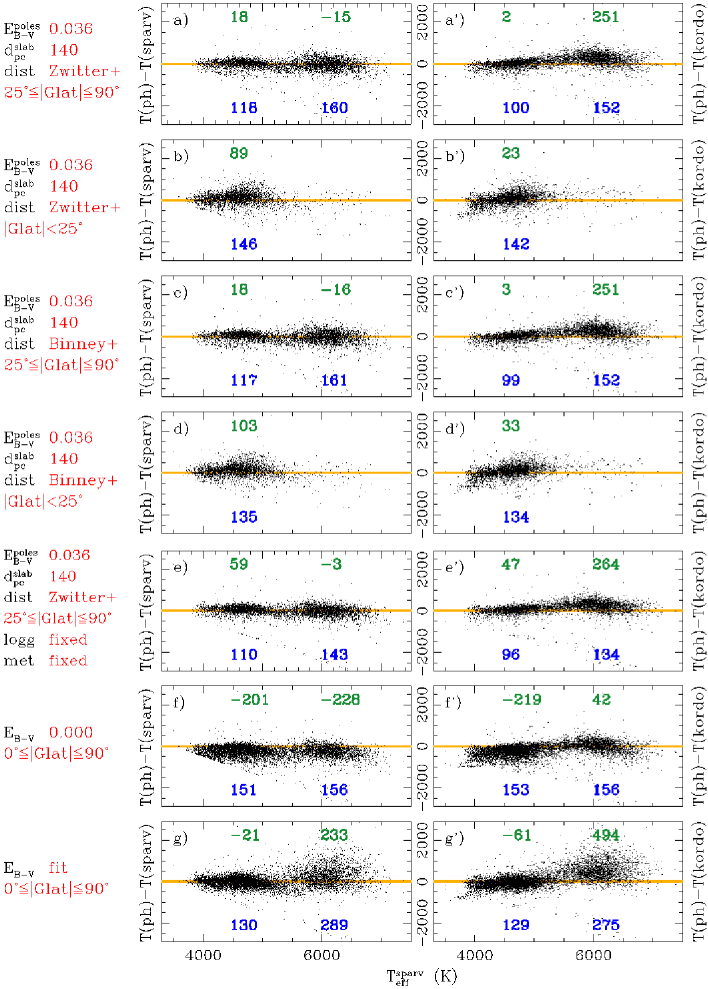
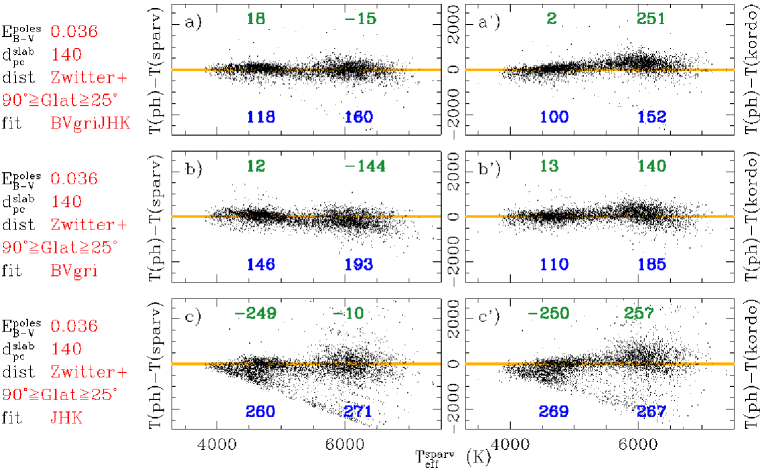
The temperature of RAVE stars obtained from photometry is compared in Figure 15 to spectroscopic temperature from RAVE DR4. Photometric and spectroscopic temperatures agree well.
In the top four rows of Figure 15, this comparison is carried out separately for stars above and below 25∘ in galactic latitude, which was the original limit of the RAVE survey to avoid the regions closer to the galactic plane where the reddening becomes relevant and increasingly patchy. The comparison is carried out separately for Zwitter et al. (2010) and Binney et al. (2014) distances to RAVE stars, and for the two different types of spectroscopic temperatures and derived in RAVE DR4.
To filter out outliers and lower quality data, the comparison between photometric and spectroscopic temperatures in Figure 15 is carried out only for stars with best RAVE and APASS data. Only stars with 4 or more independent APASS photometric observations and fainter than the 10 mag safe limit for saturation risk are considered. These stars are further filtered out so that their RAVE DR4 spectra (1) have S/N45, (2) provided valid atmospheric parameters (, , [M/H]) via both sparv and kordo pipelines, (3) passed the chemical analysis pipeline of Boeche et al. (2011), and (4) do not show peculiarities according to Matijevič et al. (2012) pipeline. About 51 000 stars are plotted in Figure 15.
For galactic latitudes , Figure 15 shows that there is a negligible bulk difference between photometric temperatures (assuming the slab reddening described above) and spectroscopic temperatures for both red-giant/red-clump (RC) and main-sequence/turn-off (MS/TO) stars, with no appreciable difference between Zwitter et al. (2010) and Binney et al. (2014) distances. Most of the RAVE stars are out of the dust slab, so their accurate distance does not matter here. The rms of the differences between photometric and spectroscopic temperature () is 118 K for RC stars and 160 K for MS/TO stars, which are comparable to the rms of spectroscopic temperatures derived independently from multiple RAVE spectra of the same star. The comparison between photometric and spectroscopic temperatures show a minimal bulk difference for RC stars and instead a substantial one for MS/TO stars, while in both cases the rms is similar to what found for . The effect of fixing and [M/H] to the spectroscopic values are explored in the fifth row of Figure 15 (panels , ). While somewhat reducing the rms for both RC and MS/TO stars, it introduces an offset of about 40 K for RC stars.
At lower Galactic latitudes (25∘), the simple slab reddening shows its limitation on RC stars by introducing some bulk difference between photometric and spectroscopic temperatures for both and , in addition to expanding the rms. At these low Galactic latitudes, compensation for reddening requires a more sophisticated approach, a true 3D model of the reddening distribution that will be derived elsewhere in this series.
The effect of assuming null reddening for RAVE stars is explored in row , of Figure 15. The net effect is to lower the temperature of both MS/TO and RC stars, because the redder energy distribution caused by extinction requires cooler stellar models to be fitted.
The last row of Figure 15 (panels ,), compares spectroscopic and photometric temperatures when all parameters are simultaneously fitted by the photometric data and no assumption on the reddening is done. The comparison is good for RC stars, with no significant offset (at least against ) and an rms similar to the cases when the reddening is fixed (first four rows of Figure 15). For MS/TO stars the so derived is instead unreliable, being characterized by a large offset and rms. The different behaviour between RC and MS/TO stars can be traced to the fact that the maximum of the energy distribution for RC stars falls well within the wavelength range covered by the APASS+2MASS photometric bands, while for hotter MS/TO stars this maximum tends to move to wavelengths shorter than covered by APASS+2MASS.
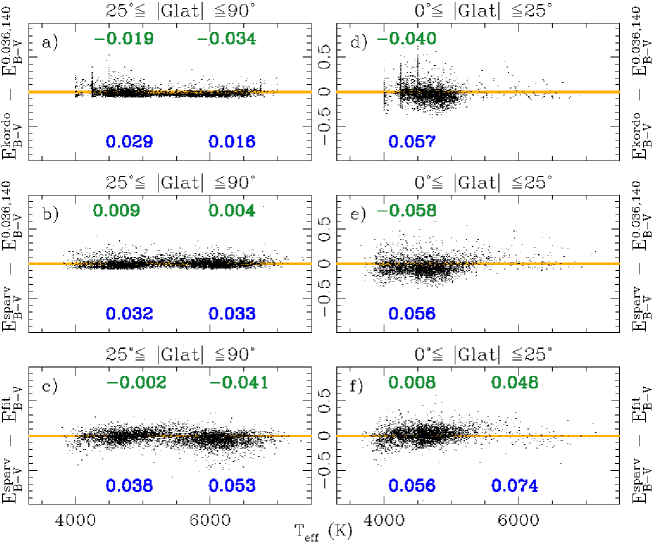
By adopting the atmospheric parameters from spectroscopy, the fit to returns the reddening. For RAVE DR4 stars this is explored in Figure 16.
At higher galactic latitudes sparv RAVE DR4 atmospheric parameters return a reddening which is very well in line with the slab reddening, as illustrated in panel of Figure 16. No trend is present and the offset is essentially null. Also kordo RAVE DR4 atmospheric parameters return a null trend (panel of Figure 16), with a smaller rms but an appreciable offset. Closer to the galactic plane (panels and of Figure 16) the comparison with the slab reddening shows the limitations of the slab approach already commented upon above. The last row of Figure 16 compares (separately for low and high galactic latitudes) the reddening derived by fixing the atmospheric parameters to the sparv values and the reddening obtained when the atmospheric parameters are fitted simultaneously with . As noted above for , the comparison is excellent for high galactic latitude RC stars, with a null trend and offset and only a marginal increase in rms. The comparison is less favorable for MS/TO stars and for low galactic latitude RC stars.
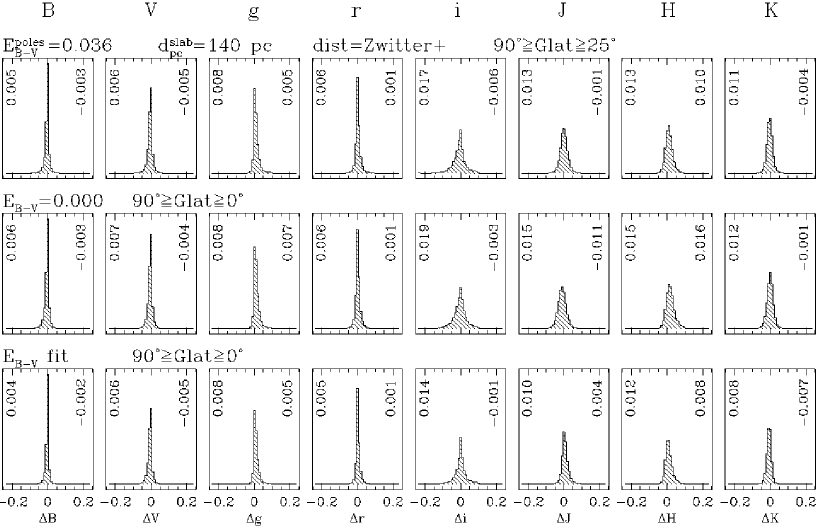
Figure 17 displays the distribution of the differences between the observed magnitudes and those of the best fitting synthetic stellar model, for three representative panels of Figure 15 (for other panels they look similar). It is not tricking how the distributions for optical bands are much sharper than those for infrared bands. This reflects the fact that optical bands carry more information (closer to the peak of the energy distribution and where the effect of the reddening is larger) than infrared bands, as well as the fact that the errors of 2MASS data are much larger than those for APASS (cf. Eq.1).
The much greater importance of optical bands compared to infrared ones in constraining the temperature and reddening of stars is reaffirmed in Figure 18. Here the same computation done for the first row of Figure 15 (its panels , are copied at the top of Figure 18 for comparison purposes), are repeated by fitting only the APASS optical data or only the 2MASS infrared data. It is quite obvious how in the case of optical-only data the overall picture is retained, while for IR-only data the fit is far less constrained.
8 Conclusions
The APASS all-sky, Landolt-Sloan ,,,, photometric survey now provides the missing broad-band optical photometric support to the RAVE spectroscopic survey, and coupled with 2MASS ,, infrared data, it offers a wide-wavelength coverage. The high astrometric and photometric accuracy of the APASS data has been verified on a large sample of standard and literature stars. With this first paper in the series, we provide ,,,, data for the stars included in the latest RAVE DR4 data release, and derive temperature and reddening for them under different conditions by fitting to a densely populated synthetic photometric library. The comparison of photometric and spectroscopic temperatures of RAVE stars shows a good agreement, so that photometric temperature can be either valid per se or as prior to spectroscopic analysis. RAVE stars at Galactic latitudes display an reddening quite well approximated by a slab distribution of the interstellar dust that is characterized by 140 pc extensions on either side of the Galactic plane and a reddening at the Galactic poles amounting to mag. Future papers in this series will focus on RAVE peculiar stars, on the 3D structure of interstellar reddening as constrained by the APASS+2MASS photometry of RAVE stars, and on the results of the APASS extention to brighter magnitude limits and additional , and photometric bands.
References
- Abt (2011) Abt, H. A. 2011, AJ, 141, 165
- Albrecht et al. (1980) Albrecht R., Maitzen H. M., 1980, A&AS, 42, 9
- Allen (1983) Allen D. A., 1983, MNRAS, 204, 113
- Appenzeller (1975) Appenzeller I., 1975, A&A, 38, 313
- Berdyugin et al. (2001) Berdyugin A., Teerikorpi P., 2001, A&A, 368, 635
- Berdyugin et al. (2004) Berdyugin A., Piirola V., Teerikorpi P., 2004, A&A, 424, 873
- Bessell (1990) Bessell, M. S. 1990, PASP, 102, 1181
- Bessell & Murphy (2012) Bessell M., Murphy S., 2012, PASP,124, 140
- Binney et al. (2014) Binney J., et al., 2014, MNRAS, 437, 351
- Boeche et al. (2011) Boeche C., et al., 2011, AJ, 142, 193
- Bohlin & Gilliland (2004a) Bohlin R. C., Gilliland R. L., 2004, AJ, 127, 3508
- Bohlin & Gilliland (2004b) Bohlin, R. C., & Gilliland, R. L. 2004, AJ, 128, 3053
- Bond et al. (1971) Bond H. E., Perry C. L., Bidelman W. P., 1971, PASP, 83, 643
- Burstein & Heiles (1978) Burstein D., Heiles C., 1978, ApJ, 225, 40
- Cardelli et al. (1989) Cardelli J. A., Clayton G. C., Mathis J. S., 1989, ApJ, 345, 245
- Castelli & Kurucz (2003) Castelli F., Kurucz R. L., 2003, IAUS, 210, 20P
- Eggen (1995) Eggen O. J., 1995, AJ, 109, 2229
- Fiorucci & Munari (2003) Fiorucci M., Munari U., 2003, A&A, 401, 781
- Fitzpatrick (1999) Fitzpatrick E. L., 1999, PASP, 111, 63
- Fukugita et al. (1996) Fukugita M., Ichikawa T., Gunn J. E., Doi M., Shimasaku K., Schneider D. P., 1996, AJ, 111, 1748
- Golay (1974) Golay M., 1974, Introduction to Astronomical Photometry, Reidel Publishing Co.
- Knude (1977) Knude J. K., 1977, ApL, 18, 115
- Kordopatis et al. (2013) Kordopatis G., et al., 2013, AJ, 146, 134
- Henden & Munari (2000) Henden, A., Munari, U. 2000, A&AS 143, 343
- Henden & Munari (2001) Henden, A., Munari, U. 2001, A&A 372, 145
- Henden & Munari (2006) Henden, A., Munari, U. 2006, A&A 458, 339
- Henden & Munari (2014) Henden, A., Munari, U. 2014, in ”Observing techniques, instrumentation and science for metre-class telescopes”, T. Pribulla and R. M. Komzik eds., Contrib. Astron. Obs. Skalnate Pleso 43, 518
- Henden et al. (2014) Henden, A. et al. 2014, AJ, to be submitted
- Hillenbrand et al. (2002) Hillenbrand L. A., Foster J. B., Persson S. E., Matthews K., 2002, PASP, 114, 708
- Heiles (1976) Heiles C., 1976, ApJ, 204, 379
- Holmberg (1974) Holmberg E. B., 1974, A&A, 35, 121
- Landolt (2009) Landolt A. U., 2009, AJ, 137, 4186
- Lynga (1979) Lynga G., 1979, IAUS, 84, 87
- Matijevič et al. (2012) Matijevič G., et al., 2012, ApJS, 200, 14
- McFadzean et al. (1983) McFadzean A. D., Hilditch R. W., Hill G., 1983, MNRAS, 205, 525
- Mermilliod & Mermilliod (1994) Mermilliod J.-C., Mermilliod M., 1994, Catalogue of Mean UBV Data on Stars, Springer-Verlag, New York
- Moro & Munari (2000) Moro D., Munari U., 2000, A&AS, 147, 361
- Munari et al. (2005) Munari U., Sordo R., Castelli F., Zwitter T., 2005, A&A, 442, 1127
- Munari et al. (2012) Munari U., et al., 2012, BaltA, 21, 13
- Munari et al. (2014) Munari U., Henden A., Frigo A., 2014, NewA, 27, 1
- Munari & Moretti (2012) Munari U., Moretti S., 2012, BaltA, 21, 22
- Nicolet (1982) Nicolet B., 1982, A&AS, 47, 199
- Philip (1973) Philip A. G. D., 1973, IAUS, 52, 263
- Ramírez et al. (2006) Ramírez I., Allende Prieto C., Redfield S., Lambert D. L., 2006, A&A, 459, 613
- Ruchti et al. (2010) Ruchti G. R., et al., 2010, ApJ, 721, L92
- Ruchti et al. (2011a) Ruchti G. R., et al., 2011a, ApJ, 737, 9
- Ruchti et al. (2011b) Ruchti G. R., et al., 2011b, ApJ, 743, 107
- Savage & Mathis (1979) Savage B. D., Mathis J. S., 1979, ARA&A, 17, 73
- Siebert et al. (2011) Siebert A., et al., 2011, AJ, 141, 187
- Sharon et al. (2010) Sharon C., Hillenbrand L., Fischer W., Edwards S., 2010, AJ, 139, 646
- Smith et al. (2002) Smith, J.A., Tucker, D.L., Kent, S. et al. 2002, AJ 123, 2121
- Soubiran et al. (2010) Soubiran C., Le Campion J.-F., Cayrel de Strobel G., Caillo A., 2010, A&A, 515, A111
- Steinmetz et al. (2006) Steinmetz M., et al., 2006, AJ, 132, 1645
- Straizys & Kavaliauskaite (1967) Straizys V., Kavaliauskaite G., 1967, VilOB, 20, 3
- Straižys (1995) Straižys V. 1995, Multicolor Stellar Photometry, Pachart Publishing House
- de Vaucouleurs & Buta (1983) de Vaucouleurs G., Buta R., 1983, AJ, 88, 939
- Williams et al. (2011) Williams M. E. K., et al., 2011, ApJ, 728, 102
- Wylie de Boer et al. (2012) Wylie de Boer E., Freeman K., Williams M., Steinmetz M., Munari U., Keller S., 2012, ApJ 755, 35
- Zwitter et al. (2008) Zwitter T., et al., 2008, AJ, 136, 421
- Zwitter et al. (2010) Zwitter T., et al., 2010, A&A, 522, A54