Does the stellar distribution flare?
A comparison of stellar scale heights with LAB H i data
Abstract
The question, whether the stellar populations in the Milky Way take part in flaring of the scale heights as observed for the H i gas is a matter of debate. Standard mass models for the Milky Way assume a constant scale height for each of the different stellar distributions. However, there is mounting evidence that at least some of the stellar distributions reach at large galactocentric distances high altitudes that are incompatible with a constant scale height. We discuss recent observational evidence for stellar flaring and compare it with H i data from the Leiden/Argentine/Bonn (LAB) survey. Within the systemic and statistical uncertainties we find a good agreement between both.
1 Introduction
Observations of the H i gas distribution in the Milky Way galaxy have shown early that the H i distribution is warped (Westerhout, 1962). Furthermore the scale height of the density distribution increases systematically with galactocentric radius (Lozinskaya & Kardashev, 1963). Because of the strength of this effect this phenomenon was described as flaring. Yet, for the stars the situation appeared to be different. A constant scale height was reported by most of the observers.
Flaring of H i gas is a natural phenomenon revealing the radial mass distribution of the Milky Way galaxy. Considering the barometric equation, the gravitational force balances gas pressure and turbulent motions. Pressure and turbulence can be characterized by the velocity dispersion of the objects under consideration as a function of . It is well established fact that the surface density distributions of stars and gas in most of the galaxies decrease exponentially with (Freeman, 1970; Bigiel & Blitz, 2012). Consequently, the gravitational forces perpendicular to the plane decrease with . Since the velocity dispersion of the H i gas distribution is approximately independent on (e.g. Spitzer, 1968) the associated scale height of the gas increases exponentially with .
Lozinskaya & Kardashev (1963) were the first to describe warp and flaring of the H i gas in detail. They also noted that stars do not share the gaseous flaring and deduced from this different behavior that flaring cannot be caused by gravitational effects. Alternatively they proposed that regular magnetic fields cause the gaseous flaring. Today we know that the magnetic fields are oriented predominantly parallel to the Galactic plane, on average with a strength of a few G (Beck & Wielebinski, 2013). X-shaped halo fields are sometimes observed, indicating an opening of the field lines with similar to the flaring H i layer. An unambiguous proof that magnetic forces cause the H i layer to flare is still missing (Gressel et al., 2013).
Next to the distribution of the baryonic matter flaring might be also affected by the dark matter distribution. Olling (1995) demonstrated that the shape of the flaring H i layer is affected by the flattening of the dark matter component. Olling & Merrifield (2000, 2001), later Narayan & Jog (2002); Kalberla (2003); Narayan et al. (2005) and Kalberla et al. (2007) applied this basic idea to model the Milky Way mass distribution using full-sky H i data. According to these investigations it became evident that also stellar flaring is expected to be observed (Jog, 2007). Olling & Merrifield (2000, 2001) assumed constant scale heights for the stellar distribution and note that their results do not depend on details of the vertical distribution. Contrary to that Kalberla (2003) and Kalberla et al. (2007) found interrelations between the scale heights of all model components. Vertical changes in the mass distribution affect the scale heights of the other components. Their aim was eventually to match the mass model to the observed H i flaring. Several axisymmetric spheroidal halo models were considered but neither oblate nor prolate models fitted at the same time all observations; the solutions were found to depend on the radial scales considered. The best fit was obtained with an isothermal dark matter distribution in a thick disk and an associated ring in the Galactic plane at kpc. Such an axisymmetric model is certainly only an approximation because it is evident from the H i distribution that towards the southern sky (approximately in direction to the Magellanic System) there is more gas and baryonic mass (Kalberla et al., 2007; Kalberla & Dedes, 2008). These findings agree well with the orientation of the minor axis of the triaxial mass distribution derived by Law et al. (2009).
So-far the stellar distributions appear to behave differently. The constant scale height of stars (van der Kruit & Searle, 1982) demands an exponential fall-off of the velocity dispersion proportional to (Lewis & Freeman, 1989). This, however, is hard to understand physically since the radial decrease in surface density needs precisely to be compensated by the fall-off of the stellar vertical velocity dispersion (van der Kruit & Freeman, 2011, see Sect. 3.2.3 for discussion).
2 Evidence for flaring from observations
2.1 Preliminaries
The determination of scale heights depends on the determination of distances to the objects under consideration. The distance scale is tied to . Here we use kpc, the standard value used for stellar data in the publications mentioned below.
From the barometric equation, the flaring amplitude at a particular position depends on the velocity dispersion of the component under investigation. Accordingly, to quantify flaring, one needs to distinguish between the underlying disk populations (either thin or thick) since they are characterized by different velocity dispersions. Both components may have different radial scale lengths and a mix could therefore mimic a pseudo-flaring. We distinguish between thin and thick disk components in the further discussion.
H i distances are derived as kinematical distances and depend on the rotation curve used, hence on the Galactic mass model. For stellar distance determination photometric distances are mostly used. Using the luminosity function (Wainscoat et al., 1992) the differential star counts along the line of sight can be converted to space densities. Star counts need to be corrected for extinction. The completeness of the sample and selection effects need to be investigated carefully. Moreover one needs to investigate potential signatures for a warp. Such details have been taken into account by the publications discussed below but will not be subject of our paper.
2.2 H i and CO
Observations of the H i gas in the outer part of the Milky Way have shown early on significant changes of the scale heights with radius . Burton (1976) derived for kpc the flaring relation . For the flaring in H i is about a factor of two stronger compared to heights used by Gyuk et al. (1999, see Sect. LABEL:intro); Reylé et al. (2009, see Sect. LABEL:intro); Polido et al. (2013, see Sect. LABEL:intro).
2.3 Cepheids
Feast et al. (2014, F14) report the detection of five classical Cepheid stars towards the Galactic bulge at kpc above the plane. Distances were derived from the well-calibrated period-luminosity relationship. These stars were observed in two colors, so that their distances and reddenings could be determined simultaneously. The puzzling result however is that these massive young stars (age years) are located such high above the Galactic plane. Because they are observed towards both Galactic hemispheres this finding is interpreted as a strong indication for stellar flaring at distances of kpc. Feast et al. (2014) conclude that the derived heights are consistent with H i flaring according to Kalberla et al. (2007).
2.4 2MASS
2.4.1 The thin disk
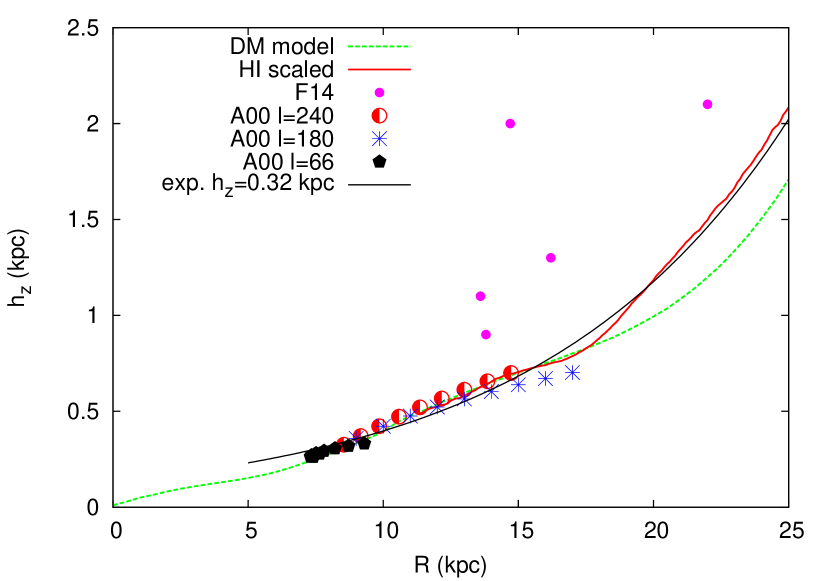
Alard (2000, A00) was the first to report on evidence for the flaring of stars but his contribution remains unpublished. He analyzed three stripes of 2MASS data oriented perpendicular to the Galactic plane with towards the longitudes and . stars in 169 lines of sight were analyzed. We plot the results in Fig. 1.
2.4.2 The old stellar population
Lopez-Corredoira et al. (2002, LC02) selected two well-defined samples for the determination of stellar flaring, red clump giants and old disk stars, limited in apparent K band magnitude to 14.0. Young stars and spiral arms were avoided. 2MASS data were used within distances kpc. The basic assumption was that their sample is dominated by the old disk population. A relaxed distribution is expected with well defined scale heights.
2.4.3 Red clump and red clump giant stars
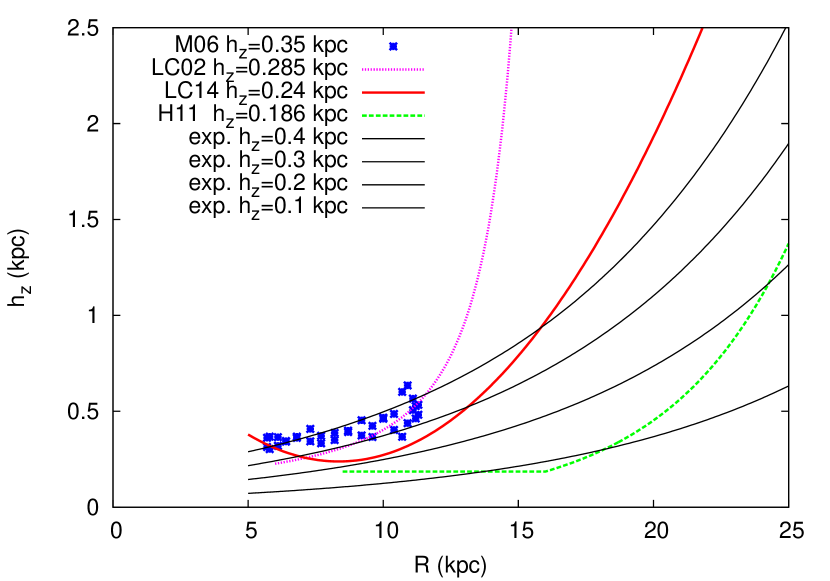
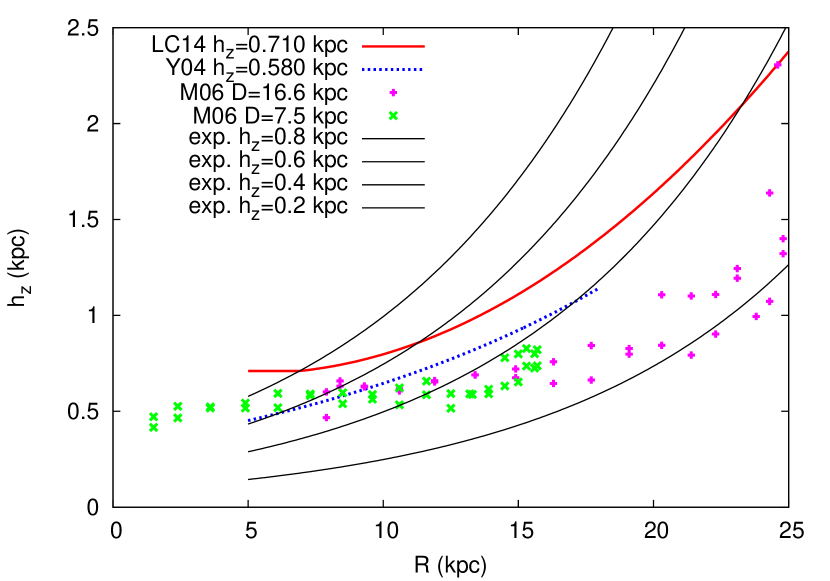
Momany et al. (2006, M06) used 2MASS red clump and red clump giant stars, selected at fixed heliocentric distances and 16.6 kpc. These objects are good standard candles for estimating distances and were chosen under the assumption that they may suffer least external contamination by nearby dwarfs. The authors find indications for a stellar flaring but did not attempt to parametrize it. We therefore show their data in Figs. 2 and 3. While the kpc sample appears to be more representative for the thin disk ( kpc), the and 16.6 kpc sample shows a flaring with an intermediate local scale height of kpc, more characteristic for the thick disk.
2.5 SDSS
Hammersley & López-Corredoira (2011, H11) used stars of type F8V to G5V from Sloan-Digital Sky Survey (SDSS) data release DR7 (Abazajian et al., 2009). Five fields for and were chosen. They modeled the thin disk assuming an admixture from the thick disk (density 9% of that of the thin disk) with a common flare for both components according to
| (2) |
For kpc they obtained a flare with a radial scale length kpc. Local thin and thick disk scale heights were fixed to kpc and kpc. The corresponding thin disk flaring curve is plotted in Fig. 2.
2.6 SDSS-SEGUE
Lopez-Corredoira & Molgo (2014, LC14) used stars of type F8V-G5V from the SDSS - Sloan Extension for Galactic Understanding and Exploration (SDSS-SEGUE) constrained to kpc and kpc. To avoid strong extinction within the Galactic plane, they used only stars within . The radial scale length and the local scale heights for thin and thick disk were fitted in regions with kpc, kpc. For a second order flaring fit all regions with kpc, kpc were used. They obtain
| (3) |
with local scale heights kpc and kpc for kpc. We plot the results in Fig. 2 and 3.
2.7 Pulsars
Yusifov (2004, Y04) analyzed 1412 Pulsars from the ATNF database (Manchester et al., 2005). Distances to the pulsars are estimated from the observed dispersion measure and a model of the free electron distribution in the Milky Way (Cordes & Lazio, 2002). It is currently assumed that such distances are accurate to 30%.
3 Comparing flaring data
In Fig. 1 we plot exponential scale heights derived by Alard (2000, A00) in comparison to the LAB H i flaring of Kalberla et al. (2007). To allow a direct comparison we scale the gaseous flaring curve to the scale height of the thin stellar disk. A similar ansatz was implicitly used by Feast et al. (2014) to prepare their Fig. 1. This approach (red line in Fig. 1, plotted only for kpc) is model independent.
The flaring derived from the best fit mass model by Kalberla et al. (2007) is marked by the green dashed line. The agreement of the observed H i scale heights with this mass model is good for kpc. At larger distances the H i data show a considerable scatter with systematic deviations between the northern and southern hemisphere, while the model is axisymmetric (Kalberla & Dedes, 2008, Fig. 4). For kpc the agreement of the stellar flaring from Alard (2000) with the scaled H i data is excellent, suggesting a common origin for both. Even the dip at kpc, attributed to the presence of a massive ring in the mass model of Kalberla et al. (2007), is consistently visible in both data sets. The dark matter disk and ring model was constructed to model details of the H i gas distribution in the Milky Way, in particular the observed flaring.
The positions of the Cepheids (Feast et al., 2014, F14) were included in Fig. 1 for comparison. They are located at radial distances 22 to 30 kpc beyond the Galactic center region. Obscuration may be considerable, which reduces the observability of Cepheids at lower . It needs to be taken into account that the 2MASS data points represent the scale heights derived for an ensemble of objects, while the Cepheid data are merely from five individual objects. Alard (2000) analyzed in total stars, this explains that his data points show a smooth flaring distribution, essentially without any scatter.
The Alard (2000) sample is by far the largest sample available to us while the Feast et al. (2014) Cepheid sample is rather restricted but has well defined distances. Next we discuss the other observations.
3.1 A common flaring model for stars and gas?
Because the best fit mass model derived from the gaseous flaring by Kalberla et al. (2007); Kalberla & Dedes (2008) is not generally accepted we focus our discussion in the following on a simple exponential flaring as proposed by Kalberla & Kerp (2009, Sect. 3.1.4).
| (5) |
with kpc fits the global H i flaring for kpc well. This relation is based on the finding that the H i distribution in the Milky Way shows an exponential decline with radius for both, surface density and mid-plane volume density . For such a double exponential distribution, needs also to be exponential.
If stars flare in a similar way as the H i gas, Equation 5 should apply to all stellar populations, regardless of the local scale height . We intend to test this hypothesis. In the following we distinguish between observations from the thin and thick stellar disk. According to Dehnen & Binney (1998) the thin disk has a scale height of kpc, the thick disk of kpc. For the further discussion we have chosen to separate thin and thick disk data according to the gap in scale heights of our sample at kpc.
In Fig. 2 we plot the exponential approximation for and 0.4 kpc according to Equation 5 to cover a range that is characteristic for the thin stellar disk. We compare this with flaring fits according to Hammersley & López-Corredoira (2011, H11) for kpc, Lopez-Corredoira & Molgo (2014, LC14) for kpc, and Lopez-Corredoira et al. (2002, LC02) for kpc. There is a common trend that stellar flaring at large galactocentric distance is much stronger than expected from Equation 5. In Fig. 2 we add data from Momany et al. (2006, M06) for kpc which cover a restricted range only but are within the uncertainties consistent with the H i flaring.
In Fig. 3 we indicate a set of exponential flaring curves for scale heights of and 0.8 kpc (black lines). Shown are also observational fits from Yusifov (2004, Y04) (blue dotted), and Lopez-Corredoira & Molgo (2014, LC14) (red). Data points are from Momany et al. (2006, M06). We find a general trend that is in opposite to Fig. 2. The observed flaring at large radial distances falls below the expectations.
From our working hypothesis that stars share the gaseous flaring which was supported by Alard (2000) and Feast et al. (2014) we come to the striking result that stellar flaring appears to depend on the scale height of the objects. Thin disk populations show a very strong flaring for large distances while thick disk stars are in this range below the expectations.
The velocity dispersion of the H i gas is on average constant. The exponential flaring curves according to Equation 5 apply therefore to the isothermal case const. Taking the results from Figs. 2 & 3 at face value, it is evident from the barometric equation that the velocity dispersions for the thin disk populations from our sample must increase with while for the thick disk populations a decrease is necessary.
It is beyond the scope of this paper to discuss in detail uncertainties and possible systematical errors in the determination of stellar flaring. Figure 5 of Lopez-Corredoira & Molgo (2014) may be characterizing the situation best; the uncertainties are very significant and there is a cross-over for the thin and thick disk flaring curves at kpc. It is in general difficult to disentangle thin and thick disk objects at large radial distances . It is possible that at large distances the thin disk gets increasingly contaminated by thick disk stars, and opposite the observed thick disk by thin disk stars. Mixing up the contributions could lead to biases but it would be a surprise that most of the investigations that went into Figs. 2 and 3 are affected by similar problems.
4 Discussion
The question, whether stellar flaring needs to be included in Galactic mass models is controversial since decades (Rohlfs & Kreitschmann, 1981). The most recent mass models still assume that the stellar disk has a constant scale height independent of galactocentric radius (e.g. Dehnen & Binney, 1998; Olling & Merrifield, 2000, 2001; Klypin et al., 2002; McMillan, 2011). Flaring was explicitly disregarded in recent empirical modeling of the Milky Way disk (Sharma & Bland-Hawthorn, 2013). The authors state: “The choice of the radial dependence is motivated by the desire to produce discs in which the scale height is independent of radius”. The same constraint was applied to recent investigations of the kinematic parameters of the Milky Way disk using the Radial Velocity (RAVE) and Geneva-Copenhagen (GCS) stellar surveys (Sharma et al., 2014). Here we like to scrutinize the constant scale height paradigm.
Considering the gaseous components, a major source of uncertainty stems from unknown contributions due to the pressure support from magnetic fields and cosmic rays (Lockman & Gehman, 1991). Boulares & Cox (1990) studied such contributions for a magnetic field perpendicular to the Galactic plane. On large scales the fields are however found to be predominantly parallel to the plane (Beck & Wielebinski, 2013). Therefore we expect that magnetic fields are important only for local fluctuations in H i scale heights, e.g. related to supernova remnants. Observational evidence for a common flaring of stars and gas disfavor the magnetic field hypothesis by Lozinskaya & Kardashev (1963) immediately.
In summary, we obtain compelling evidence for a common flaring of gas and stars in the Milky Way galaxy. H i, Cepheids, 2MASS, SDSS, and Pulsar data show all consistently increasing scale heights proportional to . Flaring at large distances from the Galactic center appears to be strong for the thin disk but weaker for the thick stellar disk. Whether or not this indicates distinct different kinematical properties concerning the associated velocity dispersions of thin and thick disk stars is an interesting but open question.
References
- Abazajian et al. (2009) Abazajian, K. N., Adelman-McCarthy, J. K., Agüeros, M. A., et al. 2009, ApJS, 182, 543
- Alard (2000) Alard, C., 2000, astro-ph/0007013
- Beck & Wielebinski (2013) Beck, R., & Wielebinski, R. 2013, Planets, Stars and Stellar Systems. Volume 5: Galactic Structure and Stellar Populations, 641
- Bigiel & Blitz (2012) Bigiel, F., & Blitz, L. 2012, ApJ, 756, 183
- Boulares & Cox (1990) Boulares, A., & Cox, D. P. 1990, ApJ, 365, 544
- Bronfman et al. (1988) Bronfman, L., Cohen, R. S., Alvarez, H., May, J., & Thaddeus, P. 1988, ApJ, 324, 248
- Burton (1976) Burton, W. B. 1976, ARA&A, 14, 275
- Cordes & Lazio (2002) Cordes, J. M., & Lazio, T. J. W. 2002, arXiv:astro-ph/0207156
- Dehnen & Binney (1998) Dehnen, W. & Binney, J. 1998, MNRAS, 294, 429
- Feast et al. (2014) Feast, M. W., Menzies, J. W., Matsunaga, N., & Whitelock, P. A. 2014, Nature, 509, 342
- Freeman (1970) Freeman, K. C. 1970, ApJ, 160, 811
- Gressel et al. (2013) Gressel, O., Elstner, D., & Ziegler, U. 2013, A&A, 560, A93
- Gyuk et al. (1999) Gyuk, G., Flynn, C., & Evans, N. W. 1999, ApJ, 521, 190
- Hammersley & López-Corredoira (2011) Hammersley, P. L., & López-Corredoira, M. 2011, A&A, 527, A6
- Jog (2007) Jog, C. J. 2007, Island Universes - Structure and Evolution of Disk Galaxies, 137
- Kalberla (2003) Kalberla, P. M. W. 2003, ApJ, 588, 805
- Kalberla et al. (2005) Kalberla, P. M. W., Burton, W. B., Hartmann, D., et al. 2005, A&A, 440, 775
- Kalberla et al. (2007) Kalberla, P. M. W., Dedes, L., Kerp, J., & Haud, U. 2007, A&A, 469, 511
- Kalberla & Dedes (2008) Kalberla, P. M. W., & Dedes, L. 2008, A&A, 487, 951
- Kalberla & Kerp (2009) Kalberla, P. M. W., & Kerp, J. 2009, ARA&A, 47, 27
- Klypin et al. (2002) Klypin, A., Zhao, H., & Somerville, R. S. 2002, ApJ, 573, 597
- Law et al. (2009) Law, D. R., Majewski, S. R., & Johnston, K. V. 2009, ApJ, 703, L67
- Lewis & Freeman (1989) Lewis, J. R., & Freeman, K. C. 1989, AJ, 97, 139
- Lockman & Gehman (1991) Lockman, F. J., & Gehman, C. S. 1991, ApJ, 382, 182
- Lopez-Corredoira et al. (2002) López-Corredoira, M., Cabrera-Lavers, A., Garzón, F., & Hammersley, P. L. 2002, A&A, 394, 883
- Lopez-Corredoira & Molgo (2014) Lopez-Corredoira, M., & Molgo, J. 2014, A&A, in press, arXiv:1405.7649
- Lozinskaya & Kardashev (1963) Lozinskaya, T. A., & Kardashev, N. S. 1963, Soviet Ast., 7, 161
- Malhotra (1994) Malhotra, S. 1994, ApJ, 433, 687
- Manchester et al. (2005) Manchester, R. N., Hobbs, G. B., Teoh, A., & Hobbs, M. 2005, AJ, 129, 1993
- McMillan (2011) McMillan, P. J. 2011, MNRAS, 414, 2446
- Momany et al. (2006) Momany, Y., Zaggia, S., Gilmore, G., Piotto, G., Carraro, G., Bedin, L. R., & de Angeli, F. 2006, A&A, 451, 515
- Narayan & Jog (2002) Narayan, C. A., & Jog, C. J. 2002, A&A, 394, 89
- Narayan et al. (2005) Narayan, C. A., Saha, K., & Jog, C. J. 2005, A&A, 440, 523
- Olling (1995) Olling, R. P. 1995, AJ, 110, 591
- Olling & Merrifield (2000) Olling, R. P. & Merrifield, M. R. 2000, MNRAS, 311, 361
- Olling & Merrifield (2001) Olling, R. P. & Merrifield, M. R. 2001, MNRAS, 326, 164
- Polido et al. (2013) Polido, P., Jablonski, F., & Lépine, J. R. D. 2013, ApJ, 778, 32
- Reylé et al. (2009) Reylé, C., Marshall, D. J., Robin, A. C., & Schultheis, M. 2009, A&A, 495, 819
- Rohlfs & Kreitschmann (1981) Rohlfs, K., & Kreitschmann, J. 1981, Ap&SS, 79, 289
- Sharma et al. (2014) Sharma, S., Bland-Hawthorn, J., Binney, J., et al. 2014, arXiv:1405.7435
- Sharma & Bland-Hawthorn (2013) Sharma, S., & Bland-Hawthorn, J. 2013, ApJ, 773, 183
- Spitzer (1968) Spitzer, L. 1968, New York: Interscience Publication, 1968,
- van der Kruit & Searle (1982) van der Kruit, P. C., & Searle, L. 1982, A&A, 110, 61
- van der Kruit & Freeman (2011) van der Kruit, P. C., & Freeman, K. C. 2011, ARA&A, 49, 301
- Wainscoat et al. (1992) Wainscoat, R. J., Cohen, M., Volk, K., Walker, H. J., & Schwartz, D. E. 1992, ApJS, 83, 111
- Westerhout (1962) Westerhout, G. 1962, Problems of Extra-Galactic Research, 15, 70
- Wouterloot et al. (1990) Wouterloot, J. G. A., Brand, J., Burton, W. B., & Kwee, K. K. 1990, A&A, 230, 21
- Yusifov (2004) Yusifov, I. 2004, The Magnetized Interstellar Medium, 165