22email: hspm@ph1.uni-koeln.de
Laboratory spectroscopy of 1,2-propanediol at millimeter and submillimeter wavelengths††thanks: Full Table 4 and Tables 56 as well as full text file aG’g.txt and text files gG’a.txt and g’G’g.txt are only available in electronic form at the CDS via anonymous ftp to cdsarc.u-strasbg.fr (130.79.128.5) or via http://cdsweb.u-strasbg.fr/cgi-bin/qcat?J/A+A/
Abstract
Context. Ethanediol is one of the largest complex organic molecules detected in space thus far. It has been found in different types of molecular clouds. The two propanediol isomers are the next larger diols. Hence, they are viable candidates to be searched for in space.
Aims. We wish to provide sufficiently large and accurate sets of spectroscopic parameters of 1,2-propanediol to facilitate searches for this molecule at millimeter and longer submillimeter wavelengths.
Methods. We recorded rotational spectra of 1,2-propanediol in three wide frequency windows between 38 and 400 GHz.
Results. We made extensive assignments for the three lowest energy conformers to yield spectroscopic parameters up to eighth order of angular momentum.
Conclusions. Our present data will be helpful for identifying 1,2-propanediol at moderate submillimeter or longer wavelengths with radio telescope arrays such as ALMA, NOEMA, or EVLA. In particular, its detection with ALMA in sources, in which ethanediol was detected, appears to be promising.
Key Words.:
molecular data; methods: laboratory: molecular; techniques: spectroscopic; ISM: molecules1 Introduction
The presence of molecular complexity in space has attracted considerable interest in the field of astrochemistry because of the question of the origin and evolution of life in the Universe. Laboratory spectroscopic data in the millimeter and submillimeter domains for the unique identification of large complex molecules are needed to interpret the ongoing spectral surveys of star-forming regions and young stellar objects.
Ethanediol, (CH2OH)2, also known as ethylene glycol, is one of the largest complex organic molecules detected in space to date, see, for example, the Cologne Database for Molecular Spectroscopy (CDMS) (Müller et al. 2001, 2005).111Internet address: http://www.astro.uni-koeln.de/cdms/molecules Ethanediol was detected first in the massive and luminous Galactic center source Sagittarius B2(N), Large Molecule Heimat (Sgr B2(N-LMH) for short) (Hollis et al. 2002). There is also strong evidence of ethanediol in three less-evolved molecular clouds in the Galactic center (Requena-Torres et al. 2008). Very recently, it was also detected in the hot corinos associated with the class 0 protostars NGC 1333-IRAS2A Maury et al. (2014) and, tentatively, IRAS 16293-2422B (Jørgensen et al. 2012). Finally, ethanediol was also found to be abundant in the outflows of comet Hale-Bopp (Crovisier 2004).
Even though ethanediol may exist in several distinct conformations, only two of them have been identified in the laboratory by using rotational spectroscopy (Christen et al. 1995, 2001; Christen & Müller 2003; Müller & Christen 2004), with the higher energy conformer estimated to be 2.5 kJ mol-1 (300 K) above the lowest one. Therefore, astronomical detections of ethanediol reported in the literature thus far only refer to the lowest energy conformer. The rotational spectra of both conformers display strong rotation-tunneling interaction caused by two equivalent minima on the potential energy surfaces. Molecular beam Fourier transform microwave spectroscopy (MB-FTMW) and microwave-microwave double resonance were required to achieve initial assignments (Christen et al. 1995, 2001), which paved the way for later experimental investigations at millimeter and submillimeter wavelengths (Christen & Müller 2003; Müller & Christen 2004).
Investigating propanediol constitutes the next step toward understanding the molecular complexity in space since it is a structural analog of ethanediol by replacing a hydrogen atom that is bound to a carbon atom with a methyl group. Moreover, comparing the relative abundance of ethanediol and its derivatives (e.g., propanediol) can provide insights into the formation routes of theses molecules and the chemical evolution of objects in which they are detected. However, care is needed since column densities of molecules tend to decrease with increasing complexity.
Two stable isomers of propanediol are known to date, 1,2-propanediol (CH3CHOHCH2OH) with the OH groups at two adjacent carbon atoms, and 1,3-propanediol (CH2OHCH2CH2OH) with the OH groups at the outer carbon atoms. The conformational landscape of both isomers has been thoroughly investigated quite recently by using both FTMW spectroscopy and quantum chemical calculations (Lovas et al. 2009; Plusquellic et al. 2009). Only two conformers were found experimentally for 1,3-propanediol, which both displayed tunneling caused by two equivalent minima on the potential energy surfaces (Plusquellic et al. 2009). Other conformers were calculated to be at least 600 K higher in energy, except for one that was calculated to be about 400 K higher in energy, but with a rather small dipole moment. The lowest energy conformer was studied before by using free-jet absorption microwave spectroscopy (Caminati et al. 1995). Very recently, Smirnov et al. (2013) performed extensive millimeter measurements, analyzed the rotation-tunneling interaction in the spectra of both conformers, and provided the spectroscopic basis to search for 1,3-propanediol in space by radio astronomy.
For 1,2-propanediol, seven conformers were identified using FTMW spectroscopy, three of which are relatively low and close in energy (Lovas et al. 2009). Lovas et al. (2009) also carried out quantum-chemical calculations on a variety of conformers, which included determining the relative energies, quartic centrifugal distortion parameters, and dipole moment components; experimental dipole values were determined for three conformers. The lowest energy conformer as well as two slightly higher energy forms had been studied to some extent before (Lockley et al. 2002; Caminati 1981). None of the conformers displayed rotation-tunneling splitting. Interestingly, rotational transitions of the lowest energy conformer were used very recently to demonstrate that FTMW spectroscopy can be used to determine the enantiomeric composition of a chiral molecule (Patterson et al. 2013). Three-wave mixing was employed to create phase differences between the two enantiomers that were detected by FTMW.
We investigated the rotational spectra of the three lowest energy conformers of 1,2-propanediol at millimeter and submillimeter wavelengths to permit searching for them in space by radio astronomical means.
2 Experimental details
The present experimental conditions are quite similar to those employed for the lower frequency measurements (up to 230 GHz) of n-butyl cyanide Ordu et al. (2012). Spectra were recorded in three frequency bands (3870, 200230, and 297400 GHz). The fundamental frequency sources were computer-controlled sweep synthesizers that were referenced to a rubidium atomic clock. An Agilent E8257D sweeper was used as a direct frequency source to record lines up to 70 GHz. The RF output from a microwave generator (Rohde & Schwarz SMF 100A; maximum frequency 43 GHz) was multiplied up to the desired frequency with cascaded multipliers from Virginia Diodes, Inc. (VDI). Factors of 16 and 21 were employed for the bands starting at 200 and 297 GHz. Both synthesizers enable quasi-continuous tuning in freely adjustable frequency increments of typically some kilohertz. DC-biased room-temperature Schottky diodes were used as detectors. The detector signal was coupled to a lock-in amplifier for phase-sensitive detection. Frequency modulation was used to reduce baseline effects; demodulation was carried out at , resulting in a line shape approximating the second derivative of a Gaussian.
The millimeter or submillimeter beam was formed by a standard gain horn antenna in combination with an HDPE lens for low-loss coupling of the beam to the 7 m long Pyrex absorption cell with 100 mm inner diameter. The cell windows were made of PTFE and tilted by 10 degrees to reduce baseline effects even more. A double-pass absorption scheme was used, which extended the absorption path length to 14 m.
The vapor pressure of 1,2-propanediol is rather low at room temperature, 19 Pa Verevkin et al. (2009). To achieve a sufficient and reasonably stable vapor pressure, measurements were carried out under slow flow conditions. In addition, the sample container, the needle valve, with which the flow of 1,2-propanediol was controlled at the inlet side, and the absorption cell were heated to about 55oC (328 K). The sample pressure was between 1.0 and 1.5 Pa.
After the integration time was optimized, which depends on the desired signal-to-noise level, step size (20, 32, and 90 kHz at lower, medium, and higher frequencies) and scan widths, our spectrometer setup allowed for full-band sweeps with a typical speed of about 1 to 4 weeks per 100 GHz because the lines were generally weak, even more so at lower frequencies.
3 Conformational landscape and spectroscopic properties of 1,2-propanediol
The molecule 1,2-propanediol may exist in up to 27 different conformers; chirality is ignored. It is usually assumed that different enantiomers (conformations that behave as mirror images) have the same spectroscopic parameters. The assumption may be not entirely correct, but to date there is no experimental evidence for distinguishable spectroscopic parameters of enantiomers. Quantum chemical calculations suggest that any such differences would require very heavy atoms in a molecule. The conformers of 1,2-propanediol can be distiguished by the torsional angles of the HOCC atoms involving the outer OH group of the OCCO atoms, and of the CCOH atoms with the OH group at the central C atom. The OCCO torsional angle also determines the position of the methyl group with respect to the rest of the molecule. This angle can be about 180o, +60o, or 60o, designated by , , and , respectively, with for (or ), and for . instead of was used in Lovas et al. (2009). The two torsional angles involving the OH groups are designated analogously by lower case characters.
Lovas et al. (2009) used MP2 quantum chemical calculations with basis sets of triple zeta quality to investigate structures and energetics of the 12 1,2-propanediol conformers found to be lowest in energy in earlier calculations with smaller basis sets (Vázquez et al. 1989). The first nine conformers from Vázquez et al. (1989) were also stable in the more recent calculations, whereas the two conformers next in energy were transformed into other conformers in the structure optimization process. Dipole moment components as well as quartic centrifugal distortion parameters were determined for the ten remaining conformers (Lovas et al. 2009). Lovas et al. (2009) recorded rotational spectra of 1,2-propanediol between 6.4 and 26.0 GHz using two types of FTMW spectrometers and were able to assign transition frequencies to seven different conformers based on calculated and observed spectroscopic parameters and on the relative magnitudes of the dipole moment components. The conformer assignments are quite secure, in particular for the five conformers lowest in energy. The calculated energy ordering of these conformers appears to agree with experimental intensities when collisional cooling is considered, especially for the three lowest energy conformers.
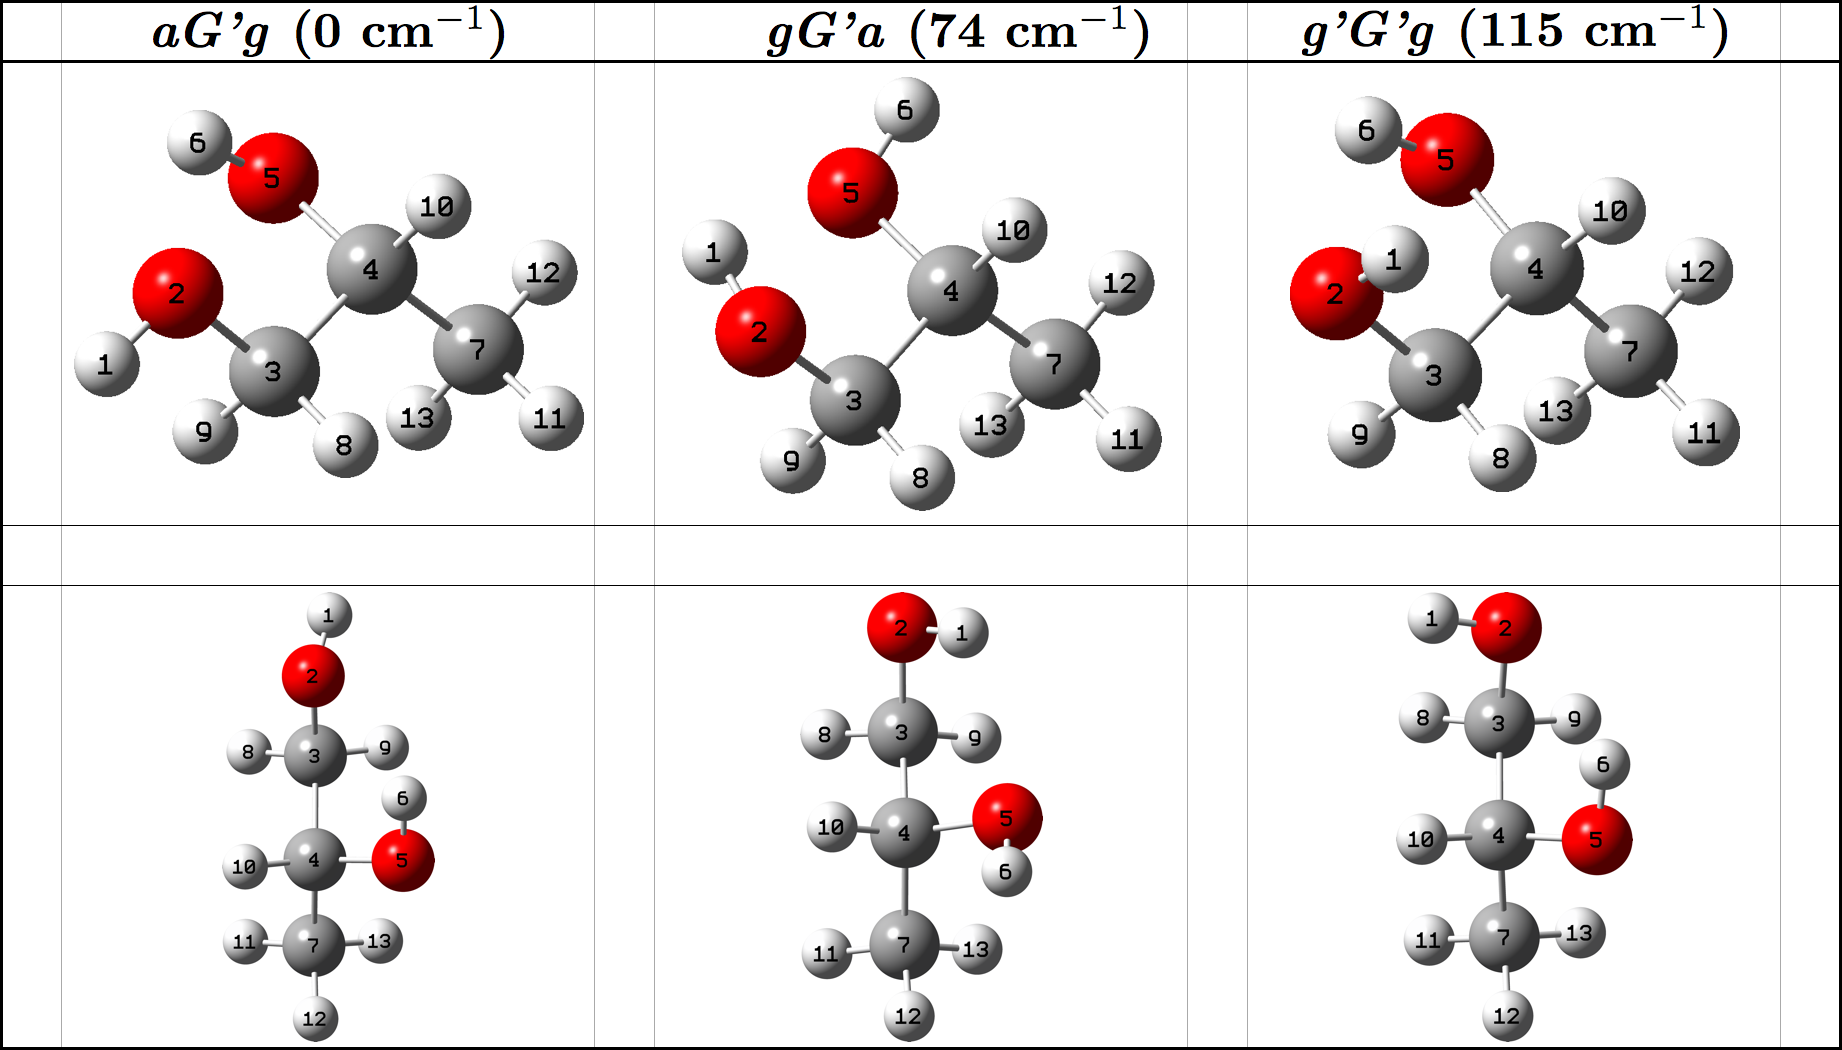
The predicted structures and relative energies for the three lowest energy conformers are depicted in Fig. 1. The lowest energy conformer is , in agreement with an earlier FTMW study (Lockley et al. 2002). Two other conformers, and , found in an even earlier millimeter wave study (Caminati 1981), are the second and, probably, the fourth lowest energy conformers, calculated to be 74 and 212 cm-1 higher. The third lowest conformer is , 115 cm-1 higher in energy than the lowest one.
Lovas et al. (2009) also determined dipole moment components experimentally for the , and conformers. We present in Table 1 the values of the two lowest energy conformers and the calculated components for .
| Conformer | |||
|---|---|---|---|
| aG’g | 1.201 | 1.916 | 0.365 |
| gG’a | 2.496 | 0.309 | 0.45 |
| g’G’g | 0.41 | 1.86 | 1.51 |
a Conformers aG’g and gG’a were designated
as tG’g and gG’t in Lovas et al. (2009).
The three lowest energy conformers of 1,2-propanediol are fairly asymmetric top molecules with a Ray’s asymmetry parameter not close to the prolate symmetric top limit of 1 (Gordy & Cook 1984). The values for , , and conformers are 0.7062, 0.6900, and 0.7132, respectively.
4 Results
With 13 atoms, 1,2-propanediol is a comparatively heavy molecule with relatively small rotational constants, which, in turn, lead to a dense rotational spectrum even at low energies. The fairly large number of conformers as well as the larger number of usually lower lying vibrational states compared with lighter molecules increase the line density even more.
Lovas et al. (2009) identified more than 140 transitions between 6.4 and 26.0 GHz for the three lowest 1,2-propanediol conformers. Transitions obeying all three types of selection rules were recorded for each of the conformer. Internal rotation splitting of the outer methyl group was not resolved with either FTMW spectrometer. Therefore, we did not expect to resolve it either because of the larger line widths in our experiments.
We used Pickett’s SPFIT and SPCAT programs (Pickett 1991) for fitting and predicting spectra of the 1,2-propanediol conformers. Watson’s reduction of the rotational Hamiltonian (Watson 1977) was used here. Predictions based on the previous works (Lockley et al. 2002; Lovas et al. 2009) allowed us to easily assign stronger -branch transitions with similar or slightly higher and quantum numbers in the 3870 GHz region. Using these transitions to improve the predictions, other assignments could be made until the signal-to-noise ratio was too low to determine the transition frequency with reasonable uncertainty. We were only able to assign transitions pertaining to the strong dipole moment components ( 0.5 D, see Table 1; see also Table 2 for statistics on our results and final fits). Transitions with up to 42 and up to 13 were assigned in this region for the lowest energy conformer. Similar quantum numbers were reached for the third lowest conformer . For both conformers, -type - and -branch transitions were observed. In addition, -type -branch transitions were observed for the aG’g conformer and -type - and -branch transitions for the g’G’g conformer. Fewer assignments, all pertaining to -type selection rules, were made for the conformer because of the small - and -dipole moment components. On the other hand, we were able to assign several weaker -branch transitions with and 0 in addition to the stronger -branch transitions because of the relatively large -dipole moment component.
| aG’g | gG’a | g’G’g | |
| no. of transitions | 2013 | 1401 | 1198 |
| 626 GHz | 82a,b | 41a | 41a |
| 3870 GHz | 256 | 115 | 211 |
| 200230 GHz | 553 | 280 | 177 |
| 297400 GHz | 1122 | 965 | 769 |
| no. of -branch trans. | 1436 | 1338 | 950 |
| no. of -branch trans. | 577 | 63 | 248 |
| no. of -types | 756 | 1372 | 6a |
| no. of -types | 1261 | 14a | 809 |
| no. of -types | 16a,b | 15a | 383 |
| no. of different lines | 1176 | 723 | 718 |
| rms error of the fit | 0.975 | 1.022 | 0.985 |
| standard deviationc (kHz) | 20.8 | 20.9 | 23.6 |
| uncertainty range (kHz) | 1090 | 1050 | 1070 |
| 69 | 71 | 69 | |
| 38 | 45 | 33 |
a From Lovas et al. (2009).
b From Lockley et al. (2002).
c Given for completeness; see Sect. 4.
Line overlap or proximity of two lines occurred quite rarely at these frequencies, therefore the uncertainties were estimated based on the base line quality and the signal-to-noise ratio. Assigned uncertainties at these low frequencies ranged mostly from 10 to 25 kHz, with some weak lines having uncertainties up to 50 kHz. The assigned uncertainties increased at higher frequencies up to 90 kHz. After each round of assignments, the need for more spectroscopic parameters was tested. We searched for the parameter that reduced the rms error of the fit most among the parameters that were useful based on the previously employed parameters. An additional parameter whose inclusion lead to a substantial reduction of the rms error was generally determined with great significance, meaning that its uncertainty was lower than one fifth of its magnitude. The search for additional parameters was continued as long as substantial reduction of the rms error was obtained.
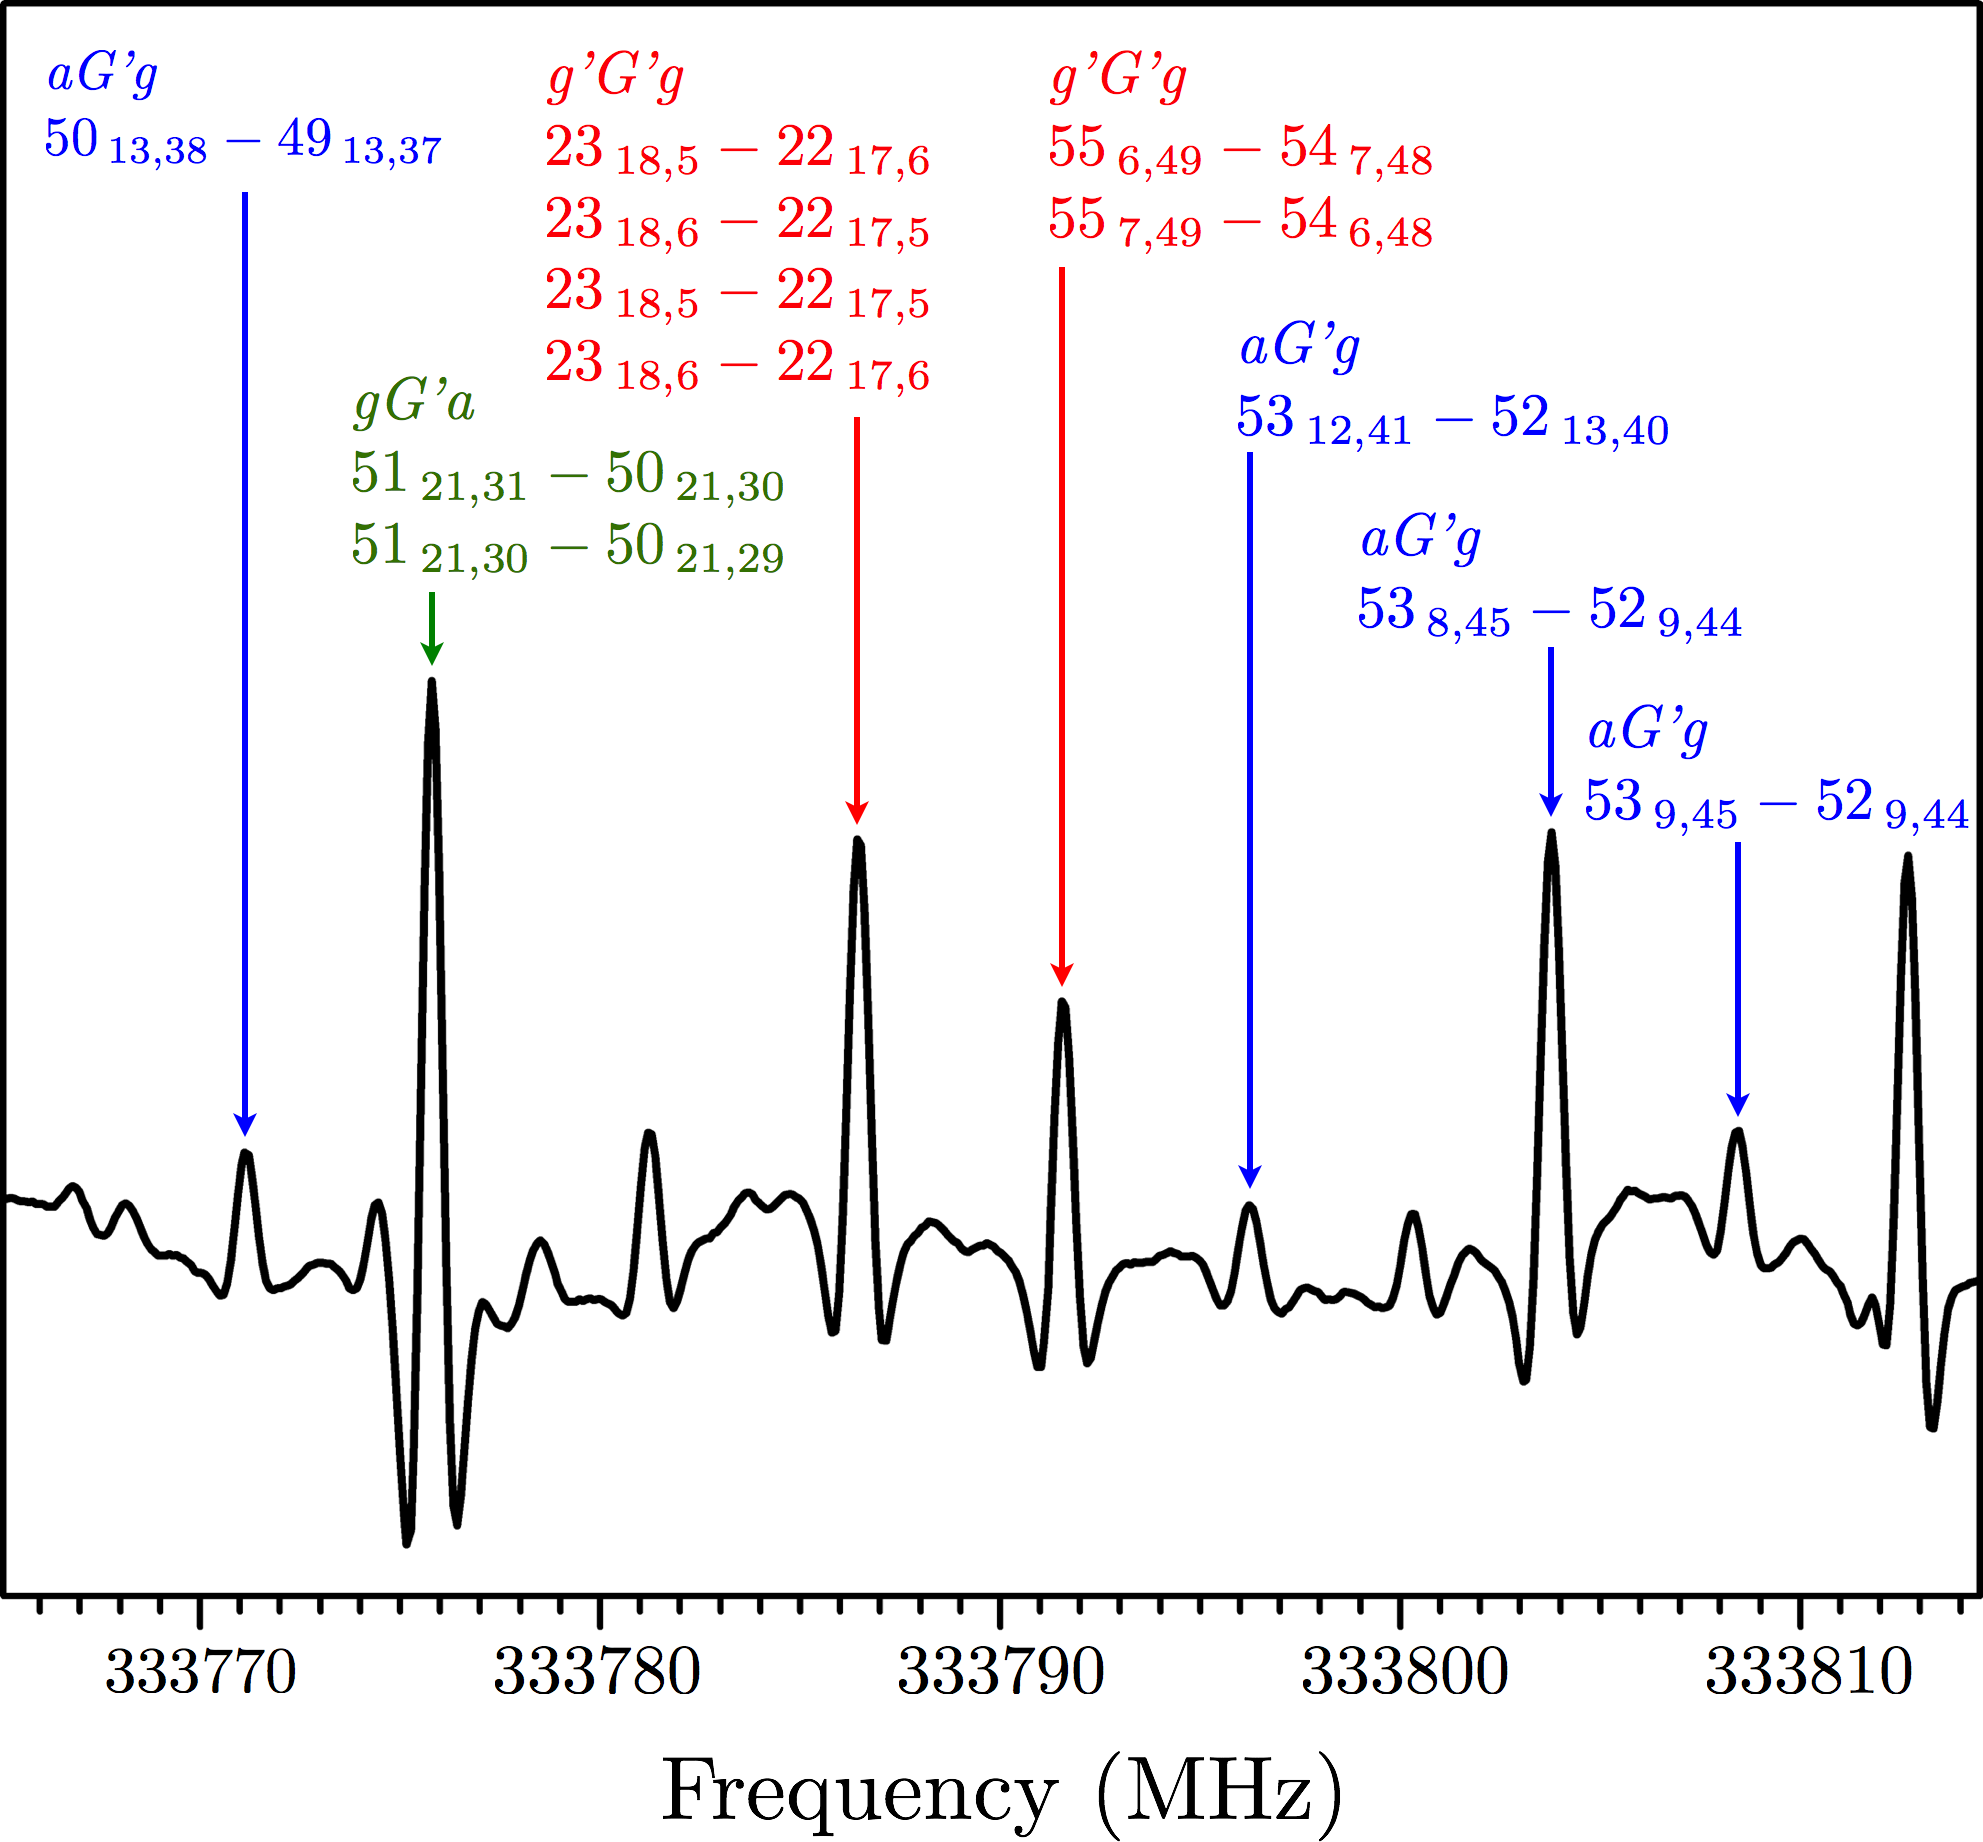
Subsequently, analyses of spectra in the 200230 GHz region and then in the 297400 GHz region were made in a similar way. Line overlap or proximity of lines was more widespread at higher frequencies and restricted the assignments somewhat in the 200230 GHz and severely in the 297400 GHz regions, in particular for weaker lines. Figure 2 shows a section of the spectrum near 334 GHz. Overlapping lines were not used in the fit except for unresolved asymmetry splitting. This refers to two -, -, or -type transitions with the same quantum numbers in the upper and the lower state, the same (prolate pairing) or (oblate pairing), and or differing by one (note: or ). The two transitions have the same intensity, and the frequency average is identical to the unsplit line center. For the aG’g conformer with - and -dipole moment components of similar magnitude, oblate pairing may involve four transitions with similar intensities, two - and two -types. Analogously, prolate pairing of transitions of the g’G’g conformer may involve four (- and -type) transitions with similar intensities. As the average frequency is in this special case identical to the intensity-weighted average, we omitted the intensity-weighting (specified in the line file after the uncertainties in SPFIT). The maximum quantum numbers of transitions used in the fits are 69, 71, and 69 for the aG’g, gG’a, and g’G’g, respectively; the corresponding values are 38, 45, and 33.
Previous data from Lovas et al. (2009) were used in the final fits with the reported uncertainties with the exception of two lines of the aG’g conformer and of three lines of the g’G’g conformer, for which the uncertainties were increased from 2 to 5 kHz (four lines) and from 5 to 10 kHz (one line) because of high residuals in the final fits. In addition, three lines of the g’G’g conformer were omitted for the same reason. Uncertainties of 4 kHz were assigned to the aG’g data from Lockley et al. (2002). The gG’a data from Caminati (1981) were not used in Lovas et al. (2009), and we did not use them either. Ultimately, a full set of up to sextic centrifugal distortion parameters plus one octic term were determined for the lowest energy conformer; two parameters less each were used in the final fits of the two higher energy conformers. The rms error of each fit, overall as well as restricted to one of the three frequency windows or to the previous data sets, was close to 1.0 throughout, in most cases slightly lower. Table 2 presents the unitless rms error as well as the standard deviation of each fit along with additional statistical information. The standard deviation is only given for completeness. It cannot be used as a measure for the quality of the fit because we used more than one uncertainty to reflect the changing quality of the experimental lines. The final parameters of the three lowest energy conformers of 1,2-propanediol are given in Table 3.
| Parameter | aG’g | gG’a | g’G’g | ||||
|---|---|---|---|---|---|---|---|
| 8572 | .057374 (95) | 8393 | .400915 (198) | 8536 | .771860 (108) | ||
| 3640 | .099657 (37) | 3648 | .559609 (45) | 3604 | .192077 (50) | ||
| 2790 | .972773 (33) | 2778 | .302133 (44) | 2778 | .337515 (52) | ||
| 1 | .863902 (170) | 2 | .38752 (275) | 1 | .862365 (315) | ||
| 6 | .085380 (133) | 5 | .337883 (204) | 6 | .107365 (207) | ||
| 0 | .6116173 (186) | 0 | .6593872 (172) | 0 | .6178250 (226) | ||
| 163 | .0629 (72) | 182 | .78504 (284) | 157 | .1335 (44) | ||
| 62 | .7055 (46) | 61 | .6642 (103) | 60 | .0612 (70) | ||
| 69 | .320 (103) | 70 | .809 (222) | ||||
| 43 | .356 (153) | 30 | .218 (183) | 43 | .284 (211) | ||
| 12 | .9991 (310) | 13 | .913 (37) | 12 | .932 (104) | ||
| 0 | .1462 (33) | 0 | .18016 (230) | 0 | .1637 (37) | ||
| 10 | .21 (169) | ||||||
| 73 | .42 (118) | 85 | .75 (171) | 78 | .60 (217) | ||
| 25 | .05 (36) | 21 | .79 (69) | 22 | .29 (75) | ||
| 0 | .2276 (274) | 0 | .4312 (309) | ||||
a Watson’s -reduction was used in the representation . Numbers in parentheses are one standard deviation
in units of the least significant digits.
The newly recorded transitions with their assignments, uncertainties, and residuals between observed frequency and those calculated from the final set of spectroscopic parameters are available in the supplementary material, as outlined in the appendix. The entire line, parameter, and fit files along with additional auxiliary files will be available in the spectroscopy section222Internet address: http://www.astro.uni-koeln.de/cdms/daten of the CDMS (Müller et al. 2001, 2005). Updated predictions for all three lower energy conformers of 1,2-propanediol will be available in the catalog section of the CDMS.
5 Discussion and conclusion
The rotational constants of all three 1,2-propanediol conformers are very similar, as one can see in Table 3. Therefore, it is not surprising that the centrifugal distortion parameters are mostly very similar as well. A rotational temperature of 50 K was recently reported for the lighter homologue ethanediol in Sgr B2(N) (Belloche et al. 2013). Assuming that the rotational temperature of propanediol in this source will be similar, the quantum number range covered for 1,2-propanediol in the present work is sufficient for astronomical observations, see Fig. 3. Some extrapolation to higher quantum numbers is possible in case of much higher rotational temperatures. We expect the actual transition frequency to be close to the prediction, that is, within three to five times the predicted uncertainty, as long as the predicted uncertainty does not exceed 300 kHz.
According to Belloche et al. (2013), it is advantageous to search for the weak spectroscopic features of a rather complex molecule at frequencies below the Boltzmann peak at an expected rotational temperature. At centimeter wavelengths, however, local thermodynamic equilibrium (LTE) with one rotational temperature may be a poor assumption even for a prolific hot-core source such as Sgr B2(N), at least in case of the lowest energy transitions. These transitions sample in particular the outer, less dense, and often colder envelope that surrounds the hot core. In fact, it was shown recently that the low-energy transitions of methyl formate, observed with the 100 m Greenbank telescope up to 50 GHz, deviated significantly from LTE, and several of these transitions were masing weakly (Faure et al. 2014).
An interesting aspect is the question whether we should expect an even greater molecular complexity to occur in the ISM. Bossa et al. (2009) reported on the thermal formation of aminomethanol in laboratory experiments consisting of H2O, NH3, and H2CO. The molecule was identified in the solid phase by infrared spectroscopy. It is not known so far whether the molecule can be transferred into the gas phase without complete decomposition. Moreover, it is not known what its average lifetime in the gas phase would be compared with related molecules. Nevertheless, this intriguing result may indicate that methanediol, 1,1-ethanediol, 1,1-propanediol, 2,2-propanediol, etc. could also be formed in interstellar ice analogs. In this context, it may be of interest that carbonic acid, OC(OH)2, is fairly stable in water-poor environments, in particular at low temperatures, and that it can be transferred into the gas phase without complete decomposition Bernard et al. (2013). The microwave spectrum of carbonic acid was also recorded recently Mori et al. (2011). And while OS(OH)2 is, to our knowledge, not stable in the gas phase, O2S(OH)2, sulfuric acid, is, and its rotational spectrum was studied extensively quite recently Cohen & Drouin (2013). Apparently, the stability of a molecule containing two OH groups (or one OH group and one NH2 group) attached to one atom X depends critically on the atom X and on other atoms or molecule groups attached to X.
Acknowledgements.
These investigations have been supported by the Deutsche Forschungsgemeinschaft (DFG) in the framework of the collaborative research grant SFB 956, project B3. JBB is grateful for support from the Marie Curie Intra-European Fellowship (FP7-PEOPLE-2011-IEF-299258).References
- Belloche et al. (2013) Belloche, A., Müller, H. S. P., Menten, K. M., Schilke, P., & Comito, C. 2013, A&A, 559, A47
- Bernard et al. (2013) Bernard, J., Huber, R. G., Liedl, K. R., Grothe, H., & Loerting, T. 2013, J. Am. Chem. Soc., 135, 7732; and references therein
- Bossa et al. (2009) Bossa, J. B., Theule, P., Duvernay, F., & Chiavassa, T. 2009, ApJ, 707, 1524
- Caminati (1981) Caminati, W. 1981, J. Mol. Spectrosc., 86, 193
- Caminati et al. (1995) Caminati, W., Melandri, S., and Favero, P. G. 1995, J. Mol. Spectrosc., 171, 394
- Cohen & Drouin (2013) Cohen, E. A., & Drouin, B. J. 2013, J. Mol. Spectrosc., 288, 67
- Christen et al. (1995) Christen, D., Coudert, L. H., Suenram, R. D., & Lovas F. J. 1995, J. Mol. Spectrosc., 172, 57
- Christen et al. (2001) Christen, D., Coudert, L. H., Larsson, J. A., & Cremer, D. 2001, J. Mol. Spectrosc., 205, 185
- Christen & Müller (2003) Christen, D. & Müller, H. S. P. 2003, Phys. Chem. Chem. Phys., 5, 3600
- Crovisier (2004) Crovisier, J., Bockelée-Morvan, D., Biver, N., et al. 2004, A&A, 418, L35
- Faure et al. (2014) Faure, A., Remijan, A. J., Szalewicz, K., & Wiesenfeld, L. 2014, ApJ, 783, 72
- Gordy & Cook (1984) Gordy, W., & Cook, R. L. 1984, Microwave Molecular Spectra (New York: Wiley)
- Hollis et al. (2002) Hollis, J. M., Lovas, F. J., Jewell, P. R., & Coudert, L. H. 2002, ApJ, 571, L59
- Jørgensen et al. (2012) Jørgensen, J. K., Favre, C., Bisschop, S. E., et al. 2012, ApJ, 757, L4
- Lockley et al. (2002) Lockley, T. J. L., Hearn, J. P. I, King, A. K., & Howard, B. J. 2002, J. Mol. Struct., 612, 199
- Lovas et al. (2009) Lovas, F. J., Plusquellic, D. F., Pate, B. H., et al. 2009, J. Mol. Spectrosc., 257, 82
- Maury et al. (2014) Maury, A. J., Belloche, A., André, P., et al. 2014, A&A, 563, L2
- Mori et al. (2011) Mori, T., Suma, K., Sumiyoshi, Y., & Endo, Y. 2011, J. Chem. Phys., 134, 044319; and references therein
- Müller et al. (2001) Müller, H. S. P., Thorwirth, S., Roth, D. A., & Winnewisser, G. 2001, A&A, 370, L49
- Müller & Christen (2004) Müller, H. S. P., & Christen, D. 2004, J. Mol. Spectrosc., 228, 298
- Müller et al. (2005) Müller, H. S. P., Schlöder, F., Stutzki, J., & Winnewisser, G. 2005, J. Mol. Struct, 742, 215
- Ordu et al. (2012) Ordu, M. H., Müller, H. S. P., Walters, A., et al. 2012, A&A, 541, A121
- Patterson et al. (2013) Patterson, D., Schnell, M., & Doyle, J. M. 2013, Nature, 497, 475
- Pickett (1991) Pickett, H. M. 1991, J. Mol. Spectrosc., 148, 371
- Plusquellic et al. (2009) Plusquellic, D. F., Lovas, F. J., Pate, B. H., et al. 2009, J. Phys. Chem. A, 113, 12911
- Requena-Torres et al. (2008) Requena-Torres, M. A., Martín-Pintado, J., Martín, S., & Morris, M. R. 2008, ApJ, 672, 352
- Smirnov et al. (2013) Smirnov, I. A., Alekseev, E. A., Piddyachiy, et al. 2013, J. Mol. Spectrosc., 293294, 33
- Vázquez et al. (1989) Vázquez, S., Mosquera, R. A., Rios, M. A., & van Alsenoy, C. 1989, J. Mol. Struct. (Theochem), 184, 323
- Verevkin et al. (2009) Verevkin, S. P., Emel’yanenko, V. N., & Nell, G., 2009, J. Chem. Thermodyn., 41, 1125
- Watson (1977) Watson, J. K. G., 1977, in ”Vibrational Spectra and Structure”, Vol. 6, ed. J. Durig (Amsterdam: Elsevier), 1
Appendix A. Supplementary material
The newly recorded experimental transition frequencies for the aG’g, gG’a, and g’G’g conformers of 1,2-propanediol are given as Tables 4, 5 and 6, respectively, in the supplementary material as text files. Only the first and the last ten lines of Table 4 appear in the paper edition. The tables give the rotational quantum numbers , , and for the upper state followed by those for the lower state. The observed transition frequency is given in megahertz units with its uncertainty and the residual between observed frequency and that calculated from the final set of spectroscopic parameters. In the case of unresolved asymmetry splitting, frequencies and residuals refer to the unsplit line center.
Additional text files aG’g.txt, gG’a.txt, and g’G’g.txt provide the internal coordinates of the three propanediol conformers. A schematic representation is given in Table 7.
| Frequency | Unc. | oc | |||||||
|---|---|---|---|---|---|---|---|---|---|
| 1 | 0 | 1 | 0 | 0 | 0 | 6431. | 0705 | 0.004 | 0.00052 |
| 2 | 1 | 1 | 2 | 0 | 2 | 6730. | 6486 | 0.004 | 0.00132 |
| 5 | 1 | 5 | 4 | 2 | 2 | 7764. | 4042 | 0.004 | 0.00652 |
| 2 | 0 | 2 | 1 | 1 | 1 | 7829. | 7009 | 0.004 | 0.00263 |
| 3 | 1 | 2 | 3 | 0 | 3 | 8330. | 2346 | 0.004 | 0.00261 |
| 4 | 1 | 3 | 4 | 1 | 4 | 8439. | 0989 | 0.004 | 0.00071 |
| 4 | 1 | 3 | 4 | 0 | 4 | 10733. | 5960 | 0.004 | 0.00131 |
| 1 | 1 | 1 | 0 | 0 | 0 | 11363. | 0101 | 0.004 | 0.00422 |
| 2 | 1 | 2 | 1 | 1 | 1 | 12012. | 9795 | 0.004 | 0.00022 |
| 3 | 0 | 3 | 2 | 1 | 1 | 12169. | 5787 | 0.004 | 0.00079 |
| 61 | 27 | 34 | 60 | 27 | 33 | 397547. | 6360 | 0.030 | 0.04320 |
| 61 | 27 | 35 | 60 | 27 | 34 | 397547. | 6360 | 0.030 | 0.04320 |
| 67 | 5 | 62 | 66 | 6 | 61 | 397802. | 5190 | 0.055 | 0.01818 |
| 67 | 5 | 62 | 66 | 5 | 61 | 397802. | 5190 | 0.055 | 0.01818 |
| 67 | 6 | 62 | 66 | 5 | 61 | 397802. | 5190 | 0.055 | 0.01818 |
| 67 | 6 | 62 | 66 | 6 | 61 | 397802. | 5190 | 0.055 | 0.01818 |
| 68 | 4 | 64 | 67 | 5 | 63 | 398920. | 0610 | 0.080 | 0.01838 |
| 68 | 4 | 64 | 67 | 4 | 63 | 398920. | 0610 | 0.080 | 0.01838 |
| 68 | 5 | 64 | 67 | 4 | 63 | 398920. | 0610 | 0.080 | 0.01838 |
| 68 | 5 | 64 | 67 | 5 | 63 | 398920. | 0610 | 0.080 | 0.01838 |
Notes. This table as well as those of other conformers are
available in their entirety in the electronic edition in the online journal:
http://cdsarc.ustrasbg.fr/cgi-bin/VizieR?-source=J/A+A/Vol/Num.
A portion is shown here for guidance regarding its form and content.
| atom | atom ref. no. | bond length label | atom ref. no. | bond angle label | atom ref. no. | dihedral angle label |
|---|---|---|---|---|---|---|
| H | ||||||
| O | 1 | B1 | ||||
| C | 2 | B2 | 1 | A1 | ||
| C | 3 | B3 | 2 | A2 | 1 | D1 |
| label | value | |||||
| B1 | 0.96170000 | |||||
| B2 | 1.43000000 | |||||
| D9 | 178.50000000 | |||||
| D10 | 59.30000000 | |||||
Notes. This text file as well as those of other conformers are
available in their entirety in the electronic edition in the online journal:
http://cdsarc.ustrasbg.fr/cgi-bin/VizieR?-source=J/A+A/Vol/Num.
A portion is shown here for guidance regarding its form and content.