Reaction Studies of Neutral Atomic with using a Merged Fast-Beams Apparatus
Abstract
We have investigated the chemistry of forming CH+, CH, and CH. These reactions are believed to be some of the key gas-phase astrochemical processes initiating the formation of organic molecules in molecular clouds. For this work we have constructed a novel merged fast-beams apparatus which overlaps a beam of molecular ions onto a beam of ground-term neutral atoms. Here we describe the apparatus in detail and present cross section data for forming CH+ and CH at relative energies from meV to and 3 eV, respectively. Measurements were performed for statistically populated C in the ground term reacting with hot H (at an internal temperature of K). Using these data we have derived rate coefficients for translational temperatures from K to and K, respectively. For the formation of CH we are able only to put an upper limit on the rate coefficient. Our results for CH+ and CH are in good agreement with the mass-scaled results from a previous ion trap study of , at a translational temperature of K. That work also used statistically populated C but internally cold D ( K). The good agreement between the two experiments implies that the internal excitation of the H is not significant so long as the reaction proceeds adiabatically. At 300 K, the C fine-structure levels are predicted to be essentially statistically populated, enabling us to compare our translational temperature results to thermal equilibrium calculations. At this temperature our rate coefficient for forming CH+ lies a factor of below the Langevin rate coefficient currently given in astrochemical databases and a factor of below the published classical trajectory studies using quantum mechanical potential energy surfaces. Our results for CH formation at 300 K are a factor of , above these semi-classical results. Astrochemical databases do not currently include this channel. We also present a method for converting our translational temperature results to thermal rate coefficients for temperatures below K. The results indicated that CH formation dominates over that of CH+ at temperatures K.
1 Introduction
The first organic molecules are thought to have formed through interstellar gas-phase chemistry when atomic carbon was “fixed” into hydrocarbons. Typical molecular cloud densities are so low that one needs only consider binary collisions. As a result, the initial chemical network involved is rather simple, primarily consisting of C+ or C reacting with either H, H2, or H (van Dishoeck, 1998; Herbst & Millar, 2008). The cosmic pathway from there to more complex hydrocarbons and other organic molecules passes through the molecular cations CH (). Understanding how C+ and C react to form these ions is therefore critical for modeling the origins of organic chemistry.
The available pathways for the C+ network have been well laid out (van Dishoeck, 1998; Herbst & Millar, 2008), even if significant uncertainties remain in the actual rate coefficients (Vasyunin et al., 2008; Wakelam et al., 2009, 2010). Naively one would expect the hydrogen abstraction reaction
| (1) |
to be important. However, this process is endothermic by 0.4 eV and does not go forward at the low temperatures typical of molecular clouds. Instead, C+ is thought primarily to undergo radiative association via
| (2) |
A discussion of theoretical and experimental work on this system can be found in Gerlich & Horning (1992) and Gerlich (2008) and references therein. Hydrogen abstraction reactions of the product CH with H2 can then form CH. Recent experimental studies of hydrogen abstraction involving CH+ and CH have been published by Gerlich et al. (2011).
The corresponding C chemistry is expected to be dominated by reactions with H, but the network is much more uncertain. Astrochemical databases currently include the proton transfer process (Wakelam et al., 2012; McElroy et al., 2013)
| (3) |
Classical trajectory studies using quantum mechanical potential energy surfaces (PESs) have been used to calculate the thermal rate coefficient for this reaction in the range of K (Talbi et al., 1991; Bettens & Collins, 1998, 2001). That semi-classical work takes into account the temperature dependence of both the translational motion and the internal energy of the C atom but assumes the H ion is in the ground state.
Ion trap measurements for
| (4) |
have been performed by Savić et al. (2005) at an estimated translational temperature of K (see Section 9.2 for a discussion of both the translational and internal temperatures in their work). Throughout this paper, we use the term “translational temperature” to refer to the reaction center-of-mass velocity distribution when it is described by a Maxwell-Boltzmann distribution. The internal energies of the reactants, however, are not necessarily in thermal equilibrium. When both the translational temperature and internal energies are in thermal equilibrium, we use the term “thermal”.
Comparing theory and experiment for these analogous reactions touches on a major issue in astrochemistry, namely how to convert data between isotopologues of a collision system. Two approaches are commonly used. Some researchers assume the rate coefficients are the same, independent of the isotopologues involved (e.g., Rodgers & Millar, 1996; Albertsson et al., 2013). Others use the Langevin theory (Gioumousis & Stevenson, 1958) and scale by the square root of the ratio of the reduced masses (e.g., Stancil et al., 1998; Gay et al., 2011). These two approaches result in a multiplicative scaling factor of 1 and 1.29, respectively, for the Savić et al. (2005) data. However, even taking this into account, theory and experiment have still not converged in either magnitude or temperature dependence. The theoretical calculations differ from one another by a factor of about 1.7. Including the error bars on the laboratory work, the published rate coefficients for this reaction span nearly an order of magnitude; though it is unclear if this represents a temperature dependence in the reaction or is a true discrepancy. But even assuming only a factor of 2 uncertainty, astrochemical sensitivity studies still find that improving the accuracy of this rate coefficient is of critical importance for reliably matching model predictions to observations (Vasyunin et al., 2008; Wakelam et al., 2009, 2010).
Current astrochemical databases, however, do not consider the possibility of the additional reaction channels
| (5) |
and
| (6) |
If these reactions are fast enough, then they could result in an increased efficiency for the gas-phase formation of complex hydrocarbons. However, the theoretical predictions and experimental findings for these two reactions are not in agreement.
For reaction (5), Talbi et al. (1991) calculate that it possesses a significant activation energy and will not proceed at typical molecular cloud temperatures. Bettens & Collins (1998, 2001), though, find that the reaction proceeds with no barrier at a rate a factor of smaller than that for reaction (3). That this channel is open is supported by the experimental work of Savić et al. (2005) on the analogous system
| (7) |
However, they measure a rate coefficient that is only a factor of smaller than that for reaction (4).
As for reaction (6), it was not considered by either Talbi et al. (1991) or Bettens & Collins (1998, 2001). Quite likely that is because in binary collisions the process can only proceed via radiative association. Such reactions typically have rate coefficients many orders of magnitude smaller than processes such as reactions (3) and (4), which are expected to proceed with near Langevin rate coefficients (e.g., Herbst & Millar, 2008). Surprisingly though, Savić et al. (2005) measured a rate coefficient for the analogous process
| (8) |
and found that it is a factor of only smaller than that for reaction (4).
It is clear that additional research is needed to improve our understanding of the reaction complex. However, to accomplish this goal, there are formidable challenges both theoretically and experimentally.
Astrochemical databases use the Langevin value for the reaction system. The only detailed calculations of which we are aware for this system are the semi-classical results of Talbi et al. (1991) and Bettens & Collins (1998, 2001). Fully quantum mechanical scattering calculations for ion-neutral collision systems with 4 or more atoms appear to be just beyond current theoretical capabilities. The deep potential wells require large reactant and product basis sets. Accurate long-range potentials are needed as they are predicted to drive the reaction process. Additionally, multiple electronic surfaces may be involved along with non-adiabatic coupling between the surfaces. Brief reviews of the field can be found in Althorpe & Clary (2003) and Bowman et al. (2011). In the meanwhile, the state-of-the-art seems to be represented by the work of Klippenstein et al. (2010), which is a combination of transition state theory, classical trajectory simulations, and master equation analysis. They calculated the and systems; but we are unaware of any similar work on .
Experimentally, studies of cross sections and rate coefficients for reactions of C with molecular ions are extremely difficult. Part of the difficulty has to do with the challenge of generating beams of neutral atomic C. Standard experimental techniques for measuring ion-neutral reactions, such as flowing afterglows and related approaches, cannot generate sufficient amounts of neutral atomic C due to its high reactivity (A. Viaggiano, private communication). Laser ablation can produce beams of atomic C (Kaiser & Suits, 1995; Gu et al., 2006), but have yet to be used in an experimental configuration that can generate cross sections or rate coefficients (Wilson et al., 2012). In fact, we are aware of only two published laboratory measurements of cross sections or rate coefficients for reactions of C with molecular ions (Schuette & Gentry, 1983; Savić et al., 2005).
The approach of Schuette & Gentry (1983) was to send a fast beam of C+ through a gas cell, neutralizing a portion of the beam through electron capture. After the cell, any remaining C+ was magnetically removed, leaving a beam of neutral C. Merging an internally hot D beam with the neutral beam, they studied the reaction
| (9) |
Because both beams were fast, standard laboratory methods could be used to characterize the parent beam profiles and particle currents and also to detect the product ions. Hence it was possible to perform absolute cross section measurements. However, the neutral C beam contained an unknown mixture of ground state and metastable levels of C with internal energies of up to eV. This limits the ability to make an unambiguous comparison of the results with theoretical calculations. Moreover, it also prevents the use of the results for astrochemistry where any neutral C atoms are expected to be in the ground term.
Another experimental approach taken is that of Savić et al. (2005). They used heated graphite rods to create an effusive beam consisting of a mixture of C, C2, and C3, which flowed into an ion trap containing internally cold D. With their apparatus they investigated reactions (4), (7), and (8). Rate coefficients were determined by measuring the trapped parent and daughter ion populations versus time. However, there are a number of drawbacks to this method: (a) the beam is not pure and the Cn impurities () can react with the trapped ions, potentially affecting the results; (b) the carbon source emits vacuum ultraviolet radiation which can cause ionization in the trap and alter the chemistry occurring; (c) the carbon beam is emitted in bursts and has an unknown density which varies spatially and temporally, complicating the determination of the neutral-ion overlap and the extracted rate coefficient; (d) the energy of the carbon atoms and the energy spread of the effusive beam are both highly uncertain; and (e) the K translational temperature of the experiment is a factor of higher than typical molecular cloud temperatures. However, perhaps the biggest issue is that (f) trapped ionic end products can undergo subsequent parasitic reactions with either parent-beam or background-gas neutrals, complicating the interpretation and analysis of the data. This last point is the reason that only lower limits were given for the error bars on their measurements of reactions (7) and (8).
It is clear that there is a need for an improved ability to study reactions of neutral atomic C with molecular ions. Here we describe a novel, merged fast-beams apparatus that we have developed to study such reactions. For our proof-of-principle studies we have investigated reactions (3), (5), and (6). As we describe below, our approach overcomes many of the limitations of Schuette & Gentry (1983) and Savić et al. (2005).
The rest of this paper is organized as follows. In Section 2 we review our experimental approach. A detailed description of the apparatus is provided in Section 3. Section 4 discusses the beam profile measurements and simulations used to determine the relative energies. Section 5 outlines how the signal was determined while Section 6 reviews the data acquisition method. Uncertainties and data averaging are briefly discussed in Section 7. Results are presented in Section 8 and discussed in Section 9. Some astrochemical implications are explored in Section 10. In Section 11 we summarize our findings.
2 Experimental Approach
We have developed a versatile merged fast-beams apparatus capable of studying a range of chemical processes involving neutral atoms or molecules reacting with atomic or molecular ions (see Figure 1). As currently configured, the system is designed to detect charged daughter products which are heavier than either of the parent beams, such as reactions (3), (5), and (6).
The neutral beam portion of the apparatus begins with a Cs-ion sputter source to generate singly charged anions. By floating the source cathode to a negative potential of , we non-selectively extract anions and generate a fast beam with a laboratory kinetic energy of , where is the unit charge. A Wien filter is used to purify the beam by selecting for the charge-to-mass ratio of the desired ion, which is then directed into an electrically isolated cell, floated to a potential of . Inside this floating cell the anions, now with an energy of , are crossed by a laser beam which photodetaches a fraction of the beam. After exiting the photodetachment chamber, the anions are electrostatically deflected into a Faraday cup, resulting in a neutral beam with a kinetic energy of . For the second beam in the experiment, we use a duoplasmatron ion source floated to a positive potential of . We select the desired cations with a Wien filter. The resulting ion beam kinetic energy is . An electrostatic deflector is used to merge the ions with the neutral beam.
For mono-energetic beams, the relative energy in the center-of-mass is given by (Brouillard & Claeys, 1983)
| (10) |
where and are the neutral and ion masses, respectively; is the reduced mass of the collision system; and is the intersection angle. This relative energy between the two beams can be controlled by varying either the source potentials or the floating cell potential or some combination thereof.
The beginning of the interaction region is determined by the point inside the electrostatic deflector where the ions merge with the neutral beam. A beam profile monitor (BPM) is mounted near the beginning of the interaction region and another near the end. These are used to measure the horizontal and vertical profile of each beam and determine their overlap. During data acquisition, both beams are chopped on and off, out of phase. This enables us to extract the desired signal from various backgrounds. Parent beam densities of cm-3 help reduce to insignificant any possible effects of three-body and parasitic reactions.
The end of the interaction region is determined by an electrostatic chicane (Figure 2) which sends the parent ions into a Faraday cup, while the parent neutral beam continues ballistically and any heavier, charged daughter products are directed into an electrostatic energy analyzer. A hole in this analyzer allows the neutral beam to pass through into a detector which measures the neutral beam particle current. The desired product ion is selected based on its final kinetic energy and directed into a channel electron multiplier (CEM) operated in pulse counting mode. We note that, as a result of the high beam velocities in the laboratory frame, the angular spread of the reaction products is strongly compressed in the forward direction onto a small surface area. This enables us to use standard detection techniques to collect the signal ions emitted over the entire 4 steradians in the center-of-mass frame.
Experimentally we measure the reaction cross section times the relative velocity convolved with the relative velocity spread of the experiment. This merged-beams rate coefficient can be written as (e.g., Bruhns et al., 2010b)
| (11) |
Here is the count rate measured at the CEM, is the transmittance of the analyzer for the selected daughter product, is the geometric transmittance of the grid in front of the CEM, is the CEM efficiency, is the neutral beam velocity, is that of the ion beam, is the neutral particle current measured in amperes, is the ion current, and is the length of the interaction region. The term is the average overlap integral in the interaction region and is discussed further in Section 4.1.
Because we measure all of the quantities on the right hand side of Equation (11), we are able to report absolute measurements. From a combination of beam profile measurements and trajectory models, we are able to determine the interaction relative energy spread. This enables us to deconvolve our results to generate cross sections which can then be re-convolved with a Maxwell-Boltzmann distribution to generate a translational temperature rate coefficient.
3 Apparatus Description
The apparatus design is based, in part, on that of our self-merged fast-beams apparatus which has already been described in a series of papers (Kreckel et al., 2010; Bruhns et al., 2010a, b). For example, many of the ion optics for steering and focusing are similar to those used previously. Here we describe only those additional details specific to this new apparatus.
3.1 Carbon Beam Line
We generate a beam of C- using a Cs-ion sputter source in combination with a Wien filter to remove all other unwanted negative particles. The Wien filter can readily resolve 12C- from both 13C- and 12C1H-, thereby enabling us to generate an isotopically pure 12C- beam. Generally we operate the beam at a relative energy of keV. The full width half maximum (FWHM) energy spread for a C- beam from a sputter source is typically eV (Doucas, 1977a, b). Operating pressures in the region of the ion source are Torr.
C- is one of the rare atomic anions which possess more than one stable bound level lying below the first detachment threshold: a ground level and two excited levels ( and 3/2). However, sputter sources have been shown to produce insignificant populations of the excited levels (Scheer et al., 1998; Takao et al., 2007). Thus we produce an essentially pure beam of ground level C-.
After exiting the Wien filter, the beam is directed into a 90∘ electrostatic cylindrical deflector. This deflection prevents any neutral particles or ultraviolet photons emitted by the source from having a direct path into the interaction region. Typical pressures in the deflector are Torr. Nominal C- currents after this deflector are A.
The anion beam is then directed through a 5 mm diameter circular aperture and continues essentially ballistically. Along this second leg of the carbon beamline, we have installed horizontal and vertical solenoid coils with rectangular cross sections. These enable us to largely cancel out the effects of the Earth’s magnetic field, which would generate an unwanted deflection of the anion beam.
After the 5 mm aperture, the anions enter into the floating cell, housed in what we call the photodetachment chamber. Outside of this chamber we use a diode laser to generate an 808-nm (1.53-eV) laser beam with kW of power. Using lenses and mirrors external to the vacuum chamber, the beam is directed into the floating cell. Near the center of the overlap region with the anion beam, the laser light is brought to an oval-shaped focus where 90% of the power lies in an area of 9.4 mm in the horizontal direction and 11.6 mm in the vertical direction. The laser crosses the anions at an angle of . The laser beam exits the chamber a distance of 2008 mm from the entrance and is directed into a water-cooled power meter, which we monitor during data acquisition.
Based on the known photodetachment cross section (Seman & Branscomb, 1962; Zhou et al., 2004), laser power, and anion velocity, and using the expected beam shapes and overlap geometry, we estimate that of the C- beam is photodetached into ground term C(, though not all of the beam passes through subsequent apertures in the system. The photon energy and flux are insufficient to photodetach into higher lying levels of atomic C.
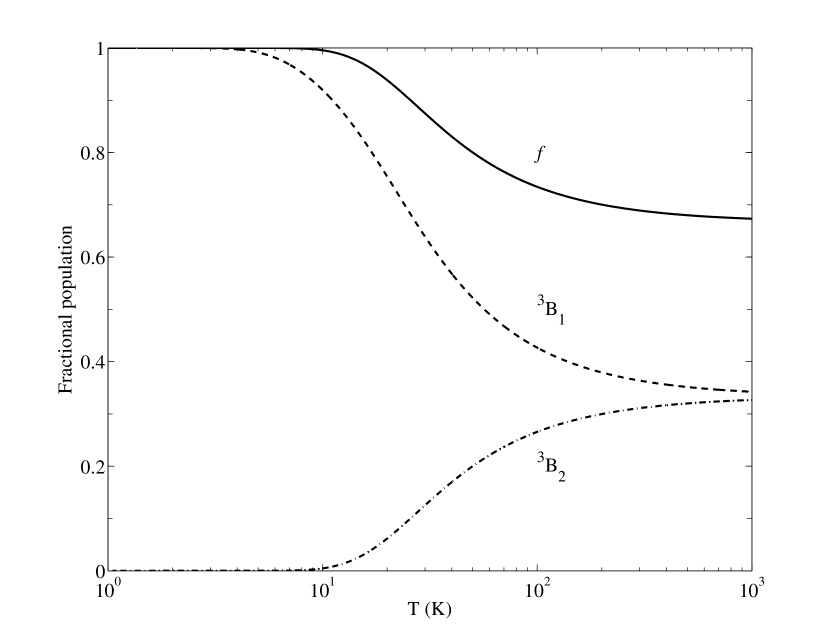
Based on previous photodetachment studies, we expect to statistically populate all three fine-structure levels of the ground term (Scheer et al., 1998). The and 2 levels lie above the ground level by energies of and 5.4 meV, respectively. We have calculated the thermal population of the levels using the partition functions
| (12) |
where is the statistical weight of level . The results are shown in Figure 3, which indicates that the fine-structure population reaches a statistical distribution for temperatures K. We will return to this issue in Section 9.
The neutral beam exits the floating cell with a relative energy of . Both the anion and neutral beams then enter a cylindrical deflector. The remaining C- ions are electrostatically deflected into a Faraday cup which collects the anion beam. Typical C- currents measured at this point are on the order of 1 A.
The neutral beam then passes through a 12 mm diameter aperture in the outer plate of this cylindrical deflector and after that through a second 5 mm aperture, a distance of 3168 mm downstream from the first. The separation of these two 5 mm apertures geometrically limits the divergence of the C beam to a maximum half angle of 1.57 mrad. The beam continues into yet another cylindrical electrostatic deflector and passes through a 12 mm diameter hole in the outer plate of that deflector. This deflector is used to merge the molecular ions with the neutral beam. For data acquisition, we chop the C beam on and off by chopping the laser beam. The switching time of the laser is on the order of a few hundred ns.
3.2 Molecular Beam Line
The molecular ions are formed using a duoplasmatron. We extract a beam of cations from the source and use a Wien filter to select the desired H ions. The typical beam kinetic energy is keV, chosen to match the laboratory velocity of the keV C beam. The typical energy spread from a duoplasmatron has a FWHM of eV (Aberth & Peterson, 1967). The pressure in the vicinity of the source is Torr.
The vibrational and rotational temperatures of formed in a duoplasmatron may be quite substantial. This is due to the formation mechanism, namely, proton transfer between H and H2, at least one of which is typically vibrationally excited in the discharge. Internal energies of eV are inferred by Anicich & Futrell (1984). These are supported by experimental studies which found internal energies ranging between eV, with a generally decreasing internal energy as the source load pressure increases (X. Urbain, private communication). We convert this to an internal temperature using the theoretical partition function results of Kylänpää & Rantala (2011), specifically their Equation (8). Based on this, we estimate that our H internal temperature lies between and 3,400 K, which is below the 4,000 K dissociation temperature of the system. The internal temperature is higher than that expected for many astrochemical environments. However, as we show later, this internal excitation appears not to have a significant effect on our measurements down to temperatures of at least K. Still, in future work we hope to explore the possibility of installing a cold molecular ion source on our system.
As in the C beamline, the H beam is deflected 90∘ into a second leg which is surrounded by rectangular shaped solenoid coils to cancel the magnetic field of the Earth in the horizontal and vertical directions. The beam is then directed into a drift region defined by two 5 mm apertures separated by a distance of 3069 mm. The drift region contains only two electrostatic ion optics, both just prior to the second aperture. The first is a horizontal electrode, dubbed the “kicker”. This is used to adjust the vertical angle of the beam entering the 90∘ deflector which merges them onto the neutrals. With this we are able to reduce the vertical angle between the ion beam and the neutral beam in the interaction region. The second electrode is a horizontal plate opposite the kicker which we use to chop the beam, allowing or preventing the beam from being sent into the merger. The potential on this electrode is controlled using a fast high voltage switch with a switching time of better than 100 ns. This enables us to chop the H beam on and off during data acquisition.
Typical H currents exiting the drift region are nA. The divergence of the H beam at this point is geometrically constrained by the collimating apertures, which limit the maximum half angle to 1.62 mrad. The beam then passes through a one-dimensional (1D) electrostatic lens and into a 90∘ electrostatic cylindrical deflector which merges the cations with the neutrals. The 1D lens is used to compensate for the focusing effects of the cylindrical deflector in the horizontal or merging plane. The divergence of the beam grows somewhat due to self-repulsion from space charge effects within the beam and due to focusing effects from the merging cylindrical deflector. Typical pressures in the beam merger are Torr.
3.3 Interaction Region
The H beam is brought horizontally onto the neutral C beam, near the exit of the beam merger. The two beams then co-propagate for some distance with a low relative velocity. Within this interaction region, some of the parent cations and neutrals undergo chemical reactions, generating daughter molecular ions.
The kinetic energy of the daughter ions is essentially the sum of plus the product of the H kinetic energy per amu ( keV amu-1) times the mass in amu, transferred from the H. For matched parent-beam laboratory velocities, this typically corresponds to keV for forming CH+, keV for CH, and keV for CH. These are the end products for reactions (3), (5), and (6), respectively. The dominant background ion is the keV C+ formed when the parent C beam is ionized by collisions with residual gas in the vacuum system.
The parent beams are demerged using an electrostatic chicane. Trajectory studies using the ion optics package SIMION111www.simion.com indicate that the overlap length of the two beams is mm. This distance includes both the merging and demerging regions, which make up less than 6% of the interaction length. The beams merge with an initial angle in the horizontal plane of rad and are brought parallel within a distance 30 mm. The demerging occurs in the vertical direction over a distance of 38 mm with a final angle between the beams of rad. Here and throughout all uncertainties are quoted at an estimated statistical confidence level.
The profiles of the C and H beams are measured at distances of and mm from the beginning of the interaction region (Figure 4). A retractable Faraday cup near the middle of the interaction region can be used to measure ion beam currents. The operating pressure in the interaction region is generally Torr. To minimize any deflection of the parent and daughter product beams due to external magnetic fields, the interaction region is shielded using a series of solenoid coils, similar to the configuration in both the C and H legs.
3.4 Signal Detection
One of the challenges of this research is separating the daughter ions from the parent beams as well as from any unwanted background. We accomplish the desired discrimination using electrostatic ion optics, which allows us to analyze the beams based on their kinetic energy.
The parent H beam is demerged from the C beam by the first pair of deflector plates in the chicane and directed with essentially 100% efficiency into a Faraday cup where the current is measured during data acquisition. Typical currents are nA. This corresponds to H beam densities of cm-3. The subsequent three pairs of deflector plates in the chicane bring the product ions and background C+ again onto the path of the neutral C beam.
The remaining neutrals and ions then continue into an electrostatic energy analyzer which consists of three 90∘ cylindrical deflectors in series. The neutral beam passes unaffected through a 12 mm diameter hole in the outer plate of the lower cylindrical deflector (LCD), and continues into a neutral detector which we monitor during data acquisition. The calibration of this detector is described in Section 3.5.
The cations are deflected vertically by the LCD, which directs the desired ions into the middle cylindrical deflector (MCD). The MCD deflects these ions perpendicular to their trajectories before and after the LCD. There is a hole in the outer plate of the MCD, behind which a Faraday cup is mounted. Thus, with no voltage on the MCD, we can measure the beam current at this point. Dubbed the upper cup, the transmittance from the interaction region to this Faraday cup is .
The upper cylindrical deflector (UCD) bends the selected ions another 90∘ in the same plane as that of the MCD, for a total of 180∘ in a single plane. We found that this 180∘ deflection was necessary in order to electrostatically separate C+, CH+, CH, and CH from each other. At the exit of the UCD, the selected ions are moving downwards in the laboratory.
Ions which are discriminated against will strike somewhere on the inside of the LCD, MCD, or UCD. The deflector plates of all three are coated with a fine layer of graphite to minimize both photon and secondary charged particle emission resulting from these undesired ions hitting the surfaces. Typical operating pressures, as measured near the MCD, are on the order of Torr.
The transmittance through the Chicane, LCD, MCD, and UCD was optimized using a proxy C- beam at kinetic energies similar to those predicted for the product CH ions and with inverted plate voltage polarities. This was carried out prior to data acquisition by mounting a Faraday cup at the exit of the UCD. The transmittance was found to be .
For data collection we installed a CEM at the exit of the UCD. Ions were detected in single particle counting mode. In front of the CEM we have mounted a grid with a geometric transmittance of . A voltage of V is applied to the grid to repel negative particles produced in any of the cylindrical deflectors. The CEM particle detection efficiency is discussed below in Section 3.6.
3.5 Neutral Current Measurement
Typical neutral particle currents, as measured in amperes, are nA. This corresponds to atomic C beam densities of cm-3. Beam fluctuations during data acquisition introduce an uncertainty in the measured . These are treated as a statistical uncertainty.
Neutral currents are measured on a particle collecting cup which can be externally configured either as a Faraday cup to measure ion currents directly or as a neutral detector to measure neutral particle currents via secondary negative particle emission. The transmission efficiency of a neutral beam from the interaction region to this cup was measured using a 28 keV C- proxy beam and found to be .
The neutral C particle current, as measured in amperes, is given by
| (13) |
Here is the current measured on the neutral detector and is the secondary negative particle emission coefficient for keV C striking the detector.
We used collisional detachment of C- to determine the of the neutral detector. Helium was leaked into the chicane. As C- passed through the He, single and double electron detachment formed C and C+, respectively. Triple electron detachment was found to form insignificant currents of C++ for the He gas pressures used. The various anion and cation currents were measured in the MCD upper cup by selecting the appropriate polarities for the voltage on the LCD and setting the MCD voltages to zero.
From conservation of particle flux, we expect at a given He pressure to have
| (14) |
where the subscripts label the beam currents, which are defined as positive quantities. This can be rewritten in terms of measured quantities as
| (15) |
where are the currents measured in the upper cup and the other quantities have been defined previously. Due to the configuration of the LCD, either or can be measured simultaneously with , but not both. So it is useful to rearrange this equation as
| (16) |
In order to determine , the currents and are measured simultaneously for a set of pressure values . The same is done for the currents and but as a result of the coarse control of the leak valve into the chicane, these data are collected on a different grid of pressure values . Each of these latter two currents are then fit to polynomials and , respectively, which allows us to interpolate the data onto the pressure grid. Expressing the ratio as the ratio of these polynomials then yields
| (17) |
Using this equation, we perform a least squares fitting over the entire pressure range for the measured and data and treat the quantities and as fitting parameters. Doing this we find where the uncertainty represents the run-to-run spread in the measured and is treated as a systematic uncertainty.
3.6 CEM Efficiency
We used a commercially available CEM to detect the ions resulting from the reactions studied. CEMs have been shown to have a detection efficiency of for cations with incident kinetic energies above 2 keV amu-1 (Crandall et al., 1975; Savin et al., 1995). To better quantify this, we have measured the detection efficiency of a CEM identical to that used for our chemical studies here. For this we used a beam of keV C+ ( keV amu-1) as a proxy for the CH product ions ( keV amu-1). These measurements were performed on a merged-beams apparatus at the Université catholique de Louvain. The apparatus and technique is described briefly below. A more technical description of the general apparatus used for calibration can be found in Staicu-Casagrande et al. (2004).
Starting with an electron cyclotron resonance (ECR) ion source, we extracted cations from the source and mass selected them to form a 25 keV beam of C++. The beam was then electrostatically deflected into a high vacuum region and into a floating cell. This deflection prevented any C+ formed upstream from making it into the floating cell, as such ions had the wrong energy-to-charge ratio to be transmitted into the cell. The floating cell was held at potential of kV, thus C++ ions entering the floating cell were accelerated to 29 keV. Inside the floating cell, a fraction of the C++ beam underwent electron capture to form 29 keV C+. C++ ions exiting the floating cell decelerated to 25 keV and the C+ to 27 keV.
After the floating cell, both carbon charge states are then separated using an electro-magnet which directs the nA 25 keV C++ current into a movable Faraday cup within the magnet and the pA 27 keV C+ current, generated in the floating cell, into a retractable Faraday cup at the exit of the magnet. The floating cell voltage shifts the energy-to-charge ratio, so that only those ions formed via electronic capture within the floating cell have the correct energy-to-charge ratio to reach the detector. Any C+ current produced outside of the floating cell will have a kinetic energy of 25 keV and not be directed into the retractable Faraday cup. Comparing the two currents we found that of the C++ underwent electron capture to form C+. We then attenuated the C++ beam at the source to give an pA C++ current as measured within the magnet. The changes in the source conditions had no measurable effect on the pressure in the floating cell or in the magnet. Hence, as we are in the single collision regime, it is safe to assume that the attenuated C+ particle count rate should be given by . Comparing this predicted value to that measured on a CEM situated directly behind the retractable Faraday cup, we find the CEM efficiency to be .
4 Beam Overlap and Relative Energies
We have determined the overlap of the two beams through a combination of beam profile measurements and geometric modeling. The beam profiles are measured using the two BPMs located in the interaction region. Typical profiles are shown in Figure 4. Simulations of the beam trajectories have been created based on the known experimental geometry and the measured beam profiles. These modeling studies are also used to determine the average relative energy and the corresponding energy spread. The methodology employed is similar to that described by Bruhns et al. (2010a) and is only briefly reviewed here.
4.1 Beam overlap
The overlap between the two beams at an arbitrary position is given by
| (18) |
where and are the fluxes of the neutral and ion beams, respectively; is chosen to lie along an axis defined by the propagating beams in the laboratory frame; and and are both perpendicular to the axis and to one another. Bruhns et al. (2010a) explain how this is implemented experimentally using the BPM data to calculate . These experimental values are used to constrain the geometric simulations described below. The geometric model enables us, in turn, to determine the average overlap factor in the interaction region
| (19) |
which is needed for Equation (11).
4.2 Geometric Simulations
Particle ray tracing was computed starting from a pseudo-plane analogous to the end of the interaction region. In this Monte Carlo simulation, the particles were flown in reverse from this plane and through the limiting apertures of their respective beam lines. Each particle was given a random starting position and an initial trajectory in this pseudo-plane. In addition, the kinetic energy for each particle was randomly assigned from a Gaussian probability distribution using the FWHM for the corresponding source.
4.2.1 Beam Profiles
Beam profiles were calculated from the simulated particle flux distribution at pseudo-plane analogs of the two BPM locations within the interaction region (see Figure 4). The profiles were derived along the lines of Equations (53) and (54) of Bruhns et al. (2010a). The simulated C beam profiles were found to be in good agreement with those measured. For the H beam, it was necessary to adjust the shape and position of the limiting apertures used in the calculations in order for the simulated profiles to best match those measured. These adjustments were required to account for a vertical shift of the H beam as it moved through the interaction region along with focusing effects induced by the beam merger, resulting in a typical average bulk misalignment of 0.81 mrad as determined from the beam profiles. SIMION studies indicate that these features are the result of a minor misalignment of the 1D lens prior to the 90∘ deflection which merges the H onto the C beam.
From our Monte Carlo trajectory simulation, we can readily calculate using Equation (18). This is highly advantageous as it is not possible to measure the beam profiles along the entire interaction region. We use these simulations as a guide for interpolating between the BPMs and for extrapolating upstream and downstream of the BPMs.
4.2.2 Relative Energies
Calculating the particle relative energies from the Monte Carlo simulation required that the interaction region be discretized into pseudo-planes. In turn, each pseudo-plane was further divided into square cells. The size of the cells was selected so as to ensure statistically significant particle densities. For every neutral-ion pair within each cell, we calculated the interaction angle and relative velocity. This process was repeated for every pseudo-plane. A typical simulation used 10,000 particles for each species with over 50 pseudo-planes, each divided into 900 cells. From these simulations, which take into account the bulk misalignment of the beam and their angular spreads, and binning the resulting interaction angles into a histogram, a Gaussian-like distribution emerged yielding a mean interaction angle of mrad.
A histogram for the calculated values of throughout the interaction region is shown in Figure 5 for a small sample of floating cell voltages. For nearly velocity-matched beams V, the relative velocity spread is dominated by the bulk interaction angle and the divergence of the two beams relative to one another. In this regime, the relative velocity spread is well described by a Maxwell-Boltzmann distribution222More precisely we used the form for a three-dimensional Maxwell-Boltzmann velocity distribution as expressed in spherical coordinates and then integrated over and , leaving the relative velocity as the sole remaining variable.. For floating cell values of V the relative velocity spread is determined largely by the energy spreads of the two ion sources. The resulting function tends towards a Gaussian distribution in velocity. The simulations also enable us to determine versus , along with the corresponding energy spread (see Figure 6). The simulations of the reaction complex studied here indicate that we achieved values of as low as meV, corresponding to an effective translational temperature of K (as derived from a Maxwell-Boltzmann fit of the velocity distribution).
5 Signal Determination
The signal rate was extracted by accounting for the various backgrounds using a standard beam chopping technique (Brouillard & Claeys, 1983). The neutral beam is chopped by turning the laser on and off. The timing of the laser is controlled using a programmable digital signal from the power supply unit (PSU). During typical operation the laser was gated on for 5 ms and off for 5 ms. The PSU also provides an external trigger. We sent this through a gate-and-delay generator and fed it into the fast high voltage switch that we use to chop the H beam. The delay time is set to 2.5 ms or a quarter of the period for the laser chopping pattern. The resulting square wave pattern used is shown in Figure 7.
The CEM counts for each quadrant of the chopping cycle are recorded in four individual counter channels as
| (20) | ||||
| (21) | ||||
| (22) | ||||
| (23) |
Here represents the signal counts with both beams on, is the background counts due to the C beam, is the background counts due to the H beam, and is the background counts with both beams off. The corresponding uncertainty in from counting statistics is given by
| (24) |
Data are collected at a given relative energy, for an integration time . Taking the chopping pattern into account, the corresponding counter rates are readily calculated by dividing by , yielding . The signal rate is then given by
| (25) |
where the fractional uncertainty in is .
Figure 8 shows count rates through as a function of the UCD plate potential. For this the LCD and MCD voltages were already optimized for transmittance of the CH+ signal. These rates have been normalized to the peak of the resulting signal rate scan, which is also shown in the figure. The largest of these beam-induced backgrounds occurs when the C beam is on. This background is due to C atoms stripping on residual gas and forming C+ ions with a kinetic energy close to that of the CH+ signal ions. A portion of the resulting C+ ions are transmitted through the electrostatic energy analyzer system and into the CEM for UCD voltages just below those giving the optimal transmission of the CH+ beam.
We confirmed the shape of the resulting signal scan using a proxy for the CH+ signal. The proxy was generated by tuning the kinetic energy of the C- beam to that expected for the CH+ signal. Double electron detachment on residual gas in the apparatus generated a C+ beam which we directed through the detector system and into a Faraday cup mounted at the CEM position. A comparison of the normalized proxy beam current is shown in Figure 9, along with the normalized signal counts. The transmitted profiles match closely, confirming that we have successfully removed the background from the signal. The proxy C+ scan profile skews similar to the signal profile. We carried out experimental tests which confirmed that this is due to the beams entering the LCD from the chicane at a slight angle and a mismatch in applied plate voltages with respect to that required for ion transmission along the central trajectory of the cylindrical deflectors.
6 Data Acquisition Procedure
For a typical data acquisition cycle, the C- and H beams are first each tuned independently to optimize the transported current and beam profiles in the interaction region. The beams are then tuned together to make them as parallel as possible. Once tuned, data acquisition begins. The data acquisition procedure is largely controlled via an automated Labview program. For a typical data acquisition run, is fixed and the signal counts recorded until the statistical uncertainty approaches .
The floating cell voltage was scanned in steps of 50 V for between 0 and V and from there in larger steps of 100 V up to kV. In order to minimize focusing of the C- beam by the floating cell, and hence of the C beam, we limited to voltages below 10% of the sputter source voltage, typically 2 keV. To achieve effective values of beyond kV, the C- ion source voltage was offset and scanned in 200 V steps from 0 to 2.0 kV. Varying the voltage offset on the source enabled us to achieve effective values of up to kV. The upper limit was defined by the maximum stable source potential of kV, combined with = 2 kV. As a result, we were able to scan between meV and 20 eV.
Data acquisition for a typical data run begins with the control program measuring the C and H beam profiles. While one beam is being profiled, the other is off. Beam chopping is then initiated and the beam currents measured. To within the stability of each beam, the chopped current measurement is half that of the unchopped beam. Next, all four counters are initialized and data are collected for an integration time of s. The current measurements and 10-s integration are repeated typically times. Afterwards, the chopping is turned off and the beam profiles are measured again. During the period between profile measurements, the beam currents are continually monitored and act as a proxy for the stability of the measurement and the alignment of the beams. The data acquisition cycle is repeated until either the statistical uncertainty approaches the desired level or the ion beams begin to de-tune.
7 Uncertainties and Averaging
Tables 1 and 2 list typical experimental operating values for the quantities going into Equation (11) and their associated uncertainties. The different terms are divided into those uncertainties which are statistical in nature (Table 1) and those which are systematic (Table 2). The signal data at a given relative energy were collected over a number of experimental runs until the counting-statistics uncertainty in was typically less than 4%. More details about the various terms can be found in Sections 3-5.
For each data run at a given , we calculated the measured merged-beams rate coefficient and the associated statistical-like experimental uncertainty . The various runs at that energy were averaged together using a weighting of
| (26) |
The resulting merged-beams rate coefficient and associated statistical-like uncertainty is then given by
| (27) |
There is an additional 12% systematic uncertainty on each resulting merged-beams rate coefficient.
8 Results
8.1 Experimental Merged-Beams Rate Coefficients
Figure 10 presents our experimental results for the merged-beams rate coefficient as a function of the average relative energy for , reaction (3), and for , reaction (5). The error bars show the statistical-like uncertainty. We also searched for CH signal from reaction (6): . However, analyzer scans within the predicted kinetic energy range for the CH signal yielded count rates indistinguishable from the background noise. At matched beam velocities, meV, the measured rate coefficient of cm3 s-1, enables us to put a upper limit of cm3 s-1 on this channel.
8.2 Cross Sections
We have extracted the cross section from our data using the functional form
| (28) |
where denotes either reaction (3) or (5). The resulting cross sections are in units of cm2 for in eV. Over the ranges for which data were measured, the fitting accuracy was between % for reaction (3) and % for reaction (5).
Concerning the first term of the denominator in Equation (28), leaving the power as a free fitting parameter yields an behavior at low energies for CH+ formation. For the case of CH, we find an behavior. We attribute the large uncertainty in this term to the rapid decrease of the CH merged-beams rate coefficient with relative energy. As a result the fit is dominated by the higher order terms. Here, we have chosen to use for both channels as it agrees to within the experimental uncertainties and for which there is some theoretical support. This term results in a thermal rate coefficient with a behavior at low temperatures and matches the calculated behavior for the thermal rate coefficient of the electronically similar reaction complex , which is predicted to be dominated at low temperatures by the charge-quadrupole interaction (Klippenstein et al., 2010). The terms in the denominator with greater powers of have been arbitrarily selected to match the higher energy dependence in each of the measured merged-beams rate coefficients.
The best fit parameters were derived using these functional forms for the cross sections, multiplying them by , convolving them with the experimental velocity distribution, and performing a fit between the measured merged-beams rate coefficients and the model. The resulting best fits to the data are shown by the solid lines in Figure 10. For reaction (3) the fit is good over the measured relative energy range of meV to 20 eV and for reaction (5) from meV to 3 eV. The best fit parameters of the cross section for each reaction are given in Table 3. The experimentally derived cross sections for both reactions are plotted in Figure 11.
8.3 Translational Temperature Rate Coefficients
The translational temperature rate coefficient , for reaction , is derived by multiplying the extracted cross section by the relative velocity and convolving the product with a Maxwell-Boltzmann distribution. Using Equation (28) as a guide, we have fit our resulting rate coefficients with
| (29) |
where denotes either reaction (3) or (5). The resulting rate coefficients are given in units of cm3 s-1 for in units of K. The best fit parameters for each reaction are given in Table 4.
The experimentally derived translational temperature rate coefficients are shown by the solid curves in Figure 12. The shaded regions show the quadrature sum of the systematic uncertainty and the fitting accuracy, yielding an uncertainty of between % for reaction (3) and between % for reaction (5). The low temperature limit for the validity of the derived translational temperature rate coefficients is K, which is the effective translational temperature of our experimental energy spread for the minimum achieved. The functional form of Equation (29) has been chosen so that the extrapolation below 72 K goes to a behavior as predicted by Klippenstein et al. (2010) for the electronically similar reaction complex . The high temperature limits for the fits of and K correspond to the highest values of measured for reactions (3) and (5) of and 3 eV, where the cross sections are vanishingly small.
9 Discussion
An energy-level diagram for the various reaction pathways which we discuss in this section can be found in Figure 13. The sources for the derivation of this energy-level diagram are given in the figure caption.
9.1 Merged-Beams Rate Coefficient
9.1.1
The neutral C is of symmetry. H is of 1A symmetry, as this is the only electronic state which lies below the dissociation limit of the molecule (McNab, 1995). The final electronic state of H2 is . Hence, taking the spin multiplicities into account (i.e., ignoring possible intersystem transitions to the CH singlet manifold), the lowest accessible symmetry of CH+ is the electronic state (Talbi et al., 1991; Bettens & Collins, 1998). Putting it all together we can re-write reaction (3) as
| (30) |
This reaction is exoergic by eV (Delsaut & Liévin, 2015). The only additional channel for CH+ formation is the endoergic reaction:
| (31) |
The threshold for this reaction is eV.Delsaut & Liévin (2015)
Our measured merged-beams rate coefficient for reaction (3) exhibits a relative energy dependence that is similar to that measured by Schuette & Gentry (1983) for reaction (9): . Figure 10 presents their cross section results multiplied by . Both measurements show an initial increase in the merged-beams rate coefficient with increasing relative energy. Possible reasons for the similar behaviors seen with increasing energy could be due to the opening up of new electronic states in the intermediate reaction complex or to additional ro-vibrational channels becoming energetically accessible in the daughter products. Clearly, though, further theoretical and experimental work is needed to understand the observed behavior.
At some point, the magnitude of the rate coefficient dramatically decreases with increasing relative energy. We attribute this to the opening of additional reaction pathways that compete with the reaction we are measuring. The first four of these channels are:
| (32) | |||||
| (33) | |||||
| (34) | |||||
| (35) |
with threshold energies of 1.98, 2.69, 4.32, and 6.16 eV, respectively (see Figure 13). In this relative energy range, we also see no obvious sign for the onset of CH+ formation via reaction (31). We attribute this, in part, to the opening of the above competing channels.
A similar decrease was seen by Urbain et al. (1991) for the associative ionization (AI) reaction . One difference, though, is that the cross section for the AI reaction shows a sharp and dramatic decrease at the opening of the competing channel. This is readily explained by the well-defined initial internal energies of the reactants and the absence of any internal degrees of freedom in their products.
In our results we cannot unambiguously identify the opening of any of the above channels competing with reaction (3). Moreover, the decrease seen in our data is not as sharp as that seen by Urbain et al. (1991). Both the shift and broadening of the observed threshold are most likely due to the H internal excitation. The range of possible ro-vibrational levels that can contribute to the process effectively leads to a smearing out with relative energy, unlike what was seen by Urbain et al. (1991) for atomic collision partners. Additionally, the empirical fit to our data suggests that the merged-beams rate coefficient peaks at around 1.37 eV. This is about 0.61 eV below the opening of the first competing pathway at 1.98 eV, implying a level of internal excitation for the H in our experiment that is in rough agreement with the predictions of Anicich & Futrell (1984) and the measurements of Urbain (private communication), which are discussed in Section 3.2. Using the partition function of Kylänpää & Rantala (2011), this 0.61 eV of excitation corresponds to an internal temperature of K.
9.1.2
Our results for reaction (5) show a decreasing merged-beams rate coefficient with increasing relative energy. Bettens & Collins (1998) describe the formation process of CH as involving the rearrangement of the CH complex followed by the ejection of one hydrogen atom. Using this as the basis of a hand-waving argument, we attribute the observed energy dependence to the decreasing time available for the rearrangement of the CH complex as the collision energy increases. Clearly, though, further theoretical and experimental work will be needed to resolve this issue. Then at eV, similarly to that observed for reaction (3), the process rapidly decreases in strength. This suggests that we are seeing the onset of the competitive channels, reactions (32) to (35), but again shifted to a lower relative energy due to the internal excitation the H in our measurement.
9.2 Translational Temperature Rate Coefficients
The reaction of ground-term C with cations is predicted by Gentry & Giese (1977) to be driven by the long-range shape of the PES. At these distances we do not expect the internal excitation of the H to play any role. Based on these assumptions and the statistical population of the C fine-structure levels, we expect our translational temperature rate coefficient to be equivalent to a thermal equilibrium rate coefficient for K.
9.2.1
At 300 K, the Langevin rate coefficient adopted for this reaction by the astrochemical databases (Wakelam et al., 2012; McElroy et al., 2013) is a factor of times larger than our results, while the semi-classical results of Talbi et al. (1991) and Bettens & Collins (1998, 2001) are larger by factors of and , respectively, as can be seen in Figure 12. The cause for the discrepancies is not immediately obvious. It is unlikely to be due to the differences in the population of the fine-structure levels in the atomic C, which are expected to be statistically populated in gas above 300 K as well as in our experiment. So it seems to us that a more likely explanation for the discrepancies is that the actual potential energy surfaces are less attractive than those used in the calculations, possibly due to an underestimate of the spin-orbit coupling strength (see Equations 6-10, Figure 4, and Appendix B of Klippenstein et al., 2010).
One might also be tempted to attribute these differences to the internal excitation of the H ions used for the present results, as the calculations were performed for internally cold H. However, a comparison to the work of Savić et al. (2005) strongly suggests that this is not the case. Our translational temperature rate coefficient is in very good agreement with the mass-scaled results of Savić et al. (2005). Their work used an effusive C beam, at an estimated translational temperature of K, colliding with D stored in an ion trap, with wall temperatures of K. Assuming that the D cloud is approximately at rest with respect to the C beam, the translational temperature of the interaction is given by
| (36) |
yielding K. The very good agreement between their work and ours suggests that at this translational temperature the internal excitation of the H affects our results at a level constrained by the size of the mutual experimental uncertainties. We expect this to remain valid down to 300 K, as we can posit no reason for this situation to change so long as the fine-structure levels of the C remain statistically populated. Thus, at 300 K it seems unlikely that the differences between theory and our results can be attributed to internal excitation of the H.
9.2.2
Our results indicate that there is no energy barrier for reaction (5) with internally excited H. This is to be contrasted with the calculations of Talbi et al. (1991) who predict the existence of such a barrier. Later calculations by Bettens & Collins (1998, 2001) find no such barrier, but their predicted thermal rate coefficient lies a factor of below our results at 300 K (see Figure 12). Results similar to ours were found by Savić et al. (2005) for internally cold D. The very good agreement that we find between our work and their mass-scaled results suggests that indeed there is no barrier for this particular system.
Coming back to the work of Savić et al. (2005), they could not exclude the possibility of the deuterium-abstraction parasitic reaction
| (37) |
contributing to the formation of CD. For that reason they gave only lower limits for their uncertainty on reaction (7). Such a parasitic reaction would effectively reduce their inferred CD+ rate coefficient while boosting their CD rate coefficient. In our experimental setup, the low density of the parent H beam combined with the low CH+ formation rate yields an insignificant rate for a parasitic reaction forming CH. Hence, the good agreement between our results for reactions (3) and (5) and their mass-scaled results for reactions (4) and (7) suggest that, to within our mutual error bars, parasitic reactions were not an issue for their measurements of these two reactions.
9.2.3
For radiative association to occur, the CH collision complex must radiate away binding energy plus any internal energy of the parent H ion. Based on our results for reaction (6), we can put a upper limit on the translational temperature rate coefficient at 72 K of cm3 s-1, for an H internal energy of eV. The mass-scaled results of Savić et al. (2005) of cm3 s-1, lie within this limit, though their results are for the much higher translational temperature of K and with insignificant internal excitation of the H. Still we find it unlikely that the rate coefficient for this reaction can be as high as their results suggest. Their data imply a surprisingly flat temperature dependence for this radiative association reaction. Moreover, previous experimental and theoretical studies for radiative association reactions have found rate coefficients many orders of magnitude smaller (Gerlich & Horning, 1992). Savić et al. (2005) suggest that their results for this reaction may have been contaminated by parasitic reactions. For example, there is the two-step process of reaction (7) followed by the deuterium-abstraction reaction
| (38) |
or the three-step, and therefore less likely, process of reaction (4) followed by reaction (37) and then by reaction (38). The rate coefficient measured by Savić et al. (2005) can readily be explained if in their apparatus the effective rate coefficient for either of these two pathways was of the rate coefficient for the initial step. Unfortunately the uncertainty limits on their and our results do not enable us to tease out the explanation for their having measured such a high rate coefficient for this radiative association process.
9.3 Converting Translational Temperature to Thermal Rate Coefficients
Talbi et al. (1991) and Bettens & Collins (1998, 2001) carried out their calculations at 10 K. In their work, they treat the reaction adiabiatically and ignore surface crossing and intersystem transitions. This approach is still standard for theoretical rate coefficients (Klippenstein et al., 2010; Li & Guo, 2014). Additionally, Talbi et al. (1991) and Bettens & Collins (1998, 2001) extrapolated to temperatures up to 300 K by multiplicatively scaling their results to account for the temperature dependence of fractional populations of the attractive surfaces involved in the reaction. Here we take a similar approach. Using our translational temperature results on statistically populated ground-term C, we convert them to thermal rate coefficients using factors, derived below, which account for the temperature dependence of the fractional population of the attractive surfaces involved. In converting our translational temperature results to thermal data, we also ignore the internal excitation of the H in our experiment. The role of internal excitation remains an open question for barrierless complex-forming reactions such as those studied here. Typically no enhancement in reactivity is expected (e.g., Guo, 2012). However, experimental and theoretical work has shown that for some reactions internal excitation can significantly enhance reactivity (see Li & Guo, 2014, and references therein). Our work cannot resolve this issue. But ignoring the H internal excitation here seems a reasonable approximation based on the good agreement between our results on hot H and the mass-scaled results of Savić et al. (2005) on cold D.
Gentry & Giese (1977) investigated reactions of ground-term atomic C with cations. That work used the adiabatic approximation in which the process is driven by the long-range shape of the PESs. The only aspect of the cation accounted for is the charge. They find that for ground-term C reacting with a cation, the nine states in the C() manifold form six attractive surfaces and three repulsive. These can be characterized at long range by the level and state of the carbon. The one state of the level and three states of the level correlate with attractive surfaces. For the level, two of the states correlate to attractive surfaces and three to repulsive.
Building on the work of Gentry & Giese (1977), Talbi et al. (1991) and Bettens & Collins (1998, 2001) have extended it to reactions with . They find that the reaction proceeds not through the singlet ground symmetry of CH, but rather through excited triplet surfaces of the intermediate . In fact, in the reaction the C atom is predicted to be preferentially directed towards the apex of the H triangle (cf., Figure 1 of Bettens & Collins, 1998) The lowest energy triplet is the 3A′′, which does not lie along the reaction path. Complete rearrangement is needed to reach the 3A′′ state, namely the insertion of the C atom between the three H nuclei.
Using the adiabatic approximation Talbi et al. (1991) and Bettens & Collins (1998, 2001) correlate the carbon fine-structure levels to the PESs of the intermediate, namely the 3B2 symmetry and the slightly higher 3B1 symmetry, which are both attractive, while the next higher triplet symmetry, the 3A2 is repulsive. The six attractive surfaces are assumed to correlate adiabatically with the six attractive surfaces formed by the 3B2 and 3B1 symmetries and the three repulsive surfaces to the three formed by the 3A2 symmetry.
This leads to a one-to-one mapping of the long-range surfaces to those of the CH intermediate. Using a ket notation for the ground-term C, the state, the state, and one of the two states all map to the 3B2 symmetry. The other one of the states and both of the states all map to the 3B1 symmetry. Lastly, both of the states and the single state all map to the 3A2 symmetry.
Putting this all together, the partition functions for the attractive 3B2, 3B1, and 3A2 symmetries are given by
| (39) | |||||
| (40) | |||||
| (41) |
with defined by Equation (12). The partition functions for the 3B2 and 3B1 symmetries are shown in Figure 14. The temperature dependence for the fractional population on attractive surfaces forming either of these ions is given by the factor
| (42) |
which starts out at 1 at low temperature and decreases to 2/3 at high temperature, as can be seen in Figure 14. The partition function of the repulsive 3A2 symmetry is given by . All three partition functions converge to a value of at high temperature, i.e., for statistically populated levels. Based on the above discussion and using these partition functions, we can develop all the scale factors needed to account for the temperature dependence of the fractional population on attractive surfaces.
Talbi et al. (1991) and Bettens & Collins (1998, 2001) find that the 3B2 and 3B1 symmetries both lead to formation. Calculations by Bettens & Collins (1998, 2001) indicate that the cross sections are the same for formation of CH+ via the 3B2 and 3B1 symmetries. Furthermore, they find that ground-symmetry CH forms only via the CH(3B2) surface.
The calculations of Bettens & Collins (1998, 2001), the measurements of Savić et al. (2005), and our results, all find that both the CH+ and CH channels are open. Thus the Langevin rate coefficient corresponds to the sum of the rate coefficients for these two channels. The temperature dependent Langevin thermal rate coefficient can then be written as
| (43) |
The resulting temperature dependent Langevin rate coefficient is shown in Figure 15.
In order to convert our translational temperature results to thermal rate coefficients, we first add together the translational temperature rate coefficients for reactions (3) and (5) and multiply the sum by . This corrects our experimental data where only two-thirds of the C fine-structure levels contribute to the reaction process. Next we convert our results for CH formation based on the predictions of Bettens & Collins (1998, 2001) that only the symmetry is involved. Hence, to derive the thermal rate coefficient for reaction (5) we need only multiply the translational temperature results by the factor . This corrects our experimental data where only one-third of the C fine-structure levels contribute to the formation of CH. Lastly, for the thermal rate coefficient for reaction (3), we take the summed thermal rate coefficient for reactions (3) and (5) subtract from it that for reaction (5). The resulting thermal rate coefficients for reactions (3) and (5) are shown in Figure 15 and for the summed thermal rate coefficient in Figure 16.
9.4 Thermal Rate Coefficients
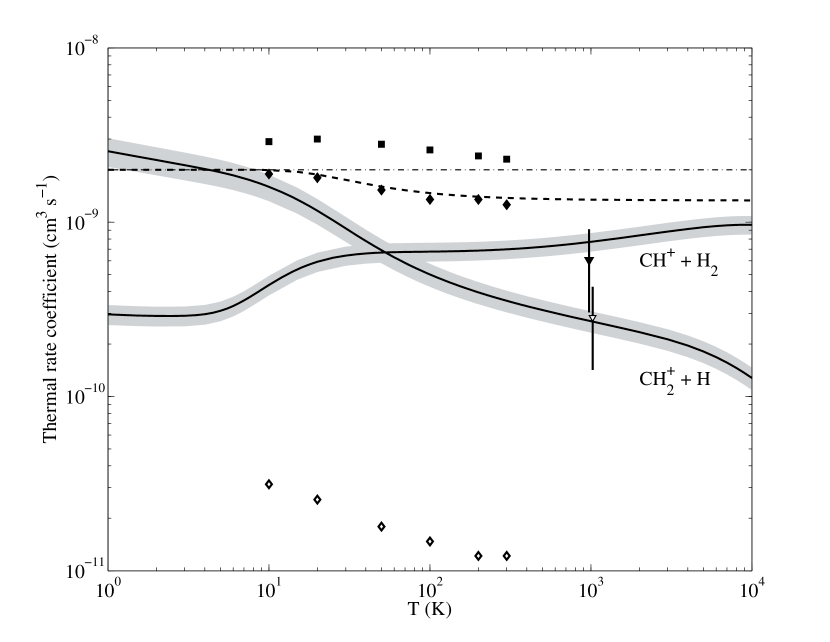
Our experimentally derived thermal rate coefficient for reaction (3) decreases with decreasing temperature. A comparison with the theoretical calculations of Talbi et al. (1991) and Bettens & Collins (1998, 2001), shown in Figure 15, finds poor agreement in both the magnitude and temperature dependence. At 10 K the calculations of Talbi et al. (1991) are a factor of greater than the experimental results. This discrepancy decreases with increasing temperature and is at 300 K. Over this same temperature range, the calculations of Bettens & Collins (1998, 2001) lie a factor of above ours at 10 K and at 300 K. The current astrochemical databases (Wakelam et al., 2012; McElroy et al., 2013) use the Langevin rate coefficient for reaction (3). The unmodified and modified Langevin rate coefficients also do a poor job of reproducing our experimental results for this channel. This is not surprising since, as discussed above, the Langevin rate coefficient should be taken as representing the sum of the rate coefficients for reactions (3) and (5). Lastly, we note that the modified Langevin rate coefficient closely matches the calculations of Bettens & Collins (1998, 2001).
For reaction (5), our experimentally derived thermal rate coefficient increases with decreasing temperature. The theoretical calculations of Bettens & Collins (1998, 2001) show a roughly similar temperature dependence, but differ significantly in the magnitude of the rate coefficient. At 10 and 300 K, their calculations lie a respective factor of and 29 times below our results. Theory appears to greatly underestimates the importance of this channel.
Above K the statistical fractional population in our experiment of the ground term C() closely matches a thermal distribution. A similar situation is expected for the K carbon atoms in the Savić et al. (2005) measurements. Hence, we expect in both experiments that the corresponding CH symmetries will be thermally populated. Thus, above 300 K our experimental rate coefficient remains essentially unchanged from that presented in Figure 12. As such, for formation of both CH+ and CH, there remains good agreement of our results with the mass-scaled experimental data from Savić et al. (2005).
We attribute all the differences between theory and our experimental results to a combination of factors. The first, as mentioned earlier, is that the potential energy surface of the system is less attractive at large internuclear distances than currently predicted. Secondly, formation of CH is over an order of magnitude easier than calculated by published theory. Lastly, these effects are amplified by the temperature dependence for the fractional population of reacting states.
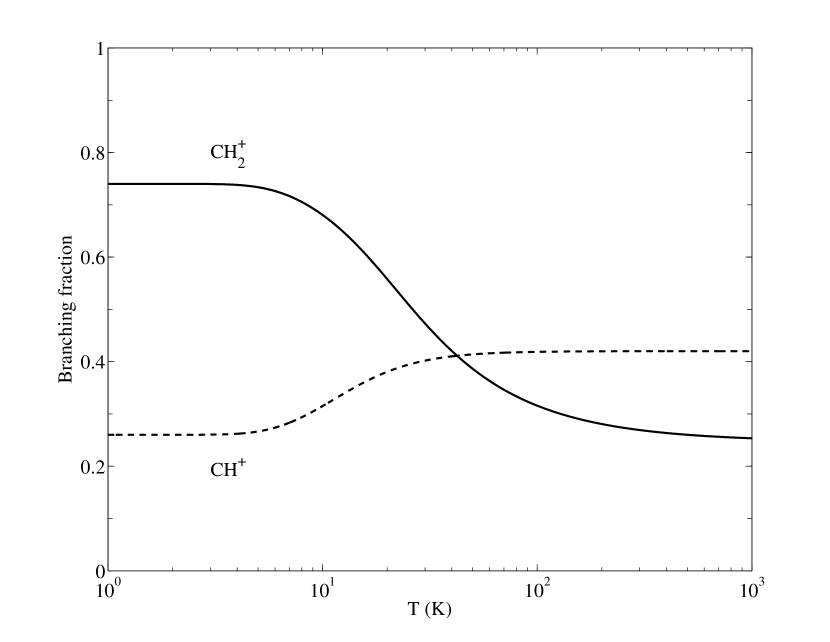
The effects of the changing population of the attractive 3B1 and 3B2 symmetries can also be seen in the Figure 17 which shows the branching ratio for forming CH+ and CH. Formation of CH+ dominates above K. Below this temperature the populations of the 3B1 and 3A2 symmetries decrease and all of the population shifts into the 3B2 symmetry, reducing the rate coefficient for CH+ formation and increasing that for CH formation. In fact, our results predict that at the K temperature typical of dark molecular clouds approximately 80% of all reactions lead directly to CH. This may be an issue for astrochemical models as this important channel is currently absent from astrophysical databases.
10 Some Astrophysical Implications
In gas-phase astrochemistry of dark molecular clouds, the CH molecule is predicted to play a key role in the synthesis of complex organic molecules (Smith & Spanel, 1995). Reaction (3) contributes to CH formation via the hydrogen abstraction chain
| (44) |
On the scale of a dark cloud lifetime, the initial formation of CH+ via reaction (3) is slow due to the low abundances of C and H in the cloud. However, once the CH+ molecule is formed it rapidly proceeds to CH due to the high H2 abundance and fast rate coefficient for the hydrogen abstraction reactions. Our thermal rate coefficient for reaction (3) at 10 K is significantly smaller than the unmodified Langevin value used in current astrochemical databases (Wakelam et al., 2012; McElroy et al., 2013). At higher temperatures, it is still significantly reduced, suggesting a slower formation rate at higher temperatures for CH from the pathway and thereby a reduced abundance of more complex organic molecules.
One needs, however, to also take into account reaction (5) which is currently not included in astrochemical models. This can lead to the formation of CH via
| (45) |
which also proceeds rapidly for the same reasons as reaction pathway (44). We note reaction (45) also enables CH formed via reaction (2) to go on to form CH. Thus the rate coefficient for the reaction complex forming CH is effectively the sum of the thermal rate coefficients for reactions (3) and (5).
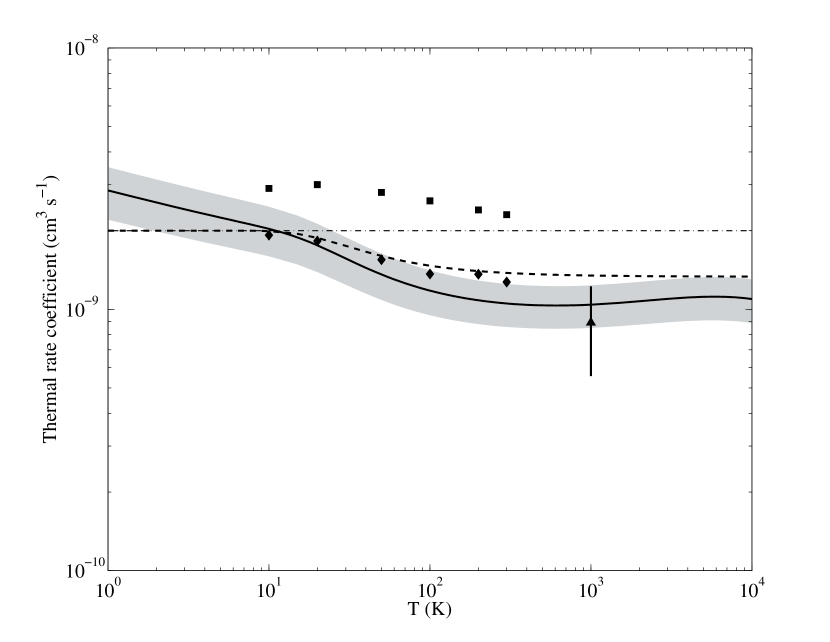
Figure 15 shows the summed thermal rate coefficients for our results as well as the published theoretical and experimental results. Table 5 provides a numerical comparison at selected temperatures. The results of Talbi et al. (1991) always fall outside the estimated experimental uncertainty limits. The unmodified Langevin rate coefficient lies within these experimental limits from to 30 K. The modified Langevin results show reasonable agreement from to 60 K and are only slightly discrepant above K. Comparing to the summed results of Bettens & Collins (1998, 2001), we find surprisingly good agreement over most of the K temperature range that they covered. Lastly, we continue to find good agreement with the experimental results of Savić et al. (2005).
Based on these comparisons, we expect that incorporating our results into astrochemical models will have a temperature-dependent effect on the gas-phase formation rate for CH and the more complex organic molecules that are formed from CH. At 10 K our summed rate coefficient for the reaction is in good agreement with the unmodified Langevin value currently used in the astrochemical databases. However, at 300 K, our summed value is a factor of lower. Determining the full astrochemical implications of our results will require a detailed chemical simulation incorporating our findings, which is beyond the scope of our work here.
We also would like to point out that in molecular clouds, for densities of cm-3 or higher, the population of the levels is expected to be in thermal equilibrium. At lower densities the excitation of the levels is probably less than thermal (Nussbaumer & Rusca, 1979). It is clear that the field will eventually need fine-structure resolved rate coefficients.
11 Summary
We have developed a novel, merged fast-beams apparatus which allows us to merge a beam of molecular ions onto a neutral beam of ground-term atoms. Here we have described the apparatus in detail. For the proof-of-principle studies, we have measured the chemistry of forming CH+, CH, and CH. Our measurements were performed for statistically populated C() in the ground term, which is nearly equivalent to the population expected for thermal temperatures above 300 K. Hence, our translational temperature results are expected to be similar to thermal results above this temperature. At K, we find good agreement between our results and the mass-scaled results from published ion trap measurements for forming CD+ and CD. At 300 K, our results for CH+ formation lie a factor of below both the unmodified Langevin value currently in the astrochemical databases and the published semi-classical results. These databases do not currently include the CH formation channel. Our translational temperature results at 300 K for forming CH are a factor of larger than the semi-classical results. Additionally, we have used statistical arguments as a guide to convert our translational temperature results to thermal results for temperatures below 300 K. Our conversion indicates that formation of CH will dominate over that of CH+ at temperatures below K. Clearly, though, further experimental work using cold H molecules and more sophisticated theoretical calculations are needed to test this prediction.
12 Acknowledgments
The authors thank E. Herbst, M. Delsaut, J. Liévin, B. J. McCall, E. F. McCormack, and P. C. Stancil for stimulating conversations. We also thank the referee for their insightful and helpful review. This work was supported in part by the Advanced Technologies and Instrumentation Program and the Astronomy and Astrophysics Grants Program in the NSF Division of Astronomical Sciences. X. Urbain is Senior Research Associate of the F.R.S.-FNRS.
References
- Aberth & Peterson (1967) Aberth, W. & Peterson, J. R. 1967, Rev. Sci. Instrum., 38, 745
- Albertsson et al. (2013) Albertsson, T., Semenov, D. A., Vasyunin, A. I., Henning, T., & Herbst, E. 2013, Astrophys. J. Suppl. Ser., 207, 27
- Althorpe & Clary (2003) Althorpe, S. C. & Clary, D. C. 2003, Annu. Rev. Phys. Chem., 54, 493
- Anicich & Futrell (1984) Anicich, V. G. & Futrell, J. H. 1984, Int. J. Mass Spectrom. Ion Proc., 55, 189
- Bettens & Collins (1998) Bettens, R. P. A. & Collins, M. A. 1998, J. Chem. Phys., 108, 2424
- Bettens & Collins (2001) —. 2001, J. Chem. Phys., 114, 6490
- Bowman et al. (2011) Bowman, J. M., Czakó, G., & Fu, B. 2011, Phys. Chem. Chem. Phys., 13, 8094
- Brouillard & Claeys (1983) Brouillard, F. & Claeys, W. 1983, in Physics of Ion-Ion and Electron-Ion Collisions (New York: Plenum Press), 415–459
- Bruhns et al. (2010a) Bruhns, H., Kreckel, H., Miller, K., Lestinsky, M., Seredyuk, B., Mitthumsiri, W., Schmitt, B. L., Schnell, M., Urbain, X., Rappaport, M. L., Havener, C. C., & Savin, D. W. 2010a, Rev. Sci. Instrum., 81, 013112
- Bruhns et al. (2010b) Bruhns, H., Kreckel, H., Miller, K. A., Urbain, X., & Savin, D. W. 2010b, Phys. Rev. A, 82, 042708
- Crandall et al. (1975) Crandall, D. H., Ray, J. A., & Cisneros, C. 1975, Rev. Sci. Instrum., 46, 562
- Delsaut & Liévin (2015) Delsaut, M. & Liévin, J. 2015, J. Chem. Phys., in preparation
- Doucas (1977a) Doucas, G. 1977a, Int. J. Mass Spectrom. Ion Phys., 25, 71
- Doucas (1977b) —. 1977b, Revue de Physique Appliquée, 12, 1465
- Gay et al. (2011) Gay, C. D., Stancil, P. C., Lepp, S., & Dalgarno, A. 2011, Astrophys. J., 737, 44
- Gentry & Giese (1977) Gentry, W. R. & Giese, C. F. 1977, J. Chem. Phys., 67, 2355
- Gerlich (2008) Gerlich, D. 2008, in Low Temperature and Cold Molecules, ed. I. W. M. Smith (London, UK: Imperial College Press), 121–174
- Gerlich et al. (2011) Gerlich, D., Borodi, G., Luca, A., & Mogo, C. Smith, M. A. 2011, Phys. Chem. Chem. Phys., 225, 475
- Gerlich & Horning (1992) Gerlich, D. & Horning, S. 1992, Chem. Rev., 92, 1509
- Gioumousis & Stevenson (1958) Gioumousis, G. & Stevenson, D. P. 1958, J. Chem. Phys., 29, 294
- Gu et al. (2006) Gu, X., Guo, Y., Kawamura, E., & Kaiser, R. 2006, J. Vac. Sci. Technol. A, 24, 505
- Guo (2012) Guo, H. 2012, Int. Rev. Phys. Chem., 31, 1
- Herbst & Millar (2008) Herbst, E. & Millar, T. J. 2008, in Low Temperature and Cold Molecules, ed. I. W. M. Smith (London, UK: Imperial College Press), 1–56
- Kaiser & Suits (1995) Kaiser, R. I. & Suits, A. G. 1995, Rev. Sci. Instrum., 66, 5405
- Klippenstein et al. (2010) Klippenstein, S. J., Georgievskii, Y., & McCall, B. J. 2010, J. Phys. Chem. A, 114, 278
- Kreckel et al. (2010) Kreckel, H., Bruhns, H., Čížek, M., Glover, S. C. O., Miller, K. A., Urbain, X., & Savin, D. W. 2010, Science, 329, 69
- Kylänpää & Rantala (2011) Kylänpää, I. & Rantala, T. T. 2011, J. Chem. Phys., 135, 104310
- Li & Guo (2014) Li, A. & Guo, H. 2014, J. Phys. C, 118, 11168
- McElroy et al. (2013) McElroy, D., Walsh, C., Markwick, A. J., Cordiner, M. A., Smith, K., & Millar, T. J. 2013, Astron. & Astrophys., 550, A36
- McNab (1995) McNab, I. R. 1995, Adv. Chem. Phys., 89, 1
- Nussbaumer & Rusca (1979) Nussbaumer, H. & Rusca, C. 1979, Astron. & Astrophys., 72, 129
- Rodgers & Millar (1996) Rodgers, S. D. & Millar, T. J. 1996, Mon. Not. R. Astron. Soc., 280, 1046
- Savić et al. (2005) Savić, I., Cermák, I., & Gerlich, D. 2005, Int. J. Mass Spectrom., 240, 139
- Savin et al. (1995) Savin, D. W., Gardner, L. D., Reisenfeld, D. B., Young, A. R., & Kohl, J. L. 1995, Rev. Sci. Instrum., 66, 67
- Scheer et al. (1998) Scheer, M., Bilodeau, R. C., Brodie, C. A., & Haugen, H. K. 1998, Phys. Rev. A, 58, 2844
- Schuette & Gentry (1983) Schuette, G. F. & Gentry, W. R. 1983, J. Chem. Phys., 78, 1777
- Seman & Branscomb (1962) Seman, M. L. & Branscomb, L. M. 1962, Phys. Rev., 125, 1602
- Smith & Spanel (1995) Smith, D. & Spanel, P. 1995, Mass Spectrometry Reviews, 14, 255
- Staicu-Casagrande et al. (2004) Staicu-Casagrande, E., Nzeyimana, T., Naji, E., de Ruette, N., Fabre, B., Le Padellec, A., & Urbain, X. 2004, Eur. Phys. J. D, 31, 469
- Stancil et al. (1998) Stancil, P. C., Lepp, S., & Dalgarno, A. 1998, Astrophys. J., 509, 1
- Takao et al. (2007) Takao, T., Jinno, S., Hanada, K., Goto, M., Oshikiri, K., Okuna, K., Tanuma, H., Azuma, T., & Shiromaru, H. 2007, J. Phys. Conf. Ser., 88, 6
- Talbi et al. (1991) Talbi, D., Defrees, D. J., Egolf, D. A., & Herbst, E. 1991, Astrophys. J., 374, 390
- Urbain et al. (1991) Urbain, X., Cornet, A., Brouillard, F., & Giusti-Suzor, A. 1991, Phys. Rev. Lett., 66, 1685
- van Dishoeck (1998) van Dishoeck, E. F. 1998, in The Molecular Astrophysics of Stars and Galaxies, ed. T. W. Harquist and D. A. Williams (Oxford, UK: Clarendon Press), 53–99
- Vasyunin et al. (2008) Vasyunin, A. I., Semenov, D., Henning, T., Wakelam, V., Herbst, E., & Sobolev, A. M. 2008, Astrophys. J., 672, 629
- Wakelam et al. (2012) Wakelam, V., Herbst, E., Loison, J.-C., Smith, I. W. M., Chandrasekaran, V., Pavone, B., Adams, N. G., Bacchus-Montabonel, M.-C., Bergeat, A., Béroff, K., Bierbaum, V. M., Chabot, M., Dalgarno, A., van Dishoeck, E. F., Faure, A., Geppert, W. D., Gerlich, D., Galli, D., Hébrard, E., Hersant, F., Hickson, K. M., Honvault, P., Klippenstein, S. J., Le Picard, S., Nyman, G., Pernot, P., Schlemmer, S., Selsis, F., Sims, I. R., Talbi, D., Tennyson, J., Troe, J., Wester, R., & Wiesenfeld, L. 2012, Astrophys. J. Suppl. Ser., 199, 21
- Wakelam et al. (2009) Wakelam, V., Loison, J.-C., Herbst, E., Talbi, D., Quan, D., & Caralp, F. 2009, Astron. & Astrophys., 495, 513
- Wakelam et al. (2010) Wakelam, V., Smith, I. W. M., Herbst, E., Troe, J., Geppert, W., Linnartz, H., Öberg, K., Roueff, E., Agúndez, M., Pernot, P., Cuppen, H. M., Loison, J. C., & Talbi, D. 2010, Space Sci. Rev., 156, 13
- Wilson et al. (2012) Wilson, A. V., Parker, D. S. N., Zhang, F., & Kaiser, R. I. 2012, Phys. Chem. Chem. Phys., 14, 477
- Zhou et al. (2004) Zhou, H. L., Manson, S. T., Hibbert, A., Ky, L. V., Feautrier, N., & Chang, J.-C. 2004, Phys. Rev. A, 70, 022713
| Source | Symbol | Section | Value | Uncertainty (%) |
|---|---|---|---|---|
| Signal rate | 5 | 1-15 Hz | 4 | |
| C velocity | 3.1 | cm s-1 | 1 | |
| H velocity | 3.2 | cm s-1 | 1 | |
| C current | 3.5 | 30 nA | 5 | |
| H current | 3.3 | 200 nA | 5 | |
| Overlap factor | 4 | 2.7 cm-2 | 10 | |
| Statistical-like uncertainty (single run) | 13 |
| Source | Symbol | Section | Value | Uncertainty (%) |
|---|---|---|---|---|
| Analyzer transmission | 3.4 | 0.73 | 3 | |
| Grid transmission | 3.4 | 0.90 | 1 | |
| Neutral transmission | 3.5 | 0.94 | 2 | |
| Neutral detector calibration | 3.5 | 2.7 | 11 | |
| CEM efficiency | 3.6 | 0.99 | 3 | |
| Interaction length | 3.3 | 121.5 cm | 2 | |
| Total systematic uncertainty | 12 |
| Reaction | Parameters | ||||
|---|---|---|---|---|---|
| (3) | 2.3474E-16 | 1.1028E-15 | - | 1.4694E-01 | 2.0471E-03 |
| (5) | 1.9983E-16 | - | 5.4737E-02 | 5.6944E-03 | 2.2891E-01 |
| Reaction | Parameters | |||||
|---|---|---|---|---|---|---|
| (3) | 1.0218E-09 | 7.2733E-11 | 5.9203E-14 | 4.4914E-02 | -2.6056E-04 | 2.6397E-06 |
| (5) | 8.5145E-10 | - | - | 9.5666E-04 | -4.4040E-05 | 2.3496E-06 |
| Source | Temperature (K) | ||||||
|---|---|---|---|---|---|---|---|
| 10 | 20 | 50 | 100 | 200 | 300 | 1000 | |
| Langevin (unmodified) | 2.0 | 2.0 | 2.0 | 2.0 | 2.0 | 2.0 | 2.0 |
| Langevin (modified) | 2.0 | 1.9 | 1.6 | 1.5 | 1.4 | 1.4 | 1.3 |
| Talbi et al. (1991) | 2.9 | 3.0 | 2.8 | 2.6 | 2.4 | 2.3 | |
| Bettens & Collins (1998, 2001) | 1.9 | 1.8 | 1.5 | 1.4 | 1.4 | 1.3 | |
| Savić et al. (2005) | |||||||
| Present results | |||||||
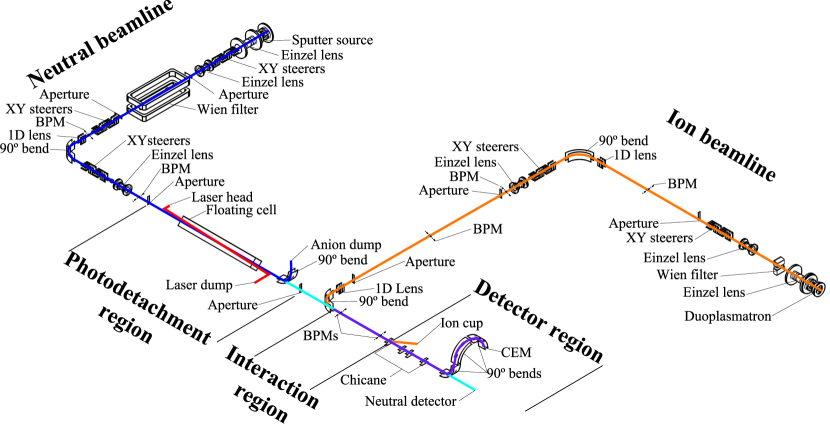
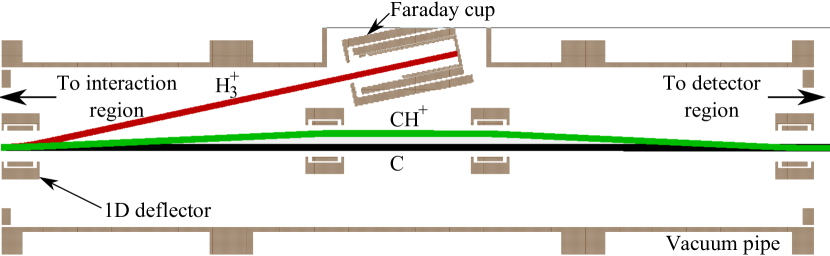
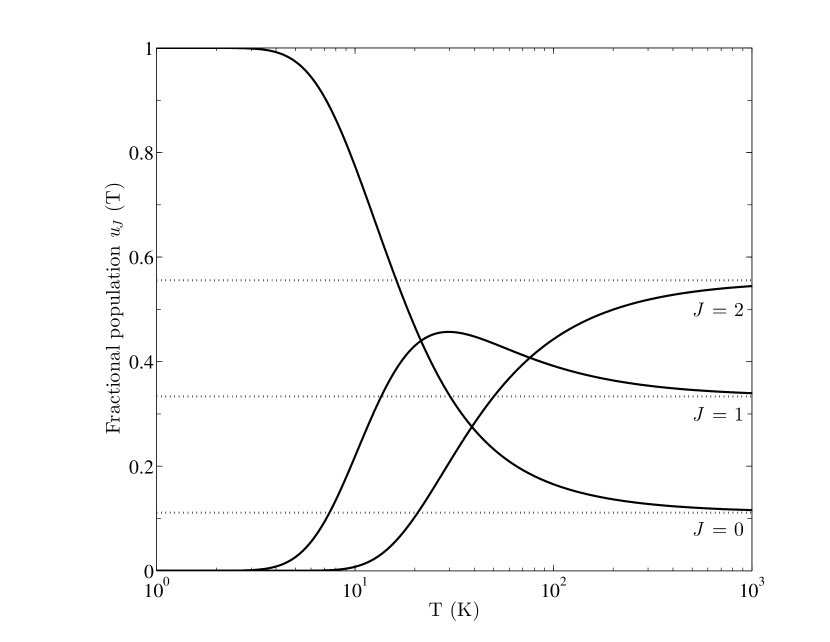
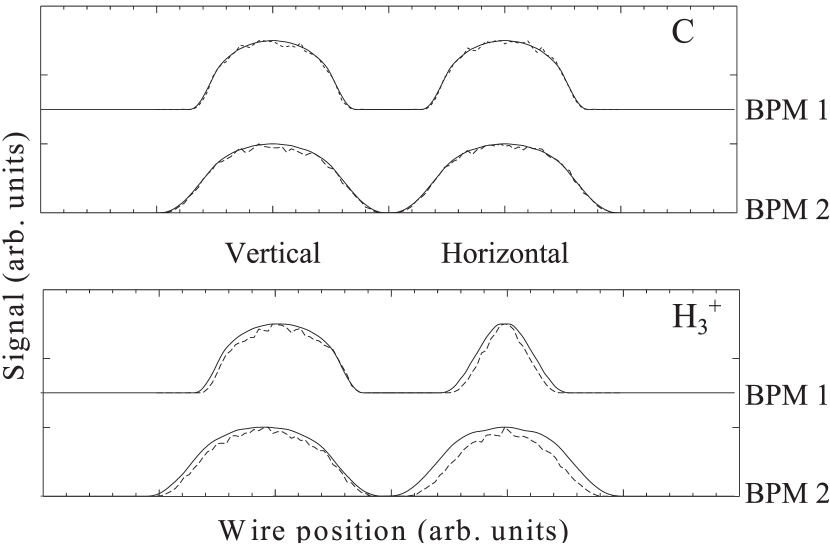
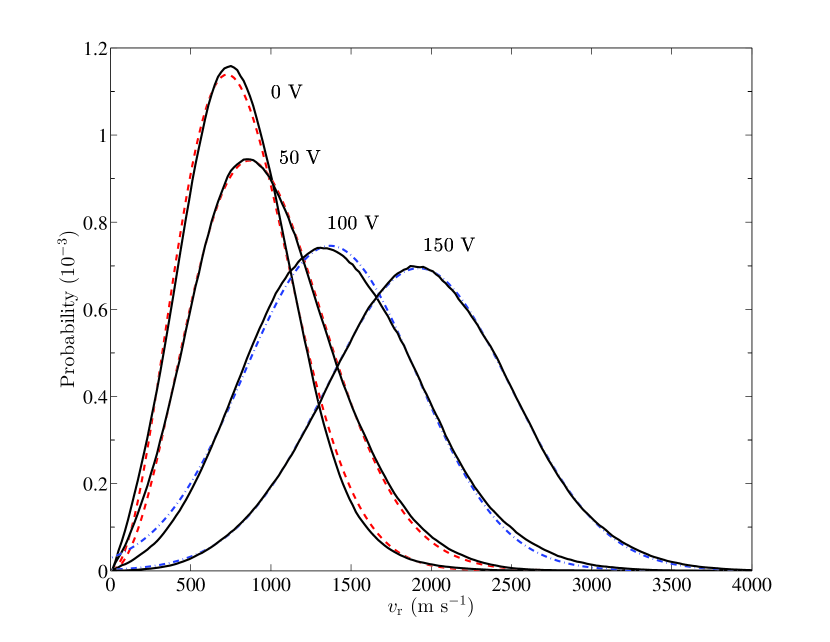
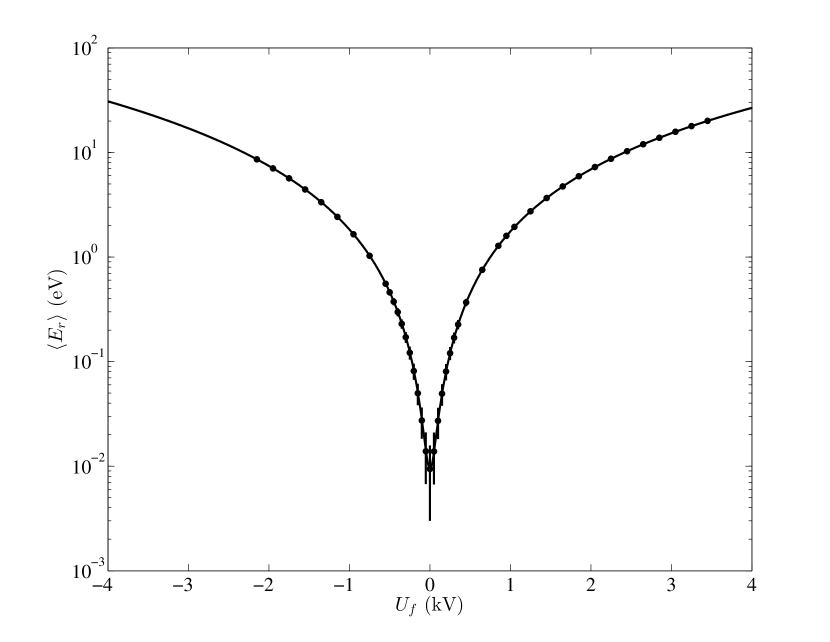

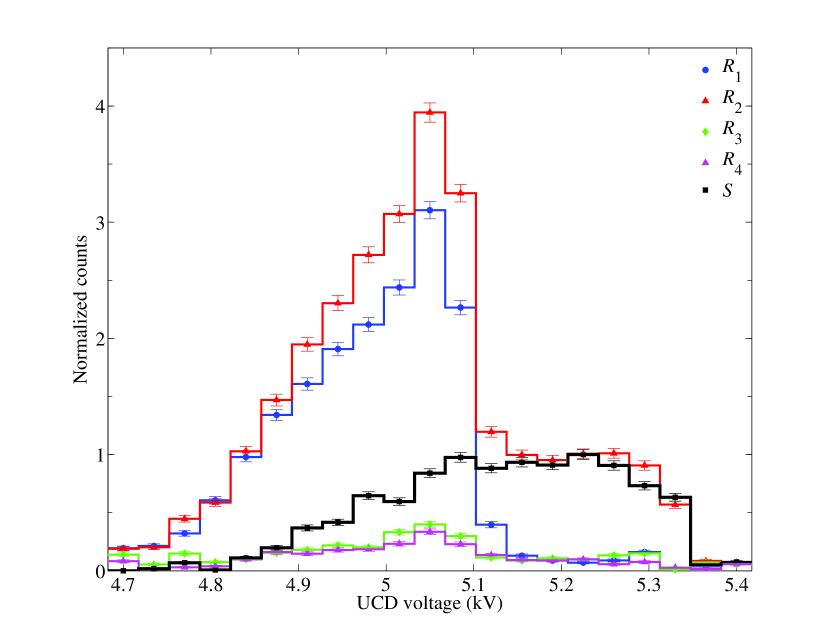
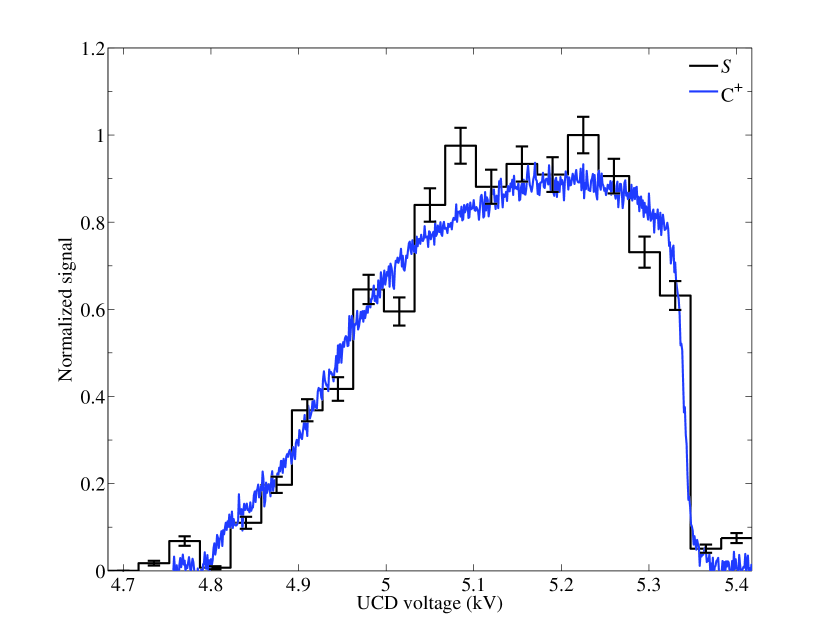
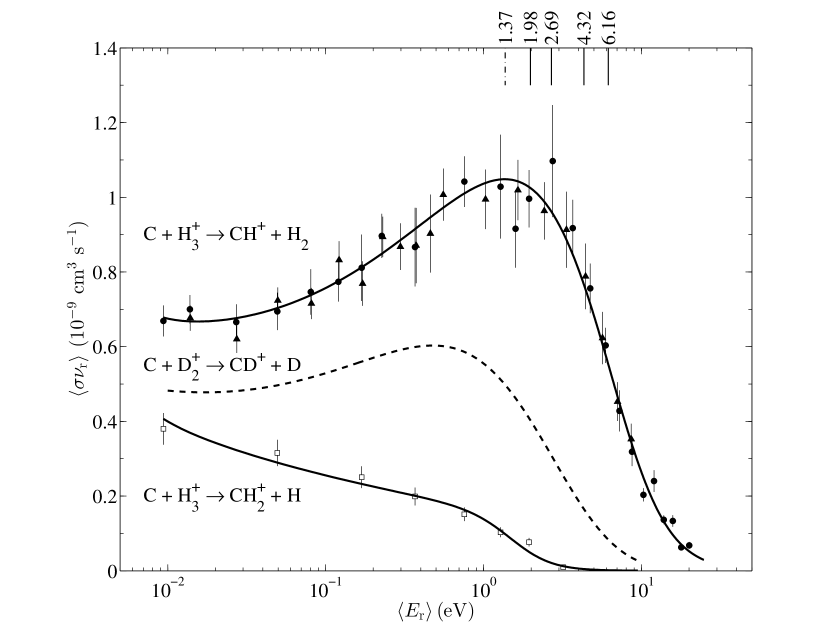

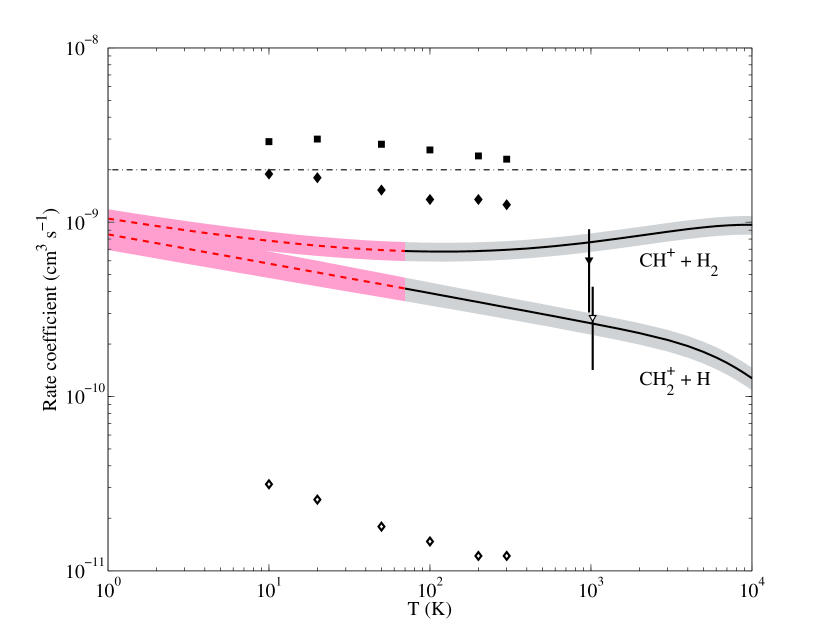
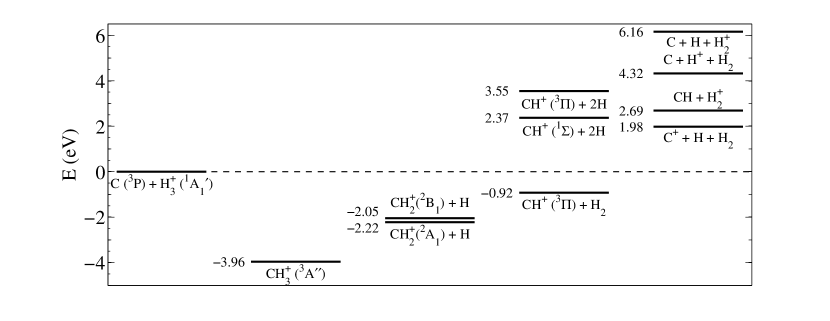
.