The Swift UVOT Stars Survey. I. Methods and Test Clusters
Abstract
We describe the motivations and background of a large survey of nearby stellar populations using the Ultraviolet Optical Telescope (UVOT) aboard the Swift Gamma-Ray Burst Mission. UVOT, with its wide field, NUV sensitivity, and 23 spatial resolution, is uniquely suited to studying nearby stellar populations and providing insight into the NUV properties of hot stars and the contribution of those stars to the integrated light of more distant stellar populations. We review the state of UV stellar photometry, outline the survey, and address problems specific to wide- and crowded-field UVOT photometry. We present color-magnitude diagrams of the nearby open clusters M 67, NGC 188, and NGC 2539, and the globular cluster M 79. We demonstrate that UVOT can easily discern the young- and intermediate-age main sequences, blue stragglers, and hot white dwarfs, producing results consistent with previous studies. We also find that it characterizes the blue horizontal branch of M 79 and easily identifies a known post-asymptotic giant branch star.
1 Introduction: Stellar Populations in the UV
At far-ultraviolet (FUV) and near-ultraviolet (NUV) wavelengths—accessible only from high altitude or from space—old stellar populations are dominated by hot stars in short-lived stages of stellar evolution. In optical images of these old populations, such hot objects are inconspicuous compared to the large numbers of main-sequence stars and red giants. By contrast, young populations are dominated by luminous massive stars whose spectral-energy distributions also peak in the UV. Thus UV imaging of resolved populations provides a unique window into stellar properties and evolution.
Over the past four decades, UV space missions have imaged globular and open star clusters and other resolved populations, in order to obtain better insight into the UV photometric properties of hot stars. These experiments have included the Orbiting Astronomical Observatory 2 (OAO-2), Astronomical Netherlands Satellite (ANS), Ultraviolet Imaging Telescope (UIT), Galaxy Evolution Explorer (GALEX), and Hubble Space Telescope (HST). The present paper focuses on the most recently launched spacecraft with a UV imaging camera, the Swift Gamma-Ray Burst Mission with its Ultraviolet Optical Telescope (UVOT). The capabilities of these missions for UV imaging, and a sample of studies that have used them to focus on stellar populations, are summarized in Table 1. General reviews of UV studies of stellar populations include Kondo et al. (1989), O’Connell et al. (1999), Bowyer et al. (2000), Moehler et al. (2001), Catelan (2009), and Heber (2009).
| Mission | Mission | Aperture | FOV Area | Resolution | Wavelength | Star-Cluster Study Examples |
|---|---|---|---|---|---|---|
| Duration | (cm) | (arcmin2) | (′′) | Range (Å) | ||
| OAO-2 | 1968–1973 | 78.5 | 1000–4250 | Molnar et al. 1978 | ||
| de Boer & Code 1981 | ||||||
| ANS | 1974–1976 | 22 | 6.25 | 1500–3300 | van Albada et al. 1979 | |
| UIT | 1990, 1995 | 30 | 1257 | 2.7 | 1200–3200 | Parise et al. 1994; Whitney et al. 1994, 1995 |
| Hill et al. 1996; Dorman et al. 1997 | ||||||
| O’Connell et al. 1997; Parise et al. 1998 | ||||||
| Landsman et al. 1996, 1998 | ||||||
| GALEX | 2003–2013 | 50 | 4071 | 4.3–5.3 | 1350–2800 | Lanzoni et al. 2007; Dalessandro et al. 2009, 2012 |
| Schiavon et al. 2012 | ||||||
| HST/FOC | 1990–1999 | 240 | .01–.05 | 0.01-0.04 | 1100–6500 | Ferraro & Paresce 1993; Burgarella et al. 1994 |
| HST/WFPC2 | 1993–2009 | 240 | 2.3–5.0 | .04 | 1150–11000 | Ferraro et al. 1999, 2001; Castellani et al. 2006 |
| Sandquist et al. 2010; Brown et al. 2010a | ||||||
| Dalessandro et al. 2011, 2013a | ||||||
| HST/ACS | 2002– | 240 | 0.21–.30 | .03 | 1150–11000 | Dieball et al. 2007; Haurberg et al. 2010 |
| HST/WFC3 | 2009– | 240 | 7.3 | .04 | 2000–10000 | Bellini et al. 2013; Piotto et al. 2013 |
| Swift/UVOT | 2004– | 30 | 289 | 2.3 | 1700–8000 | This study |
The UV light of stellar populations is contributed by the following stellar types:
-
1.
Massive Main-Sequence Stars: Main-sequence stars of spectral type F and earlier have significant UV emission. The properties of the most massive O- and B-type stars and the track of their post-main-sequence evolution are still poorly understood owing to their short lifetimes, uncertain distance scales, and the poorly constrained UV extinction law (see reviews in Zinnecker & Yorke 2007, Portegies Zwart et al. 2010, and Langer 2012).
-
2.
Luminous Blue Variables and Wolf-Rayet Stars: The evolutionary stages between the O-star main sequence and supernovae are highly extremely luminous and have peak emission in the UV. They are also highly variable (Langer 2012).
-
3.
Population I Supergiants: Evolved high-mass stars of spectral types late B through early G are the optically brightest members of young populations (e.g., Humphreys 1983) because of their small bolometric corrections compared to blue and red supergiants (e.g., Bond 2005). They are of particular interest in the UV as they have large Balmer discontinuities in their spectra owing to low surface gravities, which can make them stand out on optical-UV color-color diagrams.
-
4.
Blue Stragglers (BSS): Primarily present in older stellar populations, these are merged binaries that mimic the colors and magnitudes of higher-mass stars. They are a particularly important contributor to the UV light of globular clusters (Laget et al. 1992; Mould et al. 1996; Ferraro et al. 2001, 2003; Dalessandro et al. 2013b).
-
5.
Blue Horizontal-Branch (BHB) Stars: BHB stars are He-burning stars lying blueward of the RR Lyrae gap; they are found in most old, metal-poor stellar populations. They typically have temperatures of 7,000–16,000 K and therefore have significant UV emission. UV color-magnitude diagrams (CMDs) have shown discontinuites in the HB morphology at approximately 11,500 K and 21,000 K. These HB “jumps” are created, respectively, by radiative levitation of heavy elements in the atmospheres of hot evolved stars (Grundahl et al. 1999) and early helium flashing (Momany et al. 2004).
-
6.
Extreme Horizontal Branch Stars (EHB): EHB stars or hot OB subdwarfs are helium-burning HB stars having such thin hydrogen envelopes that they cannot sustain shell burning. These stars will eventually evolve directly to the white dwarf (WD) sequence without ascending the asymptotic giant branch (AGB). With temperatures greater than 16,000 K, they are extremely luminous in the UV and likely produce much of the “UV upturn” seen in old elliptical galaxies (Brown et al. 1997; O’Connell et al. 1999), possibly dominating the UV light of old stellar populations. This feature has been identified in numerous Galactic globular clusters (e.g., Rich et al. 1997; Sandquist et al. 2008; Brown et al. 2010a; Schiavon et al. 2012).
-
7.
Blue-Hook Stars (Bhk): Bhk stars are horizontal-branch stars that appear to be below the He-burning limit and hotter than the theoretical limit of EHB stars (35,000 K). Only discovered in the most massive globular clusters, these may be very rare “late flashers” that ignite helium while on the WD sequence (D’Cruz et al. 2000; Dalessandro et al. 2011; Brown et al. 2012) and have high surface helium abundances (Moehler et al. 2004a,b, 2007).
-
8.
AGB Manqué Stars (AGB-M): These failed AGB stars are the descendants of EHB and Bhk stars. They evolve away from the He-burning sequences but have envelopes too small to reach the AGB (Greggio & Renzini 1990).
-
9.
Post-Asymptotic Giant Branch Stars (PAGB): These stars are rapidly evolving from the tip of the AGB to the WD sequence. They are the most luminous Population II stars, and are the brightest stars in globular clusters in the optical and UV (Strom et al. 1970; Zinn et al. 1972). Their rapid evolution results in extremely short lifetimes (25,000 yr). This makes them both rare and valuable as they may have a uniform optical luminosity while at spectral types A and F, making them potential standard candles (Bond 1997; Alves et al. 2001).
-
10.
Hot White Dwarfs: The degenerate end states of low-mass stars, these start at temperatures of over 100,000 K and cool adiabatically. In the early stages, they are extremely bright in the UV. Our previous studies have explored some of their photometric properties (Siegel et al. 2010, Siegel et al. 2012).
All of the stars listed above are detectable in the optical and infrared. However, with the exception of BHB, MS and supergiant stars, they are often drowned in the light of the far more numerous late-type MS and RGB stars. Although they are hot, the bolometric corrections make them optically faint and indistinguishable from cooler stars. And for very hot stars ( K), the optical passbands are far enough down the Rayleigh-Jeans tail of the spectral-energy distributions that the stars all have similar optical colors over a wide range of temperatures. In the UV, by contrast, the numerous late-type stars emit very little light. Therefore, the rarer hot stars—EHB, Bhk, AGB-M, PAGB, etc.—are easily discerned in the NUV and FUV. Illustrations of this can be seen in Figure 4 of Dieball et al. (2007), Figure 2 of Haurberg et al. (2010), and Figure 4 of Brown et al. (2010a), which contrast the unusual and rarefied topography of FUV/NUV CMDs against the more familiar optical.
Star clusters have been the primary resource for identifying and characterizing hot stars. Star clusters contain simple (mostly) stellar populations and are therefore ideal for constraining the UV properties of stellar populations as a function of age and metallicity. They are nearby, meaning they can be studied on a star-by-star basis. And most clusters are well-studied in the optical and infrared, meaning the underlying age, metallicity, distance, and foreground reddening are well known. The Galaxy contains more than 800 open clusters, which are primarily young, and 150 globular clusters, which are primarily old. Together, they span a broad range of stellar populations in both age and chemistry, as well as a variety of environments.
Despite the extensive, excellent and pioneering work cited above, frustrating gaps remain in our understanding of the UV properties of stellar populations and hot stars. Examples include the role that helium abundance plays in creating EHB and Bhk stars, the luminosity of high-mass stars, and the reality of the “late-flasher” scenario for creating EHB and AGB-M stars. Hanging over all of these questions is the uncertainty in the UV extinction law, particularly the strength of the 2175 Å bump and the shape of the UV extinction curve at shorter wavelengths (see Hoversten et al., in prep). Studies of open clusters, as opposed to globular clusters, are particularly lacking with concomitant lack of insight into the UV properties of young stellar populations and massive stars. And measures of the integrated UV light of stellar populations, particularly young stellar populations, are needed to provide a critical check on the population-synthesis models used to measure the stellar content of distant unresolved stellar populations. Bruzual (2009), discussing the PEGASE galaxy evolution code, noted that “The main limitations of these models come from incomplete data sets of evolutionary tracks and from either empirical or theoretical stellar spectral libraries.” More effort is needed to produce complete censuses of hot stars in nearby stellar populations; connect the number, type, luminosity and colors of those stars to the properties of the underlying stellar populations and/or individual stars; understand the shape of the UV extinction curve; and, perhaps most significantly, produce measures of integrated light to compare to more distant and unresolved stellar populations. This need is particularly critical for young stellar populations.
The core problem is a lack of data. Hot stars are rare and require extensive surveys to identify. Moreover, work beyond the optical window requires space instrumentation. However, even the existing space instruments have been unable to provide a complete census of hot stars. The HST surveys of simple stellar populations have produced spectacular color-color and CMDs, but lack the spatial footprint for a complete census. GALEX has provided photometry of many stars but lacks the spatial resolution to provide high-quality photometry in globular clusters and its brightness constraints limited its ability to study open clusters. UIT made significant contributions but the data are more than two decades old and not deep enough to characterize the fainter populations.
To address these lacunae, we have initiated a series of programs using the UVOT onboard the Swift Gamma-Ray Burst Mission (Gehrels et al. 2004; Roming et al. 2005). UVOT occupies a unique niche that makes it ideal for studying nearby stellar populations in the NUV. Its field of view covers 40 times the area of HST/WFC3, and it has twice the spatial resolution of GALEX. Importantly, UVOT has less stringent brightness limits than GALEX, allowing it to survey UV-bright areas of the sky including the Galactic mid-plane, open and globular clusters, and the Magellanic clouds, all of which are now being surveyed by Swift.
Our first effort to use Swift/UVOT to constrain the properties of hot stars created a set of UV standard stars and demonstrated an ability to constrain the temperatures of WDs to a precision of 1000 K, based on Sloan Digital Sky Survey, UVOT, and GALEX data (Siegel et al. 2010). Subsequently, we demonstrated UVOT’s ability to detect and characterize hot pre-WD stars, clearly identifying a hot compact companion to the red-giant central star in the planetary nebula WeBo 1 (Siegel et al. 2012). We are now undertaking the next step in characterizing hot stars in the UVOT photometric system: constraining the properties of hot main-sequence and evolved stars in nearby open and globular clusters. This will inform future studies of other galaxies within the Local Group.
We begin this series of papers here by describing our methods of wide-field photometry and the connection between the measured photometry and the properties of the underlying stars. §2 details the data, processing and analysis methods, and the conversion of raw UVOT instrumental magnitudes to calibrated photometry. It is likely of interest only to those attempting to perform wide-field photometry with UVOT. §3 then compares the properties of three open clusters—M 67, NGC 188, and NGC 2539—to theoretical isochrones, attempting to map out the color-magnitude and color-color space occupied by the primary sequences. It also examines the UVOT photometry of the old globular cluster M 79. §4 summarizes our results. In an appendix, we address the effect of reddening on UVOT photometry.
2 UVOT Observing and Data Reduction
2.1 The Swift Ultraviolet Optical Telescope (UVOT)
The Swift spacecraft has a complement of three instruments, used respectively at gamma-ray, X-ray, and UV/optical wavelengths, with a primary mission of detecting and studying gamma-ray bursts and their X-ray and UV/optical afterglows. UVOT is a modified Ritchey-Chrétien 30 cm telescope that has a wide () field of view and a microchannel plate intensified CCD detector operating in photon-counting mode (see details in Roming et al. 2000, 2004, 2005). Incoming photons are amplified by a photomultiplier stage creating an electron cloud. This cloud is converted back into photons by a phosphor screen and the splash of those photons is recorded and centroided on a fast-read 256256 CCD to one-eighth of a pixel precision. The camera is equipped with a 11-slot filter wheel that includes a clear white filter, , , and optical filters, , , and UV filters, a magnifier, two grisms, and a blocked filter. The and filters have substantial red leaks, which have been characterized to high precision by Breeveld et al. (2010) and are included in the current UVOT filter curves (this issue is discused in detail by Brown et al (2010b) and Siegel et al. (2012)). Table 2 list the central wavelengths and FWHM of UVOT’s imaging filters. It also lists the strength of the red tail, defined as the ratio of the integrated effective area curve beyond 3000 Å over the integrated effective area curve from 1600–7000 Å. The observational effect of the red tails depends on the color of the source being observed. Table 12 of Brown et al. (2010b) indicates that the effect of the red leak is small for stars with effective temperatures greater than 10,000 K. The effect of the red leak is included in all isochrones used in this study.cd
| Filter | Central Wavelength | FWHM | Red Sensitivity |
|---|---|---|---|
| (Å) | (Å) | ||
| 5468 | 769 | ||
| 4392 | 974 | ||
| 3465 | 785 | ||
| 2600 | 693 | 0.11 | |
| 2246 | 498 | 0.0019 | |
| 1928 | 657 | 0.024 |
UVOT’s wide field, 23 resolution, broad wavelength range (1700–8000 Å), photometric stability, and ability to observe simultaneously with Swift’s X-Ray Telescope (XRT; Burrows et al. 2005) allow a broad range of scientific investigations, over and beyond the gamma-ray follow-up. UVOT is especially well suited, in the context of hot stars, for studying nearby star clusters. Its field of view can enclose almost any nearby cluster in a single pointing, and its spatial resolution allows photometry of stars almost to the center of the most crowded fields. In this sense, it is similar to UIT, which had a wide-field solar-blind channel that enabled some of the early space-based studies of UV-bright stars and stellar populations.
2.2 Photometric Reduction of UVOT Images
In this section, we describe how we process UVOT data to produce science-quality images. A general description of current UVOT data processing is given in the online UVOT Digest111http://heasarc.gsfc.nasa.gov/docs/swift/analysis/uvot_digest.html/. UVOT data are processed with programs contained in the HEASARC FTOOLS software package222http://heasarc.gsfc.nasa.gov/docs/software/lheasoft/, which includes standard pipeline processes, custom-built UVOT image tools, and up-to-date calibration files. Here we emphasize several important steps that are relevant to our program of wide-field stellar photometry. Our procedure for producing images free of instrumental signatures involves five steps: data acquisition, aspect correction, exposure-map generation, large-scale sensitivity correction, and image combination.
-
1.
Data Acquisition: Raw and pipeline-processed UVOT data are downloaded directly from the HEASARC archive333http://heasarc.gsfc.nasa.gov/cgi-bin/W3Browse/swift.pl/. (The same processed UVOT data are also available through the MAST archive at STScI444http://archive.stsci.edu.) The pipeline will be described in detail in Marshall et al. (in preparation). The standard download includes the raw frames, processed images that have been geometrically corrected to sky coordinates, and exposure maps. We also download auxiliary spacecraft data for reasons given below.
-
2.
Aspect Correction: The HEASARC automated processing performs a transformation of the raw CCD images to celestial coordinates, using the spacecraft attitude files (not the image-header coordinates, which are for the nominal pointings rather than the actual pointings). The reduction pipeline then runs UVOTASPCORR to match stars in the frame to the USNO-B1 astrometric catalog for fine aspect correction. However, this automated aspect correction is prone to failure in some fields. The severe crowding, and the sometimes dramatic differences in UV and optical fluxes for late-type stars, can cause this process to fail or (more rarely) produce an inaccurate solution. This is most likely to occur in globular clusters and fields in the Magellanic Clouds.
When the automatic fine aspect correction fails, we manually match stars in each frame to reference images from the STScI Digitized Sky Survey. We then use the FTOOLS program UVOTUNICORR to generate a new aspect solution, which is applied to the image if the new scatter in offsets is less than 125. We have found that about ten matched stars are needed to produce a sound two-dimensional translation. The FTOOL UVOTEXPMAP is then used to regenerate the exposure map at the new coordinates.
-
3.
Exposure Map Regeneration: The exposure maps are a critical part of any analysis of UVOT data. A typical Swift observing window is 600–1800 s long. Observations longer than about 1000 s will likely be spread over multiple spacecraft orbits. In our program, the observations have often been spread over weeks, months, or even years. Thus the observations have been taken at a range of spacecraft roll angles. There is also a range in pointings, at a level of 1–. These factors cause the total exposure time in a combined image of a target to vary significantly over the field, as shown in the left panel of Figure 1.
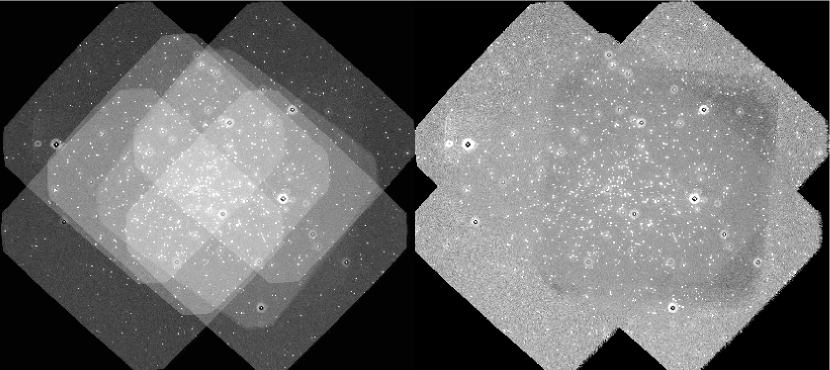
Figure 1: Left: stacked deep image of NGC 188, created by combining processed UVOT data. Total exposure varies across the image. Right: combined image divided by the UVOT exposure map. This count-rate image is more uniform but retains some residual variation due to varying background level from the Earth limb. The exposure map images generated by the HEASARC pipeline are, absent aspect correction problems, perfectly suited to this task. However, we regenerate them in all cases so that we can mask out the outer regions of the UVOT images, where the data quality is lower. The first step in this process is to generate a bad-pixel map for each image, using the UVOTBADPIX tool and the standard bad-pixel map in the most recent calibration database (CALDB) build555https://heasarc.gsfc.nasa.gov/docs/heasarc/caldb/swift/. We then recreate the exposure map using UVOTEXPMAP with the spacecraft attitude files and a simple 25-pixel trim to generate masks that remove the outskirts of each image. This step is automatically taken when we have to revise the automatic aspect correction for an image. This trim is more aggressive than used in our standard products or the forthcoming UVOT source catalog (Yershov et al., in preparation), but was chosen to avoid false detections in the image corners.
-
4.
Large Scale Sensitivity (LLS): UVOT data are not corrected in the standard pipeline for flat-field effects. We make this correction using a sensitivity map, as described in Breeveld et al. (2010). This task grows more complicated when stacking multiple images at varying pointings and roll angles. The first step in correcting for the flat field is to generate individual sensitivity images for each exposure. This task is performed using the FTOOLS task UVOTSKYLSS, the LSS maps available in CALDB, and the spacecraft attitude files.
-
5.
Image Combination: The sensitivity maps, exposure maps, and images are then combined into single large multi-extension fits files using the FAPPEND task. UVOTIMSUM is then used to combine these into a single image, a single exposure map, and a single LSS map in each filter, adjusting the combination method as appropriate for each type of image. In each case, we use the mask files generated during the exposure map reconstruction to produce clean masked images, removing both bad pixels and chip edges.
2.3 Wide Field Stellar Photometry with UVOT
UVOT’s photon-counting mode and photon-cloud centroiding of counts complicates the analysis of wide-field photometry in a number of ways. The problems of coincidence and dead-time losses, in which two or more photons hit a similar detector location during the same read time, or a photon hits during the readout, are addressed in Poole et al. (2008) and Breeveld et al. (2010). However, there are additional secondary effects that can impact PSF photometry. The onboard centroiding of the photon “splashes” causes the coincidence loss at any pixel to be mixed into adjacent pixels. This causes the PSF to change shape at high count rates, becoming narrower and developing a darkened halo of lower count rates where photons in the outskirts of the PSF are lost (although the overall counts are conserved, so the Poole et al. coincidence loss corrections will still work for fixed aperture photometry). In addition, the clusters we are studying are crowded, with multiple overlapping point sources that complicate both the individual photometric measures and the corrections for coincidence loss.
UVOT photometry is generally performed with the FTOOL UVOTSOURCE, which provides single-source aperture photometry, or UVOTDETECT, which incorporates the Source Extractor program (Bertin & Arnouts 1996) to provide multi-source photometry. While these tools have their advantages, including automatic correction for coincidence loss, they are not well-suited for images as crowded as in our cluster program fields. Thus we have adapted the DAOPHOT/ALLSTAR PSF photometry program (Stetson 1987, 1994) to the analysis of UVOT data. Ideally, software unique to UVOT would be developed that accounts for the change of PSF shape with count rate. However, as shown below, a PSF independent of count rate has proven capable of producing high-quality photometry, providing one selects the PSF stars carefully.
We first aperture photometer all stars using a circular aperture of radius 50. We then carefully select PSF stars that are not near image edges, bright stars, or the “burned in” areas of the cluster centers. We also have found that, because UVOT is a non-linear detector, removing the bright stars from our PSF sample produces significant improvements in the object subtraction and overall photometry. These stars are most obvious when the coincidence loss produces visible artifacts—dark halos and boxes around bright stars. However, we have found that an aggressive trimming of the bright end of the PSF stars was necessary to produce high-quality photometry. We allowed the PSF to have quadratic variation over the image, although in fact the PSF is reasonably constant over the face of the detector. Once this PSF star selection stage is completed, we follow standard methods of stellar photometry using the ALLSTAR program.
Translating the instrumental DAOPHOT photometry to calibrated magnitudes, however, involves a number of intermediate steps. These steps are included in the builds of UVOTSOURCE and UVOTDETECT. We list these here as they are necessary for any photometric method that assumes linear count rates.
-
1.
We convert the DAOPHOT instrumental magnitudes and sky measures to raw count rates.
-
2.
The count rates are corrected for exposure time using the summed exposure map.
-
3.
We aperture-correct the PSF photometry to the standard 50 aperture used for calibration. It is critical that this step be done before the coincidence-loss correction or the correction will fail to linearize the photometry. We have found that DAOPHOT sometimes produces a small zero-point offset between the aperture photometry and the PSF photometry. This is non-trivial with UVOT since the count rates are not linear. Correcting the photometry back to the 50 apertures before the coincidence loss correction removes the non-linearity.
-
4.
The count rates—total count rate in the aperture (star plus sky) and sky count rate—are corrected for coincidence loss using the formulation of Poole et al. (2008). We then subtract the corrected sky rate from the corrected total count rate to produce a coincidence-loss corrected count rate for each star.
-
5.
The count rates are then corrected for the large-scale sensitivity and the secular decline in instrument sensitivity, using the large-scale sensitivity map and formulations from Breeveld et al. (2010), respectively.
-
6.
Finally, we convert the count rates back to stellar magnitudes and apply the zero-point corrections of Breeveld et al. (2011). Zero-points are available for both Vega-based magnitudes and AB magnitudes.
To test the internal consistency of the pipeline, we compared deep photometry of the open cluster M 67 (described in §3) to photometry from shallower images taken in windowed mode. The windowed mode, which images the inner region of the UVOT field, significantly shortens the read and dead times of the array, reducing the coincidence losses for bright targets. Figure 2 shows the comparison for five of the six UVOT filters (no windowed data were obtained in the filter). In all five cases, fits to weighted residuals show that the comparisons are flat to within 1–2% and statistically consistent with a flat trend, confirming the accuracy of the Poole et al. (2008) coincidence-loss corrections (the comparisons appear non-linear at the faint end due to poorly measured stars being preferentially detected when they scatter to brighter magnitudes in the windowed frame). There are slight offsets in the zero points (ranging from about 0.01 to 0.06 mag, with a mean of 0.008 mag). These are barely statistically significant, and are likely the result of poor sky statistics on the short windowed images. There is also some scatter at the faint end ( 17 mag) from marginal detections when stars in the deep images being scattered to brighter magnitudes in the shallow images.

2.4 Comparison with Ground-Based Optical Photometry
As a test of the external accuracy of our photometry, we compare our UVOT data for M 67 with calibrated ground-based observations of the same stars. Frames of M 67 were obtained by H.E.B. with the Kitt Peak National Observatory (KPNO) 0.9 m telescope in 1998 March and 1999 January and March, using the T2KA chip with exposure times ranging from 5 to 120 s. The KPNO frames were reduced using the IRAF666IRAF footnote. CCDPROC task, and instrumental stellar magnitudes were measured with DAOPHOT/ALLSTAR and DAOGROW (Stetson 1990). The photometry was then corrected for atmospheric extinction, and calibrated to the Johnson BV system using observations on the same nights of standard-star fields of Landolt (1992) and matrix-inversion methods described in Siegel (2002). We also compare our photometry to the published photometry of Yadav et al. (2008), obtained with the ESO Wide-Field Imager and calibrated to the secondary standards of Stetson (2000, 2005), which is also tied to the Landolt system. The UVOT photometry has been transformed to the Johnson system using the formulations of Poole et al. (2008).
Figure 3 compares the UVOT and ground-based photometry for both and magnitudes. The top panels show the photometric comparison to the KPNO data with no correction of the UVOT data for coincidence loss or large-scale sensitivity; only zero-point offsets and sensitivity decline were incorporated. As can be seen, the uncorrected UVOT photometry severely underestimates the brightnesses of the brightest stars.
In the second two panels the coincidence-loss corrections have been applied. Now the non-linearity has mostly disappeared. However, there is still significant scatter, which our analysis shows is dependent on position within the frame. These geometric residuals are a bit haphazard as they follow the complex overlap of three different UVOT observations.
The bottom four panels show the comparisons with the large-scale sensitivity corrections also applied, with the third set comparing to the KPNO photometry and the fourth comparing to ESO photometry. The geometric and zero point residuals are now reduced and we find the weighted fit to be linear within 1%. Large outliers are likely extended objects or blends. We note that while the scatter in the comparison plots is somewhat large, this represent a worst-case scenario for UVOT because the exposures times are short (). Our full survey uses far deeper imaging, usually 1-2 ks.

3 UVOT UV and Optical Photometry of Four Star Clusters
In this section, we examine the CMDs of the old open clusters M 67 and NGC 188, the young cluster NGC 2539, and the old globular cluster M 79, based on archival Swift/UVOT data. Details of the observations are listed in Table 3, including total exposure time and photometric depth. Note that, because of the aforementioned variation of exposure time over the face of the image and the effect of crowding in the cluster cores, the exposure times and limiting magnitudes represent the maximum depth in each field. The effective depth is shallower in outlying regions, which are not as well-exposed, and in the cluster cores, where the background diffuse light of unresolved stars is bright.
These data were obtained as follows: (1) M 67 was observed on 2009 March 29 and 2011 January 11 as a calibration target, and again on 2011 May 30 as part of M.H.S.’s Swift fill-in program. (2) NGC 188 was extensively observed in a broad mosaic from 2007 December 2 to 6 as a calibration target to probe the large-scale sensitivity of UVOT. Additional data were taken on 2007 October 31 and December 20. (3) NGC 2539 was observed from 2011 June 18 to 19 as part of M.H.S.’s fill-in program. (4) M 79 was observed on 2010 June 8 as part of S.T.H.’s fill-in program.
| Filter | M 67 | NGC 188 | NGC 2539 | M 79 | ||||
|---|---|---|---|---|---|---|---|---|
| Exp Time | Limit | Exp Time | Limit | Exp Time | Limit | Exp Time | Limit) | |
| (ks) | (ABmag) | (ks) | (ABmag) | (ks) | (ABmag) | (ks) | (ABmag) | |
| 0.16 | 18.8 | 2.59 | 20.7 | |||||
| 0.16 | 19.5 | 2.72 | 21.2 | |||||
| 0.16 | 19.4 | 2.18 | 22.5 | |||||
| 2.43 | 21.0 | 3.35 | 22.9 | 1.64 | 20.8 | 2.02 | 22.7 | |
| 2.78 | 21.3 | 6.16 | 23.5 | 1.83 | 21.0 | |||
| 3.04 | 21.5 | 6.68 | 23.8 | 1.83 | 21.1 | 2.27 | 23.1 | |
3.1 M 67
The open cluster M 67 has been observed extensively from the ground; it is often used as a calibration standard because it is nearby ( kpc), is of near-solar metallicity, and is relatively old (4 Gyr: VandenBerg & Stetson 2004; Bellini et al. 2010). However, the only previous published study of M 67 blueward of the atmospheric cutoff at 3000 Å to our knowledge is that of Landsman et al. (1998, hereafter L98), which used data from UIT.777M67 was imaged by the GALEX mission but the complete analysis has not been published (Landsman et al. 2005). L98 identified twenty UV-bright stars, comprising eleven blue stragglers, seven hot WDs, one composite yellow-giant/WD binary, and one non-member. However, the UIT data were not deep enough to delineate the primary sequences (main sequence, subgiants, giants).
Figure 4 shows the UVOT optical and NUV CMDs of M 67. We have removed objects with DAOPHOT sharpness values greater than 0.5 or less than in order to exclude blends, galaxies, and bad measures. The top two panels show the optical photometry, transformed from and space to Johnson and , respectively, using the formulations of Poole et al. (2008), to allow better comparison to previous ground-based photometry and to theoretical models. Overlaid with dashed lines are isochrones from the Padova group (Bressan et al. 2012), with a reddening of , and ages of 500 Myr, 1 Gyr, and 4 Gyr, the latter being the nominal age of M 67. The NUV isochrones include the effects of filter red leaks as well as the non-linear effect of reddening on the NUV filters (see Appendix A). Providing the best fits to the isochrones in both the optical and NUV required slightly different metallicities. For the optical passbands, we found the best fit was produced with an age of 4 Gyr, a distance modulus of , and a metallicity of , all consistent with recent literature (Sarajedini et al. 2009; Twarog et al. 2009; Pancino et al. 2010; Friel et al. 2010; Jacobson et al. 2011; Reddy et al. 2013). However, for the NUV passbands, we found the isochrones were better fit with an [Fe/H] of 0.0. The difference is within the uncertainties of M 67’s metallicity, but may suggest that some modification of the NUV isochrones is necessary, an issue we will explore in greater detail later in this series of papers.
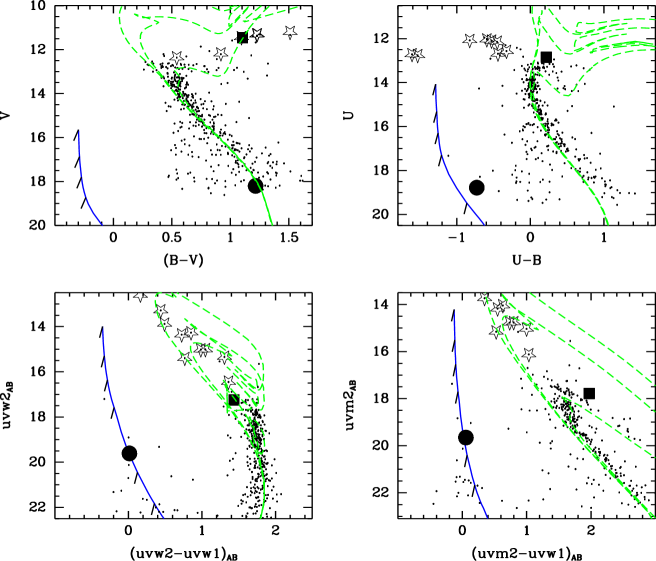
We have also overlaid in Figure 4 a cooling curve for a WD from the compilation888http://www.astro.umontreal.ca/~bergeron/CoolingModels/ of P. Bergeron (Holberg & Bergeron 2006; Kowaski & Saumon 2006; Tremblay et al. 2011; Bergeron et al. 2011). For the optical filters, we used the Bergeron synthetic color indices. For the Swift filters, we made a simple extrapolation using a black body of the appropriate temperature, normalized to match the band synthetic photometry. Future efforts will refine the WD curves using spectral-energy distributions taken from atmospheric models of the appropriate temperatures and surface gravities. The ticks along the cooling curve mark temperatures of 100000, 80000, 60000, 40000, 20000, and 10000 K from the tip to the faint end. We emphasize that this sequence is simply overlaid for comparison, and was not fit to any sequence.
NUV colors of red giants in the UVOT filters are strongly affected by filter red leaks. This produces convoluted isochrones for stars above the subgiant branch. However, the main-sequence turnoff and subgiant branch are clearly defined in all passbands, and correspond roughly to the expectations of the isochrones.
Of the eleven blue stragglers identified in L98, nine are within the UVOT field, and all of them were detected. A tenth, identified in a previous study of M 67 by Milone & Latham (1994), is also detected. These are shown in Figure 4 as open star points. Note that all are saturated, or close to saturation, in the three optical filters, creating a spurious roughly flat distribution in the two optical CMDs. However, in the NUV filters, the blue stragglers clearly lie along the younger isochrones, consistent with expectations for merged binary stars. They also cover a broad range in the NUV color indices (1–1.5 mag), hinting that the UV has far more sensitivity to the parameters of blue stragglers than the optical, a concept we will explore in future contributions.
Of the WDs identified in L98 only one—BATC 2776—falls within the UVOT field. This star, marked with a solid circle in Figure 4, is only marginally detected in the optical, but has a red color. The deep photometry Yadav et al. (2008) also shows this object to have a red color of 1.22. This contrasts against the NUV, where the object is very blue and sits within a string of faint hot objects blueward of the main sequence that are not detected in the optical passbands and lie along the sample WD cooling curve. They likely represent the hot end (20-40,000 K) of M 67’s WD sequence.
It is possible that this white dwarf is in a binary system with a faint red main sequence star. The main sequence star shows up faintly in the optical but, because it is cool, disappears in the ultraviolet. By contrast, the hot white dwarf shows up clearly in the NUV but is too small to be detected in the optical. If this is the case, the M67 data confirms the ability of UVOT to detect and characterize white dwarfs We detect the tip of the white dwarf sequence and the combination of NUV and optical data has revealed a previously unknown white dwarf binary.
Finally, the yellow giant with a hot binary companion identified by Landsman et al. (1997)—described as a “red straggler”—is indicated by a solid square. In all passbands, we also show it as being slightly redder and brighter than the MSTO and bluer than the RGB, although the optical photometry is likely compromised by severe coincidence loss. The companion WD star in M 67’s yellow binary is cooler than the companion star we identified in WeBo 1 (16,000 K vs. 100,000 K; Siegel et al. 2012) and is probably close to the limit of UVOT’s ability to detect hidden WD companions. However, it is notably a little brighter than the RGB in , which would be consistent with a UV excess.
3.2 NGC 188
Figure 5 shows the Swift/UVOT CMDs for NGC 188. We have removed objects with DAOPHOT sharpness values greater than 0.2 or less than and transformed the and photometry to Johnson and . Overlaid are isochrones from the Padova group with reddening of , ages of 500 Myr, 1 Gyr, and 5 Gyr (the latter being the nominal age of NGC 188), a metallicity of [Fe/H]=+0.1 and a distance of =11.44. These values are consistent with the literature (Sarajedini et al. 1999; Andreuzzi et al. 2002; VandenBerg & Stetson 2004; Fornal et al. 2007; Friel et al. 2010; Jacobson et al. 2011). Unlike M 67, we find that a single metallicity of fits both the optical and NUV sequences. We have also overlaid a cooling curve for a WD using the synthetic colors of Bergeron et al. (2011). The tick marks along the cooling curve mark temperatures of 100000, 80000, 60000, 40000, 20000, and 10000 K from the tip to the faint end.
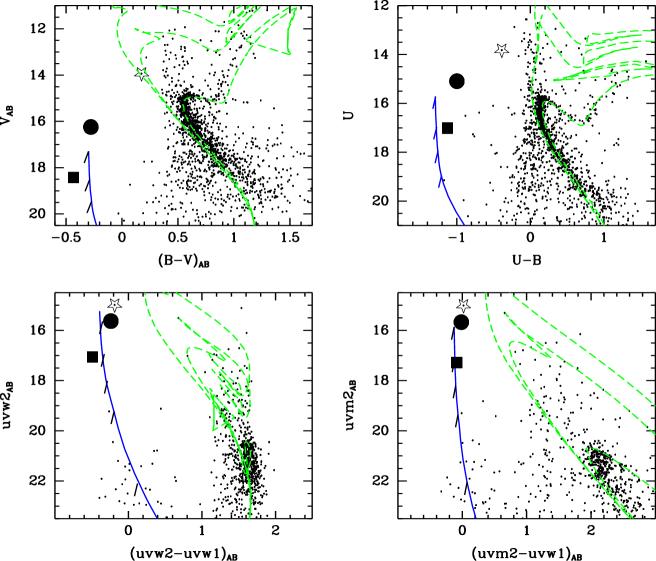
L98 identified 7 UV-bright stars in NGC 188 from UIT images and confirmed that two or three were likely members. Of these, four are too bright for UVOT to measure and are bright foreground stars (and all but one of these are outside the field). The three that remain in Figure 5, marked as large points, are:
(1) Sandage’s (1962) calibration star II-91, for which Dinescu et al. (1996) give a high probability of membership based on its proper motion. Its spectrum, according to Green et al. (1997), is that of sdB star, and L98 estimate a temperature of 30,000 K. Our UV photometry (large circle) confirms that this star is UV bright and is indeed a hot subdwarf. (2) Dinescu et al.’s star D-702 is also identified in our sample (starred point) and is also found to be UV-bright. L98 note that this star is optically moderately blue (), which we confirm. We also find that the star is extended in the images, indicating a possible blend or binary. The star’s photometry bears a striking resemblance to our recent study of WeBo 1 (Siegel et al. 2012) which we characterized as a red giant with a hot pre-WD companion. (3) UIT-1 shows up faintly in the optical but brightly in the three UV filters (solid square). Its extremely blue optical and UV colors are similar to that of the hot WDs described in Siegel et al. (2010). Its location on the CMD is near the theoretical WD sequence.
Figure 5 shows several other UV-bright stars in NGC 188 that lie along the younger isochrones. None have cross-identifications in the Dinescu et al. (1996) catalog, which is not surprising as they lie toward the outskirts of the cluster. However, their proximity to the isochrones indicates that they are likely blue stragglers. We also find several stars that are optically faint but detected in the UV and are along the theoretical WD sequences. These represent faint WDs or hot subdwarfs. Further investigation of all of these stars—especially spectroscopic or astrometric tests of their membership—is needed to confirm their nature.
3.3 NGC 2539
To test the utility of the isochrones for younger populations, we present photometry of the open cluster NGC 2539. NGC 2539 is of about Hyades age, is nearby (630 Myr, 1200 pc; Lapasset et al. 2000), and of near solar metallicity (Santos et al. 2009; Reddy et al. 2013). We have overlaid the appropriate isochrones in Figure 6, along with a cooling curve for a WD using the synthetic colors of Bergeron et al. (2011). The tick marks along the cooling curve mark temperatures of 100000, 80000, 60000, 40000, 20000, and 10000 K from the tip to the faint end.
The isochrones reproduce the main sequence very well in both the optical and NUV, only showing some deviation near the convective hook at the tip of the main sequence. Even the evolved sequences in space overlap the Padova isochrones. As with M 67 and NGC 188, we show a sequence of objects blueward of the main sequence that could correspond to extremely hot WDs. We do not detect any blue stragglers in NGC 2539, likely due to its young age and the loss of brighter stars to coincidence saturation.
3.4 M 79
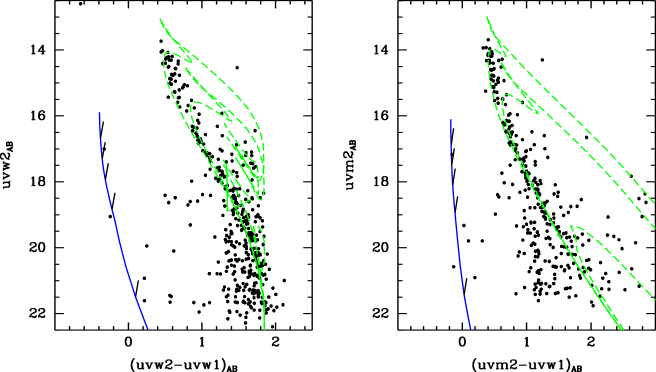
As another test of UVOT’s ability to discern hot UV-bright stars, we examine the old stellar population in a Galactic globular cluster. This population may contain analogs of the evolved stars that produce the UV upturn in early-type galaxies. Figure 7 shows ground-based optical and UVOT NUV CMDs for the globular cluster M 79. The optical photometry is from frames taken with the CTIO 0.9-m telescope, obtained by H.E.B. with the Tek3 CCD chip in 1997 November. For the ground-based data, we have restricted our analysis to stars with DAOPHOT sharp values between and 0.2. For the UVOT data, we retained stars with sharp values between and 0.5 and lying within of the cluster center.

The optical CMD shows prominent subgiant, RGB, BHB, and AGB sequences. A hint of an EHB sequence is seen. The filled square depicts a known PAGB star (Şahin & Lambert 2009, initially discovered by Siegel & Bond (in preparation) based on ground-based photometry (see Siegel & Bond 2005). However, the NUV CMD is strikingly different from the optical. The RGB and AGB have completely vanished, and the BHB, the AGB-M, and the PAGB star are much more prominent. The triangles in the left panel identify the AGB-M stars as identified from the UVOT data. These were not obviously AGB-M stars in the optical data (and, in fact, some were too faint or in too heavily crowded regions to meet our SHARP selection criterion). This once again demonstrates the utility of NUV/FUV data in identifying rare evolutionary sequences.
The point at which the blue end of BHB turns down toward fainter magnitudes in the NUV data is likely the location of the EHB. For EHB stars, our filters lose some sensitivity to bolometric correction and being on the Rayleigh-Jeans tail of the spectral-energy distribution. We do not detect any clear signature of blue hook stars in this cluster, but M 79 is not known to have blue hook stars and they may be too faint in Swift’s NUV filters for clear detection in any case. We will explore this issue in greater detail with the full data set, including UVOT photometry of clusters with known blue hook stars.
4 Conclusions
Our examination of four nearby star clusters has demonstrated that UVOT produces excellent wide-field photometry of stellar populations. For M 67, NGC 188, NGC 2539, and M 79, we easily identify unusual UV-bright stars: young main-sequence stars, blue stragglers, white dwarfs, blue horizontal branch stars, extreme horizontal branch stars, AGB manqué stars, PAGB stars, and the hot components of red-giant star/white-dwarf binaries and red main-sequence star/white-dwarf binaries.
The main sequences of the young open clusters are consistent with the expectation of theoretical isochrones, as are the sequences of blue stragglers. The young stellar populations show a strong convective hook at the tip of the main sequence. UV-bright stars identified in previous surveys—mainly blue stragglers and white dwarfs—are confirmed by the UVOT data. While the main sequence of M 79’s old population is too faint in the NUV to be detected, we clearly show a BHB sequence consistent with previous investigations. We also clearly identify the known PAGB star, which stands well away from the primary sequences. This indicates that the UVOT will be an excellent tool with which to find and characterize these extremely rare stars.
Future contributions in this series of papers will examine the complete set of clusters and nearby galaxies that have been observed by UVOT, in particular the efficacy of UVOT in separating out composite stellar populations of varying age and metallicity. We will also explore the properties of composite stellar populations in the galaxies of the Local Group and connect these studies to our ongoing work on unresolved stellar populations in extragalactic objects. The results with the four test clusters in the present work, however, confirm the efficacy of our photometric methods and the ability of UVOT to detect and characterize the UV-bright components of simple stellar populations.
Appendix A Correcting Isochrones for Reddening in the UVOT System
In most photometric analyses, reddening corrections are applied to isochrones with simple offsets in color-magnitude space scaled to the known reddening coefficient as tabulated in works such as Schlegel et al. (1998). However, this simple method may be inappropriate for UVOT data. As demonstrated in Pei (1992), the UV extinction curve is steep with, for the Milky Way at least, a large bump at 2175 Å. Additionally, the UVOT filters suffer from some degree of red sensitivity (Breeveld et al. 2011) which complicates the effect of dust. This was demonstrated in the context of supernovae by Brown et al. (2010b, Section 2.4) and in the context of hot stars by Siegel et al. (2012). Brown’s analysis of supernovae showed non-linearity in the UV extinction as scaled by infrared/optical extinction. Siegel’s analysis of the binary system WeBo 1 found that for moderately extincted red stars, the effective wavelengths of the and filters, in particular, trended into the visible part of the spectrum. This makes a simple linear extinction coefficient problematic at best.
To test the effects of reddening on the isochrones, we ran all of the solar metallicity models of Castelli & Kurucz (2003) through our synthetic photometry program to generate unreddened magnitudes. We then reddened the spectra using the Pei (1992) dust models and re-ran the synthetic photometry code on these reddened models. The comparison is shown in Figure 8 for a reddening of .

As can be seen, there is a significant non-linearity in the reddening coefficients of the UVOT filters. For cool late-type stars, the UVOT filters have reddening coefficients similar to optical filters (due to a combination of red leak and low intrinsic UV flux). Up to approximately 8,000 K, the reddening coefficient slowly changes from approximately 3-4 to approximately 6-8, depending on the filter. By comparison, the reddening coefficient in the passband is flat with effective temperature. We also find, like Brown et al. (2010), that in the UV passbands does not scale linearly with E(B-V) but declines slightly with increasing reddening. For example, for hot stars declines from 8.17 at E(B-V)=0.1 to 7.80 at E(B-V)=1.0.
We have tabulated the maximum and minimum extinction coefficients for the Swift UVOT filters—at both low and moderate reddening—in Table 4. However, we emphasize that these are the results of simulation. Our ongoing programs—especially those that study open clusters in higher-reddening environments—can provide an empirical constraint on these values.
| Filter | E(B-V)=0.10 | E(B-V)=1.00 | ||
|---|---|---|---|---|
| Cool Stars | Hot Stars | Cool Stars | Hot Stars | |
| 3.04 | 3.10 | 3.03 | 3.09 | |
| 3.75 | 3.99 | 3.74 | 3.96 | |
| 4.49 | 4.96 | 4.39 | 4.92 | |
| 3.54 | 7.40 | 3.38 | 6.76 | |
| 4.37 | 8.79 | 4.26 | 8.36 | |
| 3.09 | 8.17 | 2.86 | 7.80 | |
We also note that the use of a single extinction law may itself be problematic. It has long been known that the UV extinction law is different in the Large and Small Magellanic Clouds as contrasted against the Milky Way. But recent studies by Maíz Apellániz & Rubio (2012), Peek & Schiminovich (2013), Dong et al. (2014) and Hoversten et al. (in prep) have indicated that the UV extinction law may vary within the same galaxy. There may be significant variation in the value of and significant variation in the strength of the 2175 Å bump.
Given the multiple dependencies for the UV extinction coefficients—on , on and on the law used—we have “simplified” things by eschewing the use of a simple analytical correction. Instead, the isochrones used throughout this paper and in future contributions are drawn from a lookup table which takes the Padova isochrones, finds the nearest match in the Kurucz models in metallicity-temperature-gravity space, applies the Pei (1992) extinction law and calculates the reddening offset. This results in subtle but not-insignificant changes to the isochrone shape for late-type stars and at high extinction values. However, this should have little effect on the hot stars our survey is focused on as they are sufficiently UV-bright that a near-linear reddening correction is appropriate. Further improvements to this program will account for variations in the reddening curve slope and the strength of the 2175 Å bump as well as the non-linear scaling of the UV reddening with total line-of-sight extinction.
References
- Alves et al. (2001) Alves, D. R., Bond, H. E., & Onken, C. 2001, AJ, 121, 318
- Andreuzzi et al. (2002) Andreuzzi, G., Richer, H. B., Limongi, M., & Bolte, M. 2002, A&A, 390, 961
- Bedin et al. (2004) Bedin, L. R., Piotto, G., Anderson, J., et al. 2004, ApJ, 605, L125
- Bellini et al. (2010) Bellini, A., Bedin, L. R., Piotto, G., et al. 2010, A&A, 513, A50
- Bellini et al. (2013) Bellini, A., Anderson, J., Salaris, M., et al. 2013, ApJ, 769, L32
- Bergeron et al. (2011) Bergeron, P., Wesemael, F., Dufour, P., et al. 2011, ApJ, 737, 28
- Bertin & Arnouts (1996) Bertin, E., & Arnouts, S. 1996, A&AS, 117, 393
- Bond (1997) Bond, H. E. 1997, The Extragalactic Distance Scale, 224
- Bond (2005) Bond, H. E. 2005, AJ, 129, 2914
- Bowyer et al. (2000) Bowyer, S., Drake, J. J., & Vennes, S. 2000, ARA&A, 38, 231
- Breeveld et al. (2010) Breeveld, A. A., et al. 2010, MNRAS, 406, 1687
- Breeveld et al. (2011) Breeveld, A. A., Landsman, W., Holland, S. T., et al. 2011, American Institute of Physics Conference Series, 1358, 373
- Bressan et al. (2012) Bressan, A., Marigo, P., Girardi, L., et al. 2012, MNRAS, 427, 127
- Brown et al. (2010) Brown, P. J., Roming, P. W. A., Milne, P., et al. 2010b, ApJ, 721, 1608
- Brown et al. (1997) Brown, T. M., Ferguson, H. C., Davidsen, A. F., & Dorman, B. 1997, ApJ, 482, 685
- Brown et al. (2010) Brown, T. M., Sweigart, A. V., Lanz, T., et al. 2010a, ApJ, 718, 1332
- Brown et al. (2012) Brown, T. M., Lanz, T., Sweigart, A. V., et al. 2012, ApJ, 748, 85
- Bruzual A. (2009) Bruzual A., G. 2009, A&A, 500, 521
- Burrows et al. (2005) Burrows, D. N., et al. 2005, Space Science Reviews, 120, 165
- Castelli & Kurucz (2003) Castelli, F., & Kurucz, R. L. 2003, Modelling of Stellar Atmospheres, 210, 20P
- Castellani et al. (2006) Castellani, V., Iannicola, G., Bono, G., et al. 2006, A&A, 446, 569
- Catelan (2009) Catelan, M. 2009, Ap&SS, 320, 261
- Dalessandro et al. (2009) Dalessandro, E., Beccari, G., Lanzoni, B., et al. 2009, ApJS, 182, 509
- Dalessandro et al. (2011) Dalessandro, E., Salaris, M., Ferraro, F. R., et al. 2011, MNRAS, 410, 694
- Dalessandro et al. (2012) Dalessandro, E., Schiavon, R. P., Rood, R. T., et al. 2012, AJ, 144, 126
- Dalessandro et al. (2013) Dalessandro, E., Salaris, M., Ferraro, F. R., Mucciarelli, A., & Cassisi, S. 2013, MNRAS, 430, 459
- Dalessandro et al. (2013) Dalessandro, E., Ferraro, F. R., Lanzoni, B., et al. 2013, ApJ, 770, 45
- de Boer & Code (1981) de Boer, K. S., & Code, A. D. 1981, ApJ, 243, L33
- Dieball et al. (2007) Dieball, A., Knigge, C., Zurek, D. R., et al. 2007, ApJ, 670, 379
- Dinescu et al. (1996) Dinescu, D. I., Girard, T. M., van Altena, W. F., Yang, T.-G., & Lee, Y.-W. 1996, AJ, 111, 1205
- Dong et al. (2014) Dong, H., Li, Z., Wang, Q. D., et al. 2014, arXiv:1403.2691
- Dorman et al. (1997) Dorman, B., Shah, R. Y., O’Connell, R. W., et al. 1997, ApJ, 480, L31
- D’Cruz et al. (2000) D’Cruz, N. L., O’Connell, R. W., Rood, R. T., et al. 2000, ApJ, 530, 352
- Ferraro & Paresce (1993) Ferraro, F. R., & Paresce, F. 1993, AJ, 106, 154
- Ferraro et al. (1999) Ferraro, F. R., Paltrinieri, B., Rood, R. T., & Dorman, B. 1999, ApJ, 522, 983
- Ferraro et al. (2001) Ferraro, F. R., D’Amico, N., Possenti, A., Mignani, R. P., & Paltrinieri, B. 2001, ApJ, 561, 337
- Ferraro et al. (2003) Ferraro, F. R., Sills, A., Rood, R. T., Paltrinieri, B., & Buonanno, R. 2003, ApJ, 588, 464
- Fornal et al. (2007) Fornal, B., Tucker, D. L., Smith, J. A., et al. 2007, AJ, 133, 1409
- Friel et al. (2010) Friel, E. D., Jacobson, H. R., & Pilachowski, C. A. 2010, AJ, 139, 1942
- Gehrels et al. (2004) Gehrels, N., et al. 2004, ApJ, 611, 1005
- Green et al. (1997) Green, E. M., Liebert, J. W., Peterson, R. C., & Saffer, R. A. 1997, The Third Conference on Faint Blue Stars, 271
- Greggio & Renzini (1990) Greggio, L., & Renzini, A. 1990, ApJ, 364, 35
- Grundahl et al. (1999) Grundahl, F., Catelan, M., Landsman, W. B., Stetson, P. B., & Andersen, M. I. 1999, ApJ, 524, 242
- Haurberg et al. (2010) Haurberg, N. C., Lubell, G. M. G., Cohn, H. N., et al. 2010, ApJ, 722, 158
- Heber (2009) Heber, U. 2009, ARA&A, 47, 211
- Hill et al. (1996) Hill, R. S., Cheng, K.-P., Smith, E. P., et al. 1996, AJ, 112, 601
- Holberg & Bergeron (2006) Holberg, J. B., & Bergeron, P. 2006, AJ, 132, 1221
- Jacobson et al. (2011) Jacobson, H. R., Pilachowski, C. A., & Friel, E. D. 2011, AJ, 142, 59
- Kondo et al. (1989) Kondo, Y., Boggess, A., & Maran, S. P. 1989, ARA&A, 27, 397
- Kowalski & Saumon (2006) Kowalski, P. M., & Saumon, D. 2006, ApJ, 651, L137
- Landolt (1992) Landolt, A. U. 1992, AJ, 104, 340
- Landsman et al. (1996) Landsman, W. B., Sweigart, A. V., Bohlin, R. C., et al. 1996, ApJ, 472, L93
- Landsman et al. (1997) Landsman, W., Aparicio, J., Bergeron, P., Di Stefano, R., & Stecher, T. P. 1997, ApJ, 481, L93
- Landsman et al. (1998) Landsman, W., Bohlin, R. C., Neff, S. G., et al. 1998, AJ, 116, 789 [L98]
- Landsman (2005) Landsman, W. 2005, Bulletin of the American Astronomical Society, 37, 1280
- Langer (2012) Langer, N. 2012, ARA&A, 50, 107
- Lanzoni et al. (2007) Lanzoni, B., Sanna, N., Ferraro, F. R., et al. 2007, ApJ, 663, 1040
- Lapasset et al. (2000) Lapasset, E., Clariá, J. J., & Mermilliod, J.-C. 2000, A&A, 361, 945
- Lee et al. (1999) Lee, Y.-W., Joo, J.-M., Sohn, Y.-J., et al. 1999, Nature, 402, 55
- Maíz Apellániz & Rubio (2012) Maíz Apellániz, J., & Rubio, M. 2012, A&A, 541, A54
- Marino et al. (2008) Marino, A. F., Villanova, S., Piotto, G., et al. 2008, A&A, 490, 625
- Marino et al. (2013) Marino, A. F., Milone, A. P., & Lind, K. 2013, ApJ, 768, 27
- Milone & Latham (1994) Milone, A. A. E., & Latham, D. W. 1994, AJ, 108, 1828
- Milone et al. (2008) Milone, A. P., Bedin, L. R., Piotto, G., et al. 2008, ApJ, 673, 241
- Milone et al. (2010) Milone, A. P., Piotto, G., King, I. R., et al. 2010, ApJ, 709, 1183
- Moehler (2001) Moehler, S. 2001, PASP, 113, 1162
- Moehler et al. (2004) Moehler, S., Sweigart, A. V., Landsman, W. B., & Dreizler, S. 2004a, Ap&SS, 291, 231
- Moehler et al. (2004) Moehler, S., Sweigart, A. V., Landsman, W. B., Hammer, N. J., & Dreizler, S. 2004b, A&A, 415, 313
- Moehler et al. (2007) Moehler, S., Dreizler, S., Lanz, T., et al. 2007, A&A, 475, L5
- Molnar et al. (1978) Molnar, M. R., Stephens, T. C., & Mallama, A. D. 1978, ApJ, 223, 185
- Momany et al. (2004) Momany, Y., Bedin, L. R., Cassisi, S., et al. 2004, A&A, 420, 605
- Mould et al. (1996) Mould, J. R., Watson, A. M., Gallagher, J. S., III, et al. 1996, ApJ, 461, 762
- O’Connell et al. (1997) O’Connell, R. W., Dorman, B., Shah, R. Y., et al. 1997, AJ, 114, 1982
- O’Connell (1999) O’Connell, R. W. 1999, ARA&A, 37, 603
- Pancino et al. (2010) Pancino, E., Carrera, R., Rossetti, E., & Gallart, C. 2010, A&A, 511, A56
- Parise et al. (1994) Parise, R. A., Maran, S. P., Landsman, W. B., et al. 1994, ApJ, 423, 305
- Parise et al. (1998) Parise, R. A., Bohlin, R. C., Neff, S. G., et al. 1998, ApJ, 501, L67
- Peek & Schiminovich (2013) Peek, J. E. G., & Schiminovich, D. 2013, ApJ, 771, 68
- Pei (1992) Pei, Y. C., 1992, ApJ, 395, 130
- Piotto et al. (2007) Piotto, G., Bedin, L. R., Anderson, J., et al. 2007, ApJ, 661, L53
- Piotto et al. (2012) Piotto, G., Milone, A. P., Anderson, J., et al. 2012, ApJ, 760, 39
- Piotto et al. (2013) Piotto, G., Milone, A. P., Marino, A. F., et al. 2013, ApJ, 775, 15
- Poole et al. (2008) Poole, T. S., et al. 2008, MNRAS, 383, 627
- Portegies Zwart et al. (2010) Portegies Zwart, S. F., McMillan, S. L. W., & Gieles, M. 2010, ARA&A, 48, 431
- Reddy et al. (2013) Reddy, A. B. S., Giridhar, S., & Lambert, D. L. 2013, MNRAS, 1119
- Rich et al. (1997) Rich, R. M., Sosin, C., Djorgovski, S. G., et al. 1997, ApJ, 484, L25
- Roming et al. (2000) Roming, P. W., Townsley, L. K., Nousek, J. A., et al. 2000, Proc. SPIE, 4140, 76
- Roming et al. (2004) Roming, P. W. A., Hunsberger, S. D., Mason, K. O., et al. 2004, Proc. SPIE, 5165, 262
- Roming et al. (2005) Roming, P. W. A., et al. 2005, Space Science Reviews, 120, 95
- Şahin & Lambert (2009) Şahin, T., & Lambert, D. L. 2009, MNRAS, 398, 1730
- Sandage (1962) Sandage, A. 1962, ApJ, 135, 333
- Sandquist & Hess (2008) Sandquist, E. L., & Hess, J. M. 2008, AJ, 136, 2259
- Sandquist et al. (2010) Sandquist, E. L., Gordon, M., Levine, D., & Bolte, M. 2010, AJ, 139, 2374
- Santos et al. (2009) Santos, N. C., Lovis, C., Pace, G., Melendez, J., & Naef, D. 2009, A&A, 493, 309
- Sarajedini et al. (1999) Sarajedini, A., von Hippel, T., Kozhurina-Platais, V., & Demarque, P. 1999, AJ, 118, 2894
- Sarajedini et al. (2009) Sarajedini, A., Dotter, A., & Kirkpatrick, A. 2009, ApJ, 698, 1872
- Schiavon et al. (2012) Schiavon, R. P., Dalessandro, E., Sohn, S. T., et al. 2012, AJ, 143, 121
- Schlegel et al. (1998) Schlegel, D. J., Finkbeiner, D. P., & Davis, M. 1998, ApJ, 500, 525
- Siegel & Bond (2005) Siegel, M. H., & Bond, H. E. 2005, AJ, 129, 2924
- Siegel et al. (2002) Siegel, M. H., Majewski, S. R., Reid, I. N., & Thompson, I. B. 2002, ApJ, 578, 151
- Siegel, et al. (2010) Siegel, M. H., et al. 2010, ApJ, 725, 1215
- Siegel et al. (2012) Siegel, M. H., Hoversten, E., Bond, H. E., Stark, M., & Breeveld, A. A. 2012, AJ, 144, 65
- Sollima et al. (2005) Sollima, A., Ferraro, F. R., Pancino, E., & Bellazzini, M. 2005, MNRAS, 357, 265
- Stetson (1987) Stetson, P. B. 1987, PASP, 99, 191
- Stetson (1990) Stetson, P. B. 1990, PASP, 102, 932
- Stetson (1994) Stetson, P. B. 1994, PASP, 106, 250
- Stetson (2000) Stetson, P. B. 2000, PASP, 112, 925
- Stetson (2005) Stetson, P. B. 2005, PASP, 117, 563
- Strom et al. (1970) Strom, S. E., Strom, K. M., Rood, R. T., & Iben, I., Jr. 1970, A&A, 8, 243
- Tremblay et al. (2011) Tremblay, P.-E., Bergeron, P., & Gianninas, A. 2011, ApJ, 730, 128
- Twarog et al. (2009) Twarog, B. A., Anthony-Twarog, B. J., & Edgington-Giordano, F. 2009, PASP, 121, 1312
- van Albada et al. (1979) van Albada, T. S., de Boer, K. S., & Dickens, R. J. 1979, A&A, 75, L11
- VandenBerg & Stetson (2004) VandenBerg, D. A., & Stetson, P. B. 2004, PASP, 116, 997
- Villanova et al. (2007) Villanova, S., Piotto, G., King, I. R., et al. 2007, ApJ, 663, 296
- Whitney et al. (1994) Whitney, J. H., O’Connell, R. W., Rood, R. T., et al. 1994, AJ, 108, 1350
- Whitney et al. (1995) Whitney, J. H., O’Connell, R. W., Rood, R. T., et al. 1995, AJ, 110, 1722
- Yadav et al. (2008) Yadav, R. K. S., Bedin, L. R., Piotto, G., et al. 2008, A&A, 484, 609
- Zinn et al. (1972) Zinn, R. J., Newell, E. B., & Gibson, J. B. 1972, A&A, 18, 390
- Zinnecker & Yorke (2007) Zinnecker, H., & Yorke, H. W. 2007, ARA&A, 45, 481