Dust emission in star-forming dwarf galaxies: General properties and the nature of the sub-mm excess ††thanks: Figure 6 is available only in the electronic edition.
We studied the global characteristics of dust emission in a large sample of emission-line star-forming galaxies. The sample consists of two subsamples. One subsample (SDSS sample) includes 4000 compact star-forming galaxies from the Sloan Digital Sky Survey (SDSS), which were also detected in all four bands at 3.4m, 4.6m, 12m, and 22m of the WISE all-sky survey. The second subsample (Herschel sample) is a sample of 28 compact star-forming galaxies observed with Herschel in the FIR range. Data of the Herschel sample were supplemented by the photometric data from the Spitzer observations, Galaxy Evolution Explorer (GALEX) survey, Sloan Digital Sky Survey (SDSS), Wide-Field Infrared Survey Explorer (WISE), Two Micron All Sky Survey (2MASS), NRAO VLA Sky Survey (NVSS), and Faint Images of the Radio Sky at Twenty-cm (FIRST) survey, as well as optical and Spitzer spectra and data in sub-mm and radio ranges. It is found that warm dust luminosities of galaxies from the SDSS sample and cold and warm dust luminosities of galaxies from the Herschel sample are strongly correlated with H luminosities, which implies that one of the main sources of dust heating in star-forming galaxies is ionising UV radiation of young stars. Likely, a significant fraction of dust is located inside H ii and surrounding regions. We found tight correlations between masses of cold and warm dust, again implying the same source of dust heating. Using the relation between warm and cold dust masses for estimating the total dust mass in star-forming galaxies with an accuracy better than 0.5 dex is proposed. On the other hand, it is shown for both samples that dust temperatures do not depend on the metallicities. The dust-to-neutral gas mass ratio strongly declines with decreasing metallicity, similar to that found in other studies of local emission-line galaxies, high-redshift gamma-ray burst (GRB) hosts, and damped Ly- absorbers (DLAs). On the other hand, the dust-to-ionised gas mass ratio is about one hundred times as high implying that most of dust is located in the neutral gas. It is found that thermal free-free emission of ionised gas in compact star-forming galaxies is important in the sub-mm and mm ranges, and it might be responsible for the sub-mm emission excess. This effect is stronger in galaxies with lower metallicities and is also positively affected by an increased star-formation rate.
Key Words.:
galaxies: fundamental parameters – galaxies: statistics – galaxies: dwarf – galaxies: starburst – galaxies: ISM – galaxies: abundances1 Introduction
Dust plays an important role in the thermal and dynamical evolution of galaxies at different spatial scales from protostars to large molecular complexes. Observations with ground-based and space-born telescopes, Infrared Astronomical Satellite (IRAS), Infrared Space Observatory (ISO), Submillimetre Common-User Bolometer Array (SCUBA), Spitzer, and Herschel, revealed significant populations of dusty luminous and ultraluminous infrared galaxies at redshifts 1 (e. g. Hauser & Dwek 2001; Elbaz et al. 2002; Dole et al. 2006; Frayer et al. 2006), indicating that dust grains are being formed in intense and short star-formation episodes and implying a rapid transition in high-redshift galaxies from the formation of zero-metal Population III stars to the formation of stellar populations more typical for present-day galaxies (e.g. Nozawa et al. 2003; Schneider et al. 2012; Chiaki et al. 2014). However, the dust formation in the early universe is debated. In particular, Valiante et al. (2011) find that population III stars do not contribute much to the dust budget. They claim that the dust is formed by population II/I, SNe, and AGB stars at the later stage.
Studies of high-redshift low-metallicity galaxies are very difficult because of their faintness and small angular sizes. We have a chance to study star formation and role of dust in low-metallicity environments by investigating properties of nearby star-forming dwarf galaxies, such as irregular, blue compact dwarf (BCD), and green pea (GP) galaxies. These galaxies can be considered as local counterparts or “analogs” of high-redshift galaxies, such as Lyman-break galaxies (LBGs) and Lyman- emitting galaxies, because of their high star-formation activity and low metallicity (e.g. Cardamone et al. 2009; Izotov et al. 2011a). Due to their proximity they can be studied in greater detail than it is possible in distant galaxies. Studying the properties of a metal-poor ISM, we may be able to better understand the physical conditions in high-redshift galaxies.
The properties of radiation in the mid- and far-infrared ranges of star-forming dwarf galaxies were studied in many papers by considering samples of galaxies and individual galaxies (e.g. Draine et al. 2007; Engelbracht et al. 2005, 2008; Cannon et al. 2006; Hunt et al. 2005a, 2010; Galliano et al. 2008; Galametz et al. 2009, 2011; Madden et al. 2006, 2013; Rémy-Ruyer et al. 2013, 2014; Wu et al. 2006, 2007, 2008; Hao et al. 2009; O’Halloran et al. 2010; Cormier et al. 2012; Indebetouw et al. 2009, 2013; Karczewski et al. 2013). Spectral energy distributions (SEDs) in these ranges are dominated by dust emission resulting from reprocessing of UV radiation from young massive stars, in particular in the most metal-deficient BCDs I Zw 18 and SBS 0335052E (Wu et al. 2007; Houck et al. 2004).
It was concluded in numerous papers that the main dust heating source in dwarf emission-line galaxies is the radiation from young stellar populations. Dust in these galaxies is heated to higher temperatures of 30-40K as compared to 20K in spirals (e.g. Engelbracht et al. 2008; Hirashita et al. 2008). The polycyclic aromatic hydrocarbon (PAH) emission in dwarf star-forming galaxies is weak or absent, and it decreases with decreasing metallicity (e. g. Wu et al. 2007; Hunt et al. 2010). Different mechanisms were invoked to explain the weakness of PAH features in these galaxies: destruction by the intense UV radiation (Madden et al. 2006), destruction by shocks (O’Halloran et al. 2006), delayed formation by AGB stars (Galliano et al. 2008), and formation of molecular clouds (Sandstrom et al. 2010). It was also found that the dust emission in dwarf galaxies cannot be characterised by radiation with a single temperature. Warm and hot dust with temperatures of up to several hundred degrees must be present in many of these galaxies in addition to cold dust to reproduce the SED in the mid- and far-infrared ranges (e. g. Griffith et al. 2011; Izotov et al. 2011b, 2014). It is most likely that dust temperature gradients are present in the ISM around massive and compact stellar clusters (e.g. Hunt et al. 2014).
The mid- and far-infrared emission in dwarf galaxies results from absorption of radiation at shorter wavelengths in the UV and optical ranges. It includes not only the stellar component and nebular emission lines but also the nebular continuum (free-bound and free-free emission). The necessity to include the latter in young starbursts was discussed by Izotov et al. (2011a) as otherwise stellar masses may be overestimated by a factor of up to 3.
It also was established that the fraction of nebular continuum increases with wavelength. Nebular continuum dominates at 1 - 3 m with a flux fraction of 70-90% in extremely young starbursts, which are characterised by high equivalent widths EW(H) 100Å of the H emission line. Ignoring this result would lead to wrong conclusions. For example, Engelbracht et al. (2008) suggested that dust already dominates at 1.8m in SBS 0335-052E, Haro 11, and SHOC 391, while it is clear from detailed fitting of optical spectra that the main contributor to the continuum in the near-infrared range is ionised gas.
Therefore, photometric data are not sufficient for correct SED fitting in the optical range; spectra are needed as well. Using spectra and the H emission line flux, one can also predict the flux of free-free emission in the radio range (Caplan & Deharveng 1986) and can estimate how much star formation is hidden in the UV and optical ranges.
Among the first studies, where detailed fitting of UV and optical SEDs, which included both stellar and gaseous continua, was applied for analysis of optical and infrared properties of large samples of compact star-forming galaxies were those performed by Izotov et al. (2011b) and Izotov et al. (2014). In particular, Izotov et al. (2014) considered a sample of 14000 SDSS galaxies with strong emission lines and found that mid- and far-infrared luminosities are strongly correlated with the luminosity of ionising stellar radiation.
This study is the continuation of the work by Izotov et al. (2011b) and Izotov et al. (2014), where relations between luminosities and optical and near-infrared colour characteristics were mainly discussed. Here we concentrate on the determination of the dust characteristics, such as temperature and mass. We use two samples. The first sample selected from the SDSS consists of compact star-forming galaxies with available mid-infrared data from the WISE all-sky survey. This sample was discussed by Izotov et al. (2014). The second sample consists of nearby star-forming galaxies observed with Herschel by Madden et al. (2013) and Rémy-Ruyer et al. (2013).
2 The samples
2.1 SDSS sample
We use a sample of 14000 star-forming galaxies selected by Izotov et al. (2014) from the spectroscopic database of the SDSS Data Release 7 (DR7) (Abazajian et al. 2009). The details of data selection can be found in Izotov et al. (2014). Out of this sample, we select 4000 compact galaxies with angular diameters 6″, which were detected in all four WISE bands at 3.4m, 4.6m, 12m, and 22m, allowing the determination of the warm and hot dust properties. The SDSS spectra and SDSS , , , , and magnitudes of all selected galaxies are available in the SDSS database. Finally, we restrict the sample to only those 1000 galaxies out of the 4000, where the [O iii] 4363Å emission line was measured with an accuracy better than 50%. This allows for a reliable determination of the oxygen abundance. Hydrogen emission lines in these galaxies are strong allowing for a correction for dust extinction from the decrement of several hydrogen lines.
2.2 Herschel sample
We use a sample of 48 star-forming galaxies studied by Rémy-Ruyer et al. (2013) with the Herschel space observatory and adopt their Herschel FIR fluxes and distances. This sample was supplemented by the data on the total fluxes from other photometric surveys, namely from the GALEX111http://galex.stsci.edu/GR6/ (Martin et al. 2005), SDSS222http://skyserver.sdss3.org/dr10/en/tools/chart/chartinfo.aspx (Abazajian et al. 2009), WISE333http://irsa.ipac.caltech.edu/cgi-bin/Gator/nph-scan?mission=irsa&submit=Select&projshort=WISE (Wright et al. 2010), 2MASS444http://irsa.ipac.caltech.edu/cgi-bin/Gator/nph-scan?mission=irsa&submit=Select&projshort=2MASS (Skrutskie et al. 2006), NVSS555http://www.cv.nrao.edu/nvss/ (Condon et al. 1998) and FIRST666http://sundog.stsci.edu/cgi-bin/searchfirst (Kimball & Ivezić 2008) surveys. Furthermore, Spitzer spectra777http://cassis.sirtf.com/atlas/index.shtml (Lebouteiller et al. 2011) in the mid-infrared range, spectra in the optical range, and, whenever it was possible, data in the sub-mm and radio ranges at different wavelengths were collected. Out of 48 galaxies by Rémy-Ruyer et al. (2013), we excluded galaxies without optical or Spitzer spectra, galaxies with large angular radii 60″, and galaxies, which were not detected by Herschel in any of the PACS or SPIRE photometric bands. Furthermore, we excluded the compact object UM 311 because this is not a galaxy, but an H ii region within a spiral galaxy.
In the end, the Herschel sample consists of 28 compact galaxies with coordinates and distances shown in Table 1. References on available photometric and spectroscopic data are also given in the Table.
| References | ||||||||
| Object | RA (J2000) | Dec (J2000) | Distance | H | Optical | Spitzer | sub-mm and | H i 21cm |
| flux | spectra | photometry | radio | |||||
| Haro 11 | 00h36m52.7s | 33d33m17.0s | 92.1 | 1 | 2 | 3 | 4,1,5,6 | 53 |
| Haro 3 | 10h45m22.4s | 55d57m37.0s | 19.3 | 7 | 8 | 9 | 5,54,57 | 10 |
| HS 00171055 | 00h20m21.4s | 11d12m21.0s | 79.1 | 11 | 11 | … | 57 | … |
| HS 00522536 | 00h54m56.4s | 25d53m08.0s | 191.0 | 11 | 11 | … | … | … |
| HS 08223542 | 08h25m55.5s | 35d32m32.0s | 11.0 | 7 | 12 | 3 | 57 | 13 |
| HS 12223741 | 12h24m36.7s | 37d24m37.0s | 181.7 | 12 | 12 | … | 57 | … |
| HS 13043529 | 13h06m24.2s | 35d13m43.0s | 78.7 | 12 | 12 | … | 57 | … |
| HS 13303651 | 13h33m08.3s | 36d36m33.0s | 79.7 | 12 | 12 | … | 57 | … |
| I Zw 18 | 09h34m02.0s | 55d14m28.0s | 18.2 | 7 | 12 | 3 | 14,16,57 | 10 |
| II Zw 40 | 05h55m42.6s | 03d23m32.0s | 12.1 | 17 | 18 | 3 | 19,20,21,22,23,5,54 | 24 |
| Mrk 1089 | 05h01m37.7s | 04d15m28.0s | 56.6 | 25 | 26 | … | 1,5,27,54 | 29 |
| Mrk 1450 | 11h38m35.7s | 57d52m27.0s | 19.8 | 7 | 30 | 3 | 5,57 | 31 |
| Mrk 153 | 10h49m05.0s | 52d20m08.0s | 40.3 | 7 | 12 | 3 | 5,57 | 32 |
| Mrk 209 | 12h26m15.9s | 48d29m37.0s | 5.8 | 7 | 12 | 33 | 5,55,56,57 | 10 |
| Mrk 930 | 23h31m58.3s | 28h56m50.0s | 77.8 | 7 | 8 | 3 | 34,5 | 35 |
| NGC 1140 | 02h54m33.6s | 10d01m40.0s | 20.0 | 7 | 18 | 3 | 19,20,28,5 | 24 |
| Pox 186 | 13h25m48.6s | 11d36m38.0s | 18.3 | 37 | 37 | … | … | … |
| SBS 0335052E | 03h37m44.0s | 05d02m40.0s | 56.0 | 38 | 39 | 3 | 40,41,5,54 | 42 |
| SBS 1159545 | 12h02m02.4s | 54d15m50.0s | 57.0 | 30 | 30 | … | 57 | … |
| SBS 1211540 | 12h14m02.5s | 53d45m17.0s | 19.3 | 30 | 12 | … | 57 | 35 |
| SBS 1249493 | 12h51m52.5s | 49d03m28.0s | 110.8 | 43 | 43 | … | 57 | 52 |
| SBS 1415437 | 14h17m01.4s | 43d30m05.0s | 13.6 | 44 | 43 | … | 57 | 35 |
| SBS 1533574 | 15h34m13.8s | 57d17m06.0s | 54.2 | 45 | 45 | … | 57 | 35 |
| Tol 1214277 | 12h17m17.1s | 28d02m33.0s | 120.5 | 46 | 47 | 3 | … | … |
| UGC 4483 | 08h37m03.0s | 69d46m31.0s | 3.2 | 7 | 30 | 3 | … | 48 |
| UM 448 | 11h42m12.4s | 00d20m03.0s | 87.8 | 7 | 39 | 3 | 28,49,5,57,58 | 10 |
| UM 461 | 11h51m33.3s | 02d22m22.0s | 13.2 | 7 | 12 | 3 | 57 | 50 |
| VII Zw 403 | 11h27m59.9s | 78d59m39.0s | 4.5 | 7 | 45 | 3 | 51,59 | 10 |
Note: Distances and Herschel photometric data are from Rémy-Ruyer et al. (2013). GALEX photometric data are from http://galex.stsci.edu/GR6/. SDSS photometric data are from http://skyserver.sdss3.org/dr10/en/tools/chart/chartinfo.aspx. WISE data are from http://irsa.ipac.caltech.edu/cgi-bin/Gator/nph-scan?mission=irsa&submit=Select&projshort=WISE. 2MASS data are from http://irsa.ipac.caltech.edu/cgi-bin/Gator/nph-scan?mission=irsa&submit=Select&projshort=2MASS. NVSS and FIRST data in the continuum at 20 cm are from http://www.cv.nrao.edu/nvss/ and http://sundog.stsci.edu/cgi-bin/searchfirst, respectively; low-resolution Spitzer spectra are from http://cassis.sirtf.com/atlas/index.shtml.
References: (1) Schmitt et al. (2006); (2) Guseva et al. (2012); (3) Engelbracht et al. (2008); (4) Galametz et al. (2009); (5) Condon et al. (1998); (6) Madden et al. (2006); (7) Moustakas & Kennicutt (2006); (8) Izotov & Thuan (2004); (9) Hunt et al. (2006); (10) Huchtmeier & Richter (1989); (11) Ugryumov et al. (2003); (12) Izotov et al. (2006a), http://das.sdss.org/spectro/; (13) Chengalur et al. (2006); (14) Leroy et al. (2007); (15) Cannon et al. (2005); (16) Hunt et al. (2005b); (17) Lagos et al. (2007); (18) Guseva et al. (2000); (19) Galliano et al. (2005); (20) Albrecht et al. (2004); (21) Hirashita (2011); (22) Hunt et al. (2005b); (23) Kepley et al. (2014); (24) Springob et al. (2005); (25) Vacca & Conti (1992); (26) Izotov & Thuan (1999); (27) Galametz et al. (2009); (28) Bicay et al. (1995); (29) Williams et al. (1991); (30) Izotov et al. (1994); (31) Huchtmeier et al. (2005); (32) Thuan & Martin (1981); (33) Dale et al. (2009); (34) Rosa-Gonzalez et al. (2007); (35) Thuan et al. (1999b); (36) Hunter et al. (1994); (37) Guseva et al. (2004); (38) Izotov et al. (2006b); (39) Izotov & Thuan (1998); (40) Johnson et al. (2009); (41) Hunt et al. (2014); (42) Ekta et al. (2009); (43) Thuan et al. (1995); (44) Gil de Paz et al. (2003); (45) Izotov et al. (1997); (46) Guseva et al. (2011); (47) Izotov et al. (2001); (48) de Vaucouleurs et al. (1991); (49) Dressel & Condon (1978); (50) Courtois et al. (2011); (51) Thuan et al. (2004); (52) Pustilnik et al. (2002); (53) Cormier et al. (2014); (54) Rabidoux et al. (2014); (55) Viallefond & Thuan (1983); (56) Klein et al. (1991); (57) Kimball & Ivezić (2008); (58) James et al. (2002); (59) Leroy et al. (2005).
3 The determination of galaxy parameters
Most global galaxy parameters (metallicities, stellar masses, H luminosities and UV, optical, infrared and radio monochromatic luminosities) for the SDSS sample were derived by Izotov et al. (2014), which we adopt in this paper. We apply the same technique to derive galaxy parameters for the Herschel sample. The technique is briefly described in this section.
3.1 Element abundances and H luminosity
The SDSS spectra of the galaxies from the SDSS sample are used to derive emission-line fluxes and equivalent widths, the extinction coefficient (H), the H ii region luminosity in the H emission line, and chemical element abundances. The observed line fluxes were obtained using the IRAF888IRAF is the Image Reduction and Analysis Facility distributed by the National Optical Astronomy Observatory, which is operated by the Association of Universities for Research in Astronomy (AURA) under cooperative agreement with the National Science Foundation (NSF). SPLOT routine. The line flux errors included statistical errors in addition to errors introduced by the standard star absolute flux calibration, which we set to 1% of the line fluxes. These errors are later propagated into the calculation of abundance errors. The line fluxes were corrected for the Milky Way and internal reddening using the extinction curve of Cardelli et al. (1989) and for underlying hydrogen stellar absorption. The extinction coefficients are defined as (H) = 1.47, where = / and = 3.2 (Aller 1984).
The oxygen abundances were derived according to the procedures described by Izotov et al. (1994, 1997) and Thuan et al. (1995), where a two-zone photoionised H ii region model was adopted: a high-ionisation zone with temperature (O iii), and a low-ionisation zone with temperature (O ii). In the H ii regions with a detected [O iii] 4363 emission line, the temperature (O iii) was calculated using the direct method based on the [O iii] 4363/(4959+5007) line ratio. The electron temperature (O iii) in H ii regions with non-detected [O iii] 4363 emission line was derived by a semi-empirical method (Izotov & Thuan 2007; Izotov et al. 2014), which is based on the relation between (O iii) and the total flux of strong [O ii] 3727, [O iii] 4959, and [O iii] 5007 emission lines.
We use the relation between the electron temperatures (O iii) and (O ii) obtained by Izotov et al. (2006a) from the H ii region models of Stasińska & Izotov (2003) to derive (O ii). Ionic and total oxygen abundances were derived using expressions for ionic abundances and ionisation correction factors (ICFs) obtained by Izotov et al. (2006a).
The extinction-corrected luminosity (H) was obtained from the observed H emission-line flux by adopting the total extinction, which included the Milky Way, internal galaxy extinctions, and the distance derived from the redshift. For distance determination, Izotov et al. (2014) used the relation = (,,,) from Refsdal et al. (1967), where the Hubble constant = 67.3 km s-1 Mpc-1 and cosmological parameters = 0.273, = 0.682 were obtained from the Planck mission data (Planck Collaboration 2013). The equivalent widths EW(H) were reduced to the rest frame.
The SDSS spectra were obtained with a small aperture of 3″ in diameter. To derive integrated characteristics of the galaxies from their spectra and to make a comparison with photometric data more accurate, Izotov et al. (2014) corrected spectroscopic data for the aperture using the relation 2.5r(3″)-r, where and (3″) are the SDSS -band total magnitude and the magnitude within the 3″ spectroscopic aperture, respectively.
The SDSS spectra for some galaxies from the Herschel sample were also available. Izotov et al. (2014) used these data to derive the same parameters as those for SDSS sample galaxies. In other cases, we used optical spectra obtained with different telescopes to derive extinction, physical conditions and element abundances. The H fluxes were obtained from SDSS spectra only for three Herschel galaxies, HS 1222+3741, HS 1304+3529, and HS 1330+3651. For other galaxies, we adopted the observed H fluxes from the literature, which were obtained with the largest available apertures and corrected them for the extinction derived from the optical spectra. References on the optical spectra and H fluxes are given in Table 1.
3.2 Stellar masses
Izotov et al. (2014) derived galaxy stellar masses by modelling the galaxy spectral energy distributions (SED) in the optical range for each galaxy from the SDSS sample. They took into account both the stellar and ionised gas emission.
The method is based on fitting a series of model SEDs to the observed one and finding the best fit. The fit, described in more detail by Guseva et al. (2006, 2007) and Izotov et al. (2011a, 2014), was performed for each SDSS spectrum over the whole observed spectral range of 3900–9200Å. As each SED is the sum of both stellar and ionised gas emission, its shape depends on the relative contribution of these two components. The contribution of gaseous emission relative to stellar emission can be parameterized by the equivalent width EW(H) of the H emission line. The shape of the spectrum depends also on reddening and the star-formation history of the galaxy.
Izotov et al. (2014) approximated the star-formation history in each galaxy by a recent short burst with age 10 Myr, which accounts for the young stellar population, and a prior continuous star formation responsible for the older stars with age 10 Myr. The contribution of each stellar population to the SED was parameterized by the varying ratio of the masses of the young to old stellar populations, /. Then the total stellar mass is equal to = + . We adopted and , calculated by Izotov et al. (2014) for SDSS sample galaxies, where details of the SED fitting can be found.
For the galaxies from the Herschel sample, we derive stellar masses, using the same method of SED fitting and spectra as cited in Table 1.
3.3 Integrated dust characteristics
To derive integrated dust characteristics in our SDSS and Herschel samples we use the modified blackbody fitting technique, similar to that used by Rémy-Ruyer et al. (2013).
Rémy-Ruyer et al. (2013) fitted the Herschel data by adopting a single dust temperature . This is sufficient to fit far-infrared fluxes and to derive the mass of the cold dust. However, there is evidence for warm and hot dust in star-forming dwarf galaxies (e.g. Griffith et al. 2011; Izotov et al. 2011b, 2014; Hunt et al. 2014).
Therefore, we adopted a three-component model with the temperatures , , and to fit dust emission in the wavelength range 3 - 500 m covered by WISE, Spitzer, and Herschel observations:
where and are Planck and Boltzman constants, respectively, is the emissivity index, , and , and are scaling coefficients.
The cold dust component with the temperature contributes mainly at wavelengths 70 m covered by Spitzer/MIPS 70m and 160m and Herschel observations. The warm dust component with the temperature strongly contributes in the wavelength range 10 - 50m covered mainly by the WISE 12m and 22 m, Spitzer/MIPS 24m and Spitzer/IRS observations. Finally, the hot dust component with the temperature contributes in the wavelength range 10 m, which is covered by the WISE 3.4m and 4.6 m, and Spitzer/IRAC observations. In reality, there is a gradient in dust temperature. However, we show later that a three-component model is sufficient to fit dust emission in the entire mid- and far-infrared ranges.
We use Monte Carlo simulations to derive , , and , and scaling coefficients , , and by minimization of :
| (2) |
where (obs) and (mod) are observed and modelled fluxes, is the uncertainty of the observed flux, and is the number of observed fluxes.
The 1 errors (68.3% confidence level) of , , , , , and are estimated by adopting = – = 7.04 for six degrees of freedom. For some objects, we considered SED modelling with a two-component dust, excluding the hot component. In this case, = 4.72 for four degrees of freedom. Derived errors of temperatures and scaling coefficients were then propagated to obtain errors for dust masses and luminosities.
The dust masses , , and of each component are given by
| (3) |
where = 100 m, () = 34.7 cm2 g-1 is the dust emissivity cross section per unit mass at 100 m for the best fit SMC (Small Magellanic Cloud) dust (Weingartner & Draine 2001), is the distance to the galaxy, = , or is the dust temperature, (,) is the Planck function, and () is the monochromatic flux of dust emission.
Rémy-Ruyer et al. (2013) varied the emissivity index from 0 to 2.5 to achieve the best agreement between the observed and modelled cold dust emission. At wavelengths 20m, the dust absorption coefficient is fairly well approximated by a power law fit with = 2.0 (Draine 2003; Krügel 2008), and as this is the range where most of the energy is emitted, we use this value to calculate the dust luminosity of the cold component from
| (4) |
At shorter wavelengths, is smaller and more variable, but, for simplicity, we use the same also for the warm and hot component. Nevertheless we also discuss the expected changes if is lower.
The photometric WISE and Spitzer fluxes at 15 m prior to fitting were corrected for contributions from the stellar and gaseous (continuum and emission lines) emission. The stellar and gaseous continuum can be important at 5 m. We subtract it by using extrapolations of SED fits obtained from optical spectra. However, if observed WISE 3.4m, 4.6m fluxes and Spitzer 3.6m, 4.5m fluxes are smaller than the extrapolated fluxes, we excluded them from the hot dust emission fitting. The stellar and gaseous continuum is negligible at longer wavelengths and does not affect the determination of warm and cold dust parameters.
The grid of CLOUDY spherical ionisation-bounded H ii region models calculated in a wide range of input parameters (version c13.01, Ferland et al. 1998, 2013) is used to predict and subtract the strongest mid-infrared emission lines, [Ar iii] 9.0 m, [S iv] 10.51 m, and [Ne iii] 15.55 m at their respective redshifted wavelengths. The range of parameters and a grid are described by Izotov et al. (2013). The input CLOUDY chemical abundances were derived from the optical spectra of each object. The equivalent widths of MIR emission lines ( 0.1 m) are small as compared to the widths of the WISE photometric bands ( 10 m); therefore, corrections for emission lines do not exceed 1%. The CLOUDY models also predict fluxes of PAH lines at 3.3 m, 6.2 m, 7.9 m, 11.3 m, 11.8 m, and 13.3 m. However, we do not subtract PAH emission from the observed fluxes due to the complexity of PAH features fitting. Our inspection of the Spitzer/IRS spectra shows that PAH emission is visible only in the six highest-metallicity galaxies from our Herschel sample with 12+logO/H 8.1. Neglecting corrections for PAH emission would overestimate the temperature of the hot dust component by at most 10%. Parameters of the warm and cold components will not be changed.
Since only SDSS optical, 2MASS NIR and WISE MIR data are available for the most of the SDSS sample galaxies, we cannot fit the cold dust component. Therefore, for this sample, we adopted a one-component dust model to derive characteristics of the warm dust from the flux ratio at 12 m and 22 m. For a small number of 58 SDSS galaxies with red 3.4m – 4.6m colours of 1.5 mag, implying the presence of hot dust, we also adopted a two-component dust model to derive characteristics of the hot and warm dust from the 3.4m/4.6m and 12m/22m flux ratios, respectively.
For the Herschel sample we use available data in the optical, NIR, MIR, FIR, sub-mm and mm ranges to fit the observed data with the three-component dust model. However, the two-component dust model is sufficient for six galaxies. We note that we discuss the parameters of only cold and warm dust emission in all cases below. This is because hot dust emission may not be in thermal equilibrium. Therefore, its characteristics, such as apparent temperature and mass, may be misleading and do not correctly represent its true parameters.
4 Results
4.1 SDSS sample of compact galaxies
We use WISE 12m and 22m fluxes to derive the temperatures , the luminosities , and the masses of the warm dust.
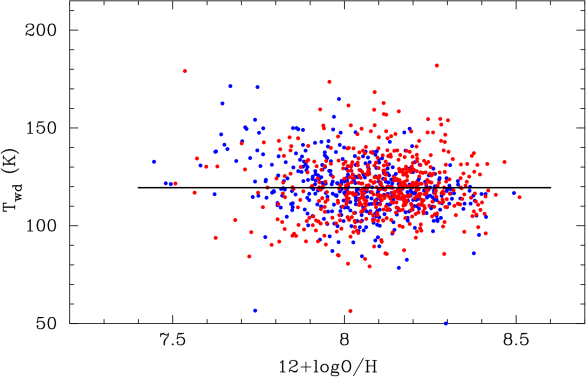
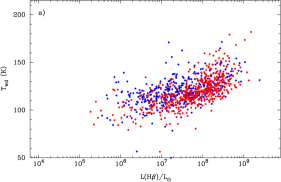
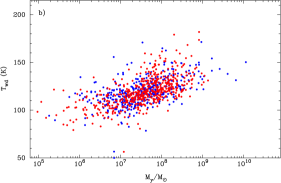
In Fig. 1, we show the dependence of the warm dust temperature on the oxygen abundance 12 +log O/H that is calculated with the emissivity index =2.0. Only 1000 galaxies with reliably derived oxygen abundances are shown in the Figure. Galaxies with the H equivalent width EW(H) 50Å and 50Å are also represented. Most of the galaxies are spread in the interval of 80 – 150K with an average value of 120K. The average temperature would be higher by 20K if = 1.0 is adopted.
No clear dependence of dust temperature on 12+logO/H is found, implying that the metallicity is not a factor, which regulates dust emission. We also do not find differences between warm dust temperatures in galaxies with high-excitation and low-excitation H ii regions.
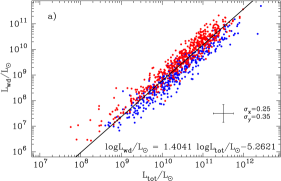
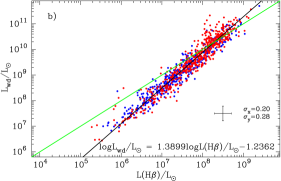
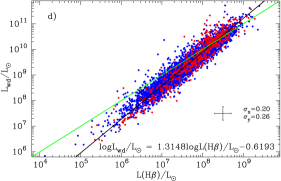
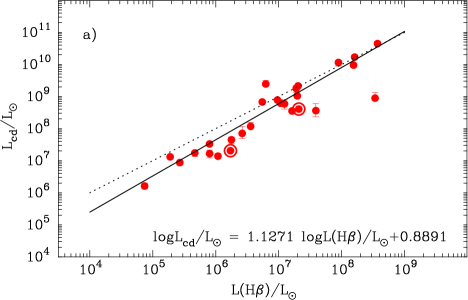
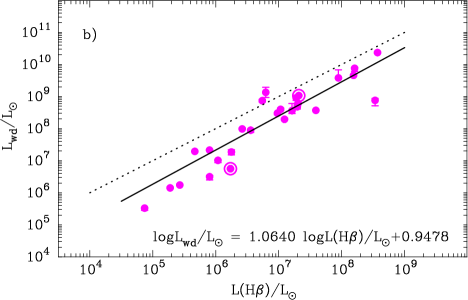
Figures 2a and 2b respectively show dependencies of warm dust luminosities on total galaxy luminosities and on H luminosity (H) for 1000 compact galaxies with reliable oxygen abundances. The total luminosity is calculated in the wavelength range 0.1 – 22 m (Izotov et al. 2013). Linear most likelihood fits of the relations are shown by solid lines.
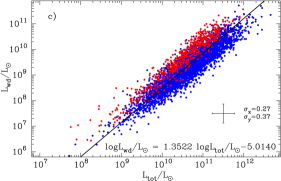
We find that the relation in Fig. 2b is tighter than that in Fig. 2a. The difference is more obvious from the comparison of Fig. 2c and Fig. 2d, where we show the entire SDSS sample of 4000 compact star-forming galaxies. This difference indicates that warm dust is heated by the UV radiation of star-forming regions with a significant fraction of ionising stellar radiation. Thus much of the warm dust is likely associated with H ii regions and neutral gas clouds surrounding these H ii regions.
This conclusion is supported by the result that there is no offset between galaxies with high and low EW(H) (Figs. 2b,d), implying that the warm dust luminosity is determined by the (H) luminosity which in turn is proportional to the luminosity of ionising radiation. The relations on the total luminosities, which include both ionising and non-ionising radiation, are broader with clear separation of galaxies with high and low EW(H) (Figs. 2a,c).
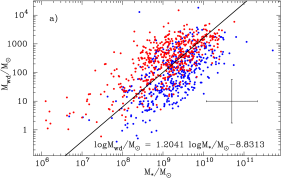
The dependence of the warm dust mass , calculated with = 2.0, on total stellar mass is shown in Fig. 3a for galaxies with high and low EW(H), respectively. The warm dust mass would be increased by a factor of 2 if = 1.0 is adopted. At a variance with the - relation, the correlation - is much weaker. This can be due to the presence of a faint old stellar population, not participating in the heating of warm dust. Its contribution to the stellar mass can be high, while it does not contribute much to the total luminosity because of the steeper than linear relation between stellar mass and luminosity.
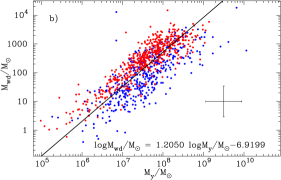
The dependence of on the mass of the young stellar population is much tighter (Fig. 3b) supporting the conclusion that warm dust in SDSS compact dwarf galaxies is heated to a large extent by the radiation from young stars. Similarly to Fig. 3a, the warm dust mass is increased by a factor of 2, if an emissivity index of 1.0 is adopted. However, a clear offset is present in both panels of Fig. 3 - the mass of warm dust in galaxies with lower EW(H) is lower than that in galaxies with high EW(H).
Relations vs. (H) (Fig. 2b) and vs. (Fig. 3b) are steeper than linear relations. We may assume that the non-linearity of the vs. (H) relation is due to the result that the warm dust in more luminous and more massive starbursts is warmer and is thus characterised by higher emissivity (Fig. 4a). However, in this case, one would expect a shallower than linear relation vs. because of the positive correlation between and (Fig. 4b) although it is steeper. Probably, other factors such as the dust-to-gas mass ratios play a role in steepening relations in Figs. 2b and 3b. The dust-to-gas mass ratios are smaller for lower-metallicity galaxies, which are also fainter and less massive. Possible deviations of warm dust emission from the thermal equilibrium may also play a role.
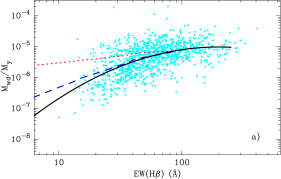
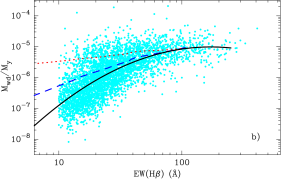
We produce dependencies of the / ratios on EW(H) for 1000 SDSS galaxies with best derived oxygen abundances and for the entire sample of 4000 SDSS compact galaxies in Fig. 5a and 5b. The clear decrease of the mass ratio with decreasing EW(H) or respective increasing age is seen. It is more evident for the entire sample (Fig. 5b). This decrease is caused mainly by the decrease of , because is almost not changed at EW(H) 10Å, corresponding to instantaneous burst ages 10 Myr.
We fit the distributions for both samples by quadratic maximum-likelihood regressions. For comparison, we also show dependencies of / ratios on EW(H), which are proportional to the luminosities of ionising radiation and to the total luminosities of the instantaneous burst (Schaerer & Vacca 1998; Leitherer et al. 1999). It is seen that these dependencies are not as steep, but the dependencies, which are proportional to the luminosities of ionising radiation, are in closer agreement with the likelihood regressions. The differences between the dependencies are likely due to that the / ratios increase with the luminosity of ionising radiation more steeply than linearly. Thus, this result and the tight correlation between the luminosities and (H) suggest that warm dust is associated with H ii regions and is heated in significant part by ionising radiation of hot O-stars beyond the Ly-limit at 912Å.
4.2 Herschel sample
The original Herschel sample of 48 galaxies by Rémy-Ruyer et al. (2013) is more heterogeneous as compared to the SDSS galaxies considered in the previous subsection and includes extended irregular galaxies and BCDs. Large angular sizes of some galaxies in the Herschel sample make a comparison of data obtained at different wavelengths uncertain as large aperture corrections are needed. On the other hand, these are nearby objects, some of them are bright, and most of them were extensively observed in different wavelength ranges. Applying selection criteria discussed in Sect. 2.2, we reduced the sample to 28 compact galaxies. We collect the available data for the reduced Herschel sample from the UV-range to the radio-range using mainly databases of all-sky surveys. References to these observational data are given in Table 2.
4.2.1 SED fits
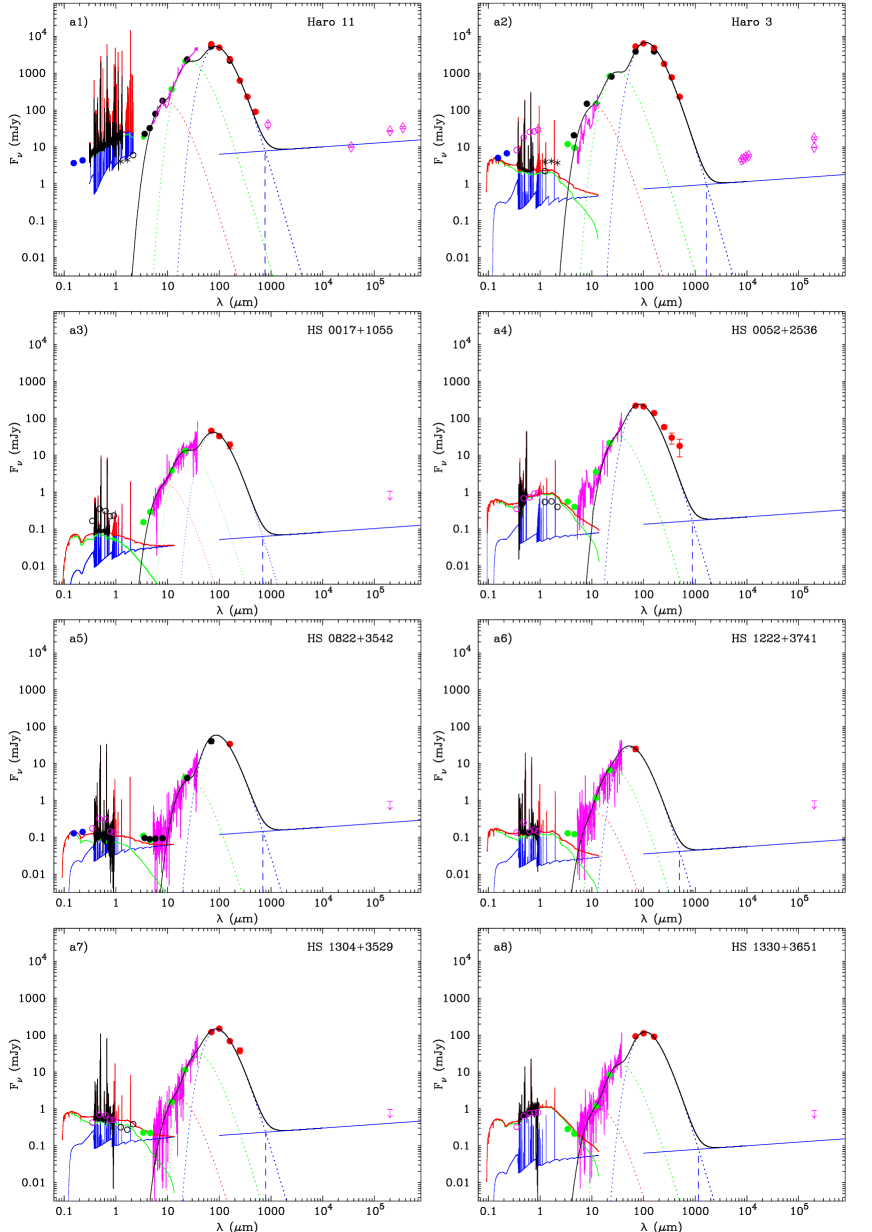
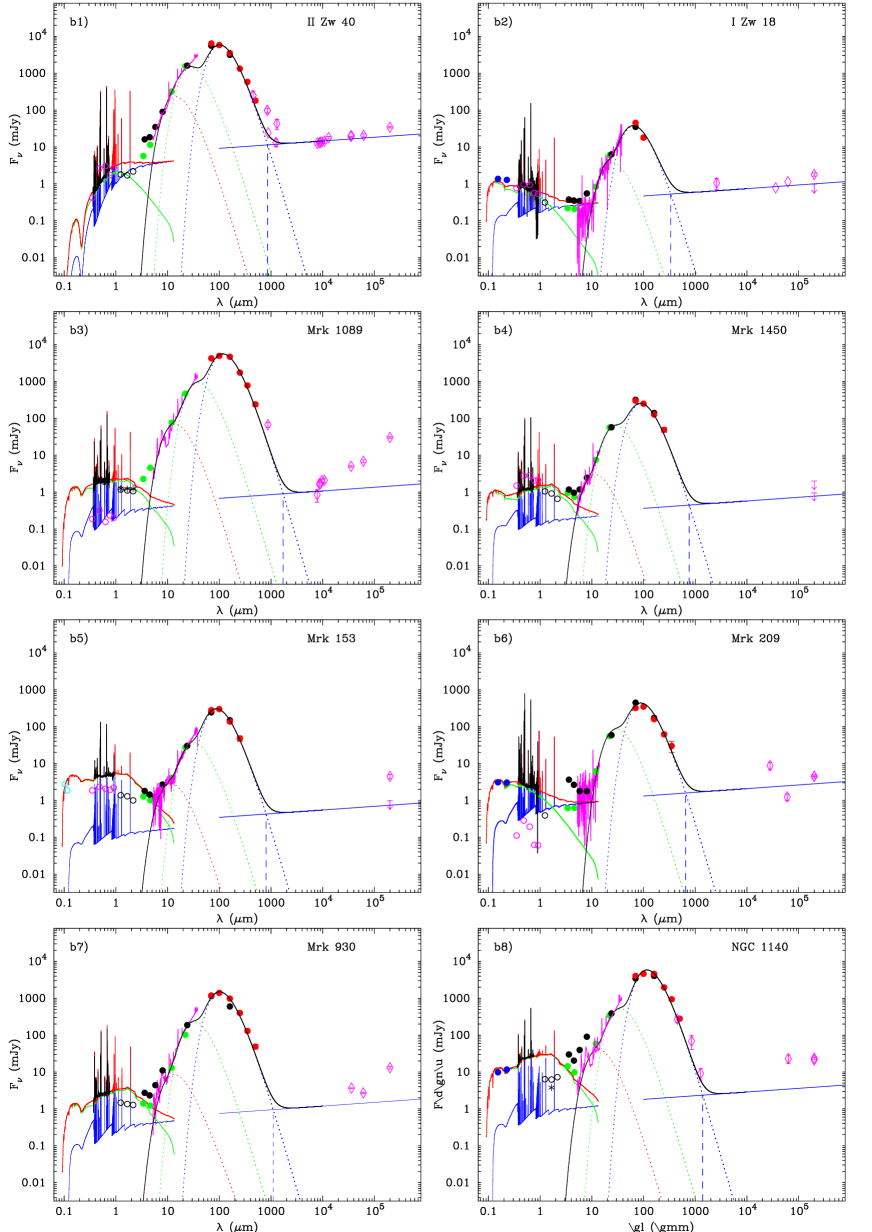
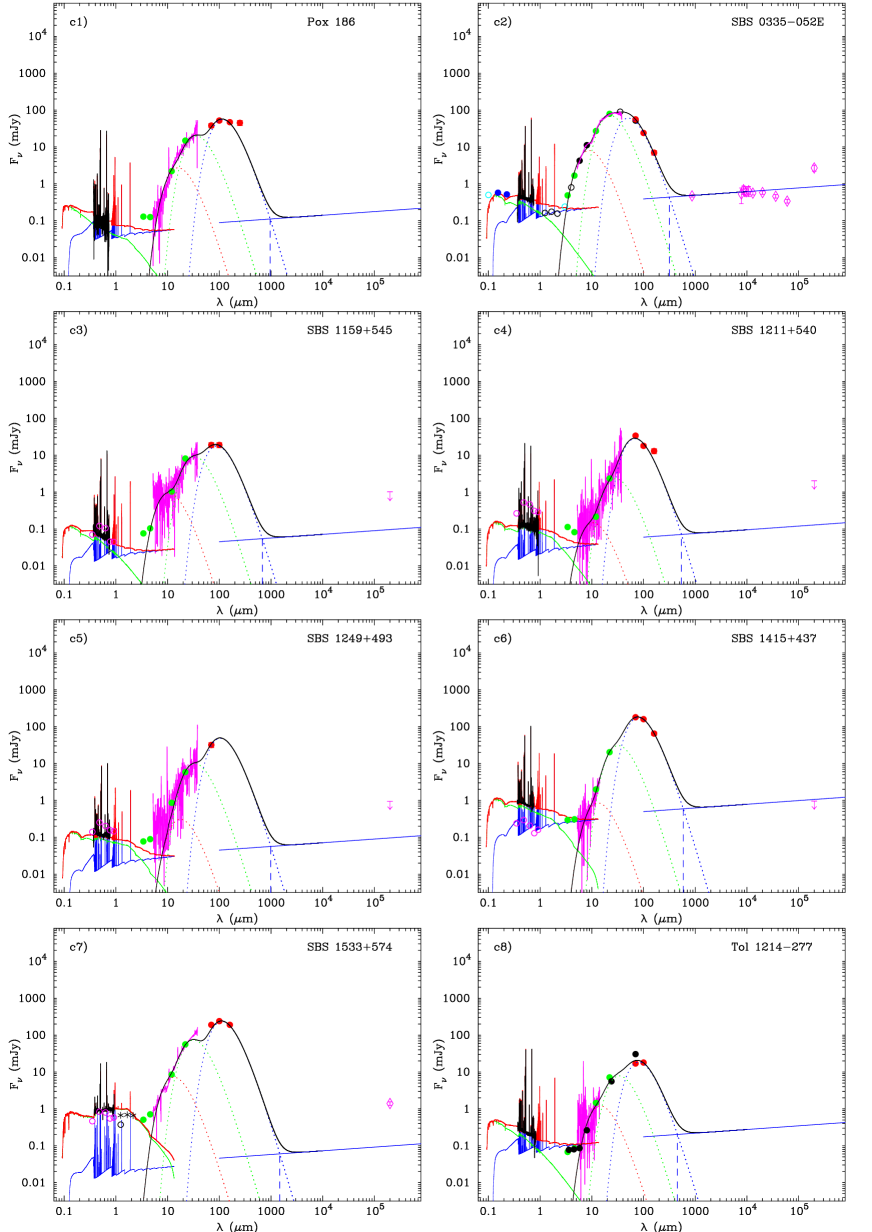
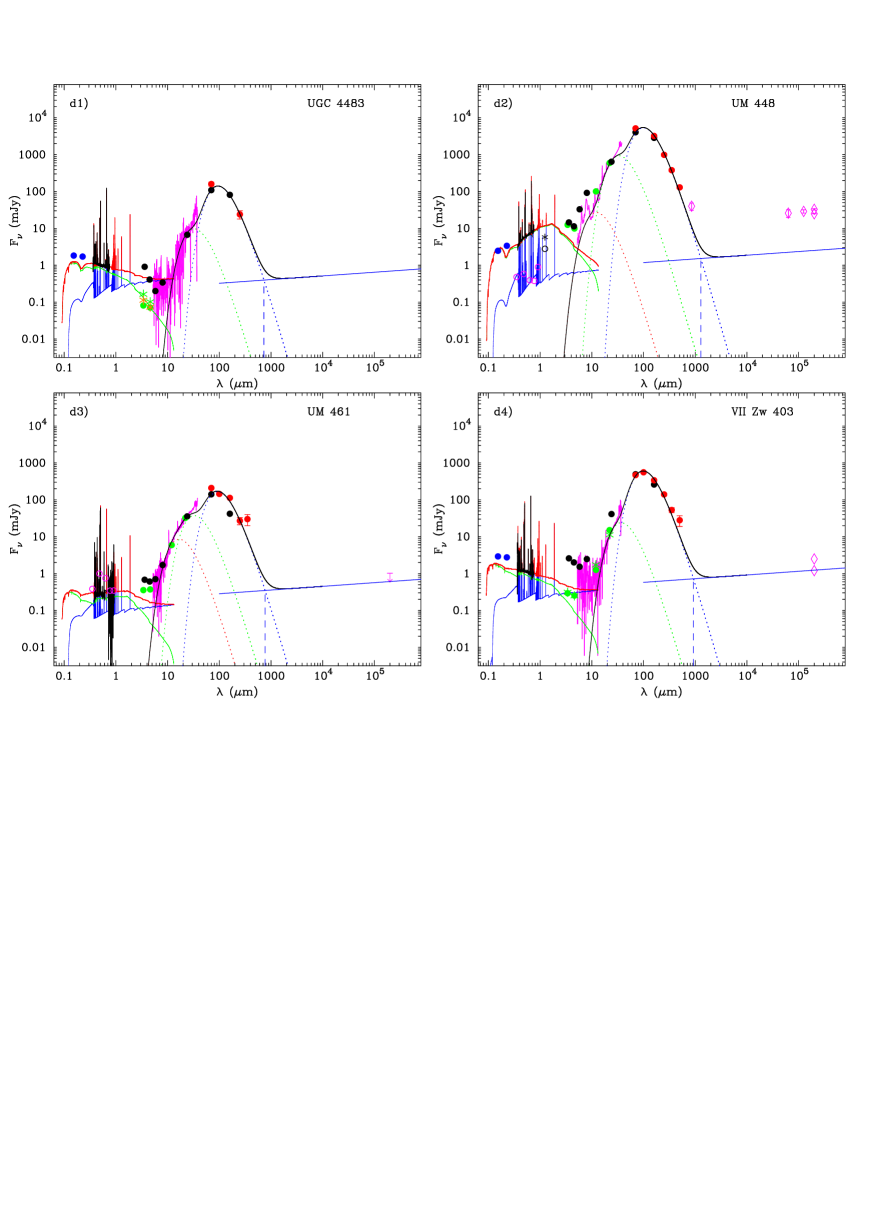
The SED fits of stellar and ionised gas emission at 15 m, of dust emission at 2 - 1000 m and of free-free emission at 100 m and the observed data are shown in Fig. 6. We note that modelled fluxes in this Figure are redshifted to observed wavelengths and reddened adopting the extinction coefficient (H), which is derived from optical spectra and the reddening law by Cardelli et al. (1989) with = 3.2 (cf. Sect. 3.1). This is done to make a comparison with observed fluxes.
First, the optical spectra were used to derive line intensities and equivalent widths of emission lines, physical conditions, redshifts and extinction. We produce spectral energy distributions, which are the sum of stellar SED and ionised gas SED. These fits were extrapolated to the UV and IR ranges and cover a wavelength range of 0.1 – 15 m. Observed fluxes in optical spectra prior to the fitting were corrected for aperture. The aperture correction for nine compact galaxies with SDSS spectra was done comparing the photometric magnitude of the galaxy with magnitude measured within the spectroscopic slit of 3″ in diameter. Typical aperture corrections for compact Herschel galaxies are of order 1.5 - 2.0. For other galaxies, we scale the observed spectra by comparing H or H line fluxes inside the slit with those derived from narrow-band imaging and from spectra, which were obtained with large apertures.
Second, the extinction- and aperture-corrected flux of the H emission line was used to calculate the SED of free-free emission in the sub-mm and radio ranges (at 100m in Fig. 6), according to Caplan & Deharveng (1986).
Third, we find that the three-component model with cold, warm, and hot dust is generally required to fit the SED in the mid- and far-infrared ranges. For this, Spitzer/IRS spectra with varying wavelength ranges, but typically at 5.5 – 35m, and available Herschel, Spitzer, and WISE photometric data, are shown by line and different symbols in Fig. 6. The two-component model without hot dust is sufficient only in six galaxies (HS 00522536, HS 0822+3542, I Zw 18, Mrk 209, UGC 4483, and VII Zw 403). The SED fits of individual dust components are shown for hot, warm, and cold dust, respectively. The total SED of dust emission is also shown, which additionally includes the free-free emission component at 100m. The wavelength at which dust emission and free-free emission are equal are also indicated. In all cases, a dust emissivity index of 2.0 is adopted.
4.2.2 Comparison with Rémy-Ruyer et al. (2013) results
| Dust parameters | 12+ | log | log | log | ||||||||
|---|---|---|---|---|---|---|---|---|---|---|---|---|
| Temperature (K) | log Mass () | log Luminosity () | logO/H | (H)a | ||||||||
| Object | cold | warm | cold | warm | cold | warm | () | () | () | |||
| Haro 11 | 34 | 104 | 6.54 | 3.73 | 10.74 | 10.82 | 8.36 | 9.37 | 9.45 | 10.51 | ||
| Haro 3 | 26 | 93 | 5.89 | 2.32 | 9.39 | 9.13 | 8.28 | 6.74 | 5.97 | 7.76 | ||
| HS 00171055 | 38 | 121 | 4.11 | 1.07 | 8.55 | 8.56 | 7.63 | 6.96 | 6.96 | 7.22 | ||
| HS 00522536 | 36 | 90 | 5.73 | 2.85 | 10.06 | 9.58 | 8.04 | 7.90 | 6.90 | 8.83 | ||
| HS 08223542 | 33 | 107 | 2.83 | 0.92 | 6.94 | 6.24 | 7.45 | 5.28 | 4.60 | 5.97 | ||
| HS 12223741 | 54 | 111 | 3.87 | 1.70 | 9.25 | 8.96 | 7.79 | 7.25 | 6.87 | 8.13 | ||
| HS 13043529 | 32 | 72 | 4.96 | 2.53 | 9.02 | 8.68 | 7.93 | 7.24 | 6.76 | 8.19 | ||
| HS 13303651 | 27 | 82 | 5.29 | 2.01 | 8.89 | 8.48 | 7.98 | 6.81 | 7.42 | 9.34 | ||
| I Zw 18 | 45 | 118 | 2.38 | 0.67 | 7.31 | 6.75 | 7.17 | 6.13 | 5.94 | 6.42 | ||
| II Zw 40 | 28 | 101 | 5.25 | 1.87 | 8.95 | 8.88 | 8.23 | 7.37 | 7.93 | 8.00 | ||
| Mrk 1089 | 25 | 77 | 6.84 | 3.56 | 10.23 | 9.88 | 8.10 | 7.93 | 8.02 | 8.89 | ||
| Mrk 1450 | 32 | 98 | 4.01 | 1.00 | 8.07 | 7.95 | 7.84 | 6.48 | 5.77 | 7.55 | ||
| Mrk 153 | 33 | 88 | 4.70 | 1.61 | 8.77 | 8.29 | 7.86 | 6.95 | 7.84 | 8.60 | ||
| Mrk 209 | 32 | 96 | 3.11 | 0.13 | 7.14 | 7.01 | 7.74 | 5.83 | 5.56 | 5.83 | ||
| Mrk 930 | 29 | 89 | 6.24 | 2.99 | 9.98 | 9.66 | 8.03 | 7.93 | 7.78 | 9.46 | ||
| NGC 1140 | 25 | 80 | 5.97 | 2.38 | 9.33 | 8.79 | 8.38 | 7.12 | 6.98 | 8.72 | ||
| Pox 186 | 25 | 80 | 3.85 | 0.89 | 7.24 | 7.29 | 7.70 | 5.65 | 4.98 | 6.33 | ||
| SBS 0335052E | 57 | 129 | 3.06 | 1.37 | 8.61 | 9.03 | 7.30 | 7.19 | 6.78 | 7.26 | ||
| SBS 1159545 | 33 | 88 | 3.78 | 1.34 | 7.85 | 7.99 | 7.44 | 6.35 | 5.76 | 5.77 | ||
| SBS 1211540 | 42 | 99 | 2.46 | 0.48 | 7.22 | 6.50 | 7.58 | 5.79 | 5.67 | 7.06 | ||
| SBS 1249493 | 28 | 87 | 5.10 | 1.97 | 8.79 | 8.60 | 7.68 | 6.90 | 6.53 | 7.41 | ||
| SBS 1415437 | 37 | 89 | 3.27 | 0.59 | 7.65 | 7.27 | 7.55 | 6.11 | 5.35 | 6.06 | ||
| SBS 1533574 | 26 | 91 | 5.34 | 2.11 | 8.83 | 8.87 | 8.05 | 6.70 | 6.30 | 8.08 | ||
| Tol 1214277 | 37 | 87 | 4.18 | 1.93 | 8.56 | 8.57 | 7.52 | 7.54 | 6.94 | 6.99 | ||
| UGC 4483 | 30 | 89 | 2.31 | 1.17 | 6.21 | 5.52 | 7.46 | 4.67 | 4.46 | 5.16 | ||
| UM 448 | 29 | 87 | 6.84 | 3.74 | 10.65 | 10.37 | 8.32 | 8.23 | 8.59 | 10.45 | ||
| UM 461 | 31 | 88 | 3.57 | 0.66 | 7.52 | 7.33 | 7.73 | 5.83 | 5.45 | 6.94 | ||
| VII Zw 403 | 29 | 78 | 3.33 | 0.20 | 7.12 | 6.15 | 7.66 | 5.22 | 4.83 | 5.98 | ||
aextinction-corrected.
In Fig. 6, we use fits to derive temperatures, luminosities, and masses of cold, warm, and hot dust components in 28 compact galaxies from the Herschel sample by Rémy-Ruyer et al. (2013).
Derived temperatures, luminosities, and masses of cold and warm dust components are shown in Table 2, and they can be compared to the properties of the cold dust derived by Rémy-Ruyer et al. (2013). We do not show parameters for the hot dust component, because the equilibrium conditions for this component may not be valid. Additionally, the Table shows oxygen abundances, extinction-corrected H luminosities, masses of the young stellar population and total stellar masses .
We note that Rémy-Ruyer et al. (2013) did not derive parameters of the cold dust in objects, which were not detected at 160m and longer wavelengths. This refers to seven galaxies, HS 0822+3542, HS 1222+3741, I Zw 18, SBS 1159+545, SBS 1249+493, Tol 1214277, and UGC 4483, out of the 28 galaxies from our sample. We also note, that we had to correct the luminosity of cold dust in SBS 0335052E, mistakenly given by Rémy-Ruyer et al. (2013) (their Table 4) upwards by a factor of 100.
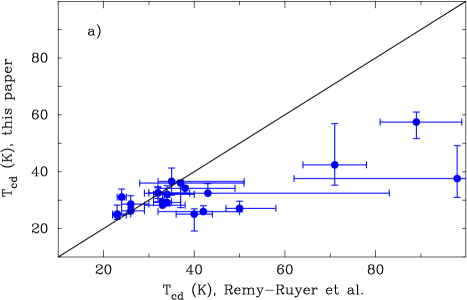
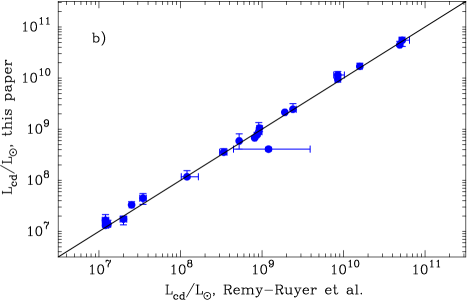
In Fig. 7a, we show a comparison between the cold dust temperatures in 21 galaxies, for which data are available in Rémy-Ruyer et al. (2013) with those in this paper. For most of the galaxies the agreement is good. However, there are some outliers. These are objects, for which Rémy-Ruyer et al. (2013) adopted 0.0. The most deviant object is HS 0017+1055. We derive = 38K, using a three-component dust model. Our fit reproduces all available WISE, Spitzer/IRS and Herschel observations of this galaxy well, and the derived is similar to that obtained for other galaxies (Table 2). Rémy-Ruyer et al. (2013) found = 98K, using a one-component dust model with = 0.0.
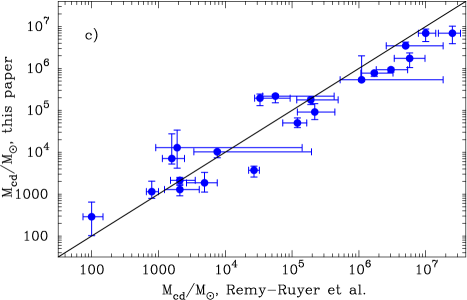
On the other hand, the luminosities of the cold dust are in good agreement (Fig. 7b). This is expected, because fits in both cases reproduce the observed FIR fluxes. Derived masses of cold dust differ to a larger extent (Fig. 7c), despite the overall agreement between Rémy-Ruyer et al. (2013) and our determinations.
4.2.3 Dust temperatures
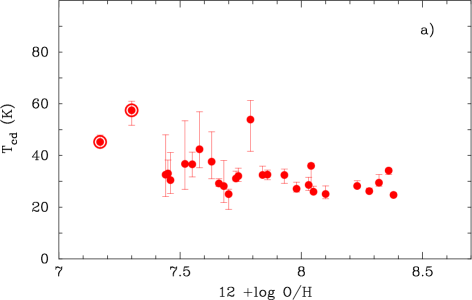
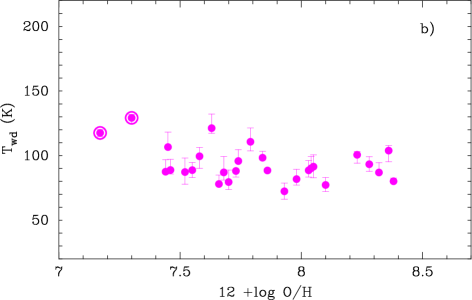
In Fig. 8, relations among the oxygen abundances 12 + logO/H and the temperatures of cold, and warm dust for galaxies from the Herschel sample are shown. Temperatures vary in the range of 25 K 57 K with the average value of 30K for the cold component and in the range of 72 K 129 K with the average value of 90K for the warm component. No obvious trends with metallicity are found, excluding the two most deviant and most metal-deficient BCDs, I Zw 18 and SBS 0335052E. This result confirms that found for the temperatures of warm dust in SDSS sample galaxies (Fig. 1). We note, however, that the average temperatures for the SDSS sample are higher, 120K for the warm component. The cause for this discrepancy remains unclear. However, the temperatures derived for the warm component in the Herschel sample are more robust, because SED fitting in these objects is controlled by the photometric data from WISE, Spitzer, and Herschel and by Spitzer/IRS spectra, while only WISE photometric data are available for the SDSS sample. We also cannot exclude imperfect correction of WISE fluxes for the contribution of the nebular emission lines, which was done with the use of Cloudy photoionised H ii region models.
4.2.4 Dust luminosities
Dependencies of cold and warm dust luminosities on the H luminosity (H) are shown in Fig. 9. The relation in Fig. 9a is almost as tight as that in Fig. 9b for only compact galaxies with Spitzer/IRS spectra. This suggests that likely the same sources heat the warm and cold dust in compact galaxies from the Herschel sample.
4.2.5 Dust masses
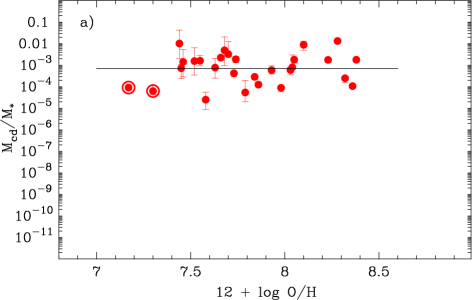
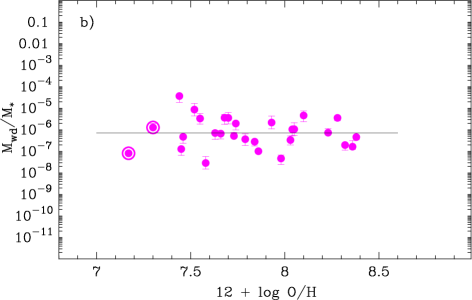
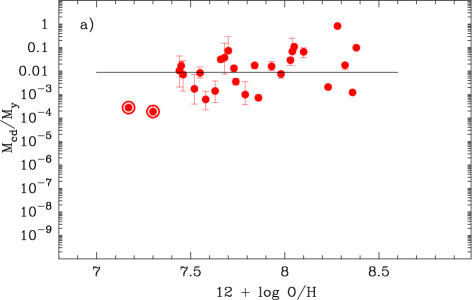
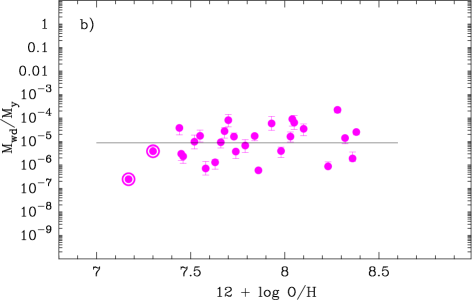
In Fig. 10, dust mass to total stellar mass ratios on oxygen abundance 12 + logO/H for cold and warm dust components are shown. No clear dependence is present. The two most-metal deficient galaxies, I Zw 18 and SBS 0335052E are among the galaxies of the Herschel sample with the lowest cold dust mass (Table 2). In Fig. 10a, they have low / mass ratios of 10-4, which are lower by a factor of 10 than the average value for the sample. This, however, does not deviate more than by 1 from other sample galaxies.
Deviations of I Zw 18 and SBS 0335052E are much larger in the / vs 12+logO/H diagram (Fig. 11a). This is presumably because of the low cold dust mass and high fraction of 30% of the young stellar population in the total mass, indicating that both galaxies are relatively unevolved and had no time to produce dust in large quantities. Although the old stellar population with age 1 Gyr is present in I Zw 18, its mass of 2106 (Annibali et al. 2013) is small compared to the H i mass of 108 (Lelli et al. 2012). There is no direct evidence for an old stellar population in SBS 0335052E. Pustilnik et al. (2004) inferred from the integrated light of SBS 0335052E that the stellar-to-total baryon mass fraction in this galaxy is 0.035.
Therefore, / in these galaxies is only by 3 times higher than / (Table 2). On the other hand, the young-to-total stellar mass ratio is much smaller in many other galaxies from the Herschel sample, elevating their dust-to-young stellar mass ratio, as compared to that in Fig. 10a. The difference between I Zw 18 and SBS 0335052E and other galaxies is lower for the warm dust component.
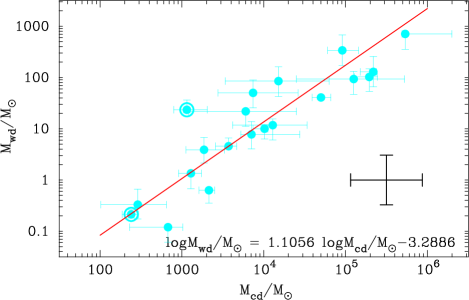
In Fig. 12, the relation is shown between the warm and cold dust masses. The presence of a correlation between cold and warm dust masses for the Herschel sample suggests that these components are linked to young stellar populations. This correlation with dispersion of 0.5 dex opens the opportunity for estimating the cold dust mass from the warm dust mass. The most outlying galaxy in Fig. 12 is SBS 0335052E with highest / ratio. Given the warm dust mass and using the relation in Fig. 12 would overestimate the cold dust mass by one order of magnitude for this galaxy. On the other hand, the relation in the Figure nicely reproduces the cold dust mass in I Zw 18.
Only a small fraction of the local star-forming galaxies with low metallicity was observed with Herschel (Rémy-Ruyer et al. 2013). On the other hand, there are many more compact star-forming galaxies that were detected with WISE (this paper, Izotov et al. 2011b, 2014). The relation in Fig. 12 allows us to estimate the cold dust mass in these galaxies with an uncertainty better than by a factor of three.
4.2.6 Dust-to-gas mass ratio
The dust-to-gas mass ratio is often considered as a measure of metallicity. In this respect it might be compared to the oxygen abundance 12 + logO/H measured in the ionised gas. One would expect that the dust-to-gas mass ratio and heavy element mass fraction in the ionised gas should be comparable if the galaxy ISM is well mixed.
However, there is some evidence that the neutral gas metallicity is much lower than that of the ionised gas. Thuan et al. (2002, 2005), Lebouteiller et al. (2004, 2013), Lecavelier des Etangs et al. (2004) using FUSE and the Cosmic Origin Spectrograph (COS) onboard HST showed that the oxygen-to-hydrogen abundance ratio in the neutral gas of low-metallicity BCDs is on average several times lower than that in H ii regions. It was even suggested in some papers that some fraction of pristine neutral gas might be present in these galaxies.
Based on IRAS observations, Lisenfeld & Ferrara (1998) found that the dust-to-gas mass ratio in dwarf irregulars and BCDs is steeply decreased with decreasing ionised gas metallicity. Later, Engelbracht et al. (2008) using Spitzer observations confirmed this result. A detailed study of the dust-to-gas mass ratio in the galaxies from the Herschel sample was done by Rémy-Ruyer et al. (2014). Based on the galaxies from Rémy-Ruyer et al. (2013), they compiled H i data and calculated the mass of the molecular hydrogen by using the CO-to-H2 conversion factor for galaxies with detected CO emission and by extrapolating the conversion factor for galaxies with low metallicity, where CO emission was not detected. Rémy-Ruyer et al. (2014) found that the dust-to-gas mass ratio is steeply decreased with decreasing metallicity, a result similar to that obtained by Lisenfeld & Ferrara (1998) and Engelbracht et al. (2008).
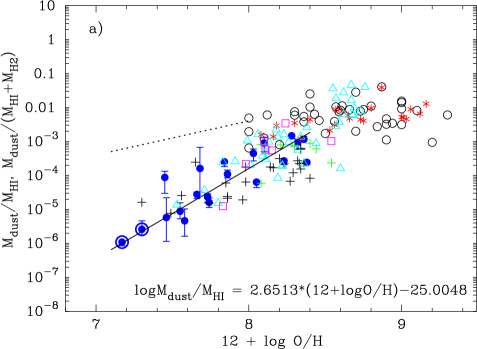
In Fig. 13a, we show the dust-to-gas mass - oxygen abundance diagram for the Herschel sample of compact galaxies together with data from the literature, which include both dwarf and giant galaxies. The mass of molecular hydrogen for three galaxies from the Herschel sample with detected CO emission (Haro 11, Mrk 1089, Mrk 930) was taken from Cormier et al. (2014) and added to the H i mass. The / ratios for Mrk 1089 and Mrk 930 are low, of 0.2 – 0.3. However, this ratio of 5 is much higher for Haro 11. For galaxies selected from the literature, we show the data in Fig. 13a, which include the H2 mass, whenever it was available. We do not use the extrapolation of the CO-to-H2 conversion factor to low metallicities to derive the H2 mass in galaxies from the Herschel sample with undetected CO emission because this procedure is highly uncertain.
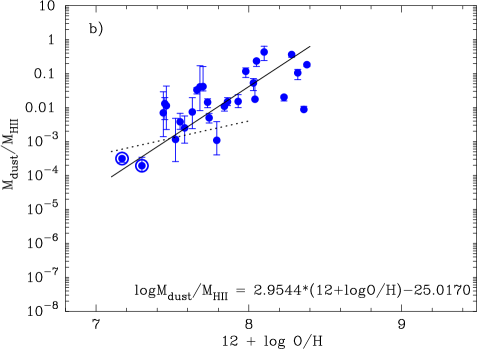
We confirm a sharp decrease of dust-to-gas mass ratios with decreasing metallicity at 12 + logO/H 8.5, while the ratio is almost constant in giant galaxies with higher metallicities. The Herschel data can be fit by a linear maximum-likelihood relation shown as a black solid line. We note the steep slope of 2.65, which is steeper than the linear extrapolation of the data for higher-metallicity galaxies by Draine et al. (2007) and the model predictions by Hirashita et al. (2002). We note that the dust-to-gas mass ratios in Fig. 13a are global characteristics of galaxies because they are derived from the total dust and gas masses.
The dotted line in Fig. 13a is the one-to-one line between the dust-to-gas mass ratio and the heavy-element mass fraction in the ionised gas. is derived from the relation
| (5) |
where / is the ratio by mass of all heavy elements to oxygen, which we adopt to be 2.5. O/H is the oxygen abundance by number derived from the H ii region’s optical spectrum.
This relation shows that the observed dust-to-gas mass ratio in dwarf galaxies is by a factor of 100 lower than the heavy element mass fraction in the dwarf’s H ii regions. Keeping in mind that the metallicity of the neutral gas in these galaxies can be lower by a factor of up to 10 than the heavy element mass fraction in H ii regions (e.g. Thuan et al. 2005), we conclude that the global dust-to-gas mass ratio in dwarf galaxies is 10 times lower than the neutral gas metallicity. From the two relations (Fig. 13a), we can derive the dust-to-metal mass ratio, which declines with decreasing metallicity. This is in line with the trends in dust-to-metal ratios (i.e. the mass fraction of metals in dust) found by De Cia et al. (2013) for low-metallicity gamma-ray burst (GRB) hosts and damped Ly- absorbers (DLAs).
The lowest global dust-to-gas mass ratios are derived for the two lowest-metallicity BCDs, I Zw 18 and SBS 0335052E, shown in Fig. 13a. They are in nice agreement with dust-to-gas mass ratios obtained for these galaxies by Rémy-Ruyer et al. (2014) and for some other most-metal poor galaxies with 12 + logO/H 7.6 (this paper, Lisenfeld & Ferrara 1998; Engelbracht et al. 2008). Hunt et al. (2014) derived a similar dust-to-gas mass ratio for I Zw 18, but at a value 5000 times higher for SBS 0335052E. The difference in the case of SBS 0335052E is in part due to that Hunt et al. (2014) derived a dust mass, which is a factor of 40 higher than the value in this paper (Table 2), the latter being consistent with Rémy-Ruyer et al. (2013). Furthermore, Hunt et al. (2014) assumed that the dust is located inside an 1″ aperture, which is much smaller than the larger aperture, of 10″ in radius, where Herschel fluxes were measured. We adopt a large aperture of 10″. Hunt et al. (2014) also used the H i mass inside 1″ aperture, while we use the total H i mass of 4.2108 for SBS 0335052E (Ekta et al. 2009). Furthermore, hydrogen in the central part of the galaxy within a 1″ aperture is mostly ionised, and its mass that adopts the electron number density of 100 cm-3 is by at least a factor of 10 larger than the mass of neutral gas within the same aperture. In these circumstances, ionised gas should be taken into account in the dust-to-gas mass ratio determination. On the other hand, the global dust-to-gas mass ratio is almost insensitive to the presence of ionised gas, because its total mass is much lower that the neutral gas mass.
In this respect, our dust-to-gas mass ratio for SBS 0335052E can be considered as a global characteristic of the galaxy, while that of Hunt et al. (2014) describes a local characteristic for the central part of the galaxy.
In Fig. 13b, we show the dust-to-ionised-gas mass ratio for our galaxies. The ionised gas mass is derived using relation
| (6) |
where is the proton mass, is the electron number density, (H) is the extinction-corrected total H luminosity, and is the H emissivity, as defined by equation (Aller 1984)
| (7) |
= 10-4.
It is seen in Fig. 13b that the dust-to-ionised-gas mass ratio is sharply increased with metallicity and generally is higher than the dotted line denoting a ratio of unity between / and . Only in the lowest-metallicity galaxies are they comparable. This suggests that although radiation by a young stellar population is the main source of dust heating, most of dust is located in the neutral gas, and the fraction of dust in the neutral gas is increased with increasing metallicity.
4.2.7 Sub-mm excess in star-forming dwarf galaxies
Rémy-Ruyer et al. (2013) extensively discussed the sub-mm excess at wavelengths 500 m, which is detected in a significant fraction of galaxies from the Herschel sample. They noted that this excess is more frequent in low-metallicity galaxies. In particular, they discuss two galaxies with this excess, Haro 11 and II Zw 40. Rémy-Ruyer et al. (2013) also detected the sub-mm excess in the galaxies HS 00522536 and VII Zw 403 from our Herschel sample. Furthermore, Rémy-Ruyer et al. (2013) analyse different mechanisms, which may cause this emission. All of them are related to dust emission.
On the other hand, the presence of cold dust in low-metallicity compact dwarf galaxies with active star formation and intense UV stellar radiation is difficult to understand. We suggest that the free-free emission may play a role in producing sub-mm excess in these galaxies with strong nebular continuum in the optical range and at longer wavelengths, as is indicated by a high equivalent width of the H emission line. It was noted in Sect. 4.2.1 that the fluxes of the free-free emission in sub-mm and radio ranges were calculated from the H emission line flux, according to Caplan & Deharveng (1986). We compare predicted and observed fluxes in the cm range where emission is dominated by free-free processes. For most objects from our Herschel sample, no data are available in this wavelength range. For the remaining galaxies, Haro 11 (Fig. 6-a1), II Zw 40 (Fig. 6-b1), I Zw 18 (Fig. 6-b2), Mrk 1089 (Fig. 6-b3), Mrk 209 (Fig. 6-b4), Mrk 930 (Fig. 6-b7), and SBS 0335052E (Fig. 6-c2), the agreement is good.
Depending on the galaxy properties, the contribution of free-free emission may be significant in the sub-mm or mm wavelength ranges (Fig. 6). We note that the role of free-free emission in producing sub-mm excess was discussed earlier by Galliano et al. (2003) and Galliano et al. (2005) for four high-metallicity star-forming galaxies, NGC 1569, II Zw 40, He 2-10, and NGC 1140. They concluded that free-free emission is insufficient to explain this excess and that emission of very cold dust is needed. However, we point out that Rémy-Ruyer et al. (2013) did not detect the excess in NGC 1140, while it is present with the Galliano et al. (2005) data. We also conclude from our SED fitting (Fig. 6-b8) that a sub-mm excess in this galaxy is not apparent.
We note that sub-mm and mm observations for II Zw 40 are controversial (Fig. 6-b1). Submillimetre array (SMA) observations at 880m (Hirashita 2011) and MRT observations at 1.25 mm (Albrecht et al. 2004) are in very nice agreement with our fit, while 850m SCUBA and 1.3mm MAMBO observations by Galliano et al. (2005) and Hunt et al. (2005a) are not. It is possible that differences in observed fluxes are due to the fact that II Zw 40 is located at low Galactic latitude with a high Milky Way extinction. This makes subtraction of bright foreground Galactic cirrus somewhat uncertain. We also note that 870m LABOCA observations by Galametz et al. (2009) are above the fit for Haro 11 (Figs. 6-a1). On the other hand, observed and predicted fluxes at 850m for another two galaxies, NGC 1140 (6-b8) and SBS 0335052E (6-c2) are in very good agreement and do not show evidence for a very cold dust.
In Fig. 6, blue vertical dashed lines indicate the wavelengths at which contributions of dust and free-free emission are equal. The most extreme cases are the most-metal deficient galaxies from the sample, I Zw 18 and SBS 0335052E, with 370m and 340m, respectively (Figs. 6-b2 and 6-c2). In particular, ALMA observations of SBS 0335052E clearly indicate that emission at 870m is almost totally dominated by free-free emission (Fig. 6-c2, Hunt et al. 2014). There is also a general tendency of lowering with decreasing oxygen abundance, 12 + logO/H. The wavelength for galaxies with 12 + logO/H 8.0 is commonly in the sub-mm range, while it is 1mm for higher metallicities (Fig. 6). This agrees with statistics of the sub-mm excess discussed by Rémy-Ruyer et al. (2013).
Regarding Haro 11 and II Zw 40, are 700m and 960m, respectively (Figs. 6-a1 and 6-b1). Therefore, a sub-mm excess in Haro 11 due to the free-free emission is expected at shorter wavelengths, and it is seen by Herschel at 500m, while it is not in II Zw 40.
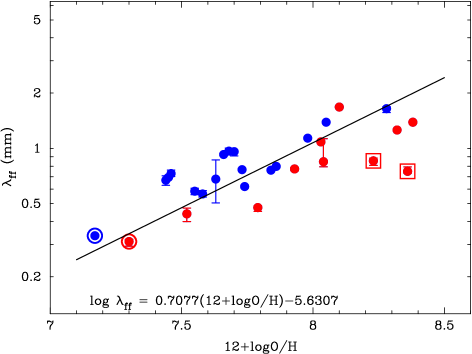
The dependence of on oxygen abundance for the entire Herschel sample is shown in Fig. 14. A clear increase of with increasing 12+logO/H is seen, implying that the sub-mm excess in low-metallicity galaxies may be due to the free-free emission from relatively transparent H ii regions, which are seen in the optical range. However, metallicity is not the only parameter determining , which is lower for galaxies with higher luminosity (H) of the H emission line (compare galaxies shown in Fig. 14). In particular, for the two most deviant high-metallicity galaxies Haro 11 and II Zw 40 with high (H) is also in the sub-mm range.
Unfortunately, there are no observational data in the sub-mm range for most of the galaxies shown in Fig. 6. Therefore, we cannot check the importance of free-free emission in producing sub-mm excess in these low-metallicity galaxies. At least, we can conclude that the wavelength, at which the contribution of free-free emission becomes important is progressively decreased with decreasing metallicity, which is consistent with measured statistics of the sub-mm excess (Rémy-Ruyer et al. 2013). Hopefully, forthcoming observations of these galaxies with ALMA will further clarify this issue.
4.3 The components of the SBS 0335052E SED in the infrared
Thuan et al. (1999a) were the first who noted the existence of highly obscured regions in SBS 0335052E based on ISO observations. More recently, Plante & Sauvage (2002) based on the same observations concluded that extinction in the obscured region is of order 30 mag and that most of the star formation in SBS 0335052E is hidden and is not seen even in the near-infrared range. Houck et al. (2004) discovered silicate absorption at 9.7 m in the Spitzer spectrum of SBS 0335052E, which is indicative of the presence of highly obscured regions. Finally, Hunt et al. (2014) modelled the IR SED using the DUSTY code with inclusion of obscured regions.
On the other hand, our fit of free-free emission from the observed H flux in SBS 0335052E is in excellent agreement with the observed fluxes in the sub-mm and radio ranges (Fig. 6-c2). There are many spectroscopic observations of SBS 0335052E with H flux measurements of (4 – 10)10-14 erg s-1cm-2. For the fit of free-free emission in Fig. 6-c2, we adopted the value of 1.0510-13 erg s-1cm-2 by Izotov et al. (2006b) for the entire galaxy. However, if, in SBS 0335052E, most of the star formation is hidden by a foreground absorbing layer as suggested by Plante & Sauvage (2002) then one would expect higher observed radio fluxes, as compared to those predicted from the observed H flux.
Furthermore, Izotov & Thuan (2011) predicted fluxes of nebular [S iv] 10.51m and [Ne iii] 15.55m emission lines from optical spectroscopic observations and Cloudy photoinised H ii region models, which are in good agreement with fluxes observed by Houck et al. (2004) in the Spitzer/IRS spectrum of SBS 0335052E. Finally, ALMA continuum observations at 870m (Hunt et al. 2014) and VLA continuum observations in the cm range (Johnson et al. 2009) do not reveal new spatially distinct star-forming regions in addition to those seen at shorter wavelengths.
Therefore, the origin of silicate absorption at 9.7m is puzzling as the observations imply that the contribution of obscured star-forming regions to FIR, sub-mm, and thermal radio emission should be lower than that of those star-forming regions, which are visible in the optical range.
According to Starburst99 models for instantaneous bursts (Leitherer et al. 1999), the H luminosity of visible star-forming regions in SBS 0335052E, (H) = 1.6107 corresponds to a luminosity of ionising radiation beyond the Lyman limit, 100 (H) = 1.6109 , and a total UV luminosity of 3.9109 . The -band extinction () of 0.3 mag for SBS 0335052E would correspond to (0.1m) 3() 0.9 mag meaning that more than half of the UV radiation is absorbed by dust. This seems to be sufficient to explain our derived of 1.7109 , which includes cold and warm dust components (Table 2).
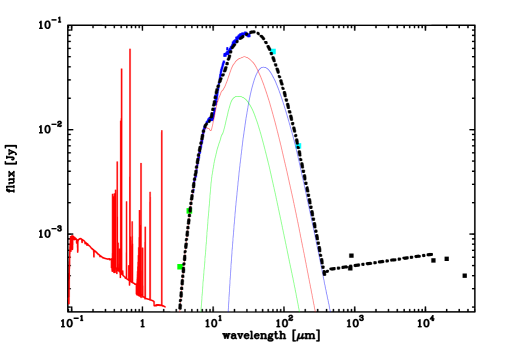
Figure15 shows the full spectrum of SBS 0335052E from the Lyman limit to centimeter radio wavelengths. Between mm, the radiation comes from dust. At shorter wavelengths, it is stellar and nebular emission including many lines; at longer wavelengths, it is free-free radiation. Because the radio continuum becomes opaque () at cm, this implies an emission measure EM pc cm-6 or an electron density of cm-3 over a length of 1 pc.
More than half of the total luminosity of the galaxy, , is emitted at optical wavelengths ( for m) and has not been attenuated by dust. The remaining luminosity, , has been processed by dust. If the galaxy is powered by O6 stars with having a luminosity , it will take of them to account for .
As one O6 star emits Lyman continuum photons per s, the output of all O6 stars amounts to photons s-1. If the fraction 22/39 leads to ionisation, one comes up with a number of ionising photons which agrees very well with the number derived from the optically thin radio emission, for example, at cm (Johnson et al. 2009).
By modelling the dust radiation from a source in a radiative transfer calculation for simple geometries, one can sometimes derive good estimates of the spatial distribution, mass, and temperature range of the dust. Here, however, the geometry is obviously much too complex, and we restrict ourselves to a decomposition of the infrared part of the SED into components and their semi-quantitative analysis. Therefore, most of the following numbers (where we use the correct emissivity and not the approximation ) are rough but indicative of the range of possible values.
In analysing the SED, we start by looking at its coldest component defined by the far infrared emission. The data points at 70 and 160m imply a colour temperature of about K in which the dust acquires at a distance of pc from a central source of luminosity . Of course, when and are fixed, the temperature depends on the size and mineralogy of the grain, but is a mean value for the grain’s standard size range (0.03 to 0.3m) and standard composition (silicate, amorphous carbon and graphite). The mass of this dust component is or 1.5 times higher than the mass derived adopting = 2 (Table 2), and it is located at the edge of or just outside the H ii region. If cold dust forms a shell of width around the powering star cluster and if is the density of dust per cm3, then the visual extinction optical depth through this shell is for an extinction coefficient at of cm2 per g of dust. This cool shell is therefore almost transparent to radiation from inside.
To explain the SED, one needs more warmer components. An important guide to their constraint plays the 9.7m silicate feature. It is claimed to be seen in absorption by Houck et al. (2004) with an optical depth . One way to produce it would be by a layer of such an optical depth that lies in front of a background source with an intrinsic, undiminished flux of 0.02 Jy at 9.7m. The foreground layer must be cooler than 150 K, or it would show the 9.7m resonance in emission. The background source itself, unless it is optically thick to stellar radiation, should for similar reasons be cooler than 150 K.
The visual extinction optical depth of the foreground layer is . If it were in front of the stellar superclusters it would strongly suppress their optical and UV emission which would then be intrinsically brighter by a factor than what is observed. That, however, is excluded because the IR part of the SED accounts for less than half of the total luminosity. The layer also cannot lie in front of the optically visible H ii region, which covers most or a considerable fraction of it, because its short wavelength emission is well detected and the extinction over it does not show much variation.
We, therefore, favour a configuration in which the near- and mid-IR emission come from one, or more likely, several optically hidden sources. Let there be of them with a luminosity with for each. For each, one has to do a radiative transfer calculation to compute their spectra. They can then be added independently to the optical and FIR fluxes. These dust hidden source(s) may be O star clusters, which are still dust enshrouded and at an earlier evolutionary stage than the visible super-star clusters. Although there must be some general trigger for the star burst in SBS 0335052E, one sees six separated clusters and their ignition is not likely to have occured simultaneously within a period much less than the lifetime of an O6 star.
The hidden sources of total luminosity may be anywhere within the field of view of the detector: within or outside the H ii region, in front of or behind it. It does not make much difference whether one imagines a few or a greater number of (spherical) hidden sources. They are in many ways quite similar: they are small ( pc), so that they would never noticably obscure the H ii region and have a visual optical depth . The model that enters Fig.15 has 40 such hidden sources, with each having a radius of 1 pc and a luminosity , representing a very dense cluster of about 100 O stars.
In Fig.15, the contribution from the hidden sources emitting in the infrared is given by the thin red curve peaking near 25 m. The cold component is also shown. To improve the fit, another warm component with K and a dust mass is shown. One would find a temperature of 160 K at a distance of 10 pc from an unobscured source of .
We mention that a satisfactory overall fit to the SED can, in principle, be achieved if silicate dust is absent, so that there is only carbon dust and no 10m feature. Then one does not need the hidden sources, and the dip near 10m would result from a crossover of two temperature components. However, the heavy elements in this galaxy come from exploding massive stars, and it is hard to avoid the creation of silicon and oxygen.
The existence of an additional very cold component (K) can never be excluded, but it sets limits on its maximum mass because the emission at 0.8 mm is clearly free-free radiation. For example, the mass of a 20K component, which would be about 3 kpc away from the galaxy center, could not be much more massive than .
5 Summary
We studied global characteristics of dust emission in a large sample of emission-line star-forming galaxies. The sample consists of two subsamples. One subsample includes 4000 compact star-forming galaxies from the SDSS, which were also detected in all four bands at 3.4m, 4.6m, 12m, and 22m of the WISE all-sky survey. The second subsample is a sample of 28 star-forming galaxies observed with Herschel in the FIR range (Rémy-Ruyer et al. 2013). For the second sample, we also use observations by WISE and Spitzer in the MIR range and various observations in sub-mm and radio ranges. Both SDSS and Herschel samples are supplemented by available data in the UV, optical, and NIR ranges.
For the SDSS sample, we use 12m and 22m WISE fluxes to determine temperatures, luminosites, and masses of warm dust. For the Herschel sample, we adopt a three component dust model to derive global parameters for cold, warm, and hot components. The parameters of cold and warm dust are compared with other global parameters, such as stellar masses and luminosities in the UV and optical ranges.
Our main results are as follows.
1. We derived temperatures, luminosities, and masses of the warm dust in SDSS compact star-forming galaxies, adopting a modified black-body distribution with a dust emissivity index =2.0. The average temperature of warm dust is 120K and does not depend on the galaxy metallicity. It is slightly larger for smaller . Warm dust luminosities are strongly correlated with H luminosities, implying that the main source of warm dust heating is radiation of star-forming regions that include ionising UV radiation, and, thus, warm dust is located inside and/or near H ii regions.
2. Warm dust masses in SDSS compact galaxies weakly depend on the total stellar masses, but they are much more tightly correlated with masses of young stellar populations. We find a strong decrease of warm-dust-to-young-stellar-population mass ratio with decreasing equivalent width EW(H) of the H emission line, implying that this ratio is higher in younger star-forming regions and that warm dust is mainly heated by ionising radiation of H ii regions. We also varied and found that warm dust masses would be higher by a factor of 2 with = 1.0, as compared to those with = 2.0.
3. We used WISE, Spitzer, and Herschel photometric data, as well as the optical and Spitzer/IRS spectra to derive global dust characteristics in 28 compact galaxies from the Herschel sample (Rémy-Ruyer et al. 2013) by adopting a three-component dust model and modified blackbody emissivity with the emissivity index = 2.0. The mean dust temperatures are 30K and 90K for the cold and warm components, respectively, with no clear dependence on metallicity. Since the emission of hot dust may not be in equilibrium, we do not analyse hot dust parameters because they may deliver erroneous results. There are two outliers, the two sources with lowest metallicity, SBS 0335052E and I Zw 18, which have higher cold dust temperatures. We find general agreement between the cold dust temperatures derived by Rémy-Ruyer et al. (2013) and in this paper.
4. Similarly to the SDSS sample, we find a tight relation between the warm dust and H luminosities for galaxies from the Herschel sample. Additionally, correlations are found between cold dust and H luminosities. All these relations suggest that the main source of dust heating in star-forming galaxies is UV radiation of young stellar populations.
5. The masses of the cold dust in the Herschel sample galaxies are in the range of 102 – 106 and on average they are by a factor of 103 higher than those of the warm dust. We found a tight correlation between masses of cold and warm dust, implying the same source of dust heating, UV radiation of star-forming regions. It is proposed to use the relation between warm and cold dust masses for estimations of the total dust mass in star-forming galaxies with an accuracy better than 0.5 dex. This can appreciably increase the number of star-forming galaxies with derived dust masses from several tens to several thousands, because the data in the mid-infrared range (e.g. WISE survey) used for the determination of the warm dust characteristics are numerous.
6. We find that dust-to-neutral gas and dust-to-metal mass ratios in Herschel star-forming galaxies strongly decline with decreasing metallicity, which is similar to results from other studies of local emission-line galaxies, high-redshift gamma-ray burst (GRB) hosts, and damped Ly absorbers (DLAs). On the other hand, the dust-to-ionised gas mass ratios are about one hundred times as high, indicating that most of dust is located in the neutral gas.
7. It is found that thermal free-free emission of ionised gas in star-forming galaxies is important in the sub-mm range and may cause the sub-mm excess, as discussed by Rémy-Ruyer et al. (2013). This effect is stronger in galaxies with lower metallicity and higher star-formation rate.
8. We showed that the optically thick foreground layer invoked by Plante & Sauvage (2002) and Hunt et al. (2014) to explain silicate dust absorption at 9.7 m in SBS 0335052E is in conflict with observations in the UV, optical, and radio ranges and results in much higher radio emission than that observed. We propose a model in which hidden star formation in SBS 0335052E resides in one or several dense and compact gas clouds, which are optically thick at 9.7 m. These hidden star clusters emit only in the infrared range and do not produce an emission excess in the radio range, leading to satisfactory agreement with all observational data.
Acknowledgements.
Y.I.I., N.G.G. and K.J.F. are grateful to the staff of the Max Planck Institute for Radioastronomy (MPIfR) for their warm hospitality. Y.I.I. and N.G.G. acknowledge financial support by the MPIfR. GALEX is a NASA mission managed by the Jet Propulsion Laboratory. This publication makes use of data products from the Two Micron All Sky Survey, which is a joint project of the University of Massachusetts and the Infrared Processing and Analysis Center/California Institute of Technology, funded by the National Aeronautics and Space Administration and the National Science Foundation. This publication makes use of data products from the Wide-field Infrared Survey Explorer, which is a joint project of the University of California, Los Angeles, and the Jet Propulsion Laboratory, California Institute of Technology, funded by the National Aeronautics and Space Administration. Funding for the Sloan Digital Sky Survey (SDSS) and SDSS-II has been provided by the Alfred P. Sloan Foundation, the Participating Institutions, the National Science Foundation, the U.S. Department of Energy, the National Aeronautics and Space Administration, the Japanese Monbukagakusho, and the Max Planck Society, and the Higher Education Funding Council for England. This research has made use of the NASA/IPAC Extragalactic Database (NED) which is operated by the Jet Propulsion Laboratory, California Institute of Technology, under contract with the National Aeronautics and Space Administration.References
- Abazajian et al. (2009) Abazajian, K. N., et al. 2009, ApJS, 182, 543
- Albrecht et al. (2004) Albrecht, M., Chini, R., Krügel, E., Muller, S. A. H., & Lemke, R. 2004, A&A, 414, 141
- Aller (1984) Aller, L. H. 1984, Physics of Thermal Gaseous Nebulae (Dordrecht: Reidel)
- Annibali et al. (2013) Annibali, F., et al. 2013, AJ, 146, 144
- Bicay et al. (1995) Bicay, M. D., Kojoian, G., Seal, J., Dickinson, D. F., & Malkan, M. A. 1995, ApJS, 98, 369
- Bourne et al. (2013) Bourne, N., et al. 2013, MNRAS, 436, 479
- Cannon et al. (2005) Cannon, J. M., Walter, F., Skillman, E. D., & van Zee, L. 2005, ApJ, 621, L21
- Cannon et al. (2006) Cannon, J. M., et al. 2006, ApJ, 647, 293
- Caplan & Deharveng (1986) Caplan, J., & Deharveng, L. 1986, A&A, 155, 297
- Cardamone et al. (2009) Cardamone, C., et al., 2009, MNRAS, 399, 1199
- Cardelli et al. (1989) Cardelli, J. A., Clayton, G. C., & Mathis, J. S. 1989, ApJ, 345, 245
- Chengalur et al. (2006) Chengalur, J. N., Pustilnik, S. A., Martin, J.-M., & Kniazev, A. Y. 2006, MNRAS, 371, 1849
- Chiaki et al. (2014) Chiaki, G., Schneider, R., Nozawa, T., Omukai, K., Limongi, M., Yoshida, N., & Chieffi, A. 2014, MNRAS, 439, 3121
- Condon et al. (1996) Condon, J. J., Helou, G., Sanders, D. B., & Soifer, B. T. 1996, ApJS, 103, 81
- Condon et al. (1998) Condon, J. J., Cotton, W. D., Greisen, E. W., Yin, Q. F., Perley, R. A., Taylor, G. B., & Broderick, J. J. 1998, AJ, 115, 1693
- Cormier et al. (2012) Cormier, D., et al., 2012, A&A, 548, A20
- Cormier et al. (2014) Cormier, D., et al., 2014, A&A, 564, A121
- Courtois et al. (2011) Courtois, H. M., Tully, R. B., Makarov, D. I., Mitronova, S., Koribalski, B., Karachentsev, I. D., & Fisher, J. R. 2011, MNRAS, 414, 2005
- Dale et al. (2009) Dale, D. A., Cohen, S. A., Johnson, L. C., et al. 2009, ApJ, 703, 517
- De Cia et al. (2013) De Cia, A., Ledoux, C., Savaglio, S., Schady, P., & Vreeswijk, P. M. 2013, A&A, 560, A88
- de Vaucouleurs et al. (1991) de Vaucouleurs, G., de Vaucouleurs, A., Corwin, Jr., H. G., et al. 1991, Third Reference Catalogue of Bright Galaxies (New York: Springer verlag)
- Dole et al. (2006) Dole, H., et al. 2006, A&A, 451, 417
- Draine (2003) Draine, B. T. 2003, ARA&A, 41, 241
- Draine et al. (2007) Draine, B. T., et al. 2007, ApJ, 663, 866
- Dressel & Condon (1978) Dressel, L. L., & Condon, J. J. 1978, ApJS, 36, 53
- Ekta et al. (2009) Ekta, B., Pustilnik, S. A., & Chengalur, J. N. 2009, MNRAS, 397, 963
- Elbaz et al. (2002) Elbaz, D., et al. 2002, A&A, 384, 848
- Engelbracht et al. (2005) Engelbracht, C. W., Gordon, K. D., Rieke, G. H., Werner, M. W., Dale, D. A., & Latter, W. B. 2005, ApJ, 628, L29
- Engelbracht et al. (2008) Engelbracht, C. W., Rieke, G. H., Gordon, K. D., Smith, J.-D. T., Werner, M. W., Moustakas, J., Willmer, C. N. A., & Vanzi, L. 2008, ApJ, 678, 804
- Ferland et al. (1998) Ferland, G. J., Korista, K. T., Verner, D. A., Ferguson, J. W., Kingdon, J. B., & Verner, E. M. 1998, PASP, 110, 761
- Ferland et al. (2013) Ferland, G. J., et al. 2013, Rev. Mexicana Astron. Astrofis.,49, 137
- Frayer et al. (2006) Frayer, D. T., et al. 2006, ApJ, 647, L9
- Galametz et al. (2009) Galametz, M., Madden, S. C., Galliano, F., et al. 2009, A&A, 508, 645
- Galametz et al. (2011) Galametz, M., Madden, S. C., Galliano, F., et al. 2011, A&A, 532, A56
- Galliano et al. (2003) Galliano, F., Madden, S. C., Jones, A. P., Wilson, C. D., Bernard, J.-P., & Le Peintre, F. 2003, A&A, 407, 159
- Galliano et al. (2005) Galliano, F., Madden, S. C., Jones, A. P., Wilson, C. D., & Bernard, J.-P. 2005, A&A, 434, 867
- Galliano et al. (2008) Galliano, F., Dwek, E., Chanial, P. 2008, ApJ, 672, 214
- Gil de Paz et al. (2003) Gil de Paz, A., Madore, B. F., & Pevunova, O. 2003, ApJS, 147, 29
- Griffith et al. (2011) Griffith, R. L., et al. 2011, ApJ, 736, L22
- Gruppioni et al. (2010) Gruppioni, C., et al. 2010, A&A, 518, L27
- Guseva et al. (2000) Guseva, N. G., Izotov, Y. I., & Thuan, T. X. 2000, ApJ, 531, 776
- Guseva et al. (2004) Guseva, N. G., Papaderos, P., Izotov, Y. I., Noeske, K. G., & Fricke, K. J. 2004, A&A, 421, 519
- Guseva et al. (2006) Guseva, N. G., Izotov, Y. I., & Thuan, T. X. 2006, ApJ, 644, 890
- Guseva et al. (2007) Guseva, N. G., Izotov, Y. I., Papaderos, P., & Fricke, K. J. 2007, A&A, 464, 885
- Guseva et al. (2011) Guseva, N. G., Izotov, Y. I., Stasińska, G., Fricke, K. J., Henkel, C., & Papaderos, P. 2011, A&A, 529, A149
- Guseva et al. (2012) Guseva, N. G., Izotov, Y. I., Fricke, K. J., & Henkel, C. 2012, A&A, 541, A115
- Gutiérrez & Beckman (2010) Gutiérrez, L., & Beckman, J. E. 2010, ApJ, 710, L44
- Hao et al. (2009) Hao, L., Wu, Y., Charmandaris, V., et al. 2009, ApJ, 704, 1159
- Hauser & Dwek (2001) Hauser, M. G., & Dwek, E. 2001, ARA&A, 39, 249
- Hirashita (2011) Hirashita, H. 2011, MNRAS, 418, 828
- Hirashita et al. (2002) Hirashita, H., Tajiri, Y. Y., & Kamaya, H. 2002, A&A, 388, 439
- Hirashita et al. (2008) Hirashita, H., Kaneda, H., Onaka, T., & Suzuki, T. 2008, PASJ, 60, S477
- Houck et al. (2004) Houck, J. R. et al. 2004, ApJS, 154, 211
- Huchtmeier & Richter (1989) Huchtmeier, W. K., & Richter, O.-G. 1989, A General Catalog of HI Observations of Galaxies, New York: Springer-Verlag
- Huchtmeier et al. (2005) Huchtmeier, W. K., Krishna, G., & Petrosian, A. 2005, A&A, 434, 887
- Hunt et al. (2005a) Hunt, L., Bianchi, S., & Maiolino, R. 2005a, A&A, 434, 849
- Hunt et al. (2005b) Hunt, L. K., Dyer, K. K., & Thuan, T. X. 2005, A&A, 436, 837
- Hunt et al. (2006) Hunt, L. K., Thuan, T. X., Sauvage, M., & Izotov, Y. I., M. 2006, ApJ, 653, 222
- Hunt et al. (2010) Hunt, L. K., Thuan, T. X., Izotov, Y. I., & Sauvage, M. 2010, ApJ, 712, 164
- Hunt et al. (2014) Hunt, L. K., Testi, L., Casasola, V., et al. 2014, A&A, 561, A49
- Hunter et al. (1994) Hunter, D. A., van Woerden, H., & Gallagher, J. S., III, 1994, ApJS, 91, 79
- Indebetouw et al. (2009) Indebetouw, R., et al. 2009, ApJ, 694, 84
- Indebetouw et al. (2013) Indebetouw, R., et al. 2013, ApJ, 774, 73
- Izotov & Thuan (1998) Izotov, Y. I., & Thuan, T. X. 1998, ApJ, 500, 188
- Izotov & Thuan (1999) Izotov, Y. I., & Thuan, T. X. 1999, ApJ, 511, 639
- Izotov & Thuan (2004) Izotov, Y. I., & Thuan, T. X. 2004, ApJ, 602, 200
- Izotov & Thuan (2007) Izotov, Y. I., & Thuan, T. X. 2007, ApJ, 665, 1115
- Izotov & Thuan (2011) Izotov, Y. I., & Thuan, T. X. 2011, ApJ, 734, 82
- Izotov et al. (1994) Izotov, Y. I., Thuan, T. X., & Lipovetsky, V. A. 1994, ApJ, 435, 647
- Izotov et al. (1997) Izotov, Y. I., Thuan, T. X., & Lipovetsky, V. A. 1997, ApJS, 108, 1
- Izotov et al. (2001) Izotov, Y. I., Chaffee, F. H., & Green, R. F. 2001, ApJ, 562, 727
- Izotov et al. (2006a) Izotov, Y. I., Stasińska, G., Meynet, G., Guseva, N. G., & Thuan, T. X. 2006a, A&A, 448, 955
- Izotov et al. (2006b) Izotov, Y. I., Schaerer, D., Blecha, A., Royer, F., Guseva, N. G., & North, P. 2006b, A&A, 459, 71
- Izotov et al. (2011a) Izotov, Y. I., Guseva, N. G., & Thuan, T. X. 2011a, ApJ, 728, 161
- Izotov et al. (2011b) Izotov, Y. I., Guseva, N. G., Fricke, K. J., & Henkel, C. 2011b, A&A, 536, L7
- Izotov et al. (2013) Izotov, Y. I., Stasińska, G., & Guseva, N. G. 2013, A&A, 558, A57
- Izotov et al. (2014) Izotov, Y. I., Guseva, N. G., Fricke, K. J., & Henkel, C. 2014, A&A, 561, A33
- James et al. (2002) James, A., Dunne, L., Eales, S., & Edmunds, M. G., MNRAS, 335, 753
- Johnson et al. (2009) Johnson, K. E., Hunt, L. K., & Reines, A. E. 2009, AJ, 137, 3788
- Karczewski et al. (2013) Karczewski, O. L., et al. 2013, MNRAS, 431, 2493
- Kepley et al. (2014) Kepley, A. A., Reines, A. E., Johnson, K. E., & Walker, L. M. 2014, AJ, 147, 43
- Kimball & Ivezić (2008) Kimball, A. E., & Ivezić, Z. 2008, AJ, 136, 684
- Kirkpatrick et al. (2013) Kirkpatrick, A., et al. 2013, ApJ, 778, 51
- Klein et al. (1991) Klein, U., Weiland, H., & Brinks, E. 1991, A&A, 246, 323
- Krügel (2008) Krügel, E. 2008, An introduction to the physics of interstellar dust. Publ. Taylor & Francis, Series in astronomy and astrophysics
- Lagos et al. (2007) Lagos, P., Telles, E., & Melnick, J. 2007, A&A, 476, 89
- Lebouteiller et al. (2004) Lebouteiller, V., Kunth, D., Lequeux, J., et al. 2004, A&A, 415, 55
- Lebouteiller et al. (2011) Lebouteiller, V., Barry, D. J., Spoon, H. W. W., Bernard-Salas, J., Sloan, G. C., Houck, J. R., & Weedman, D. W. 2011, ApJS, 196, 8
- Lebouteiller et al. (2013) Lebouteiller, V., Heap, S., Hubeny, I., & Kunth, D. 2013, A&A, 553, A16
- Lecavelier des Etangs et al. (2004) Lecavelier des Etangs, A., Désert, J.-M., Kunth, D., et al. 2004, A&A, 413, 131
- Leitherer et al. (1999) Leitherer, C., Schaerer, D., Goldader, J. D., et al. 1999, ApJS, 123, 3
- Lelli et al. (2012) Lelli, F., Verheijen, M., Fraternali, F., & Sancisi, R. 2012, A&A, 537, A72
- Leroy et al. (2005) Leroy, A., Bolatto, A. D., Simon, J. D., & Blitz, L. 2005, ApJ, 625, 763
- Leroy et al. (2007) Leroy, A., Cannon, J., Walter, F., Bolatto, A., & Weiss, A. 2007, ApJ, 663, 990
- Lisenfeld & Ferrara (1998) Lisenfeld, U. & Ferrara, A. 1998, ApJ, 496, 145
- Madden et al. (2006) Madden, S. C., Galliano, F., Jones, A. P., & Sauvage, M. 2006, A&A, 446, 877
- Madden et al. (2013) Madden, S. C., Remy-Ruyer, A., Galametz, M., et al. 2013, PASP, 125, 600
- Martin et al. (2005) Martin, D. C., Fanson, J., Schiminovich, J, et al. 2005, ApJ, 619, L1–L6
- Mauch et al. (2003) Mauch, T., Murphy, T., Buttery, H. J., Curran, J., Hunstead, R. W., Piestrzynski, B., Robertson, J. G., & Sadler, E. M. 2003, MNRAS, 342, 1117
- Morales-Luis et al. (2011) Morales-Luis, A. B., Sánchez Almeida, J., Aguerri, J. A. L., et al. 2011, ApJ, 743, 77
- Moustakas & Kennicutt (2006) Moustakas, J., & Kennicutt, R. C., Jr. 2006, ApJS, 164, 81
- Nozawa et al. (2003) Nozawa, T., Kozasa, T., Umeda, H., Maeda, K. Nomoto, K. 2003, ApJ, 598, 785
- O’Halloran et al. (2006) O’Halloran, B., Satyapal, S., & Dudik, R. P. 2006, ApJ, 641, 795
- O’Halloran et al. (2010) O’Halloran, B., et al. 2010, A&A, 518, L58
- Planck Collaboration (2013) Planck collaboration 2013, A&A, in press; preprint arXiv:1303.5075
- Plante & Sauvage (2002) Plante, S., & Sauvage, M. 2002, AJ, 124, 1995
- Pustilnik et al. (2002) Pustilnik, S. A., Martin, J.-M., Huchtmeier, W. K., Brosch, N., Lipovetsky, V. A., & Richter, G. M. 2002, A&A, 389, 405
- Pustilnik et al. (2004) Pustilnik, S. A., Pramskij, A. G., & Kniazev, A. Y. 2004, A&A, 425, 51
- Rabidoux et al. (2014) Rabidoux, K., Pisano, D. J., Kepley, A. A., Johnson, K. E., & Balser, D. S. 2014, ApJ, 780, 19
- Refsdal et al. (1967) Refsdal, S., Stabell, R., & de Lange, F. G., 1967, Mem. RAS, 71, 143
- Rémy-Ruyer et al. (2013) Rémy-Ruyer, A., Madden, S. C., Galliano, F., et al. 2013, A&A, 557, A95
- Rémy-Ruyer et al. (2014) Rémy-Ruyer, A., Madden, S. C., Galliano, F., et al. 2014, A&A, 563, A31
- Rosa-Gonzalez et al. (2007) Rosa-Gonzalez, D, Schmitt, H. R., Terlevich, E., & Terlevich, R. 2007, ApJ, 654, 226
- Sandstrom et al. (2010) Sandstrom, K. M., Bolatto, A. D., Draine, B. T., Bot, C., & Stanimirović, S. 2010, ApJ, 715, 701
- Schaerer & Vacca (1998) Schaerer, D., & Vacca, W. D. 1998, ApJ, 497, 618
- Schmitt et al. (2006) Schmitt, H. R., Calzetti, D., Armus, L., Giavalisco, M., Heckman, T. M., Kennicutt, R. C., Jr., Leitherer, C., & Meurer, G. R. 2006, ApJS, 164, 52
- Schneider et al. (2012) Schneider, R., Omukai, K., Limongi, M., et al. 2012, MNRAS, 423, L60
- Skrutskie et al. (2006) Skrutskie, M. F., et al. 2006, AJ, 131, 1163
- Springob et al. (2005) Springob, C. M., Haynes, M. P., Giovanelli, R., & Kent, B. R. 2005, ApJS, 160, 149
- Stasińska & Izotov (2003) Stasińska, G., & Izotov, Y. I. 2003, A&A, 397, 71
- Thuan & Martin (1981) Thuan, T. X., & Martin, G. E. 1981, ApJ, 247, 823
- Thuan et al. (1995) Thuan, T. X., Izotov, Y. I., & Lipovetsky, V. A. 1995, ApJ, 445, 108
- Thuan et al. (1999a) Thuan, T. X., Sauvage, M., & Madden, S. 1999a, ApJ, 516, 783
- Thuan et al. (1999b) Thuan, T. X., Lipovetsky, V. A., Martin, J.-M., & Pustilnik, S. A. 1999b, A&AS, 139, 1
- Thuan et al. (2002) Thuan, T. X., Lecavelier des Etangs, A., & Izotov, Y. I. 2002, ApJ, 565, 941
- Thuan et al. (2004) Thuan, T. X., Hibbard, J. E., & Levrier, F., 2004, AJ, 128, 617
- Thuan et al. (2005) Thuan, T. X., Lecavelier des Etangs, A., & Izotov, Y. I. 2005, ApJ, 621, 269
- Ugryumov et al. (2003) Ugryumov, A. V., Engels, D., Pustilnik, S. A., Kniazev, A. Y., Pramskij, A. G., & Hagen, H.-J. 2003, A&A, 397, 463
- Vacca & Conti (1992) Vacca, W. D., & Conti, P. S. 1992, ApJ, 401, 543
- Valiante et al. (2011) Valiante, R., Schneider, R. Salvadori, S., & Bianchi, S. 2011, MNRAS, 416, 1916
- Viallefond & Thuan (1983) Viallefond, F., & Thuan, T. X. 1983, ApJ, 269, 444
- Weingartner & Draine (2001) Weingartner, J. C., & Draine, B. T. 2001, ApJ, 548, 296
- Williams et al. (1991) Williams, B. A., McMahon, P. M., & van Gorkom, J. H. 1991, AJ, 101, 1957
- Wright et al. (2010) Wright, E. L., et al. 2010, AJ, 140, 1868
- Wu et al. (2006) Wu, Y., Charmandaris, V., Hao, L., et al. 2006, ApJ, 639, 157
- Wu et al. (2007) Wu, Y., Charmandaris, V., Hunt, L. K., et al. 2007, ApJ, 662, 952
- Wu et al. (2008) Wu, Y., Bernard-Salas, J., Charmandaris, V., et al. 2008, ApJ, 673, 193