Optical absorption of twisted bilayer graphene with interlayer potential asymmetry
Abstract
We investigate the band structure and the optical absorption spectrum of twisted bilayer graphenes with changing interlayer bias and Fermi energy simultaneously. We show that the interlayer bias lifts the degeneracy of the superlattice Dirac point, while the amount of the Dirac point shift is significantly suppressed in small rotation angles, and even becomes opposite to the applied bias. We calculate the optical absorption spectrum in various asymmetric potentials and Fermi energies, and associate the characteristic spectral features with the band structure. The spectroscopic features are highly sensitive to the interlayer bias and the Fermi energy, and widely tunable by the external field effect.
I Introduction
Twisted bilayer graphene (TBG) is a stacked and rotated two-layer graphene with an in-plane rotation angle other than the integer multiples of . Hass et al. (2007, 2008); Luican et al. (2011) With decreasing the rotation angle, the misorientation between two lattice periods produces a moiré interference pattern, of which the spatial period widely varies with the rotational alignment. Hermann (2012) Due to the band-folding by the long-period potential, TBG exhibits a peculiar band structure with a renormalized Fermi velocity and a reduced saddle point energy, which is distinctly different from monolayer graphene and also from regularly-stacked bilayer graphenes. Lopes dos Santos et al. (2007); Hass et al. (2008); Ni et al. (2008); Morell et al. (2010); Shallcross et al. (2010); Trambly de Laissardière et al. (2010); Bistritzer and MacDonald (2011a); Brihuega et al. (2012); Sato et al. (2012); Correa et al. (2014) In addition, the high-quality superlattice potential, which is inherent to the lattice-mismatched stacking of planar crystals, can offer a unique opportunity to investigate the self-similar energy spectrum of charged particles under the simultaneous influences of a periodic potential and a magnetic field. Moon and Koshino (2012); Moon and Koshino (2013a); Bistritzer and MacDonald (2011b); Wang et al. (2012); Dean et al. (2013); Hunt et al. (2013); Ponomarenko et al. (2013)
As a superlattice, the optical absorption peak of TBG systematically shift over a wide range of wavelength with the rotation angle, suggesting that this structure is a promising candidate for optoelectronic applications. Moon and Koshino (2013b); Wang et al. (2010); Stauber et al. (2013); Havener et al. (2013, 2014); Tabert and Nicol (2013); Liang et al. (2014) However, the effect of the interlayer bias (i.e., the electrostatic potential difference between layers) on the optical properties of TBGs has not yet been investigated. The interlayer bias has been widely used in the band structure engineering of multilayer graphene systems. McCann (2006); Castro et al. (2007); Koshino and McCann (2009); Mak et al. (2009); Zhang et al. (2009); Castro et al. (2010) For TBG, it is reported that the interlayer bias gives rise to some novel properties in the band structure, such as the additional renormalization of Fermi velocity and topologically protected helical modes. Xian et al. (2011); San-Jose and Prada (2013)
The purpose of this work is to reveal the band structure and the optical absorption spectrum of TBGs under interlayer bias and charge doping. The low-energy spectrum of TBG is composed of four Dirac cones originating from monolayer, and the Dirac point (electron-hole band touching point) are relatively shifted in energy by applying an interlayer bias. Lopes dos Santos et al. (2007); Xian et al. (2011); San-Jose and Prada (2013) As a rotation angle reduces, however, we find that the Dirac point shift is strongly suppressed and even becomes opposite to the case when the interlayer coupling was absent. In the angle below , the band structure is not simply regarded as the combination of Dirac cones any more, while the band touching at and always remains even in the interlayer bias, owing to the rotation symmetry. We calculate the optical absorption spectra of TBGs for various interlayer biases and Fermi energies, and associate the characteristic absorption peaks and steps with the specific properties in the band structure. We find these spectroscopic features strongly depend on the interlayer bias and the Fermi energy, and thus widely tunable by the external gate electric field.
This paper organizes as follows. Sec. II presents our theoretical methods utilizing a tight-binding Hamiltonian on explicit lattice models of TBGs. In Sec. III, we investigate the band structures of TBGs for various interlayer bias. And in Sec. IV, we discuss the characteristic optical absorption spectrum of TBGs while changing Fermi energy as well as interlayer bias. We conclude in Sec. V.
II Theoretical methods
II.1 Atomic structure
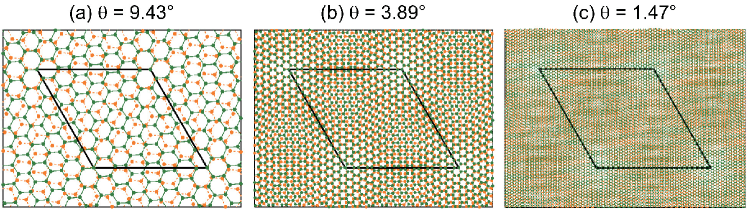
In the TBG, the lattice structures of two layers can be commensurate or incommensurate sensitively depending on the rotation angle. However, the basic physical property almost continuously evolves with the period of the moiré interference pattern which continuously varies with the rotation angle.Moon and Koshino (2013b) Here we consider three specific commensurate TBG’s , , and , which are illustrated in Fig. 1. The dashed (orange) and solid (green) lines represent the lattices of layers 1 and 2. Since the effects of the relative displacement between two layers on the band structure of TBG are almost negligible, Moon and Koshino (2013b) we only consider the structure where the two layers share the atomic position at the center of rotation.
II.2 Tight-binding model
In studying the optical properties of TBG, its lattice structures should be included explicitly into the model Hamiltonian to catch the hidden symmetry of the system correctly. Moon and Koshino (2013b) To calculate the eigenenergies and eigenfunctions of TBG, we used the single-orbit () tight-binding model, where the hopping integral between any of two carbon atoms at and are described by a conventional Slater-Koster formula with three parameters;
| (1) |
where , , , , the nearest intralayer coupling , the nearest interlayer coupling , and the decay length of the hopping integral . Trambly de Laissardière et al. (2010); Nakanishi and Ando (2001); Uryu (2004); Slater and Koster (1954) Here, nm is the distance of neighboring and sites on monolayer, and is the interlayer spacing. For TBGs, we consider the hopping within , while for monolayer, , and , we consider only the nearest neighbor hopping. The Hamiltonian is written as
| (2) |
where represents the atomic state at site , and local on-site energy to include an effect of layer-dependent electric potentials in the presence of transverse electric field. For TBG with separate top and bottom gate geometry, Nilsson et al. (2007) the system can be doped with different electric potential for each layer. We model such a situation with a rigid band approximation while varying .
II.3 Dynamical conductivity
We calculate the dynamical conductivity
| (3) |
from the eigenstate () obtained by the tight-binding model. Here, the sum is over all states, is the area of the system, is the Fermi distribution function, () represents the eigenenergy of the system, is the velocity operator, and is the phenomenological broadening which is set to in the following calculations. A finite broadening factor is necessary to avoid a singular behavior in the numerical calculation, and here we set it to a sufficiently small value to simulate the nearly ideal system. A different choice of will change the broadening width of the absorption spectra, are not much sensitive. Actual value of in the realistic situation depends on the quality of the sample and also on the experimental details. The transmission of light incident perpendicular to a two-dimensional system is given byAndo (1975)
| (4) |
III Band structures
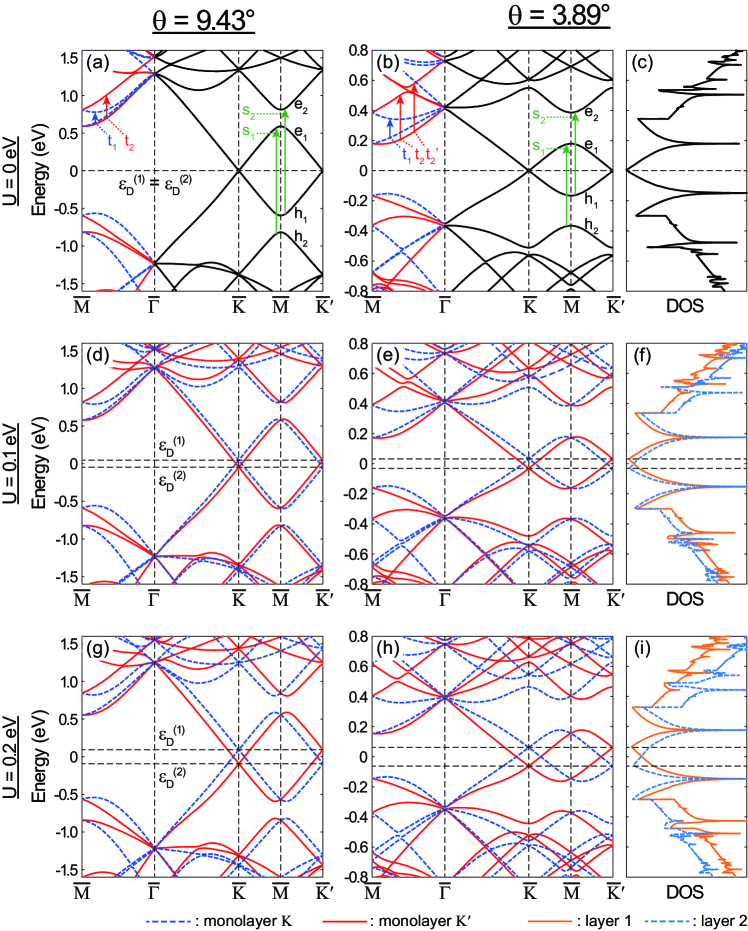
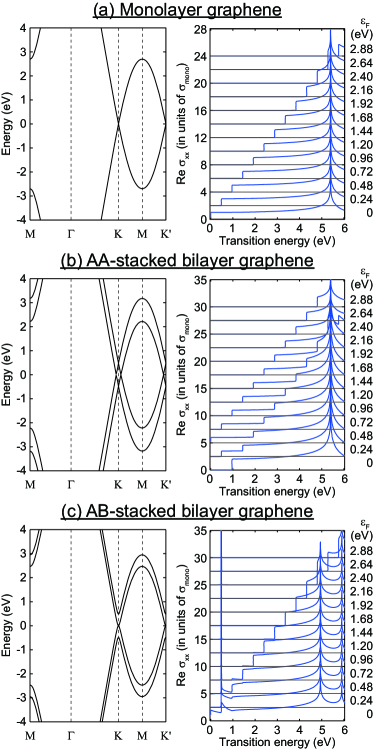
We calculate the band structure of TBG with the electrostatic potential and applied to the layer 1 and 2, respectively. Figure 2 shows the band structures of TBGs with and at 0.1, , and Fig. 3 shows similar plots for . We also plot the density of states (DOS) of in Fig. 2(c). In all the plots, the charge neutrality point is set to . Four valleys and of the layer are mapped to the two superlattice Dirac points and . Shallcross et al. (2010) In a low-energy regime, a Dirac cone in one layer strongly interacts with only one Dirac cone in another layer, since the other cones are too far separated to be mixed by the slowly varying potential of the superlattice. Thus, each energy band can be classified by the monolayer’s valley character, i.e., band from - and -points, and band from - and -points, Moon and Koshino (2013b) while it is folded in the common reduced Brillouin zone. We marked the bands with different colors in Figs. 2(a) and 2(b), according to their original valley characters and . These two bands are mirror symmetric to each other with respect to the lines of , , and . Moon and Koshino (2012) For comparison, we plot the band dispersion of monolayer graphene and two forms of regular bilayer graphene, and , at the left panels in Figs. 4(a), 4(b), and 4(c), respectively. Compared to the Dirac cones with offset in , and also to the massive dispersion in , TBG exhibits monolayerlike dispersion in the vicinity of the charge neutrality point. Lopes dos Santos et al. (2007); Hass et al. (2008)
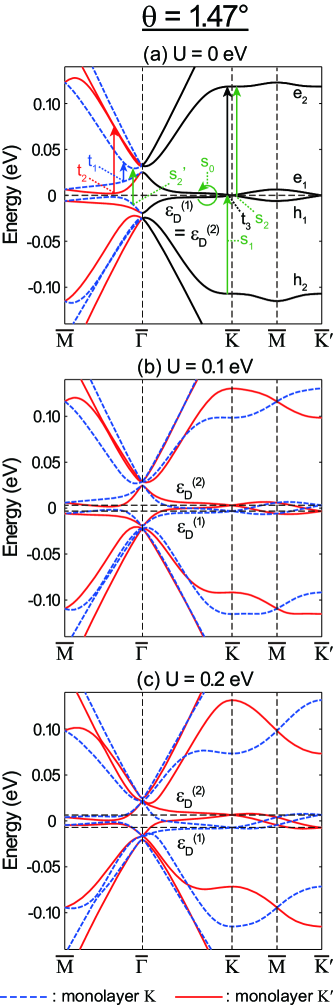
The low-energy band structure of TBG is composed of the Dirac cones originating from the two monolayer graphenes. Due to the band folding, the band widths of the lowest conduction band () and valence band () of TBG gradually decrease as the rotation angle reduces. Moon and Koshino (2012) As the angle is further reduced, the energy scale of the folded band becomes comparable to the interlayer coupling energy. In (Fig. 3), the renormalized band velocity is significantly reduced so that a flat band arises near the Dirac point. Lopes dos Santos et al. (2007); Trambly de Laissardière et al. (2010); Shallcross et al. (2010); Morell et al. (2010); Bistritzer and MacDonald (2011a)
When the interlayer bias is introduced, it lifts the degeneracy of the superlattice Dirac point. In large twist angles , the energy shift of the Dirac point approximates for layer , respectively, as if the two graphene layer were fully decoupled. Lopes dos Santos et al. (2007); Xian et al. (2011); San-Jose and Prada (2013) This is because in large , the interlayer coupling is so weak near zero energy that the Dirac cones of two layers remain almost independent. As the rotation angle decreases, however, the energy offset between the two Dirac points is suppressed. For and , TBG with shows and ( suppression), while TBG with shows and ( suppression), respectively. In small , the energy scale of the folded band becomes comparable to so that the interlayer band mixing becomes prominent near Dirac points. Thus, the wave function is distributed to both layers, and even at the Dirac point, the layer polarization of the carrier is weakened and the Dirac point shift is decreased. As further reduces, the shift of Dirac point changes its sign, as can be seen from the negative in Fig. 3(b)-(c).
Using the effective continuum model,Moon and Koshino (2013b) the amount of the shift can be approximately estimated as
| (5) |
with for layer , respectively, where eV is the interlayer coupling energy, Moon and Koshino (2013b) and is the length of the moiré reciprocal lattice vector. This is obtained by a few-mode approximation where only -points that directly couple to the Dirac point of layer 1 are taken into account in the effective continuum model. Moon and Koshino (2013b) The detail of the derivation is presented in Appendix. Equation (5) stands at large angle such that , and also the moderate bias . The analytic expression shows that the Dirac point shifts monotonically reduces as decreasing (i.e., decreasing ), and reaches zero at , or
| (6) |
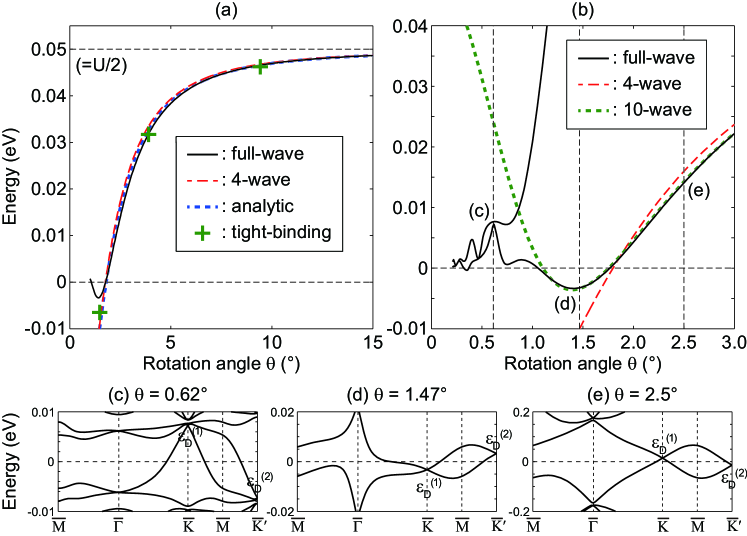
In Fig. 5(a), we plot for calculated by the full-wave effective continuum model, four-wave model [Eq. (9)], analytic model [Eq. (5)], and tight-binding method. The four models are almost perfectly consistent with each other at . We plot at small angle regime in Fig. 5(b). Figures 5(c), (d), and (e) show the band structures from the monolayer’s valley at , and , respectively, calculated by the effective continuum model. Equation (5) is no longer valid for these cases because the condition does not hold. In decreasing , the Dirac point drops below zero at , but again increases and goes to the positive region at . These features can be reproduced by considering additional six-waves to the four-wave model. As further reduces from , the higher energy bands begin to be mixed to the lowest band, and the energy band is no longer described by the single Dirac cone [Fig. 5(c)]. There the Dirac point energy exhibits a complex oscillatory behavior.
It is somewhat surprising to see that the Dirac points are never gapped even in the presence of the interlayer coupling and the interlayer asymmetric potential. Generally, it is known that the coexistence of the time reversal symmetry and the spatial inversion symmetry requires vanishing of the Berry curvature at any non-degenerate points in the energy band, Haldane (2004); Fu and Kane (2007) and this guarantees the robustness of band touching points in two-dimensional systems. Koshino (2013) In a similar manner, we can show that the coexistence of the time reversal symmetry and the in-plane (180∘) rotation symmetry (instead of the inversion symmetry) also concludes the same Dirac point protection in two dimensions, because the degree of freedom in -direction does not change the argument. The lattice structure of TBG lacks the inversion symmetry but possesses the symmetry,Moon and Koshino (2012) and moreover, symmetry holds even in the presence of the interlayer potential asymmetry because does not flip the layers. This is the origin of the Dirac point protection in the asymmetric TBG. In contrast, -stacked bilayer graphene has the inversion symmetry but lacks the symmetry, and thus the band touching is lifted by the interlayer potential difference. McCann and Fal’ko (2006)
The interlayer band mixing also influences the layer-wise DOS of the biased TBG. In Figs. 2(f) and 2(i), we plot the DOS for layer 1 and 2 by solid (orange) and dashed (blue) lines, respectively. In a fully decoupled bilayer, the DOS of the layer should vanish at . Due to the interlayer interaction, however, the layer-wise DOS of the biased TBG does not completely vanishes at the Dirac point of each layer. The minimum of the layer-wise DOS at each layer’s Dirac point becomes substantial as the rotation angle reduces or increases.
IV Optical spectrum
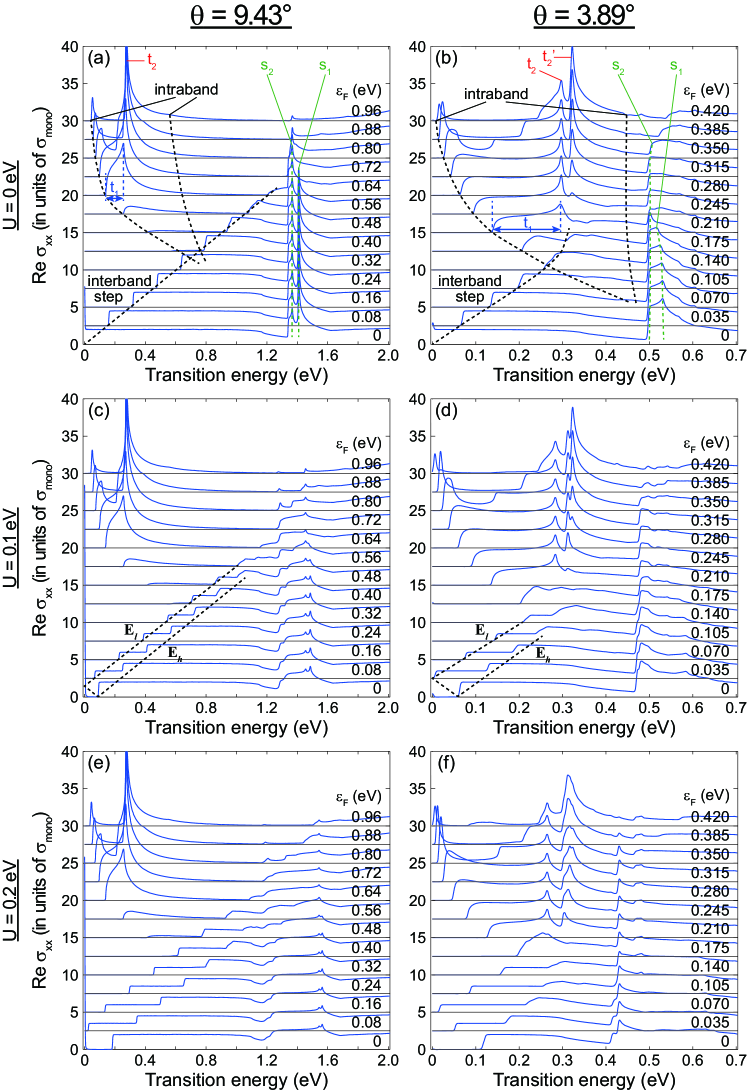
We calculated the optical conductivities of the TBGs for various Fermi energies and interlayer asymmetry . We plot the optical absorption spectra of TBGs with for different interlayer bias of , , and in Figs. 6(a), 6(c), and 6(e), respectively. Similar figures for are presented in Figs. 6(b), 6(d), and 6(f). For comparison, we plot the absorption spectra of monolayer graphene and regular bilayer graphenes (-stack and -stack) at the right panels in Figs. 4(a), 4(b), and 4(c), respectively. When Fermi energy lies at the charge neutrality point (), the low-energy optical spectrum of monolayer graphene exhibits universal dynamical conductivity
| (7) |
due to the linear dispersion of the band. Nair et al. (2008); Ando et al. (2002); Gusynin and Sharapov (2006); Gusynin et al. (2006) Here and are the spin and valley (, ) degeneracy, respectively. Meanwhile, -stacked bilayer at shows interband absorption step at , since Dirac points are located away from charge neutrality point. Xu et al. (2010); Tabert and Nicol (2012) -stacked bilayer at exhibits absorption edge at which reflects the interband transition from the low-energy band to the split band. Abergel and Fal’ko (2007); Koshino and Ando (2009); Zhang et al. (2008); Kuzmenko et al. (2009); Li et al. (2009)
The optical spectrum of TBG is characterized by several unique features described below.
(i) Interband transition peaks associated with saddle points. In each panel, we see a characteristic peak near at and at . They arise from the interband transitions between the saddle point of the lowest band ( and ) and the band edge of the second band ( and ), which are marked as () and () in Figs. 2(a) and 2(b). Moon and Koshino (2013b) Here note that the direct transition between the saddle points () is forbidden by the selection rule. Moon and Koshino (2013b) When is increased to the saddle point, one of the two interband peaks () disappears since the transition to the occupied band is no longer possible. In increasing , on the other hand, we see the interband transition peaks become broad and the intensity gets significantly reduced. This is because, in the presence of , the saddle point () and the band edge () shift in the opposite directions as we can see from Fig. 2, and this strongly affects the joint density of states associated with the transition and .
(ii) Interband absorption step. In the symmetric TBG at charge neutral (), the optical conductivity is close to in the low frequencies. As the Fermi energy deviates from 0, however, we have a discrete step below which the absorption is absent, Tabert and Nicol (2013) because the filled electrons forbid the corresponding excitations. The feature is analogous to monolayer graphene [Fig. 4(a)], as it reflects the charging of Dirac cone. The step linearly shifts to higher energies until it vanishes when reaches the saddle point, where the linear dispersion is lost.
In the presence of the asymmetric potential , the interband absorption step splits into two different energies
| (8) |
due to the relative shift of Dirac point energies and . The step positions and linearly depend on as expected from Eq. (5). We see similar absorption steps in -stacked bilayer [Fig. 4(b)], Tabert and Nicol (2012) where the Dirac points are originally split at by the interlayer coupling energy . These steps can be moved by the interlayer asymmetry , while the shift is just proportional to unlike in TBG.
(iii) Intraband absorption peaks. In the absorption spectrum of charge-doped TBGs (), we see a series of peaks centered at , which are clearly distinct from those arising from saddle point interband transitions [(i)]. Those peaks reflect the intraband transition , which is indicated more specifically as and in Figs. 2(a) and 2(b). We see that the two energy bands associated with are almost parallel between and , where the transition energy is nearly equal to . This actually causes a sharp absorption peak near . On the contrary, the transition energy for significantly depends on wavevector , giving a broad absorption peak. In , the intraband peak splits into the two peaks at and , reflecting the band anticrossing near the mid-point between and . When the Fermi energy is increased above the saddle point and the second conduction band becomes partially filled, a region with no-absorption appears in the broad peak, since the transition to the occupied band becomes forbidden. In increasing the interlayer asymmetry , we see that the structure of the intraband transition peak is not considerably changed, in contrast to the significant broadening of the interband transition peaks (i). This is consistent with the fact that the energy dispersion associated the transitions and are not strongly modified by as we see in Fig. 2.
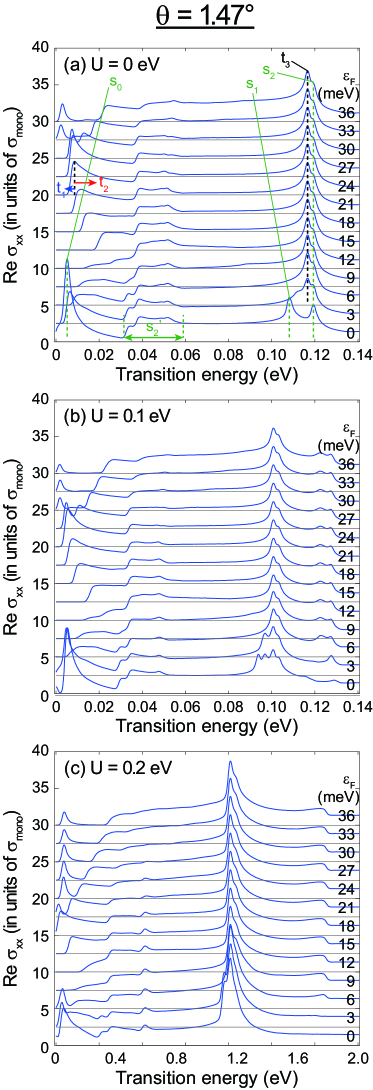
The optical spectrum of TBG with is quite different from those of due to the significant distortion of the band structure. We plot the optical absorption spectrum of TBG with for different interlayer bias of , , and in Figs. 7(a), 7(b), and 7(c), respectively. The low-energy spectrum of TBG with at is characterized by a unique absorption peak near , which is indicated as in Fig. 3(a). It is the transition between the flat bands that gives a strong absorption peak. The peak suddenly disappears as deviates from charge neutrality point since the band width of is very narrow. We can also see two characteristic peaks at high-energy spectrum, which arise from the transitions and in Fig. 3(a). In TBGs with and , the interband transition peaks (i) occur at where the band edge of the second band ( and ) resides there [Figs. 2(a) and 2(b)]. In TBG with , however, the peaks occur near and , at which the saddle points of the second band reside [Fig. 3(a)]. Likewise with the peak from , also vanishes as deviates from charge neutrality point. However, at that , a new peak from the intraband transition in Figs. 3(a) and 7(a) is activated at the energy close to . In increasing the interlayer asymmetry , each peak splits into two by the degeneracy lift of the bands (Fig. 3). In increasing , the lower-energy peak gradually redshift and their intensities are significantly enhanced. The spectrum at around originates from the transition near [ in Fig. 3(a)]. The corresponding transitions in TBGs with and have the energy higher than and , but in , it has much smaller energy than and due to the band folding. In the low-energy spectrum of charge-doped TBGs (), we see a series of peaks that come from the intraband transitions and in Fig. 3(a).
V Conclusion
We investigated the band structure and the optical absorption spectrum of TBGs with varying interlayer bias and Fermi energies theoretically. We showed that the interlayer bias lifts the degeneracy of the superlattice Dirac point, while the shift of the Dirac point is significantly suppressed as the interlayer rotation angle reduces. The low-energy band structure including the Dirac point shift was analytically described by the effective continuum model. We calculated the optical absorption spectrum and associate the characteristic spectral features with the band structure. The spectrum consists of the interband and intraband transition peaks as well as the interband absorption steps, where the peak (step) positions and amplitudes are highly sensitive to the interlayer bias and the Fermi energy. Meanwhile, we showed that both the band structure and optical spectrum of TBG with quite different from those of , due to the strong band distortion caused by interlayer coupling at the low-energy regime. Our calculation results as well as analysis can clarify optical spectrum of TBGs in actual experimental setups such as TBGs on top of different layered materials or the systems in field effect transistor geometries.
ACKNOWLEDGEMENTS
P. M. was supported by New York University Shanghai (research funds) and East China Normal University (research facilities). Y.-W. S. was supported by the NRF of Korea grant funded by the MSIP (CASE, 2011-0031640 and QMMRC, NO. R11-2008-053-01002-0). M. K. is funded by JSPS Grant-in-Aid for Scientific Research No. 24740193, No. 25107005. Computations were supported by the CAC of KIAS.
Appendix A Derivation of the Dirac point shift
Here we derive an approximate analytic expression Eq. (5) for the energy shift of the Dirac points in the TBG under a asymmetric potential. We adopt the effective continuum model, Moon and Koshino (2013b) and construct the Hamiltonian only taking account of the -points that directly couple to the Dirac point of layer 1, ( for monolayer’s and , respectively). In the effective model, the monolayer state of the layer 1 at couples to the state of the layer 2 at , , and , where and are moiré reciprocal vectors, by the Fourier component of the moiré superlattice potential. The reduced Hamiltonian of the four-wave approximation becomes
| (9) |
with
| (10) |
where is the Dirac point of the layer , is the Pauli matrices, represents the in-plane Fourier component of the interlayer transfer integral, and . For a moderate bias such that , where , the secular equation at is reduced to
| (11) |
Assuming also for a moderate bias, the Eq. (11) finally gives an analytic expression Eq. (5).
References
- Hass et al. (2007) J. Hass, R. Feng, J. Millan-Otoya, X. Li, M. Sprinkle, P. First, W. De Heer, E. Conrad, and C. Berger, Phys. Rev. B 75, 214109 (2007).
- Hass et al. (2008) J. Hass, F. Varchon, J. Millan-Otoya, M. Sprinkle, N. Sharma, W. de Heer, C. Berger, P. First, L. Magaud, and E. Conrad, Phys. Rev. Lett. 100, 125504 (2008).
- Luican et al. (2011) A. Luican, G. Li, A. Reina, J. Kong, R. Nair, K. Novoselov, A. Geim, and E. Andrei, Phys. Rev. Lett. 106, 126802 (2011).
- Hermann (2012) K. Hermann, J. Phys.: Condens. Matter 24, 314210 (2012).
- Lopes dos Santos et al. (2007) J. Lopes dos Santos, N. Peres, and A. Castro Neto, Phys. Rev. Lett. 99, 256802 (2007).
- Ni et al. (2008) Z. Ni, Y. Wang, T. Yu, Y. You, and Z. Shen, Phys. Rev. B 77, 235403 (2008).
- Morell et al. (2010) E. Morell, J. Correa, P. Vargas, M. Pacheco, and Z. Barticevic, Phys. Rev. B 82, 121407 (2010).
- Shallcross et al. (2010) S. Shallcross, S. Sharma, E. Kandelaki, and O. Pankratov, Phys. Rev. B 81, 165105 (2010).
- Trambly de Laissardière et al. (2010) G. Trambly de Laissardière, D. Mayou, and L. Magaud, Nano Lett. 10, 804 (2010).
- Bistritzer and MacDonald (2011a) R. Bistritzer and A. MacDonald, Proc. Natl. Acad. Sci. 108, 12233 (2011a).
- Brihuega et al. (2012) I. Brihuega, P. Mallet, H. González-Herrero, G. Trambly de Laissardière, M. Ugeda, L. Magaud, J. Gómez-Rodríguez, F. Ynduráin, and J.-Y. Veuillen, Phys. Rev. Lett. 109, 196802 (2012).
- Sato et al. (2012) K. Sato, R. Saito, C. Cong, T. Yu, and M. S. Dresselhaus, Phys. Rev. B 86, 125414 (2012).
- Correa et al. (2014) J. D. Correa, M. Pacheco, and E. S. Morell, J. Mat. Sci. 49, 642 (2014).
- Moon and Koshino (2012) P. Moon and M. Koshino, Phys. Rev. B 85, 195458 (2012).
- Moon and Koshino (2013a) P. Moon and M. Koshino, Phys. Rev. B 88, 241412 (2013a).
- Bistritzer and MacDonald (2011b) R. Bistritzer and A. MacDonald, Phys. Rev. B 84, 035440 (2011b).
- Wang et al. (2012) Z. Wang, F. Liu, and M. Chou, Nano Lett. 12, 3833 (2012).
- Dean et al. (2013) C. Dean, L. Wang, P. Maher, C. Forsythe, F. Ghahari, Y. Gao, J. Katoch, M. Ishigami, P. Moon, M. Koshino, et al., Nature 497, 598 (2013).
- Hunt et al. (2013) B. Hunt, J. Sanchez-Yamagishi, A. Young, M. Yankowitz, B. LeRoy, K. Watanabe, T. Taniguchi, P. Moon, M. Koshino, P. Jarillo-Herrero, et al., Science 340, 1427 (2013).
- Ponomarenko et al. (2013) L. Ponomarenko, R. Gorbachev, G. Yu, D. Elias, R. Jalil, A. Patel, A. Mishchenko, A. Mayorov, C. Woods, J. Wallbank, et al., Nature 497, 594 (2013).
- Moon and Koshino (2013b) P. Moon and M. Koshino, Phys. Rev. B 87, 205404 (2013b).
- Wang et al. (2010) Y. Wang, Z. Ni, L. Liu, Y. Liu, C. Cong, T. Yu, X. Wang, D. Shen, and Z. Shen, ACS Nano 4, 4074 (2010).
- Stauber et al. (2013) T. Stauber, P. San-Jose, and L. Brey, New. J. Phys. 15, 113050 (2013).
- Havener et al. (2013) R. W. Havener, C.-J. Kim, L. Brown, J. W. Kevek, J. D. Sleppy, P. L. McEuen, and J. Park, Nano Lett. 13, 3942 (2013).
- Havener et al. (2014) R. W. Havener, Y. Liang, L. Brown, L. Yang, and J. Park, Nano Lett. 14, 3353 (2014).
- Tabert and Nicol (2013) C. J. Tabert and E. J. Nicol, Phys. Rev. B 87, 121402 (2013).
- Liang et al. (2014) Y. Liang, R. Soklaski, S. Huang, M. W. Graham, R. Havener, J. Park, and L. Yang, Phys. Rev. B 90, 115418 (2014).
- McCann (2006) E. McCann, Phys. Rev. B 74, 161403 (2006).
- Castro et al. (2007) E. Castro, K. Novoselov, S. Morozov, N. Peres, J. M. B. Lopes dos Santos, J. Nilsson, F. Guinea, A. Geim, and A. Neto, Phys. Rev. Lett. 99, 216802 (2007).
- Koshino and McCann (2009) M. Koshino and E. McCann, Phys. Rev. B 79, 125443 (2009).
- Mak et al. (2009) K. F. Mak, C. H. Lui, J. Shan, and T. F. Heinz, Phys. Rev. Lett. 102, 256405 (2009).
- Zhang et al. (2009) Y. Zhang, T.-T. Tang, C. Girit, Z. Hao, M. C. Martin, A. Zettl, M. F. Crommie, Y. R. Shen, and F. Wang, Nature 459, 820 (2009).
- Castro et al. (2010) E. Castro, K. Novoselov, S. Morozov, N. Peres, J. Lopes dos Santos, J. Nilsson, F. Guinea, A. Geim, and A. Castro Neto, J. Phys.: Condens. Matter 22, 175503 (2010).
- Xian et al. (2011) L. Xian, S. Barraza-Lopez, and M. Chou, Phys. Rev. B 84, 075425 (2011).
- San-Jose and Prada (2013) P. San-Jose and E. Prada, Phys. Rev. B 88, 121408 (2013).
- Nakanishi and Ando (2001) T. Nakanishi and T. Ando, J. Phys. Soc. Jpn. 70, 1647 (2001).
- Uryu (2004) S. Uryu, Phys. Rev. B 69, 075402 (2004).
- Slater and Koster (1954) J. Slater and G. Koster, Phys. Rev. 94, 1498 (1954).
- Nilsson et al. (2007) J. Nilsson, A. Neto, F. Guinea, and N. Peres, Phys. Rev. B 76, 165416 (2007).
- Ando (1975) T. Ando, J. Phys. Soc. Jpn. 38, 989 (1975).
- Haldane (2004) F. Haldane, Phys. Rev. Lett. 93, 206602 (2004).
- Fu and Kane (2007) L. Fu and C. L. Kane, Phys. Rev. B 76, 045302 (2007).
- Koshino (2013) M. Koshino, Phys. Rev. B 88, 115409 (2013).
- McCann and Fal’ko (2006) E. McCann and V. I. Fal’ko, Phys. Rev. Lett. 96, 086805 (2006).
- Nair et al. (2008) R. Nair, P. Blake, A. Grigorenko, K. Novoselov, T. Booth, T. Stauber, N. Peres, and A. Geim, Science 320, 1308 (2008).
- Ando et al. (2002) T. Ando, Y. Zheng, and H. Suzuura, J. Phys. Soc. Jpn. 71, 1318 (2002).
- Gusynin and Sharapov (2006) V. Gusynin and S. Sharapov, Phys. Rev. B 73, 245411 (2006).
- Gusynin et al. (2006) V. Gusynin, S. Sharapov, and J. Carbotte, Phys. Rev. Lett. 96, 256802 (2006).
- Xu et al. (2010) Y. Xu, X. Li, and J. Dong, Nanotechnology 21, 065711 (2010).
- Tabert and Nicol (2012) C. J. Tabert and E. J. Nicol, Phys. Rev. B 86, 075439 (2012).
- Abergel and Fal’ko (2007) D. S. L. Abergel and V. I. Fal’ko, Phys. Rev. B 75, 155430 (2007).
- Koshino and Ando (2009) M. Koshino and T. Ando, Solid State Commun. 149, 1123 (2009).
- Zhang et al. (2008) L. Zhang, Z. Li, D. Basov, M. Fogler, Z. Hao, and M. Martin, Phys. Rev. B 78, 235408 (2008).
- Kuzmenko et al. (2009) A. Kuzmenko, E. van Heumen, D. van der Marel, P. Lerch, P. Blake, K. Novoselov, and A. Geim, Phys. Rev. B 79, 115441 (2009).
- Li et al. (2009) Z. Li, E. Henriksen, Z. Jiang, Z. Hao, M. C. Martin, P. Kim, H. Stormer, and D. N. Basov, Phys. Rev. Lett. 102, 37403 (2009).