Controlling polymer translocation and ion transport via charge correlations
Abstract
We develop a correlation-corrected transport theory in order to predict ionic and polymer transport properties of membrane nanopores in physical conditions where mean-field electrostatics breaks down. The experimentally observed low KCl conductivity of open -Hemolysin pores is quantitatively explained by the presence of surface polarization effects. Upon the penetration of a DNA molecule into the pore, these polarization forces combined with the electroneutrality of DNA sets a lower boundary for the ionic current, explaining the weak salt dependence of blocked pore conductivities at dilute ion concentrations. The addition of multivalent counterions into the solution results in the reversal of the polymer charge and the direction of the electroosmotic flow. With trivalent spermidine or quadrivalent spermine molecules, the charge inversion is strong enough to stop the translocation of the polymer and to reverse its motion. This mechanism can be used efficiently in translocation experiments in order to improve the accuracy of DNA sequencing by minimizing the translocation velocity of the polymer.
pacs:
05.20.Jj,87.15.hj,87.16.dpI Introduction
The analysis of biopolymer sequences is of vital importance to understand the functioning of living organisms. Nanopore sensing methods that aim at sequencing biopolymers have drawn increasing attention during the last two decades. Since the seminal article from Kasianowicz et al. 1, electrophoretic polymer translocation through nanopores has been in central focus in this field. In addition to being a potentially fast and inexpensive method, this sequencing strategy based on the analysis of ionic current variations is also practical since it does not require the biochemical modification of the translocating DNA molecule. Intensive experimental work has been performed in order to refine the method of DNA sequencing with biological 2; 3; 4; 5; 6 and solid-state nanopores 7; 8; 9; 10; 11; 12. These works have revealed that ionic current variations and the accuracy of their detection depend sensitively on the nanopore size and the translocation speed of DNA. Hence, it is of great importance to throughly characterize the optimal physical characteristics of the translocating polyelectrolyte and the pore in order to improve the resolution of this method.
The complexity of the polymer translocation problem stems from the entanglement between hydrodynamic DNA-solvent interactions, electrostatics correlations mediated by the confined electrolyte, and entropic costs associated with DNA conformations. Although hydrodynamic and entropic issues have been intensively addressed by previous Molecular Dynamics (MD) simulations 13; 14; 15; 16; 17, the central role played by electrostatics has not been scrutinized. Indeed, it is well established that the accurate sequencing of DNA necessitates a strong ionic current signal that also lasts long enough during the translocation event 5. The difficulty to realize these two combined conditions stems from the fact that a strong applied field resulting in a substantial signal will also cause the DNA molecule to escape too fast from the nanopore into the reservoir. In order to optimize the accuracy of this sequencing method, it is thus crucial to figure out the physical conditions that minimize the velocity of DNA independently of the external voltage gradient. This requires in turn a consistent electrohydrodynamic theory of the charged liquid and the translocating polyelectrolyte.
Previous MD simulation works ingenuously considered the effect of electrostatic correlations on the transport of ions 18 and DNA molecules 19 thorough nanopores. In addition to their computational complexity, the canonical nature of these simulations fixing the total ion number in the nanopore does not correspond to the experimental setup where the ionic transport takes place via charge exchanges between the ion reservoir and the pore medium. The simplest approach that mimics polymer transport experiments consists in coupling the linear Poisson-Boltzmann (PB) theory with the Stokes equation. Within such a linear mean-field (MF) theory, electrostatic effects on the electrophoretic polymer translocation was investigated by Ghosal 20; 21. In comparison with DNA translocation times measured for monovalent electrolytes 9, it was shown that translocation velocities are weakly affected by the monovalent salt density. As revealed by additional MF studies 22 and transport experiments 12, a more efficient way to control the DNA translocation velocity consists in tuning the pH of the solution. Nevertheless, this strategy is not universal since charge regulation effects depend sensitively on the chemical properties of the nanopore and the polymer type. Within a solvent-explicit MD simulation approach, Luan and Aksimentiev showed that electrostatic correlations induced by strongly charged molecules can offer a more precise control over the DNA motion 19. The correlation-induced mechanism is similar to the effect of multivalent charges on the decomplexation of oppositely charged polyelectrolytes 23. However, the above-mentioned MF theories that neglect correlation effects are naturally unable to explore this possibility.
Motivated by these facts, we develop the first unified theory of ionic and polymer transport beyond the PB approximation. First of all, our theory that can account for electrostatic many-body and surface polarization effects provides us with a realistic picture of ion transport through nanoscale pores where these effects are known to be non-negligible. Then, the ability of the proposed formalism in considering charge correlation effects allows to develop the idea of controlling polyelectrolytes via the charge reversal mechanism. The computation of the ionic current through the nanopore requires the knowledge of the charge partition between the polymer and the pore. Thus, we first extend the self-consistent (SC) electrostatic formalism previously developed for open pores 24 to the case of a cylindrical polyelectrolyte confined to the nanopore. By comparison with MC simulations, the SC scheme was shown to accurately handle electrostatic correlations including surface polarization effects 24. Then, we couple the extended SC formalism with the Stokes equation. Within the framework of this correlation-corrected transport theory, we tackle three different questions. First, we investigate the physics behind the particularly low conductivity of open -Hemolysin pores observed in transport experiments 3; 26; 25. We identify the underlying mechanism as the dielectric exclusion of ions, an effect inaccessible by previous MF theories. Then, we scrutinize the non-monotonic salt dependence of DNA-blocked -Hemolysin pores 3. In the second part, we study the effect of charge correlations on the electrophoretic transport of polyelectrolytes and investigate the possibility to control the polymer translocation by tuning the reservoir ion densities in electrolyte mixtures with multivalent counterions. We show that the addition of trivalent and quadrivalent ions into the solution allows to alter the speed and even the direction of translocating polyelectrolytes in a controlled way. We finally discuss the limitations and possible extensions of the present theory in the Conclusion.
II Model and theory
II.1 Translocating polymer model
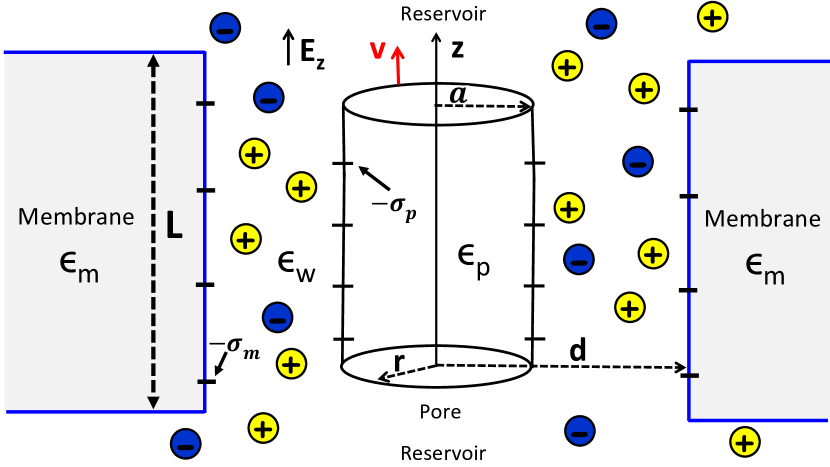
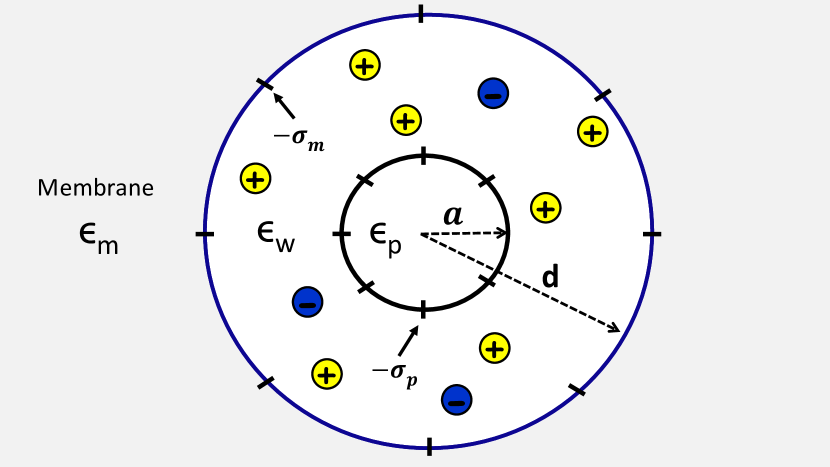
The geometry of the pore confining mobile charges and the polyelectrolyte is depicted in Fig. 1. The cylindrical nanopore of radius is in contact with an ion reservoir at the extremities. The polyelectrolyte is modelled as a rigid cylinder of radius whose longitudinal axis coincides with the axis of the nanopore. Both the nanopore and the polymer carry a smeared negative charge distribution with amplitudes and , respectively. They also have corresponding static dielectric permittivities and that may differ from the permittivity of the electrolyte , all expressed in units of the air permittivity. The transport of the mobile charges and the polymer is driven by a potential gradient at the extremities of the channel. We assume that the potential decays linearly along the nanopore of length , which results in a uniform electric field acting on the charges. We also emphasize that the nanopore lengths considered in the present work lie in the range nm which is an order of magnitude larger than the Bjerrum length Å. Thus, in the calculation of the ion densities, we will assume that the nanopore and the cylinder are infinitely long. We note that this approximation may not be accurate for membranes with nanoscale thickness comparable to the Bjerrum length. The consideration of charge transport effects through thin membranes is beyond the scope of this article.
II.2 Correlation-corrected ion densities
In this part we extend the SC theory of ion partition in open pores 24 to the case of the cylindrical polyelectrolyte confined to the nanopore (see Fig. 1). Within this formalism, the total external potential induced by the pore and the polymer charges is composed of a modified PB contribution and a perturbative correction taking into account ionic cloud deformations, , where the loop expansion parameter will be set to unity at the end of the calculation. The components of the potential are obtained from the relations
| (1) | |||
| (2) |
which are coupled to the kernel equation for the electrostatic propagator accounting for charge fluctuations,
| (3) |
In Eq. (1), the dielectric permittivity function is defined as , is the elementary charge of the electron, the Boltzmann constant, the ambient temperature, and the valency of mobile ions with species ( with the total number of ion species). The auxiliary number density is defined as
| (4) |
where the function restricts the space accessible to the electrolyte, and stands for the ionic concentration in the reservoir. Furthermore, in Eq. (1), the fixed charge density is given by the function . Then, the ionic self-energies in Eqs. (1)-(4) are obtained from the renormalized equal-point Green’s function
| (5) |
with the Bjerrum length , the DH screening parameter , and the Coulomb potential in an ion-free bulk solvent . In terms of the total self-energy (5), the solvation and image-charge potentials in Eqs. (2)-(4) are defined as
| (6) | |||
| (7) |
where the image-charge contribution includes surface polarization effects resulting from the dielectric discontinuities. From now on, we will exploit the cylindrical symmetry of the system where the electrostatic potentials depend exclusively on the radial distance . In terms of the potentials introduced above, the local ion density in the pore is given by
| (8) |
which allows to derive the total charge density needed for the calculation of ionic currents
| (9) |
We finally note that the iterative solution scheme of Eqs. (1)-(II.2) introduced in Ref. 24 is unmodified by the presence of the polyelectrolyte.
II.3 Pore conductivity and polymer velocity
Within the correlation-corrected electrostatic formulation introduced above, we now derive the polymer translocation velocity and the ionic conductance of the nanopore. The derivation of the polymer velocity will allow us to account for charge correlations and non-linearities neglected by the linear MF theory of Ref. 21. The total velocity of an ion of species is composed of the convective and the drift velocities, . The drift velocity is given by
| (10) |
where stands for the ionic mobility. For comparison with ion transport experiments, we will take the experimentally established values and 27. The convective flow velocity obeys in turn the Stokes equation
| (11) |
with the viscosity coefficient of water . By acting with the Laplacian operator on Eq. (2) and using the resulting equation with the relations (1)-(II.2), one finds that the electrostatic potential is related to the charge density via the Poisson equation . Using this relation in Eq. (11) to eliminate the charge density, the Stokes equation takes the form
| (12) |
At this stage, we note that in the stationary regime corresponding to the constant translocation velocity, the longitudinal electric force per polymer length compensates the viscous friction force , i.e. . Solving Eq. (12) by accounting for this force balance relation, the Gauss’ law , and the hydrodynamic boundary conditions (no-slip at the pore surface) and , one gets the polymer translocation velocity
| (13) |
and the convective flow velocity
| (14) |
where we introduced the electrophoretic mobility
| (15) |
Similar to the mean-field electrophoretic transport 21, the translocation velocity of the polymer (13) is the superposition of the electrophoretic velocity of the molecule in the reference frame of the flowing liquid , and the electroosmotic velocity of the charged liquid . The main difference between the present formalism and the usual mean-field transport theory is due to the correlation corrections to the electrostatic potential in Eq. (13).
The ionic current thorough the pore is given by the total number of flowing ions per unit time,
| (16) |
Substituting the ion density (8) and the velocities (10) and (14) into Eq. (16), and expanding the result at one-loop order , one finds that the ionic current is given by the linear response relation . The total conductivity of the pore is composed of a transport flow contribution and a convective part,
| (17) |
with the conductive and convective components
| (18) | |||||
In the relations (18) and (II.3), charge fluctuations are taken into account by the external potential correction and the ionic self energies in the ion densities and (see Eqs. (4) and (8)). In other words, setting these potentials to zero, one covers from Eqs. (18)-(II.3) the mean-field ion conductivity of the pore confining the polyelectrolyte.
III Results and discussion
III.1 Comparison with experimental pore conductivities
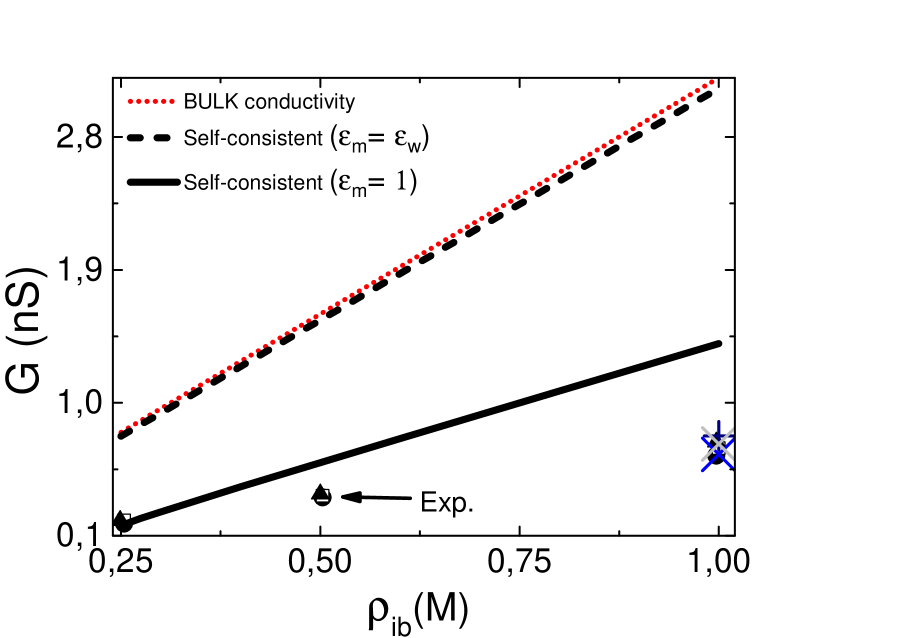
Within the correlation-corrected transport theory introduced above, we investigate first the mechanism behind the particularly low ionic conductivity of DNA-free -Hemolysin pores confining the electrolyte KCl 3. Because these pores exhibit a very weak cation selectivity driven by an asymmetric surface charge distribution 28, we model the nanopore as an overall neutral cylinder, i.e. we set . The radius and the length of the nanopore are taken as Å 3 and nm 28. We display in Fig. 2 experimental conductivity data from Refs. 3; 25; 26 together with three different theoretical predictions in order to investigate the effect of charge correlations.
The bulk conductivity can be derived from Eqs. (18)-(II.3) by neglecting the potentials and , which yields . Fig. 2 shows that the bulk result overestimates the experimental data by almost an order of magnitude. Furthermore, the SC prediction of Eq. (17) with the dielectrically homogeneous pore approximation stays very close to the bulk conductivity curve. Thus, correlation effects solely associated with the inhomogeneity of the electrolyte play a perturbative role. However, the SC prediction of Eq. (17) that takes into account the low dielectric permittivity of the membrane agrees with the experimental data in a quantitative fashion at low ion densities and qualitatively up to about M, considerably improving on the bulk result. The reduced pore conductivity with the lower membrane permittivity results from repulsive image-charge interactions between ions and the membrane. Because the radius of -Hemolysin pores is comparable to the Bjerrum length , the particularly strong amplitude of image-charge forces lead to the dielectric exclusion of ions from the nanopore 24, resulting in a pore conductivity significantly below the diffusive bulk conductivity. This indicates that the low ion permeability of DNA-free -Hemolysin pores stems mainly from surface polarization effects.
We emphasize that in Fig. 2, the deviation of the SC result from the data at large concentrations is likely to result from the dielectric continuum approximation of our solvent-implicit theory. Considering the strong confinement of Hemolysin pores, the charge structure of water solvent is expected to affect their conductivity in a significant way. Indeed, within a recently developed solvent-explicit theory in nanoslits, we have shown that the solvent charge structure results in an ionic Born energy difference between the pore and the reservoir, which in turn amplifies the ionic exclusion associated with image-charge interactions 29. This suggests that the consideration of the solvent charge structure is expected to lower the ion conductivity curve of Fig. 2. However, the formidable task of integrating the solvent-explicit SC equations in cylindrical pores is beyond the scope of the present article.
We now continue on to the transport characteristics of nanopores confining DNA molecules. We reported in Fig. 3 the SC result for the salt dependence of the conductivity of an -Hemolysin pore blocked by a single stranded-DNA (ss-DNA) molecule, together with the experimental data from Ref. 3. The caption displays the dielectric permittivity and the effective smeared charge of the ss-DNA that provided the best fit with the amplitude of the experimental conductivity. First, one notes that the SC prediction can accurately reproduce the slope of the conductivity data. Then, it is seen that unlike the conductivity of DNA-free pores linear in the ion density (see Fig. 2), the conductivity of the blocked pore varies weakly at dilute salt concentrations M but increases with salt at larger concentrations. We also reported in Fig. 3 the MF conductivity obtained from Eqs. (18)-(II.3) by neglecting the correlation corrections, i.e. by setting and . The MF result exhibits a linear increase with ion density, which indicates that the peculiar shape of the conductivity data is a non-MF effect.
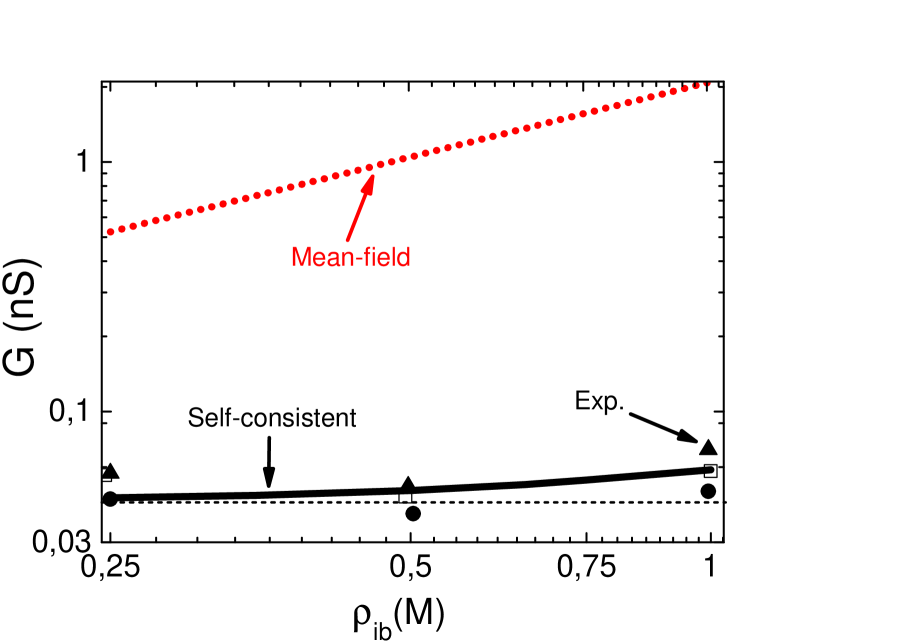
Within a phenomenological model, Bonthuis et al. explained the non-monotonical slope of the conductivity data by the formation of neutral pairs between the DNA charges and their counterions 3. The present SC transport theory can bring a more physical insight into this peculiarity. For the model parameters in Fig. 3, we found that the convective part of the conductivity in Eq. (II.3) is largely dominated by the transport component of Eq. (18). In the supplemental material, by making use of a constant Donnan potential approximation, the transport part of the conductivity is put in the closed-form
| (20) | |||||
with the dielectric exclusion coefficient
| (21) |
and the ratio between the pore volume density of the fixed charges and the bulk ionic density
| (22) |
In the highly confined space between the low dielectric membrane and the ss-DNA, strong image-charge interactions result in a pronounced dielectric exclusion of ions, i.e. . Expanding Eq. (20) up to the order , the pore conductivity follows as
| (23) | |||||
The first term of Eq. (23) plotted in Fig. 3 by the dashed horizontal curve depends solely on the ionic mobility of counterions. Thus, the ionic exclusion limit corresponds to a non-MF counterion only regime. This salt-free limit is set by the coupling between polarization forces and the electroneutrality condition of the DNA molecule. Indeed, image-charge forces repelling ions from the nanopore cannot lead to a total ionic depletion since a minimum number of counterions have to stay in the pore in order to screen the DNA charges. Thus, at low salt densities, these counterions solely contribute to the ionic current. Then, the second term of Eq. (23) quadratic in salt density is seen to depend on the ionic mobilities of both coions and counterions. Therefore, at large ion densities, coions and counterions contribute together to the pore conductivity, which explains the rise of the conductivity with salt concentration in Fig. 3.
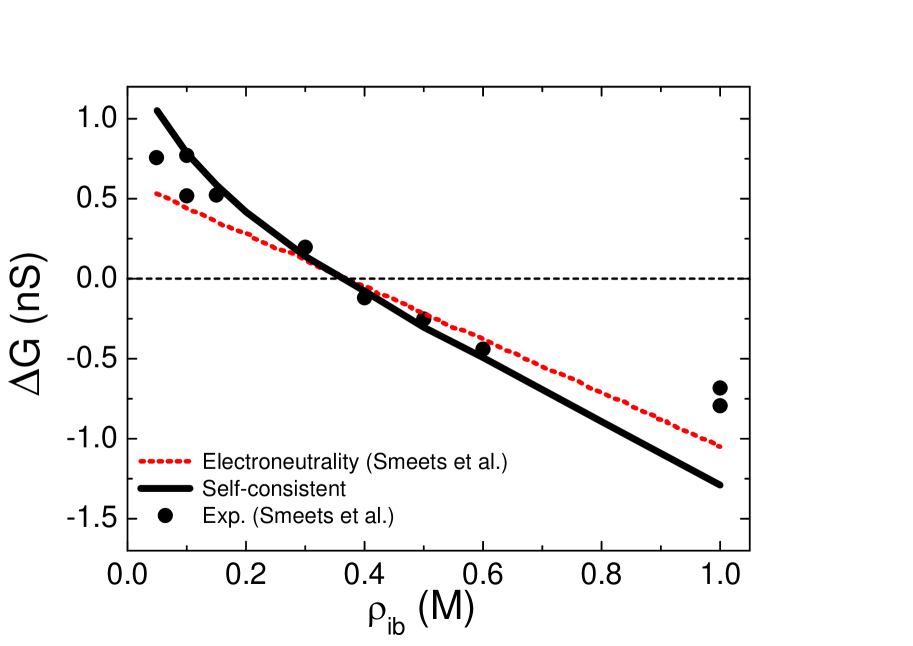
Having characterized correlation effects in highly confined -Hemolysin pores, we now consider the role of correlations in solid-state pores of larger radius. Fig. 4 displays experimental data from Fig.4(a) of Ref. 9 for the conductivity change upon the penetration of a double stranded DNA (ds-DNA) molecule into a solid-state pore of radius nm. We also show our SC prediction and a linear MF result from Ref. 9. In the SC calculation, the effective smeared charge of the ds-DNA was determined as in order to coincide with the characteristic density M where conductivity data changes its sign. The ds-DNA radius is assumed to be twice as large as the ss-DNA radius, that is nm. The conductivity change by the DNA molecule in Fig. 4 was explained in Ref. 9 by an interpolation between the low density regime M where counterion attraction to DNA amplifies the ionic current (), and the high density regime M where the DNA volume blocks the net current (). One notes that at low ion densities, the SC theory slightly improves over the linear MF result, which is mainly due to the consideration of non-linearities in Eq. (1) rather than charge correlations. This indicates that in large solid-state pores confining monovalent salt, charge correlations play a perturbative role.
III.2 Charge correlation effects on the electrophoretic motion of polyelectrolytes
We explore next the possibility to control the motion of polymers via charge correlation effects in synthetic pores. The polyelectrolyte radius will be fixed to the radius of the ds-DNA as in Fig. 4. Because the radius of solid-state pores that can contain unfolded ds-DNA molecules is usually larger than nm 30, the pore radius will be taken as nm, unless stated otherwise. In the previous section, we found that image-charge forces are perturbative in large pores of radius . Thus, to simplify the numerical task and the physical picture, we will neglect the dielectric jumps and set . We will also assume that the pore is neutral and the liquid is at ambient temperature K. With these model parameters, we characterize first the effect of charge correlations on the electrophoretic motion of polyelectrolytes in the simplest case of an asymmetric electrolyte. Then, we investigate the possibility to tune the translocation velocity of polyelectrolytes by changing the counterion concentrations in electrolyte mixtures.
III.2.1 Correlation effects in asymmetric electrolytes
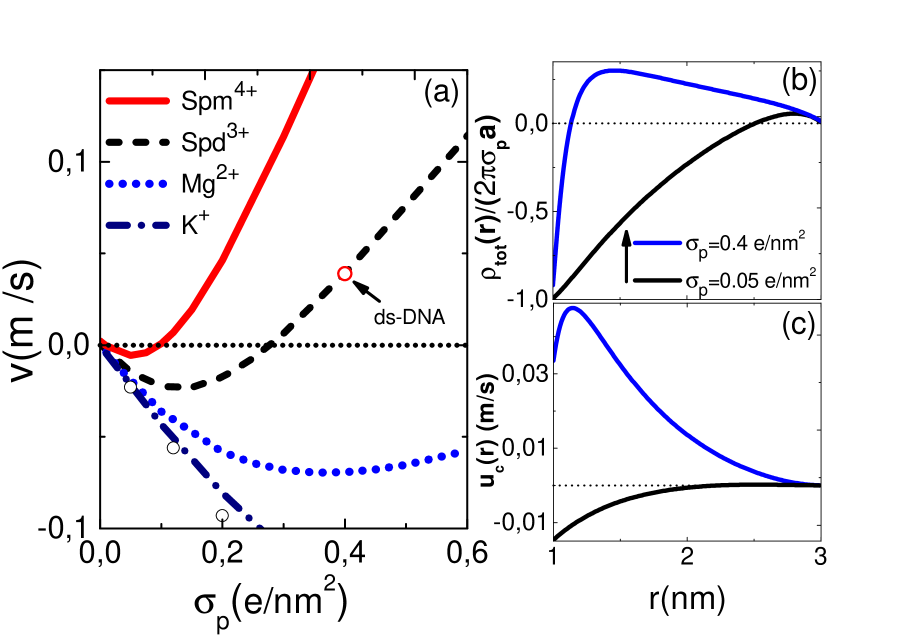
We illustrate in Fig. 5(a) the translocation velocity of a polyelectrolyte against its surface charge in the presence of an asymmetric electrolyte with composition I. The counterion species of reservoir concentration M is specified in the legend. One notes that with monovalent counterions, the translocation velocity is negative for all polymer charges, i.e. the polymer moves oppositely to the applied field. By evaluating the translocation velocity (13) with the electrostatic potential Eq. (3) of the supplemental material, taking the MF dilute salt limit and , and Taylor-expanding the result in terms of the polymer surface charge , the translocation velocity becomes
| (24) |
Eq. (24) reported in Fig. 5 by open circles is seen to closely follow the SC result. Thus, with monovalent electrolytes, the polymer motion is qualitatively driven by MF electrophoretic transport and charge correlations weakly affect the polymer translocation. Then, with multivalent counterions, the amplitude of the velocity is seen in Fig. 5(a) to increase also according to the linear law (24) for weak polymer charges, but the slope of the curves vanishes at a characteristic polymer charge and the velocity starts decreasing beyond this value. With ions, the polymer velocity stays always negative in the physical charge regime considered in Fig. 5(a). With spermidine or spermine molecules of higher valency, the translocation velocity vanishes () respectively at the polymer charges and . Polyelectrolytes with stronger charges translate in the direction of the external field (), a peculiarity that cannot be explained by the MF prediction of Eq. (24).
In order to elucidate the underlying mechanism behind the reversal of the polymer motion, we show in Fig. 5(b) and (c) the cumulative charge density of the liquid and its electroosmotic velocity Eq. (14). The cumulative charge density including the polyelectrolyte is defined as the integrated charge
| (25) |
At the surface charge where the polymer translocates oppositely to the applied field ( in Fig. 5(a)), the counterion screening of the polymer results in an overall negative cumulative charge and convective velocity. By increasing the polymer charge to the characteristic value of the ds-DNA , in the close neighborhood of the polymer surface nm, the cumulative charge becomes positive, which inverses the sign of the convective velocity of the liquid and the DNA molecule. Thus, the inversion of the translocation velocity results from the reversal of the polymer charge, i.e. the effect is driven by electrostatic correlations between multivalent counterions bound to the polyelectrolyte. The overcompensation of the macromolecular charge by strongly correlated multivalent counterions has been observed by previous MD simulations 31; 32 and nanofluidic experiments 33. The phenomenon observed in Fig. 5(a) presents itself as a useful mechanism to minimize the velocity of translocating polymers. However, the charge of a polyelectrolyte cannot be easily tuned in translocation experiments. Thus, we will next explore the possibility to control this effect via counterion concentrations in electrolyte mixtures.
III.2.2 Tunning translocation velocity in electrolyte mixtures via counterion densities
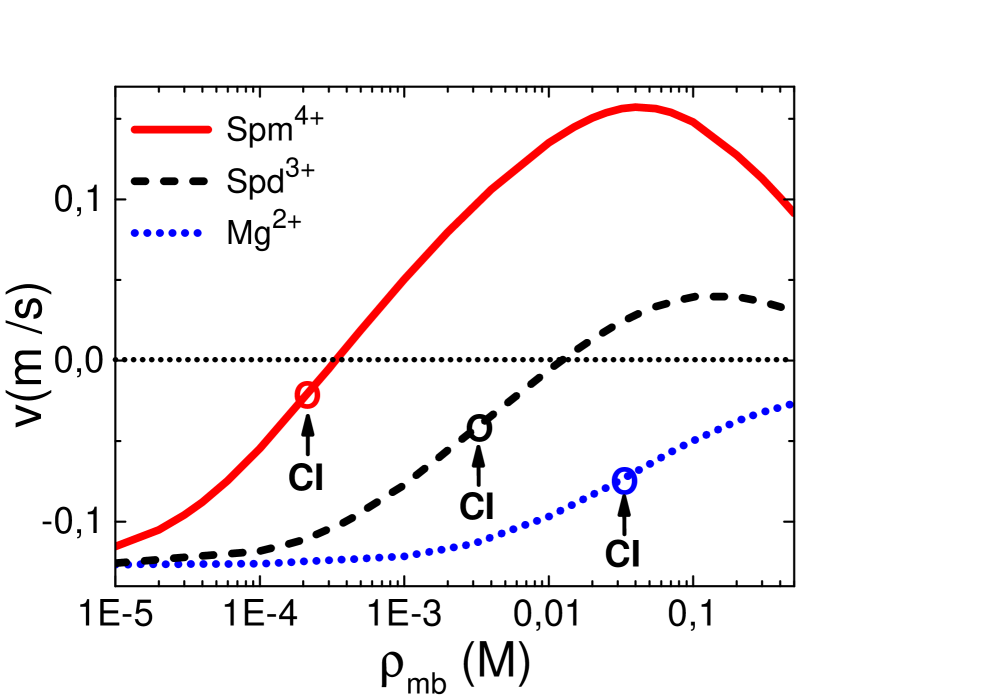
We consider an electrolyte mixtures of composition KCl+I containing an arbitrary type of multivalent counterion . In this part, the polymer charge will be set to the characteristic value of ds-DNA , unless stated otherwise. We display in Fig. 6 the DNA translocation velocity against the reservoir density of three different types of multivalent counterions in the solution (see the legend). The bulk density is fixed at M. For each type of multivalent counterion, the increase of the reservoir density first results in the inversion of the DNA charge at M, M, and M. For electrolytes with spermidine and spermine molecules, this is followed by the blockage of the translocation () at the critical densities M and M. Increasing further the counterion density, the translocation velocity that becomes positive reaches a peak and starts decreasing. With divalent magnesium ions, the polymer velocity stays negative for all concentrations, i.e. the charge inversion is not strong enough to reverse the motion of DNA. This conclusion agrees with MD simulations of electrophoretic DNA motion in charged liquids 19.
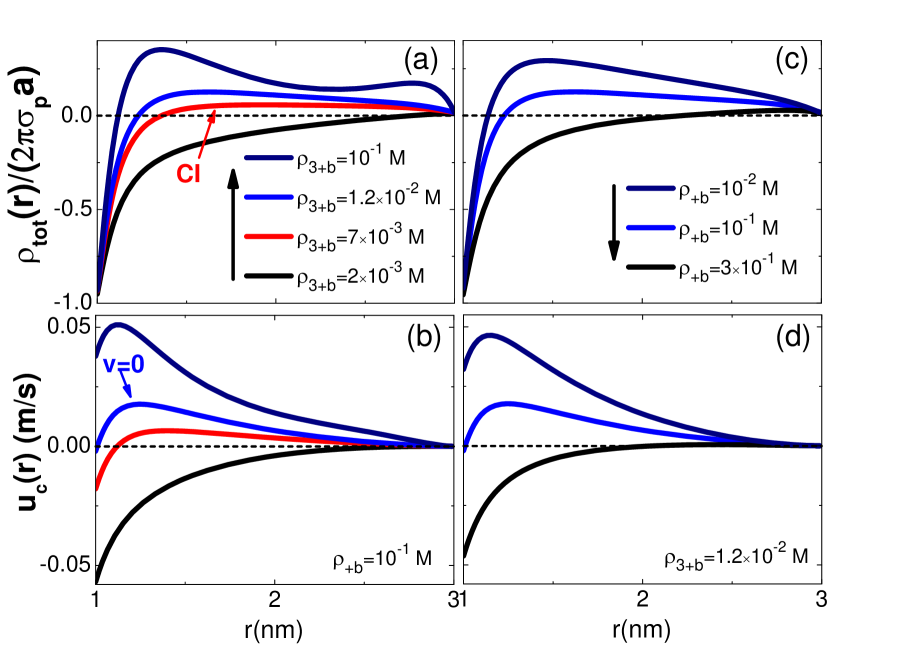
To illustrate the physical picture behind these observations, we report in Fig. 7(a) and (b) the cumulative charge density and the electroosmotic velocity of the fluid for various concentrations. It is seen that with an increase of the density from M to M, the cumulative charge density changes its sign and becomes positive at nm. As a result of this charge inversion, the liquid flows in the direction of the applied field () in the region nm. However, at the corresponding density, the hydrodynamic drag is not strong enough to reverse the motion of DNA, and the DNA molecule as well as the fluid carried by the latter at nm continue to move oppositely to the field. By increasing further the density to the characteristic value M, the cumulative charge density becomes positive enough for the hydrodynamic drag to compensate exactly the electrostatic coupling between DNA and the applied field. As a result, the translocation velocity of DNA vanishes. For the higher reservoir density M, the DNA and the surrounding fluid move in the direction of the applied field. In Fig. 7(a), one also notes that the cumulative charge density develops a well between the two density peaks located at nm and nm. The corresponding local decrease in the cumulative charge density results from the enhanced concentration of coions attracted to the charge inverted DNA molecule. This layer attracts in turn ions, leading to the second peak close to the pore wall. Indeed, we found that with a further increase of the concentration, the intensification of the attraction starts lowering the cumulative charge and the convective velocity. This explains the reduction of the positive translocation velocity at large concentrations M in Fig. 6.
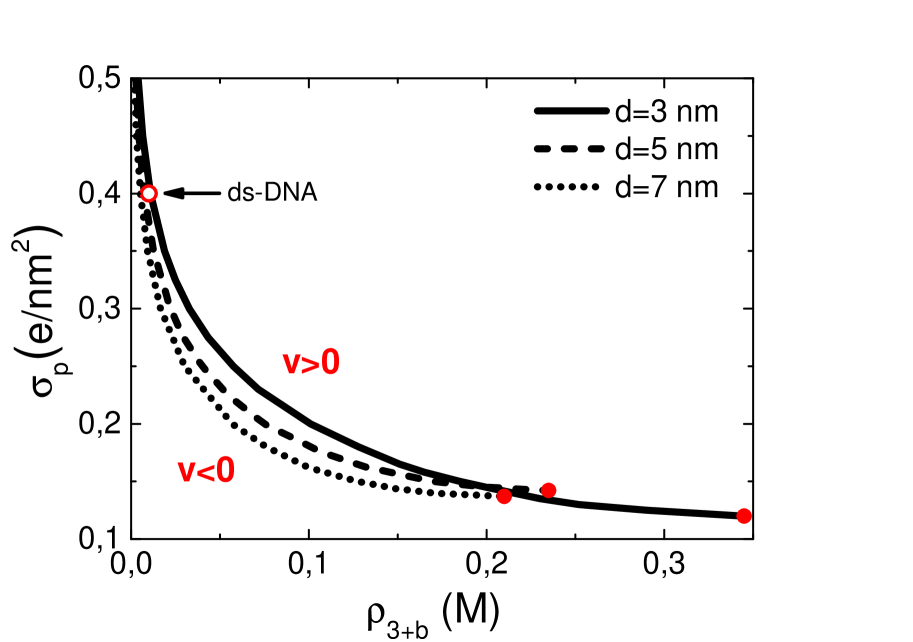
These results indicate that the modification of the multivalent counterion density is an efficient way to minimize the translocation velocity of polyelectrolytes. In order to guide future translocation experiments aiming at exploring this effect, we illustrate in Fig. 8 the characteristic polymer charge versus density curves separating the parameter domains with positive and negative translocation velocity. First, the phase diagram indicates that weaker is the polymer charge, higher is the density required to cancel the translocation velocity, i.e. . However, one also sees that with decreasing polymer charge density, the characteristic curves end at a critical point located at and M where the inversion of the polyelectrolyte motion ceases to exist. At lower polymer charges, the translocation velocity stays always negative regardless of the concentration in the reservoir. Indeed, we found that below this critical polymer charge, the peak in the velocity curves of Fig. 6 emerges before the velocity becomes positive. This observation fixes a lower polymer charge boundary for the inversion of the polymer motion to occur. Nevertheless, for the physiological density M in Fig. 8, the ds-DNA charge is shown to be located well above this lower boundary. Finally, the phase diagram in Fig. 8 indicates that in smaller pores, the main effect of confinement is a shift of the critical densities to larger values, that is at fixed polymer charge . However, one also notes that the effect of the pore radius on the critical curves is only moderate.
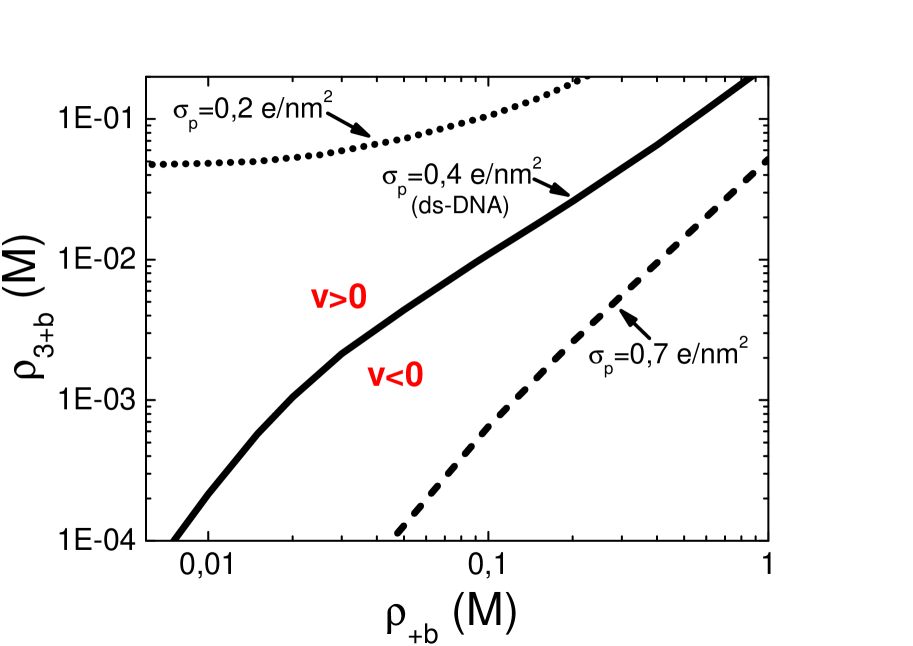
An additional parameter that can be tuned in translocation experiments is the concentration in the reservoir. We characterized the effect of ions on the polyelectrolyte motion in Fig. 9. The figure displays the characteristic density versus density curves splitting the domains with positive and negative translocation velocity. The phase diagram indicates that at fixed density and starting at any point above the curves, the increase of density switches the translocation velocity from positive to negative. Then, with increasing polymer charge, the critical lines are seen to move towards higher concentrations, i.e. at fixed concentration in the reservoir. This means that stronger is the polymer charge, higher is the amount of ions needed to stop the translocation of the molecule. To better understand the physical effect of ions on the translocation velocity, in Fig. 7(c), we show that the increase of the concentration from M to M reduces the overscreening of the DNA charge. The effect is totally suppressed at the higher concentration M. We note that monovalent salt induced suppression of the macromolecular charge reversal in asymmetric electrolyte mixtures had been observed and quantitatively characterized in previous modified PB theories 34; 35; 36. In Fig. 7(d), one sees that this effect is accompanied with the blocking of the translocation process and then the switching of the liquid and DNA velocities from positive to negative. This observation suggests the alteration of the concentration as an alternative way to minimize the velocity of DNA in translocation experiments.
IV Conclusions
We developed a correlation-corrected theory in order to characterize charge and polymer transport properties of membrane nanopores in physiological conditions where the PB theory is invalid. First, the notably reduced conductivities of -Hemolysin pores were found to result from the presence of polarization charges induced by the dielectric mismatch between the electrolyte and the membrane. Then, we showed that in the presence of an ss-DNA in the pore, the same polarization effects combined with the electroneutrality of the DNA drive the system into a counterion-only regime, setting the lower boundary of the ionic current flowing through the blocked pore. Finally, we characterized charge correlation effects on the electrophoretic translocation of polyelectrolytes. We found that the presence of multivalent counterions in the solution results in the reversal of the polymer charge and the electroosmotic velocity of the liquid. With and ions, the reversal of the fluid velocity is strong enough to invert the electrophoretic motion of the polyelectrolyte. By adequately tuning the monovalent or multivalent counterion density in the reservoir, this mechanism can be efficiently used to minimize the DNA velocity in translocation experiments.
The present model can be elaborated further by considering the finiteness of the nanopore length 37, or the helicoidal geometry and the discrete charge structure of DNA molecules 38; 39. We should also note that our theory cannot account for ionic pair formation observed in previous MC simulations and modified PB approaches 34; 35; 36. The formation of such pairs between monovalent coions and trivalent/quadrivalent molecules should lower the charge of the latter and consequently weaken the inversion of the polymer mobility. Thus, the present theory that misses ionic cluster formation may underestimate the multivalent charge concentrations and the polymer charge densities where the inversion of the polymer velocity takes place. The consideration of the cluster formation in future works will probably require the inclusion of second order cumulant corrections to the variational grand potential of the system. Then, our formalism lacks as well the charge structure of solvent molecules. This dielectric continuum approximation may indeed be responsible for the overestimation of the pore conductivity at large ion densities in Fig. 2. Thus, future works should consider the solvent charge structure in modelling ionic conductivity through nanoscale pores 29. An additional detail that deserves consideration is the flexibility of polyelectrolytes 40. Although the rigidly cylindrical polyelectrolyte model allowed us to consider surface polarization effects, the considerably low value of the effective ss-DNA charge in Fig. 3 is likely to result from charge discreteness and/or DNA configuration effects neglected herein. We emphasize that despite these model simplifications, the present theory can already capture different characteristics of membrane nanopores. Moreover, by including charge correlations, the formalism bridges a gap between MF transport theories unable to consider multivalent charges or surface polarization effects 20; 21; 22 and MD simulations with considerable complexity 19. Future translocation experiments with multivalent ions will be certainly needed to ascertain our physical conclusions.
Acknowledgement. We thank Ralf Blossey for a detailed reading of our manuscript and his precious comments. S.B. gratefully acknowledges support under the ANR blanc grant “Fluctuations in Structured Coulomb Fluids”. T. A-N. has been supported in part by the Academy of Finland through its CoE program COMP grant no. 251748.
Appendix A Derivation of the pore conductivity within Donnan approximation
In this appendix, we derive a close-form expression for the conductivity of DNA-blocked pores confining the monovalent symmetric electrolyte KCl. In strongly confined -Hemolysin pores, correlation effects resulting from the inhomogeneous screening of the electrolyte is dominated by pronounced image-charge forces. Thus, our first approximation consists in neglecting the solvation potentials and in Eq. (18). As a further approximation, we replace the Boltzmann factor containing the image charge potential by its average over the cross section of the nanopore, and cast the conductivity in the form
| (26) |
where we introduced the partition coefficient taking into account exclusively the dielectric exclusion of ions
| (27) |
To progress further, we will compute the external potential in Eq. (26) within a Donnan potential approximation. To this aim, we split the potential into a constant Donnan potential and a non-uniform correction,
| (28) |
Injecting the ansatz (28) into the generalized PB equation (1), linearizing the latter in the potential , and replacing again the Boltzmann factor including the image charge potential by its average in Eq. (27), one obtains
| (29) |
Neglecting first the inhomogeneous part of the potential in Eq. (A), i.e. setting and integrating the remaining terms over the cross section of the pore, the Donnan potential follows as
| (30) |
with the auxiliary parameter
| (31) |
Solving now the differential equation (A) with the electrostatic boundary conditions and , the inhomogeneous part of the potential follows in the form
| (32) |
with the integration constants
| (33) | |||||
| (34) |
and the auxiliary parameter . Substituting into Eq. (26) the potential (28) with the components given by Eqs. (30) and (32), linearizing the result in the potential correction , and carrying out the integral over the pore, one obtains after some algebra the result (20) of the main text.
References
- (1) Kasianowicz, J. J.; Brandin, E.; Branton, D.; Deamer, D.W. Characterization of individual polynucleotide molecules using a membrane channel. Proc. Natl. Acad. Sci. U.S.A 1996, 93, 13770-13773.
- (2) Meller, A.; Nivon, L.; Branton, D. Voltage-Driven DNA Translocations through a Nanopore. Phys. Rev. Lett. 2001, 86, 3435.
- (3) Bonthuis, D. J.; Zhang, J.; Hornblower, B.; Mathé, J.; Shklovskii, B. I.; Meller, A. Self-energy-limited ion transport in subnanometer channels. Phys. Rev. Lett. 2006, 97, 128104.
- (4) Astier, Y.; Braha, O.; Bayley, H. Toward single molecule DNA sequencing: direct identification of ribonucleoside and deoxyribonucleoside 5’-monophosphates by using an engineered protein nanopore equipped with a molecular adapter. J. Am. Chem. Soc. 2006, 128, 1705-1710.
- (5) Clarke, J.; Wu, H. C.; Jayasinghe, L.; Patel, A.; Reid, S.; Bayley, H. Continuous base identification for single-molecule nanopore DNA sequencing. Nature Nanotech. 2009, 4, 265-270.
- (6) Derrington, I. M.; Butler, T. Z.; Collins, M. D.; Manrao, E.; Pavlenok, M.; Niederweis, M.; Gundlach, J. H. Nanopore DNA sequencing with MspA. Proc. Natl. Acad. Sci. U.S.A 2010, 107, 16060-16065.
- (7) Chang, H.; Kosari, F.; Andreadakis, G.; Alam, M. A.; Vasmatzis, G.; Bashir, R.; DNA-mediated fluctuations in ionic current through silicon oxide nanopore channels. Nano Lett. 2004, 4, 1551-1556.
- (8) Storm, A. J.; Chen, J. H.; Zandbergen, H. W.; Dekker, C. Translocation of double-strand DNA through a silicon oxide nanopore. Phys. Rev. E 2005, 71, 051903.
- (9) Smeets, R. M. M.; Keyser, U. F.; Krapf, D.; Wue, M.-Y.; Dekker, N. H.; Dekker, C. Salt dependence of ion transport and DNA translocation through solid-state nanopores. Nano Lett. 2006, 6, 89-95.
- (10) Liu, H.; He, J.; Tang, J.; Liu, H.; Pang, P.; Cao, D.; Krstic, P.; Joseph, S.; Lindsay, S.; Nuckolls, C. Translocation of single-stranded DNA through single-walled carbon nanotubes. Science 2009, 327, 64-67.
- (11) Tsutsui, M.; Taniguchi, M.; Yokota, K.; Kawai, T. Identification of single nucleotide via tunnelling current. Nature Nanotech. 2010, 5, 286-290.
- (12) Firnkes, M.; Pedone, D.; Knezevic, J.; Döblinger, M.; Rant, U. Electrically facilitated translocations of proteins through silicon nitride nanopores: conjoint and competitive action of diffusion, electrophoresis, and electroosmosis. Nano Lett. 2010, 10, 2162-2167.
- (13) Sung, W.; Park, P. J. Polymer Translocation through a Pore in a Membrane. Phys. Rev. Lett. 1996, 77, 783.
- (14) Ikonen, T.; Bhattacharya, A.; Ala-Nissila, T.; Sung, W. Unifying model of driven polymer translocation. Phys. Rev. E 2012, 85, 051803.
- (15) Ikonen, T.; Shin, J.; Sung, W.; Ala-Nissila, T. Polymer translocation under time-dependent driving forces: Resonant activation induced by attractive polymer-pore interactions. J. Chem. Phys. 2012, 136, 205104.
- (16) Ikonen, T.; Bhattacharya, A.; Ala-Nissila, T.; Sung, W. Influence of pore friction on the universal aspects of driven polymer translocation. Europhys. Lett. 2013,103, 38001.
- (17) Farahpour, F.; Maleknejad, A.; Varnikc, F.; Ejtehadi, M. R. Chain deformation in translocation phenomena. Soft Matter 2013, 9, 2750-2759.
- (18) Qiao, R.; Aluru, N. R. Scaling of Electrokinetic Transport in Nanometer Channels. Langmuir 2005, 21, 8972-8977.
- (19) Luan, B.; Aksimentiev, A. Electric and electrophoretic inversion of the DNA charge in multivalent electrolytes. Soft Matter 2010, 6, 243-246.
- (20) Ghosal, S. Electrophoresis of a polyelectrolyte through a nanopore. Phys. Rev. E 2006, 74, 041901.
- (21) Ghosal, S. Effect of Salt Concentration on the Electrophoretic Speed of a Polyelectrolyte through a Nanopore. Phys. Rev. Lett. 2007, 98, 238104.
- (22) Keijan, D.; Weimin, S.; Haiyan, Z.; Xianglei, P.; Honggang, H. Dependence of zeta potential on polyelectrolyte moving through a solid-state nanopore App. Phys. Lett. 2009, 94, 014101.
- (23) Antila, H. S.; Sammalkorpi, M. Polyelectrolyte Decomplexation via Addition of Salt: Charge Correlation Driven Zipper. J. Phys.Chem. B 2014, 118, 3226-3234.
- (24) Buyukdagli, S.; Ala-Nissila, T. Electrostatic correlations on the ionic selectivity of cylindrical membrane nanopores. J. Chem. Phys. 2014, 140, 064701.
- (25) Miles, G.; Cheley, S.; Braha, O.; Bayley, H. The staphylococcal leukocidin bicomponent toxin forms large ionic channels. Biochemistery 2001, 40, 8514-8522.
- (26) Gu, L. Q.; Bayley. H. Interaction of the noncovalent molecular adapter, beta-cyclodextrin, with the staphylococcal alpha-hemolysin pore. Biophys. J. 2000, 79, 1967-1975.
- (27) Lide, D. R. Handbook of Chemistery and Physics, 93th edition, 2012, CRC Press.
- (28) Noskov, S. Y. ; Im, W.; Roux, B. Ion Permeation through the -Hemolysin Channel: Theoretical Studies Based on Brownian Dynamics and Poisson-Nernst-Plank Electrodiffusion Theory. Biophys. J. 2004, 87, 2299-2309.
- (29) Buyukdagli, S.; Blossey, R. Dipolar correlations in structured solvents under nanoconfinement. J. Chem. Phys. 2014, 140, 234903.
- (30) Wanunu, M. Nanopores: A journey towards DNA sequencing. Physics of Life Reviews 2012, 9, 125-218.
- (31) Messina, R.; Holm, C.; Kremer, K. Effect of colloidal charge discretization in the primitive model. Euro. Phys. J. E 2001, 4, 363-370.
- (32) Messina, R. Image charges in spherical geometry: Application to colloidal systems. J. Chem. Phys. 2002, 117, 11062.
- (33) van der Heyden, F. H. J.; Stein, D.; Besteman, K.; Lemay, S. G.; Dekker, C. Exploring charge inversion at high salt using streaming currents. Phys. Rev. Lett. 2006, 96, 224502.
- (34) Pianegonda, S.; Barbosa, M. C.; Levin, Y. Charge Reversal of colloidal particles. Europhys. Lett. 2005, 71, 831.
- (35) Diehl, A.; Levin, Y. Smoluchowski equation and the colloidal charge reversal. J. Chem. Phys. 2006, 125, 054902.
- (36) dos Santos, A. P.; Diehl. A.; Levin, Y.; Colloidal charge renormalization in suspensions containing multivalent electrolyte. J. Chem. Phys. 2010, 132, 104105.
- (37) Levin, Y. Electrostatics of ions inside the nanopores and trans-membrane channels. Europhys. Lett. 2006, 76, 163.
- (38) Rafiee, F. M.; Golestanian, R. Electrostatic contribution to twist rigidity of DNA. Phys. Rev. E 2004, 69, 061919.
- (39) Kim, W. K.; Sung, W. How charge fluctuations modulate complexation of DNA around a histone cylinder ? Europhys. Lett. 2013, 104, 18002.
- (40) Tsonchev, S.; Coalson, R. D.; Duncan, A. Statistical Mechanics of Charged Polymers in Electrolyte Solutions: A Lattice Field Theory Approach. Phys. Rev. E 1999, 60, 4257.