Extracting molecular potentials from insufficient spectroscopic information
Abstract
We extend our recently developed inversion method to extract excited state potentials from fluorescence line positions and line strengths. We consider a previous limitation of the method arising due to insufficient input data in cases where the relatively weaker emission data are not experimentally available. We develop a solution to this problem by “regenerating” these weak transition lines via applying a model potential, e.g. a Morse potential. The result of this procedure, illustrated for the Q-branch emission from the lowest three vibrational levels of the B( state of LiRb, is shown to have an error of cm-1 in the classically allowed region and a global error of cm-1 for . The robustness of this procedure is also demonstrated by considering the statistical error in the measured line intensities.
I Introduction
Accurate potential energy surfaces (PES) are vital to producing meaningful results in the studies of chemical reactions and molecular dynamics. So far the most reliable source of information about PES of molecules has been quantum chemical computations, of the ab initio ab or semi-empirical type se1 ; se2 . For the simplest case of a diatomic molecules, it is relatively straightforward to construct the ground state potential energy curve (PEC) using experimental data available from laser induced fluorescence (LIF). In traditional LIF measurements, a molecule in an electronically excited state fluoresces to different rovibrational levels of the electronic ground state emitting light at different frequencies (determined by the energy levels) having different intensities (determined primarily by the Franck-Condon overlap). The frequency information directly reflects the vibrational and rotational energy levels of the electronic ground state and is used to construct the ground state potential using methods such as the Rydberg-Klein-Rees (RKR) method RKR . However, the information encoded in the intensity of the lines is seldom used to extract PECs. We had previously introduced a direct procedure for the extraction (”inversion”) of PEC from line strengths JPCL2010 ; JCP2011 ; JMS2011 assuming that data for all lines, however weak in intensity, was experimentally available. Extension of this inversion formula to multi-dimensional PES has already been performed JCP2011 . Several similar methods have been recently proposed to directly reconstruct the time-dependent wave packets Avisar ; Cian2012 . In practice, however, the weak lines are often lost in the noise (we refer to a line as weak when the intensity of the line is less than 2.5% of the strongest LIF line). Moreover, the response of the photon detectors (PMT, photodiodes etc.) may not be linear over the whole range of intensities introducing errors in the calibration of intensities. In this article, we overcome the limitation of our earlier proposal by regenerating some of the weak lines using a model potential and demonstrate that the information encoded in the intensity of the lines can be used to extract, with high accuracy, the potential energy curve for an excited electronic state.
We introduced in the previous reports JPCL2010 ; JCP2011 ; JMS2011 the ability to reconstruct the time-independent eigenstate wave functions, , of the target excited state by expanding this in terms of eigenstate wave functions, , of the known reference potential, e.g. the ground state. To ensure the robustness and accuracy of this procedure, the completeness condition,
| (1) |
including a summation over contributions from all ground state levels must be satisfied JMS2011 . However, such a requirement is not always satisfied when relatively weak transitions data, proportional to the terms in Eq. (1), are not available due to the limited signal-to-noise ratio. The accuracy of the extracted excited potentials becomes undermined when the completeness condition is not satisfied. In this study, we aim at providing a solution to this limitation by “regenerating” these missing transition data to regain the desired accuracy of the extraction procedure.
We choose the LiRb molecule for demonstrating our inversion method because of the high level of interest in ultracold polar LiRb molecules as borne out by several recent reports Xpot ; LiRbExp ; PADutta . Accurate potential energy curve for the electronic ground X state of the LiRb molecule is available from LIF measurements Xpot and, recently, the first twenty-one vibrational levels (v=0-20) of the excited B state were studies using Fluorescence Excitation Spectroscopy (FES) LiRbExp . We use the full data set of the latter study LiRbExp to construct the RKR potential up to the v=20 level, i.e. within the classically allowed region of the first twenty-one vibrational levels (see supplementary information for the RKR potential). We then derive the potential following the current method but using LIF from only the first three vibrational levels (v=0, 1 and 2) of the B state. We demonstrate the success of the current method by comparing the potential we extract (using very limited experimental data) with the potential derived using the conventional RKR method (which requires a much larger data set). We find that the vibrational energy levels calculated from the derived potential are accurate within cm-1 for v=0-2. We also show that our method can be used to determine the potential in the region for which no spectroscopic information is available provided that no local perturbations are present. For example, we show that the B potential derived using the current method, with LIF data only from v=0-2 as input, is able to reproduce the positions of all vibrational levels up to v=10 with an accuracy of cm-1. Such extensions of the potential to spectroscopically unexplored regions are very useful to experimentalists and theorists alike. For example, even for the relatively simple Li2 molecule, full spectroscopic information on the 1 state is not available although it is a molecule of significant interest Semczuk2013 . In the rest of the article, we first discuss the new inversion method we proposed and the extension that we make in order to make it more accurate for practical purposes, and then establish the accuracy and usefulness of the derived potential by comparing it to the well known RKR potential.

Theory: We first briefly review our inversion formula for diatomic potentials. In the diatomic case the potential is only dependent on the internuclear distance, denoted as Our objective is to extract an excited state potential , assuming that we know the ground state potential, using as input the positions and intensities of a set of emission (or absorption) spectral lines. A schematic illustration of the process is depicted in Fig. 1 for the special case of the LiRb B X emission.
Following Ref. JPCL2010 , when the Q branch emission data are used, we write in atomic units (for which ), as
| (2) |
In the above, are the observed transition energies and are the transition-dipole matrix elements between , the rovibrational states of the ground electronic potential, and , the rovibrational states of the excited state potential. The transition dipole matrix elements are defined as
| (3) |
where The last equality spells out the Franck Condon Approximation (FCA)FCA .
Results and discussion: In this study, we envision an experiment similar to Ref. LiRbExp . Our particular objective in this study is to use the fluorescence data from to extract the potential in the spectra range of . In order to avoid systematic error and demonstrate the capability of the proposed method, we numerically generate the fluorescent data based on the Frank-Condon overlaps between the wave functions of the B-state Bpot and the X-state Xpot potentials. The numerically generated emission spectrum is shown in Fig. 2, which contains both the line intensities and line positions of the B()X() band (this may be compared with the experimentally measured intensities reported in Fig. 2 of Ref. LiRbExp ) . Here, only , , and lines are used and plotted for , , and , respectively, which are greater than of the maximum signal to simulate the experimental condition.
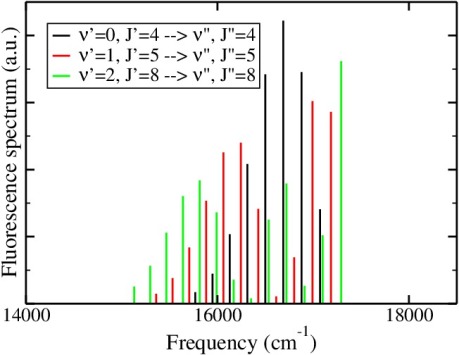
One way to extract the potential beyond the classical turning points of the state is to model the potential as an Morse potential with parameters chosen to match the energies of the lowest three vibrational states. Three such parameters for the Morse potential
| (4) |
are , and , where is the asymptote of the potential, is the dissociation energy and is a parameter dependent on the force constant. Note, the parameter is varied to match the line intensity profile, in Fig. 2. Such a Morse potential gives the correct description of the potential for , shown as the green dot-dash line in Fig. 3; but it starts to deviate significantly from the RKR potential at higher energies, shown as the red dashed line in Fig. 3. Such behavior is expected because the Morse potential is derived based on the line information of only the lowest three states.
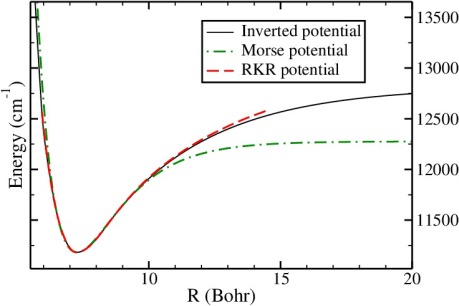
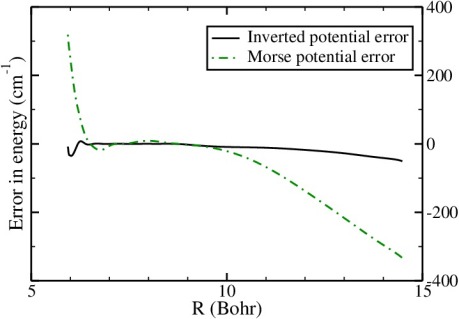
An alternative way to greatly extend the extracted potential beyond the classical turning points is to use the line intensities. The line intensities depend on the FC overlap between the ground and excited state wave functions. Since the wave function of a vibrational level can extend well beyond turning points into the classically forbidden region for that particular vibrational level, the FC overlap and hence the line intensity contain information regarding this classically forbidden region. However, such useful information is reflected by the weak transitions which are usually hard to distinguish from the background noise. Hence, we propose a method to compensate for these missing data by exploiting the Morse potential deduced earlier. Once the Morse potential is deduced from the line positions, we can compute the energy eigenfunctions, i.e. the rovibrational wave functions corresponding to the excited state potential , by solving the time-independent Schrödinger equation. These rovibrational wave functions can then be used to compute the Frank-Condon overlap and the relevant sign information JPCL2010 . These overlaps are used to “make up” for the missing/weak lines; the combination of the overlaps computed from using the Morse potential and those derived from the measured strong emission lines are used in Eq. (2) to yield the final form of the potential. Once the extracted potential is generated, we extrapolate the potential beyond a point where the density of the extracted wave function, in Eq. (2), becomes small.
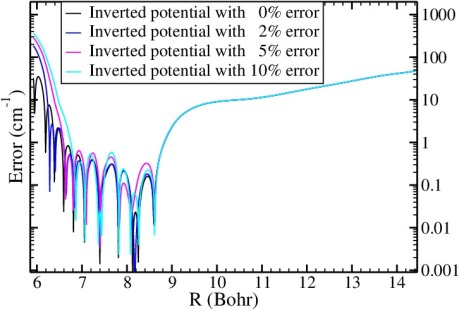
We use this method to extract the B() potential. The RMS errors of the inverted potentials, using the fluorescence data from , are given in Table 1 for the , , and regions. The final form of the extracted potential is plotted and shown as the black solid line in Fig. 3a; its R-dependent error compared with the RKR potential is shown in Fig. 3b. It is obvious that the extracted potential gives a very accurate description of the classical allowed region, ; in addition, this potential is fairly accurate in the classical forbidden region.
| Region | RMS error |
|---|---|
| VE | cm-1 |
| VE | cm-1 |
| VE | cm-1 |
| VE | cm-1 |
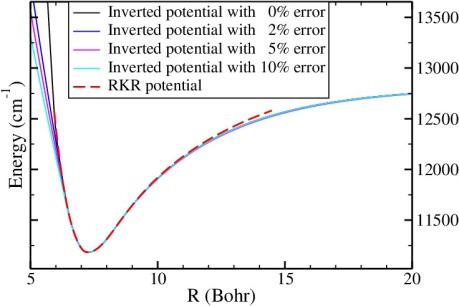
A question of major importance is the robustness of this procedure against common experimental sources of errors such as errors in the line intensities, which are directly related to the terms in Eq. (2). In this study, we focus on the statistical random errors and, to address this issue,e we introduced random errors to the data in Fig. 2 and repeated the extraction of the potentials in the presence of such errors. The errors in were generated in a random fashion of and rms errors relative to the average values. Note, the line intensities for the missing/weak lines deduced from the Morse potential are not randomized since they are based on the line positions, which are, in general, of high accuracy. In Fig. 4, we show the average B() numerical potential and its deviation from the RKR potential at different R values extracted from such data for the above magnitudes of errors. Fig. 4 demonstrates a remarkable robustness against inaccuracies in the experimental fluorescence data. The fluctuation in the magnitude of the errors in Fig. 4 as a function of the internuclear distance have been observed previously JPCL2010 . The origin of such an effect is still unknown: it has no obvious correlation with the nodal structure of the wave function. The RMS errors of the average B() numerical potential, using the fluorescence data from , are given in Table 2 for the , , and regions.
| Region | RMS error | RMS error | RMS error |
|---|---|---|---|
| for data set 1a | for data set 2b | for data set 3c | |
| VE | cm-1 | cm-1 | cm-1 |
| VE | cm-1 | cm-1 | cm-1 |
| VE | cm-1 | cm-1 | cm-1 |
| VE | cm-1 | cm-1 | cm-1 |
To summarize, we extend the recently developed inversion method for the accurate extraction of excited state potentials from fluorescence line positions and line strengths. We consider one of the limitation to our previous work arising when the relatively weaker emission data are not available. We develop a method to address this issue by “regenerating” these weak transition lines by first generating a model potential, e.g. a Morse potential based on the lowest few vibrational energy lines. We then numerically compute the first-order wave function to yield the Frank-Condon overlaps with those of the known ground state potential. This procedure, illustrated for the LiRb B(X() Q-branch emission from the lowest three vibrational levels, result in a cm-1 error in the classically allowed region and a global error of cm-1 for . We also demonstrate the robustness of this procedure by considering the statistical errors in the measured line intensities. We consider this method as an effective method to deduce accurate spectroscopic information in the previously unknown spectral region.
We are grateful for the discussion with Moshe Shapiro and Cian Menzel-Jones.
References
- (1) See, e.g., I. N. Levine, Quantum Chemistry, Prentice Hall, Englewood Cliffs, NJ, 1991 and references therein.
- (2) F. O. Ellison, J. Am. Chem. Soc. 85, 3540 (1963); J. C. Tully, J. Chem. Phys. 58, 1396 (1973); E. Steiner, P. R. Certain, P. J. Kuntz, J. Chem. Phys. 59, 47 (1973); C. W. Eaker, C. A. Parr, J. Chem. Phys. 64, 1322 (1976); B. Kendrick, R. T. Pack, J. Chem. Phys. 102, 1994 (1995); X. Li, D. A. Brue, G. A. Parker, J. Chem. Phys. 129, 124305 (2008).
- (3) P. J. Kuntz, J. Valldorf, Z. Phys. D 8, 195 (1988).
- (4) R. Rydberg, Z. Phys. 73, 376 (1931); R. Rydberg, Z. Phys. 80 514 (1933); O. Klein, Z. Phys. 76, 226 (1932); A. L. G. Rees, Proc. Phys. Soc. 59, 998 (1947).
- (5) X. Li, C. Menzel-Jones, and M. Shapiro, J. Phys. Chem. Lett. 1 3172 (2010); X. Li, C. Menzel-Jones, D. Avisar, M. Shapiro Phys. Chem. Chem. Phys. 12 15760 (2010); X, Li, M. Shapiro Israel J. Chem. 52 (5), 407 (2012).
- (6) X. Li and M. Shapiro, J. Chem. Phys. 134, 094113 (2011).
- (7) C. Menzel-Jones, X. Li, M. Shapiro, J. Mole. Spectro. 268 221 (2011).
- (8) D. Avisar, D. J. Tannor, Phys. Rev. Lett., 106, 170405 (2011);D. Avisar, D. J. Tannor, Faraday Discuss.,153, 131 (2011); D. Avisar, D. J. Tannor, J. Chem. Phys. 136, 214107 (2012).
- (9) C. Menzel-Jones, and M. Shapiro, J. Phys. Chem. Lett., 3 3353 (2012); C. Menzel-Jones, and M. Shapiro, J. Phys. Chem. Lett., 4 3083 (2013).
- (10) M. Ivanova, A. Stein, A. Pashov, H. Knöckel, and E. Tiemann, J. Chem. Phys. 134, 024321 (2011)
- (11) S. Dutta, A. Altaf, D.S. Elliott, Y. P. Chen, Chem. Phys. Lett. 511 7, (2011).
- (12) S. Dutta, D. S. Elliott, Y.P. Chen, Euro. Phys. Lett. 104 63001 (2013); S. Dutta, J. Lorenz, A. Altaf, D. S. Elliott, Y.P. Chen, Phys. Rev. A, 89 020702 (2014).
- (13) M. Semczuk, et al., Phys. Rev. A 87, 052505 (2013).
- (14) See, e.g., G. Herzberg, Molecular spectra and molecular structure, Vol. I. Spectra of diatomic molecules (Van Nostrand Reinhold, New York, 1950)
- (15) The RKR potential is generated based on the experiment done in Ref. LiRbExp and also provided in the supplemental material.