11email: n.clyne1@nuigalway.ie, matt.redman@nuigalway.ie 22institutetext: Jodrell Bank Centre for Astrophysics, School of Physics and Astronomy, University of Manchester, Oxford Road, Manchester M13 9PL, UK 33institutetext: Department of Physics and Astronomy, University College London, Gower Street, London WC1E 6BT, UK
VLT observations of the asymmetric Etched Hourglass Nebula, MyCn 18
Abstract
Context. The mechanisms that form extreme bipolar planetary nebulae remain unclear.
Aims. The physical properties, structure, and dynamics of the bipolar planetary nebula, MyCn 18, are investigated in detail with the aim of understanding the shaping mechanism and evolutionary history of this object.
Methods. VLT infrared images, VLT ISAAC infrared spectra, and long-slit optical Echelle spectra are used to investigate MyCn 18. Morpho-kinematic modelling was used to firmly constrain the structure and kinematics of the source. A timescale analysis was used to determine the kinematical age of the nebula and its main components.
Results. A spectroscopic study of MyCn 18’s central and offset region reveals the detailed make-up of its nebular composition. Molecular hydrogen, atomic helium, and Bracket gamma emission are detected from the central regions of MyCn 18. ISAAC spectra from a slit position along the narrow waist of the nebula demonstrate that the ionised gas resides closer to the centre of the nebula than the molecular emission. A final reconstructed 3-D model of MyCn 18 was generated, which provides kinematical information on the expansion velocity of its nebular components by means of position-velocity (P-V) arrays. A kinematical age of the nebula and its components were obtained by the P-V arrays and timescale analysis.
Conclusions. The structure and kinematics of MyCn 18 are better understood using an interactive 3-D modelling tool called shape. A dimensional and timescale analysis of MyCn 18’s major components provides a possible mechanism for the nebula’s asymmetry. The putative central star is somewhat offset from the geometric centre of the nebula, which is thought to be the result of a binary system. We speculate that the engulfing and destruction of an exoplanet during the AGB phase may have been a key event in shaping MyCn 18 and generating of its hypersonic knotty outflow.
Key Words.:
Planetary nebulae: individual: MyCn 18 – Stars: binaries: general – Stars: kinematics and dynamics – Stars: winds, outflows – Stars: circumstellar matter – Infrared: general1 Introduction
MyCn 18 (RA=13h39m35.07s, Dec=67d22m51.7s (J2000); PN G307.504.9; IRAS 133596707) is a beautiful example of an extremely tightly waisted bipolar planetary nebula (PN). The famous HST images of Sahai et al. (1999), who christened it the Etched Hourglass Nebula, show the remarkable degree of symmetry in the nebula and also the clear offset of the central star along the nebular minor axis. The question of how the diverse range of PNe shapes are produced from what is presumably a spherical AGB star (Soker & Harpaz, 1992; Trammell et al., 1995; Sahai & Trauger, 1998; Sahai et al., 2009) continues to intrigue astronomers and the extreme case of MyCn 18 provides a stern test of any evolutionary model.
The tight-waisted appearance of MyCn 18 led Corradi & Schwarz (1993) to compare it to two apparently similar symbiotic nebulae He2-104 and BI Cru. However, they concluded that, other than the striking morphological similarity, there was no other evidence pointing to MyCn 18 being a post-PN symbiotic nebula and that it should tentatively be classed as a young PN, on the basis of its position in optical and near-IR diagnostic diagrams.
Bryce et al. (1997) discovered hypersonic (500 km s-1) knots situated on either side of the main hourglass nebula, approximately along the polar axis. It is interesting to note that these knots are travelling much faster than the expansion velocity of the hourglass shell (50 km s-1). Such speeds are similar to those found by Corradi & Schwarz (1993) for the symbiotic nebulae He2-104 and BI Cru. O’Connor et al. (2000) demonstrated that the knots of MyCn 18 had a degree of point symmetry and that the radial speed of each knot increased linearly with its distance from the central star. They speculated that MyCn 18 might be morphologically related to the symbiotic nebulae.
The HST images of Sahai et al. (1999) revealed a wealth of structural detail in the main nebula, which appears to contain a second, inner, hourglass-shaped structure, as well as two central rings. Each of these structures has a slightly different geometric centre, none of which are coincident with the central star. Dayal et al. (2000) showed that the nebula is generally density-bounded except in the region of the hourglass waist. They also inferred that the etched arcs on the hourglass walls might indicate temporal variations in the mass-loss rate of the progenitor star. Bains et al. (2002) found a similar geometric offset between the nebula and the central star when observing at radio wavelengths. Their spectral index maps show that the nebular core appears to be more optically thick than the lobe regions at lower frequencies (1384 and 4800 MHz). The relatively low brightness temperatures were interpreted as a result of beam dilution of a clumpy structure inferred a filling factor of 0.15 at 1384 MHz. Their estimated total ionised mass of the nebula is in the region 0.2–0.8 at a distance of 2.4 kpc.
Whitelock (1985) presented JHK photometry for a sample of southern PNe and showed that the major source of the near-IR radiation from MyCn 18 is nebular in origin. Molecular hydrogen has been detected in many PNe (Hora & Latter, 1996; Kastner et al., 1998; Likkel et al., 2000; Kastner et al., 2000; Davis et al., 2003; Aleman & Gruenwald, 2004; Eyermann & Speck, 2004; Matsuura & Zijlstra, 2005; Hora et al., 2005; Wang et al., 2006; Matsuura et al., 2007; Sellgren et al., 2008; Ramos-Larios et al., 2008; Tenenbaum et al., 2009), and given that MyCn 18 is believed to be ionisation-bounded at its waist, it is likely that any available molecular hydrogen will be found around this region. Sahai et al. (1999) pointed out that the expected K-band photospheric flux (derived from optical photometry) is about half of the observed value, indicating that the central star is probably surrounded by hot dust in the waist region.
The hourglass shape of MyCn 18 is possibly formed by a fast, tenuous wind expanding within a more slowly expanding cloud, which has a higher density near its equatorial region than near its polar regions. This snow-plow-like process was first introduced by Kwok et al. (1978), as the interacting stellar winds (ISW) theory of nebular formation, and later as the generalised interacting stellar winds (GISW) model (Kwok, 1982; Balick, 1987). The HST images of MyCn 18 reveal both intricate patterns (etchings) along its nebular walls and weak emission with filamentary components just beyond the walls. MyCn 18 is a good example of an extreme bipolar PN with strong asymmetry or axi-symmetry. This bipolar shape might also be the result of the formation of a dense equatorial accretion/excretion disk or of high-velocity collimated outflows, as discussed by Sahai et al. (1999).
The mechanism for generating extreme deviations from spherical symmetry in planetary nebulae remains unsettled. Models and explanations range from single stars with particular magnetic fields arrangements (Chevalier & Luo, 1994; García-Segura et al., 1999; Pascoli & Lahoche, 2008; Vlemmings, 2011; Jordan et al., 2012; Vlemmings, 2012) to the view that almost all planetary nebulae are caused by binary companions (Yungelson et al., 1993; Soker & Rappaport, 2001; De Marco, 2009; Jones et al., 2010; Douchin et al., 2012; Jones et al., 2012). The discovery that hot Jupiter exoplanets are common around stars means that large planetary mass companions can also be considered amongst the shaping mechanisms (Nordhaus & Blackman, 2006). Clearly it is of interest to search for a binary star in MyCn 18. The identification of the central ionising star in MyCn 18 appears quite firm though it is clearly noticeable that the star is significantly offset from the geometrical centre of the outer and inner hourglass, as identified by Sahai et al. (1999).
In order to further our understanding of this striking nebula we have carried out an infra-red and spectroscopic study of MyCn 18 and used a 3-D morpho-kinematic code called shape111shape is accessible online at http://www.astrosen.unam.mx/shape/ (Steffen et al., 2011) to carefully reproduce the structural and spectral features of the nebula.
The paper is organised as follows: The observational data are presented in Sect. 2. Analyses of each topic are presented in Sect. 3. This section includes: infra-red imaging, spectroscopic analysis, the modelling of optical kinematic data using shape, a geometric dimensional analysis of the outer and inner regions of the nebula, and a timescale analysis of the nebula’s three major components. A discussion and conclusions are found in Sect. 4 and Sect. 5, respectively.
2 Observations and results
2.1 Infra-red images
A series of infra-red images of MyCn 18 were obtained in photometric conditions on 27 May 2003 using NAOS-CONICA (NACO: Rousset et al., 2003; Lenzen et al., 2003) on ESO’s VLT(UT4) telescope. NACO was used with the S27 camera (0.027 arcsec per pixel and a field of view of ).
Continuum images were obtained using the J, H, and Ks broadband filters. The NB_2.12 filter was used to image the (1-0) S(1) emission line and the filter was used to look for evidence of CO 2.295 m emission. The filters, exposure times, and image resolution are detailed in Table 1.
The central star of MyCn 18 [ = 14.9 and spectral type Of(C); as noted by Sahai et al. (1999) and Lee et al. (2007), respectively] was used as the AO reference star, with optical wavefront sensing via the VIS dichroic. Optical seeing at the observatory was 0.4–1.1 arcsec FWHM during the observed period. The observations were taken with the NACO_img_obs_FixedSkyOffset template using a 4 arcsec square jitter box and sky offset position 35 arcsec to the NE of the target position.
| Filter | (s) | Resolution | ||
|---|---|---|---|---|
| J | 1.265 | 0.25 | 1100 | |
| H | 1.66 | 0.33 | 1100 | |
| Ks | 2.18 | 0.35 | 1600 | |
| 2.122 | 0.022 | 3720 | ||
| 2.30 | 0.06 | 540 |
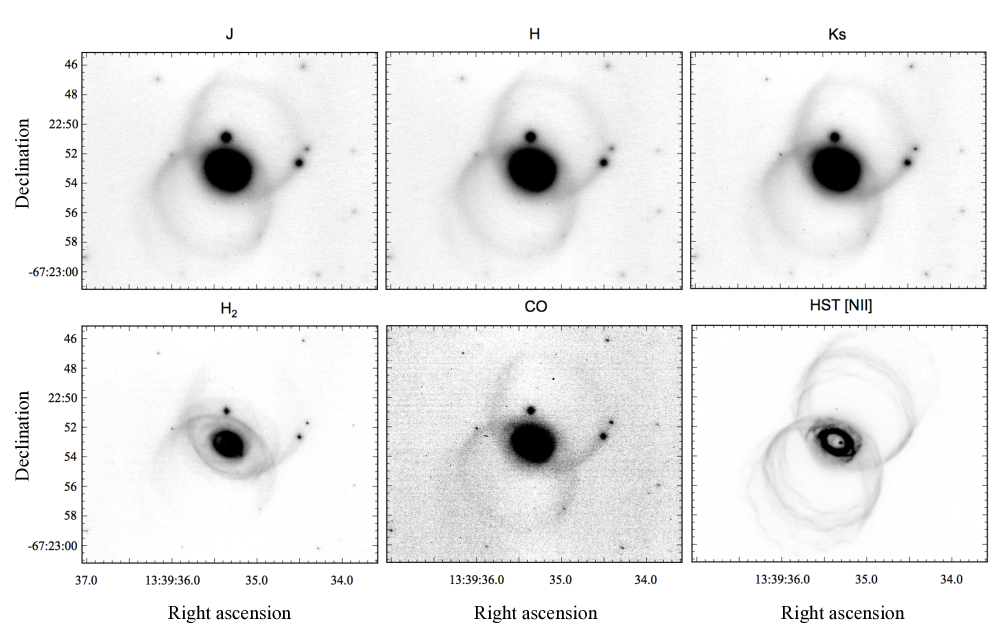
The data were reduced using a tailored version of the ORAC-DR pipeline (Cavanagh et al., 2008) invoking the UKIRT imaging recipes (Currie & Cavanagh, 2004), which had been adapted to account for NACO’s tiny point-spread function. The final image from each filter was then aligned with the Ks image. These images are shown in Fig. 1, along with the narrowband [N ii]6584 Å HST image (Sahai et al., 1999), which has been regridded to the NACO pixel scale and aligned with the Ks image for consistency (The resolution of this image is about ). Note that neither the nor the CO images have been continuum subtracted. The filter, used for the observations, produces a very irregular point spread function, and due to this irregularity we were unable to create a satisfactory continuum subtracted image. The stretch levels used for all images in both Fig. 1 and 2 are tabulated in Table 2.
The images in both Figs. 1 & 2 have been reduced in the standard way, except that no flux calibration has been applied. Each image represents a reduced mean frame uncorrected for exposure time. The standard stars GSPC P550–C (RA=10h33m51.9s, Dec=04d49m05.0s) and GSPC S889-E (RA=22h02m05.73s, Dec=01d06m01.0s) were observed with the J, H, and Ks filters but we were unable to derive an accurate flux calibration, however, the results were broadly compatible with the overall calibrations found in Whitelock (1985).
The three continuum images in Fig. 1 all show faint relatively smooth emission from the edges of the main hourglass shell, together with a much brighter central region. The image in contrast shows a much clearer thin, filamentary eye-shaped feature surrounding the bright inner region. Although the image is not continuum subtracted, it is clear from the difference between it and the corresponding broadband Ks image that the eye-shaped feature is dominated by line emission.
| Fig | J | H | Ks | H2 | CO | N II |
|---|---|---|---|---|---|---|
| 1 | 0–20 | 0–20 | 0–16 | 0–15 | 0–10 | 0–800 |
| 2 | 0–200 | 0–200 | 0–160 | 0–60 | 0–100 | 0–1600 |
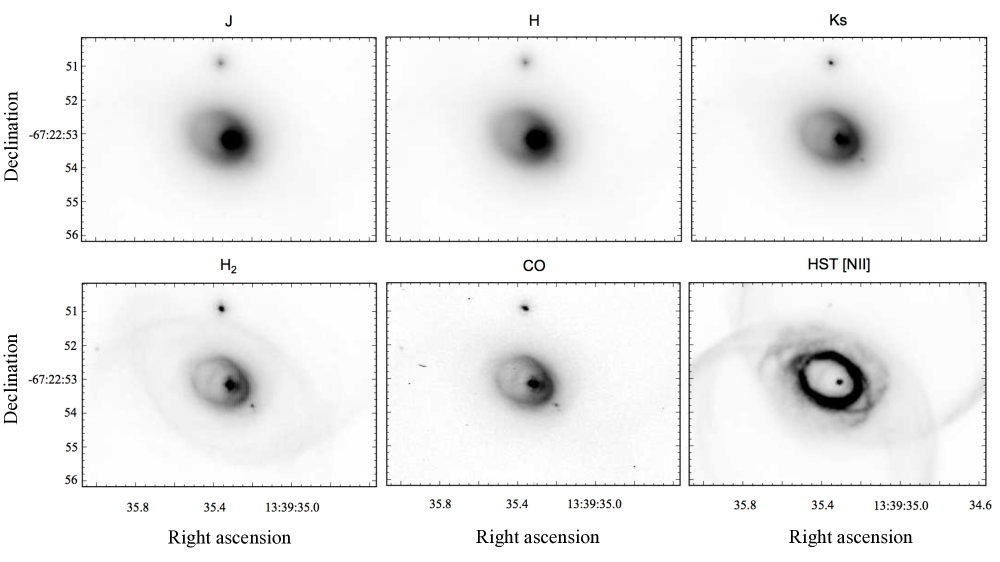
The bright central region of each image is reproduced in Fig. 2 at higher contrast to show the structure of the inner part of the nebula. Note that Figs. 1 and 2 are framed to progressively highlight the hourglass shape into the very central region of the eye. The broadband images again show a relatively smooth structure, dominated by an egg-shaped ring that is much brighter at its western, pointed end, just southwest of the central star. This ring was identified in the HST WFPC2 narrow-band optical images of Sahai et al. (1999) as ring 1. The central star is offset towards the narrow end of the ring, as noted by Sahai et al. (1999). An inner loop of emission corresponding to ring 2 is also apparent, particularly in the image.
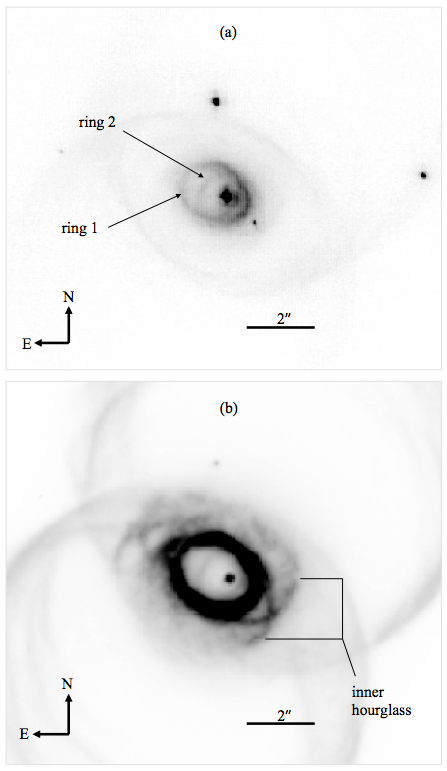
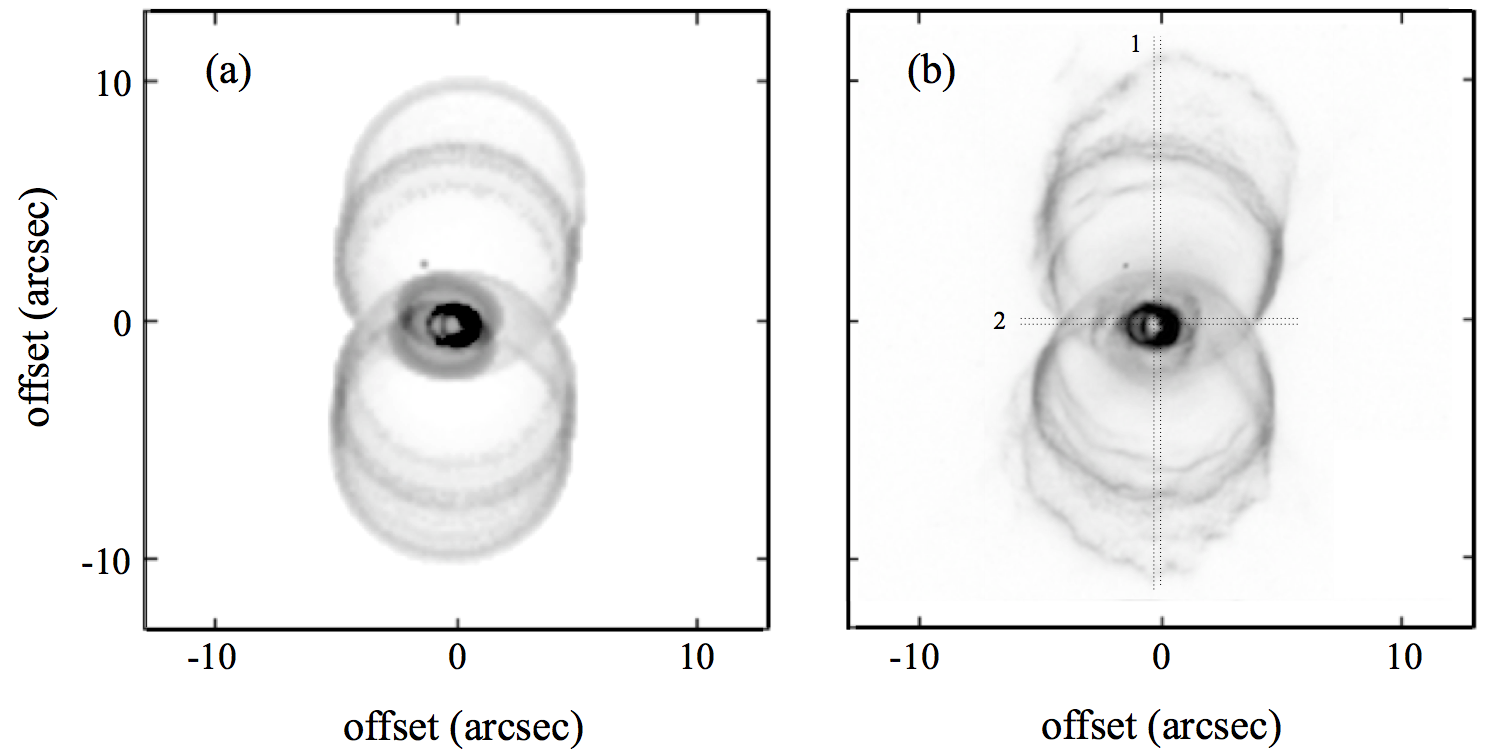
Fig. 3 shows the central region of MyCn 18 in (a) , identifying ring 1 and ring 2, and (b) in [N ii]6584 Å, revealing the nebula’s inner hourglass. Ring 1 is defined as the waist of the outer hourglass and ring 2 appears to be part of the inner hourglass, which is a higher excitation ring due to its close proximity with the central star (Sahai et al., 1999).
2.2 Infra-red spectroscopy
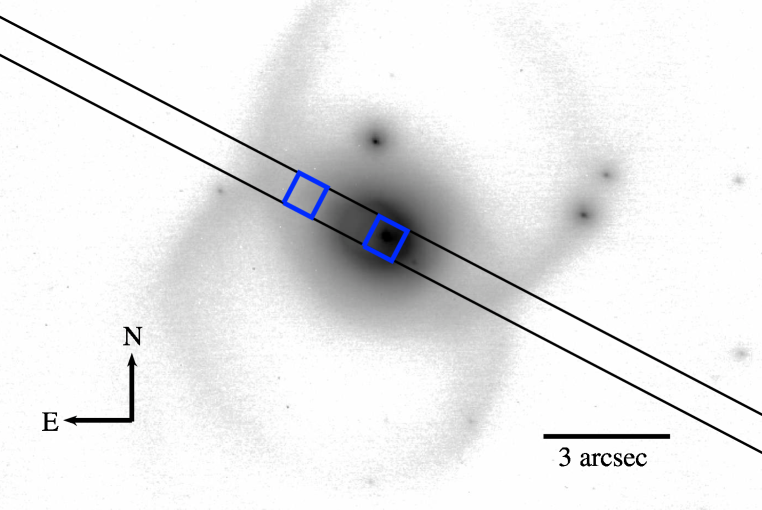
Two-micron spectra of MyCn 18 were obtained with ISAAC (Moorwood et al., 1999) at the ESO Very Large Telescope (VLT) on 29 April 2004. An ISAAC short wavelength band was equipped with the Rockwell array with pixel scale 0.145 arcsec in imaging mode and 0.147 arcsec in spectroscopic mode. The weather was clear, optical seeing varied between 0.92–1.37 arcsec and seeing at the K-band was approximately 0.75 arcsec during the acquisition of the target. The slit was placed along the minor axis of the nebula at a PA of 62.45∘ to the east (see Fig. 4) and the spatial scale was 0.15 arcsec per pixel. Low spectral resolution (LR) mode was used, and the slit width was 0.8 arcsec, resulting in a wavelength resolution () of 750. The telescope was nodded by 60 arcsec along the slit to cancel the sky background. Jitter was used along the slit to minimise the influence of hot pixels. An exposure of twilight sky was used for flat-fielding. The exposure time was 120 s 16 on source.
The approximate ISAAC slit location is shown in Fig. 4 and the orientations of the slit are from northeast to southwest, which follow from top to bottom in the figure. The two boxes across the ISAAC slit represent the regions of the centre and outflow spectrum. The data were reduced using idl and the eclipse package. The telluric standard was the G2V star Hip 053690; Pickles (1998) calculated the spectrum of this star. The wavelength calibration is based on exposures of an Ar+Xe arc lamp with the same wavelength setting as the target observations. Additionally, OH skylines (Oliva & Origlia, 1992; Maihara et al., 1993; Rousselot et al., 2000) and telluric absorption lines (Hadrava, 2006) were used for the fine adjustment of the wavelength calibration.
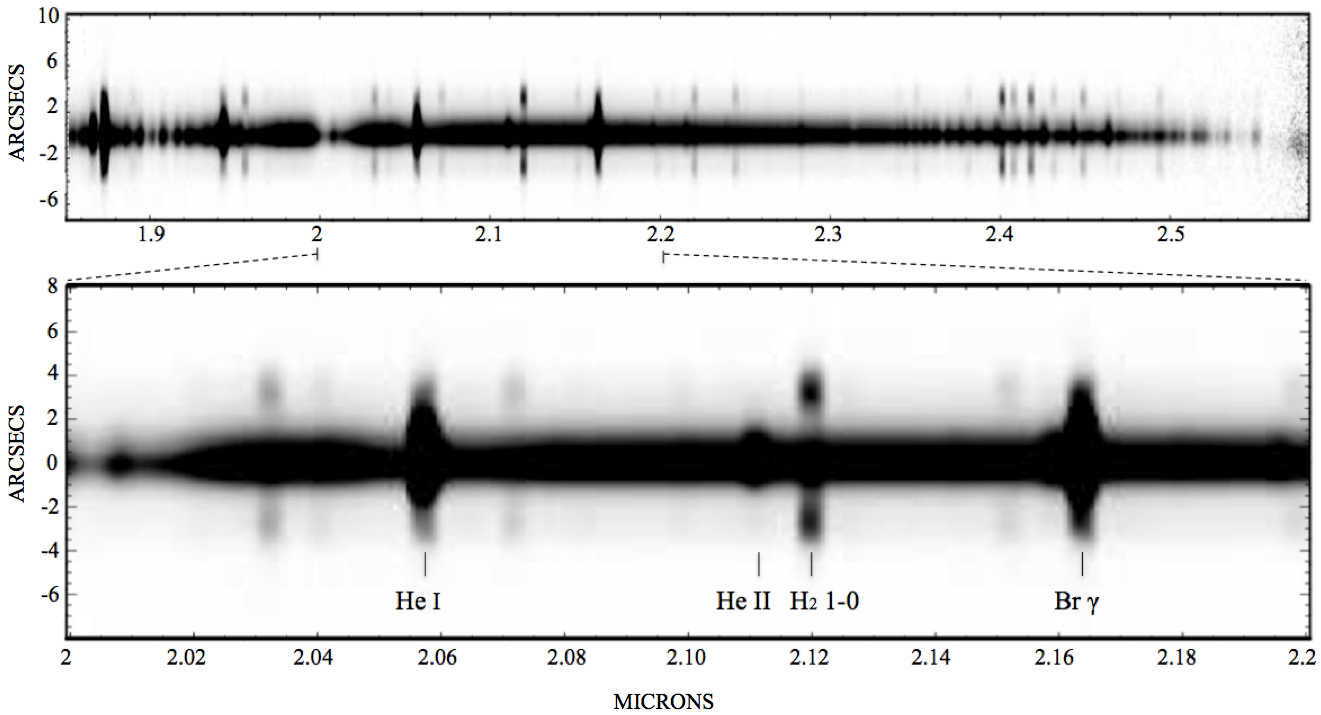
The 2-D spectrum, shown at high contrast in Fig. 5, has been binned by 5 pixels along the slit length and indicates the most prominent atomic and molecular emission lines. The spectrum is seen to contain both continuum emission from the central region of MyCn 18 and line emission from the surrounding nebular shell. A spatially extended nebular continuum is clearly shown to be about 2 arcsec in extent and slightly offset with respect to the nebula’s geometric centre. The continuum emission has a faint extension to the east of the array. Two types of emission lines can be identified: one which is brightest in the core region and the other which is relatively faint in the core region but is brighter at each end, where the slit crosses the eastern and western edges of the nebula. This spectrum shows the spatial extent of , He, and Br lines but is not corrected with telluric standard.
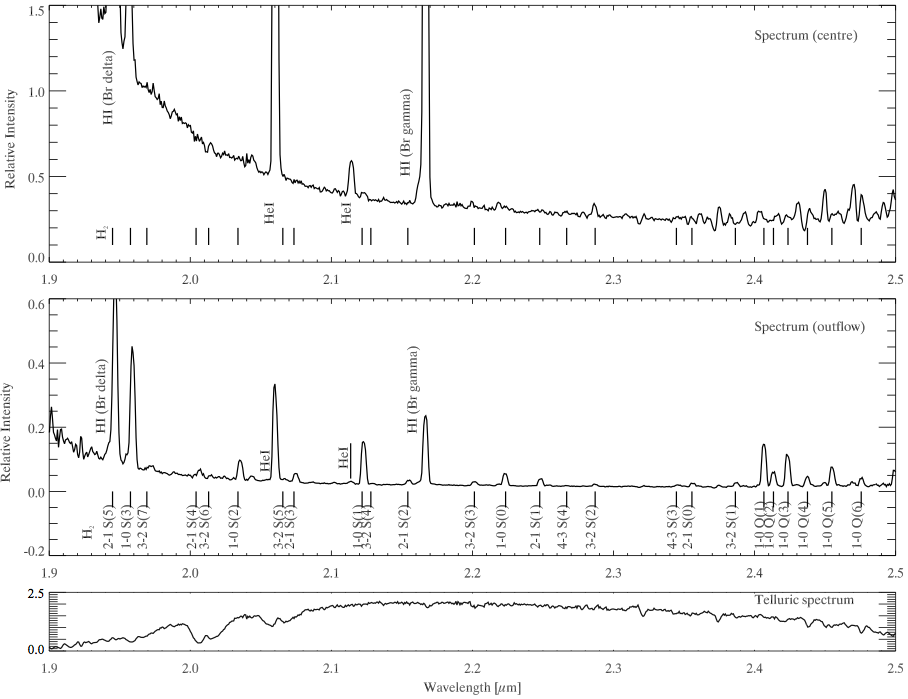
In Fig. 6, a K-band spectrum of MyCn 18 extracted from the central region is compared to a spectrum extracted from the nebular outflow region. The identifications of representative lines are also marked in the figure. In the central region, continuum is dominant, and both the central star and free-free and bound-free contribute to this continuum, as found in the images. This continuum contributes to approximately 8% of the total in-band flux in the Ks-band. There are strong H (Br and Br ) and He recombination lines. Two H2 lines can be identified at 1.95 m 1–0 S(3) and 2.12 m 1–0 S(1). The identifications of the lines beyond 2.35 m are uncertain, but some H2 lines are present. In contrast, a forest of H2 lines is found in the outflow region, in addition to the H and He recombination lines.
The spectra shown in Fig. 5 and 6 demonstrate the spatial variations of the spectra across the object. The spectrum at the central region shows a strong underlying continuum across K-band spectra, particularly below the 2.2 m wavelength. Strong H and He recombination lines are present in this region but lines are undetected. In contrast, the spectrum at the offset position, near the inner hourglass, is line dominated with some continuum. Here, He recombination lines are as strong as H recombination lines, but notably, much stronger lines are detected across this region. These spectra reveal the dominant contributors to the image (from Fig. 1) taken by the NACO. In the central region, there is a bright core found in the NB_2.122 image but this is due to continuum rather than . This image shows clear bipolar shaped outflows, which outline the hourglass shape and this part is likely to be formed by emission lines. CO has a band of lines near/at the 2.3 m line, which correspond to a large number of P- and R-branch vibrational-rotational transitions.
2.3 Optical Images & Spectroscopy
To aid our analysis of MyCn 18 we obtained optical images from the Hubble Legacy Archive444Based on observations made with the NASA/ESA Hubble Space Telescope, obtained from the data archive at the Space Telescope Institute. STScI is operated by the association of Universities for Research in Astronomy, Inc. under the NASA contract NAS 5-26555. and ESO Archive, as well as MES and EMMI long-slit spectroscopic data.
Position-velocity (P-V) arrays of [N ii]6584 Å line profiles from long-slit spectra were obtained along the major and minor axis of MyCn 18. These long-slit spectra were not flux calibrated and they have not been relatively calibrated either because we are primarily interested in the kinematics. Both sets of spectra are displayed with a linear scale.
The major nebula axis long-slit spectra were taken with the Anglo-Australian telescope (AAT) using the Manchester Echelle Spectrometer (MES; Meaburn et al., 1984) between 26 and 28 March 1999. A slit width of 150 , which is equivalent to 1 arcsec, was used and limits the resolution in the spectral direction to be 11 km s-1. In the spatial direction, seeing was about 1 arcsec. The minor nebula axis long-slit spectra were obtained using ESO’s Multi-Mode Instrument (EMMI; Dekker et al., 1986), which was attached to the ESO New Technology telescope (NTT), and spectra were taken on 23 March 1994. The seeing conditions are the same for those of the AAT, described above. For additional details on the MES and EMMI spectra, see O’Connor et al. (2000) and Corradi & Schwarz (1993), respectively.
3 Analysis
3.1 Infra-red images
The images were analysed, using iraf555IRAF is distributed by the National Optical Astronomy Observatories, which are operated by the Association of Universities for Research in Astronomy, Inc., under cooperative agreement with the National Science Foundation., for possible companion stars to the nebula’s primary. There is significant extinction and diffuse continuum emission to the centre of MyCn 18 (Bryce et al., 1997), which makes it difficult to resolve any close binary companions to the primary star. We believe the star located just SW of the central star in Fig. 3a has not been observed before. However, this star appears unlikely to be a candidate for association with the primary of MyCn 18 since it lies 0.9 arcsec (2,900 AU for a 3.2 kpc nebula distance) from the central star. Given that there are two other stars in the field of Fig. 3 then this newly observed star is also probably a field star; even if it were a companion, at this distance from the central star, it would have no direct dynamical effect on the shaping of the nebula.
Infrared contouring was later performed in and around the central region to search for even closer binary candidates. The astronomical data processing software starlink (Disney & Wallace, 1982) and its kappa (Currie & Berry, 2000) package were used to carry out the contouring. The reduced images in the H and Ks bands, as well as that in , revealed some non-circular extension from the central star (see Fig. 3a). At first we thought this might be the result of a very close binary star, however, this non-point source appearance could be due to either (i) the aligning and co-adding of the images, (ii) poor psf as a result of adaptive optics, (iii) knotty emission from a recent ejection event or (iv) a line of sight star. Due to the large intensity of continuum surrounding the central star, it is not presently possible to distinguish further between these possibilities. Further high resolution observations of the central region would be required to reveal the nature of this source.
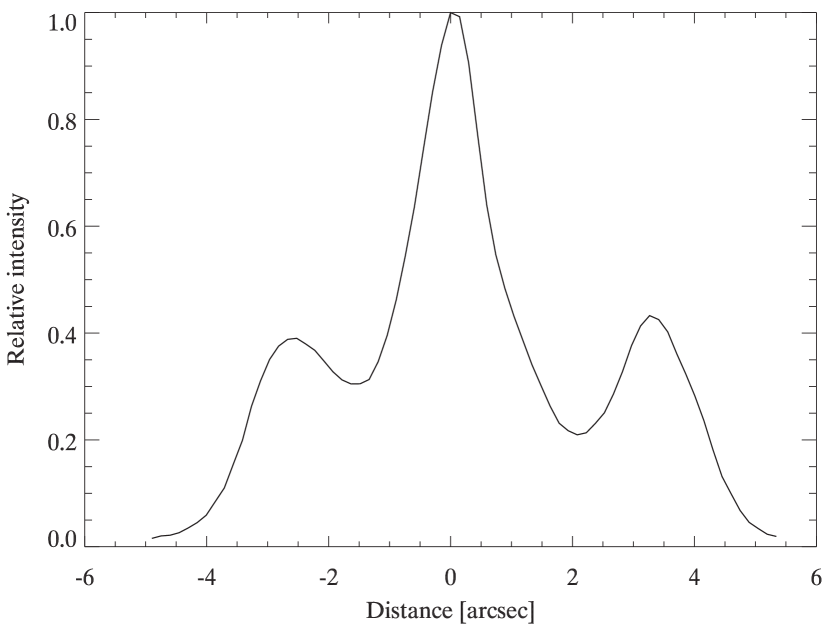
3.2 Spectroscopic analysis
There are prominent atomic recombination lines from the central region extending outwards beyond the main continuum band. The H2 lines are clearly different in spatial extent and peak at about arcsec from the star. Comparing this spatial cut to the images, it can be seen that the H2 emission comes from the cusps of the lenticular H2 feature, which is most likely the line-of-sight overlap of the two lobes of the hourglass. Sahai et al. (1999) noted that the expected K-band flux (from the star) is about half the level observed by Whitelock (1985) and suggested this may indicate the presence of hot dust in the equatorial region. Our spectra show that this excess emission can be explained instead by the strong free-free and atomic line emission from the compact ionised zone (Dayal et al., 1997; Koller & Kimeswenger, 2000; Volk, 2003; Ramos-Larios et al., 2012a). Silicates typically have a dust condensation temperature of 1000 K, therefore, the peak of the dust emission would appear at a longer wavelength (2.9 ) than what is observed in the spectra, which is actually . According to Corradi & Schwarz (1993), MyCn 18 peaks at about 60 m (48 K) and shows a typical double hump from its spectral energy distribution, indicating the presence of cool dust. Also, the light scattered by dust makes for an insignificant contribution to the nebula’s central emission as noted by Sahai et al. (1999).
The resulting spectrum is the product of the nebula intensity gradient with a stratified ionisation structure, in which the least ionised layers are found furthest from the central star. The infra-red spectroscopy shows clear ionisation stratification in that the He, H, and H2 lines are found progressively further from the central star into the putative surrounding molecular torus. The nebula is likely to be ionisation bounded in the equatorial direction but since the high-speed knots are ionised the nebula is more likely to be density bounded in the polar direction (Dayal et al., 2000; Bains et al., 2002).
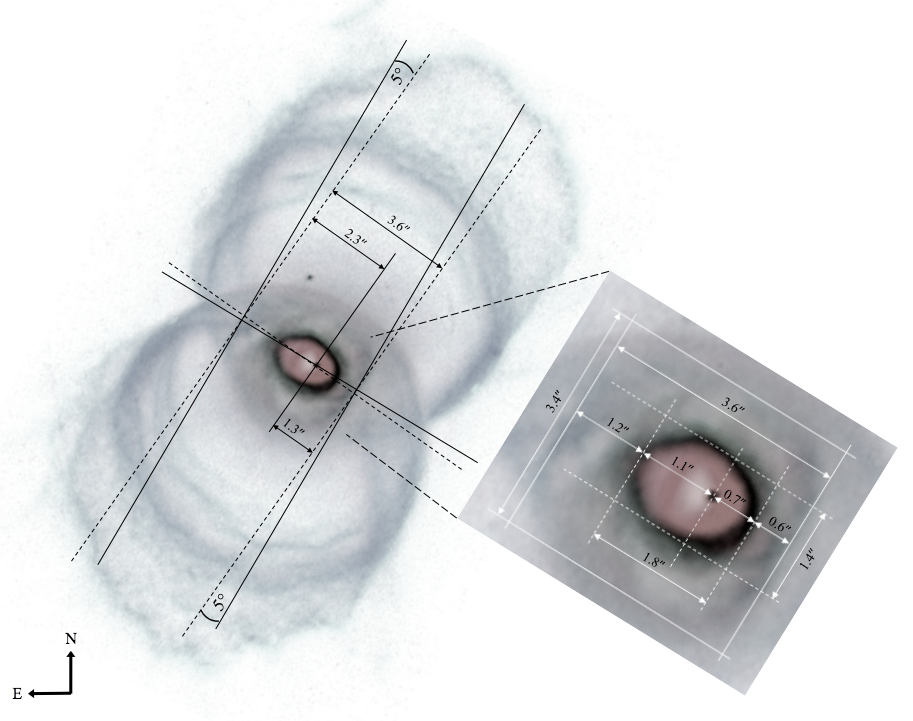
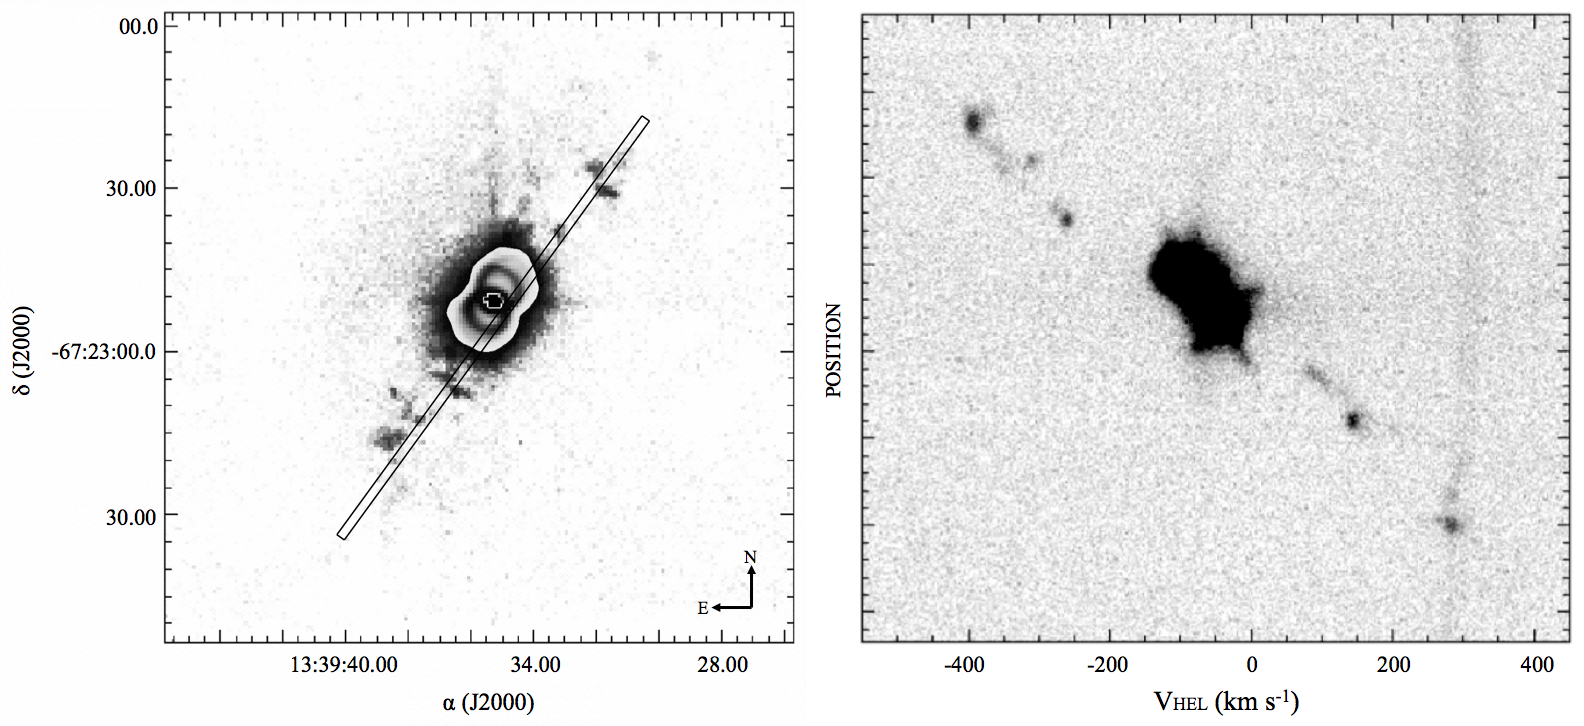
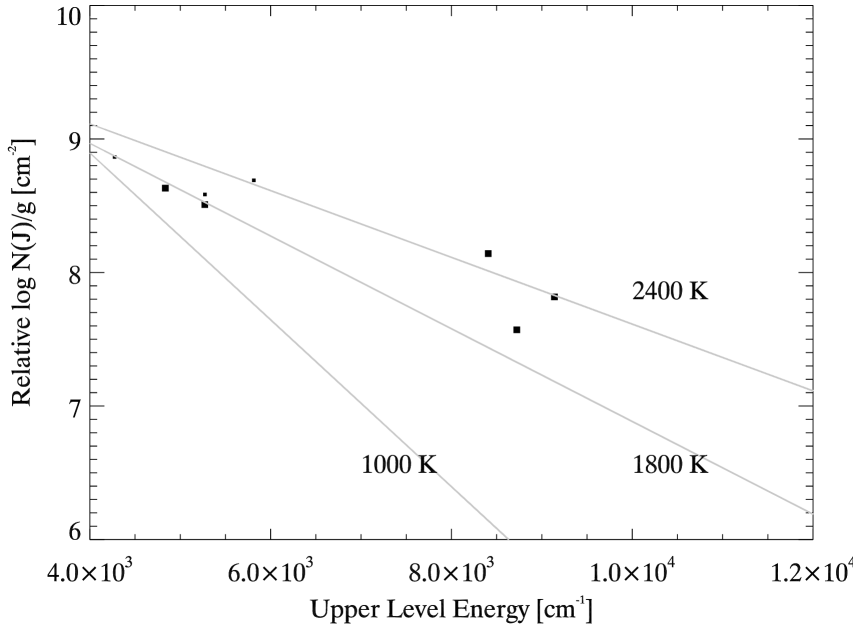
Fig. 7 shows the energy diagram of H2 lines in the outflow. The slopes, derived from the H2 lines, constrain the range of possible temperatures of the H2 emitting gas under the LTE assumption. This gives a temperature range of 1800–2400 K, though higher excitation lines may deviate from LTE (Matsuura et al., 2007). The H2 excitation temperature, estimated from rotation-vibrational lines, is as high as those estimated from similar lines of the Helix Nebula (1800 K; Matsuura et al., 2007) and the centre of NGC 6302 (1845 K; Davis et al., 2003) but much higher than temperatures estimated from rotation lines (below 1000 K; Cox et al., 1998; Bernard-Salas & Tielens, 2005). It appears that rotation-vibrational temperatures are always higher near the central region of PNe. This might require an extra heating mechanism such as UV excitation (Henney et al., 2007) or shock excitation of H2 (Burton et al., 1992).
The Ks band image in Fig. 2, which is dominated by the nebular continuum, shows an extent of about 2 arcsec across the central region. The spatial extent of the nebular continuum can also be readily seen in Fig. 5. Visually, it can be seen that the H2 1-0 line emission (at 2.12 ) is found closer to the continuum in the negative spatial (SW) direction than the positive spatial (NE) direction, as shown in Fig. 8. This corresponds with the asymmetry seen in the continuum images of Fig. 2.
3.3 Geometric and timescale analysis of MyCn 18’s nebular structures
The nebula has noticeable deviations from axial symmetry as illustrated in Fig. 9. The figure shows the relative offsets of the various features within the nebula. As shown, the central star is not centred on the nebula’s major axis and is clearly offset along the minor axis. The star is also offset from the centre of ring 1 and is closer to the centre of ring 2 (see Fig. 3a). A close observation of the inner hourglass shows a slight tilt of its structure with respect to the outer hourglass. The image on the right of Fig. 9 shows the relative offsets of the inner hourglass, the nebular waist (ring 1), and the central star with respect to the nebula’s geometric centre. In the case of the central star, it remains unclear as to why it is offset to the west of the nebular waist. An explanation of this offset may involve a binary companion.
In relation to MyCn 18’s hypersonic knotty outflow, shown in Fig. 10, the paths taken by the knots are not symmetric about the axis of symmetry of the nebula’s main hourglass (O’Connor et al., 2000). A closer inspection illustrates the scattering of the knots, with the northern cluster of knots found predominantly to the right of the main hourglass’ axis of symmetry, and conversely, the southern cluster positioned to the left of this axis. The knots appear better aligned with the inner hourglass’ axis of symmetry, thus supporting the hypothesis of a connection between these components.
The morphology and kinematics of MyCn 18 were better understood by applying timescales to each of its major components. These components include the main hourglass structure, the inner hourglass, and the high-speed interstellar knots. A distance of is routinely quoted for MyCn 18, which is inferred from a statistical method by Shklovsky (Schwarz et al., 1992). A more recent re-analysis of this method by Stanghellini et al. (2008) finds in particular that values derived in this way, by Corradi & Schwarz (1993), underestimate the distance for butterfly type planetary nebulae. They find a value for the distance to be 3.2 kpc. Other distances quoted in the literature range from 1 kpc to 3 kpc.
The fastest knots are travelling with speeds of 500 km s-1 with the kinematical age of the fastest knot being 1250 yrs (Bryce et al., 1997; O’Connor et al., 2000). Dayal et al. (2000) presented details of the velocities and corresponding timescales along different latitudes of the main hourglass and found the kinematical age of the nebula to be 2500 yrs.
While the radius, , of the nebula will vary linearly using the adopted distance, the expansion velocity follows a weaker power law in (: Dayal et al., 2000), hence the nebula expansion timescale is less sensitive than the estimated timescale of the ballistic ejection of the hypersonic knots. Our value for the kinematical age of the fastest knot, using the 3.2 kpc distance, is 1650 yrs. With regards to the kinematical age of the nebula, the value obtained was 2700 yrs.
The shape and structure of the inner hourglass appears similar to that of the main hourglass, which suggests that the mechanism that gave rise to the main hourglass might also be the same for that of the inner hourglass. Assuming this theory, the inner hourglass should follow a similar velocity law () to that of the main hourglass. In this case, the expansion velocity of the inner hourglass would increase with increasing latitude along its walls, and is estimated to have an expansion velocity of 30 5 km s-1 according to the synthetic P-V arrays generated from our shape model. This corresponds to a timescale of 1750 250 yrs. The interstellar knots have a similar kinematic age, thus implying that there might be a connection between them and the nebula’s inner hourglass.
3.4 Morpho-kinematic modelling of MyCn 18: shape analysis
While the hourglass morphology appears obvious, the significant inclination of MyCn 18 means that the structure and dynamics of the crucial region around the central star is not clear. Following the treatment of Hubble 12 in Vaytet et al (2009), the astrophysical modelling program shape (version 4.51) was used to create the morpho-kinematics of MyCn 18 that were characterised by Bryce et al. (1997); Sahai et al. (1999); Dayal et al. (2000); O’Connor et al. (2000).
shape is a software package that allows for the quick construction of many structures in 3-D and comparing these results with observed data assists in the interpretation of the object of interest. The geometry of each structure can be easily customised by means of a 3-D module and can be done either analytically or interactively. The application of a velocity field and emission properties to such a 3-D structure model can allow for the generation of 2-D rendered images and P-V arrays, channel maps, light curves, and 1-D spectral line profiles (Steffen et al., 2011). Planetary nebulae such as NGC 2392 (García-Díaz et al., 2012), IC 418 (Ramos-Larios et al., 2012b), HaTr 4 (Tyndall et al., 2012), NGC 7026 (Clark et al., 2013) and Kn 26 (Guerrero et al., 2013) are all interesting examples that have recently been modelled using shape.
A morpho-kinematic model of MyCn 18 was developed to allow for the reconstruction of its nebular morphology. Our aim, using shape, involved creating a 3-D shape resembling the nebula using observed P-V arrays (optical long-slit spectra), which are compared and matched up with synthetic P-V arrays generated from our model.
Development of the model involved using three main structures; a cylinder (for the outer hourglass), a sphere (for the inner hourglass), and a torus (central ‘eye’ region). A cylinder, with a line type and a segment value of 30 (same in each structure), was used for the outer hourglass shell. A squeeze geometry modifier was then applied to the cylinder to give an hourglass shape with a tight waist of 1.8″. A velocity modifier, which is a velocity field as a function of position, was also applied to help determine the kinematics of the outer hourglass shell. The vector field of this velocity modifier was set to give a radial Hubble expansion of 0 km s-1 at the centre to 70 km s-1 at the poles using a radial power law. The velocity function is given by f (r) = A + B(r/r0) + C(r/r. The r (initial arbitrary radius assigned to the main hourglass structure) parameter is the only constant with a value of 100, whereas all other parameters are variables. The r0 parameter is used to give the rate of change of velocity with respect to the radius r and has a value of 15. Parameters A and B are 0, whereas C and D are 2.2 and 1.82 respectively. Density modifiers, which set the spatial distribution of density, were used to give the arc-like etchings/rings on the outer hourglass shell. An arbitrary density scaling factor was used where the various structures were modified. A scaling factor of 1.0 was chosen for the main outer hourglass structure. The etchings/arcs, on each lobe, varied in density from 2.0 to 5.0. Two separate density modifiers were applied to the nebular waist (torus structure representing both ring 1 and ring 2). The first of these modifiers varied from 10 to 15 while the other (darkest region of the eye) varied from 15 to 20. All density values were chosen empirically by reference to the HST imagery of MyCn 18 from Sahai et al. (1999). Other modifiers such as shell thickness, size, and custom vertex were used to complete the outer hourglass structure. It should also be noted that the squeeze and density modifiers were set interactively, whereas the rest were set analytically. The inner hourglass was developed using a sphere. Again, a squeeze modifier was applied to give its hourglass shape, and a velocity modifier was set to give a radial expansion from 0 km s-1 at the centre to 30 km s-1 at the poles. The only different modifiers used for this structure were a translation modifier to allow for the offset (0.3″) of the structure and a rotation modifier to give the slight rotation (5∘) of the inner hourglass with respect to the outer hourglass. The central eye region (nebular waist) of the nebula was constructed using a torus. The only modifiers not used for this structure were the squeeze, translation, and rotation modifiers. The expansion velocity is radially from 0 km s-1 at its centre to 10 km s-1 at its edge. A density modifier was used to give the ring 2 feature, as shown in Fig. 3a. The value for the inclination of each structure and their features is set to 38∘ on the 2-D rendering module, which corresponds to 90. See Table 3 for the parameters used to create the model.
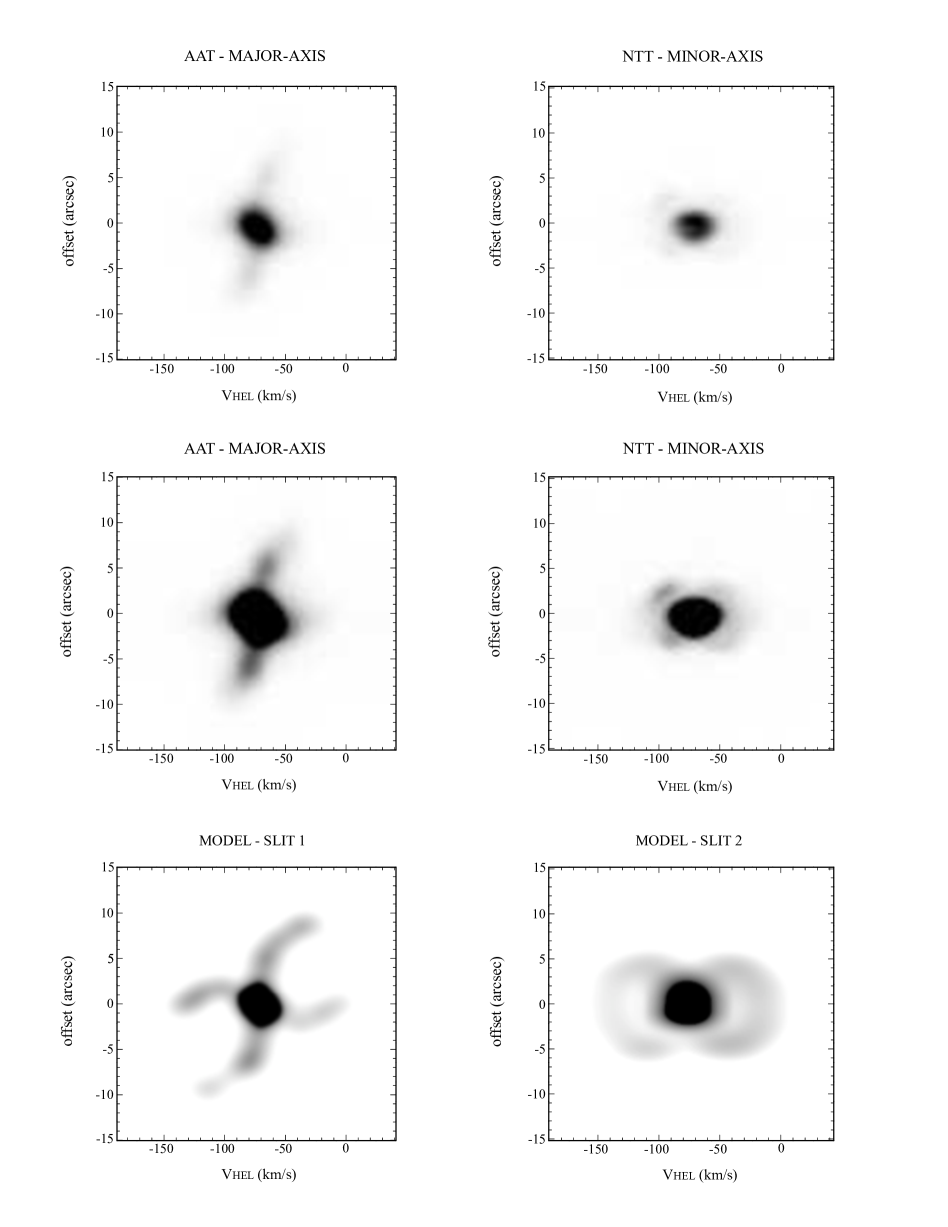
The P-V arrays shown in Fig. 11 (AAT & NTT arrays) and the associated P-V arrays from O’Connor et al. (2000) were used as the basis for the reconstruction process. Those observed spectra from Fig. 11 are shown at two different contrasts to display the spectroscopic features of MyCn 18. The stretches for the AAT spectra, from top to centre, are 0–60,000 and 0–15,000 counts respectively, and the stretches for the NTT spectra, from top to centre, are 0–40,000 and 0–10,000 counts, respectively. Also shown in Fig. 11 are synthetic P-V arrays, which were generated from the reconstructed model of MyCn 18 by means of a rendering module. The features of the synthetic P-V arrays reveal more detail than those of the observed arrays because of the lesser seeing for the observed data on those given nights. It was for this reason that the P-V arrays from O’Connor et al. (2000) needed to be used also. The discrepancies in the observed data were brought out more clearly in the modelled arrays by varying the convolution (seeing) parameters on the rendering module of shape. Figs. 11 and 12 were colour-inverted and grey-scaled for clear presentation.
| Parameter | Value |
|---|---|
| Pole-to-pole length (along its major axis) | 18″ |
| Nebular waist (along its minor axis) | 1.8″ |
| Max lobe width (along its minor axis) | 8.5″ |
| Shell thickness | 0.2″ |
| Inclination (w.r.t. plane of sky) | 52∘ |
| Systemic heliocentric radial velocity, | 71 km s-1 |
| Max velocity (outer hourglass) | 70 km s-1 |
| Max velocity (inner hourglass) | 30 km s-1 |
| Convolution (seeing) | 1.37″ |
A systemic heliocentric velocity, , of (O’Connor et al., 2000) was used as the central velocity in the synthetic P-V arrays. The brightness of the observed P-V arrays varies from low to high for a long-slit placed directly down the major axis of the nebula and across its minor axis. The MES arrays (major-axis arrays) show the lobed features, which are more visible in the higher brightness image. The same features are clearly displayed in the model slit 1 synthetic array with better seeing than the observed MES arrays. It is apparent that both the observed and synthetic arrays follow a similar pattern, which closely indicates that the shape of MyCn 18 is an open ended, bilobed, bipolar nebula.
The rates of expansion (in ) from the geometric centre out to the end of each lobe and across the waist were determined from the synthetic arrays. Having applied the appropriate velocity components, using the shape velocity modifiers, the velocity scale can be centred at , the velocity defined with respect to the nebula’s frame of reference in which the Sun is at rest. Two distinctly separate velocity features are present in the model slit-1 and MES arrays with the first around offset from to and the other from to for the model slit-1 array. The MES arrays, however, do not show emission out to these velocities, therefore, the P-V arrays from O’Connor et al. (2000) [see Fig. 3] were used to help finalise the synthetic arrays. These velocities obtained closely resemble those found by O’Connor et al. (2000) for their observed data.
The finished model, shown in Fig. 12a as a 2-D rendered image, has the same inclination (with the top, southeastern, half of the hourglass tilted towards us at an angle of 52∘ with respect to the plane of the sky) and is closely scaled to that shown in Fig. 12b, which is an HST [N ii]6584 Å image for comparison. It should also be noted that the seeing used for the 2-D rendered image is 0.3 arcsec instead of the 1.37 arcsec used when generating the synthetic P-V arrays, and the structures of the observed P-V arrays are smeared due to the 1.37 arcsec seeing, which makes it difficult to get a precise measurement of the expansion.
4 Discussion
4.1 Shaping mechanisms and offsets
Although there is still much to be understood about the complexity of MyCn 18’s asymmetry, we here propose explanations as to why this might be. Currently, the binary scenario is the favoured mechanism for the creation of bipolar planetary nebulae (Morris, 1987; Han et al., 1995; Soker & Rappaport, 2000; Balick & Frank, 2002; De Marco, 2009; Jones et al., 2010; Soker & Kashi, 2012). Companion stars may likely exist within the central eye region of MyCn 18, however, since they cannot be observed directly, their luminosity must be low in comparison to the neighbouring central star, and any continuum surrounding the central region would certainly obscure their light.
In relation to the offset of the central star, one proposed theory involves a variable accretion of matter onto the central white dwarf, resulting in a dwarf nova explosion that could have kicked the star off in one direction while producing the disrupted region of the eye in the opposite direction (see N-E region of ring 1 in Fig. 3b). Assuming momentum conservation of the ejectastar system before and after the explosion, we determine an energy of 7.2 x 1043 ergs for a velocity of 600 km s-1 (Bryce et al., 1997; O’Connor et al., 2000) and a mass of 10 (Sahai et al., 1999) for the knotty ejecta. From Fig. 9, we see that the star is offset from ring 1 by 0.2″, which corresponds to 640 AU for a distance of 3.2 kpc, and the time taken for the star to move from the nebula’s geometric centre to its current position is 1050 yrs (the difference between the age of the nebula and the knotty ejecta: 27001650 yrs). Using these values, we find that the star would have to be moving at a velocity of 3 km s-1 over that period. For a 0.6 M⊙ white dwarf and a velocity of 3 km s-1, we find an energy of 5.4 x 1043 ergs, which closely resembles that of the energy for the ejecta plus star system.
The nebula’s other prominent features are also offset with respect to the geometric centre. The offset, and even the creation, of the inner hourglass may be the result of the formation of the knots since its axis of symmetry appears to follow the path taken by the knots. Our calculation for the kinematical age of the inner hourglass corresponds closely to that of the knots, which further suggests a possible connection between both components.
The younger, high-speed knots might explain the truncated, open-ended lobes of the outer hourglass. At an earlier epoch, before the creation of the knots, the ends of the lobes may have been closed. Some time after, the high-speed ejection of the knots would have penetrated the lobed ends, giving rise to their truncation, thus suggesting the younger age of the knots. This penetration would have occurred when the outer hourglass was smaller than it is now, which could explain for the large opening angle of each lobe (see Sahai & Trauger, 1998).
Soker & Kashi (2012) propose that the formation of bipolar lobes of some PNe and pre-PNe are the result of one or more intermediate-luminosity optical transient (ILOT) events. Jets created by the accretion of matter, from an AGB (or extreme-AGB) star, onto a main-sequence companion are launched by an accretion disk, which in turn shapes the bipolar lobes. For MyCn 18 to form from an ILOT event, it would need to have a linear velocity-distance relation, a bipolar structure, an expansion velocity (for the knotty outflow) of 100–1000 km s-1, and a total kinetic energy of 1046–1049 ergs, as noted by Soker & Kashi (2012). They show that MyCn 18 has all the characteristic properties of an ILOT event apart from the total kinetic energy, which is of the order 1044 ergs, and their energy-time diagram (ETD) shows MyCn 18 to be just outside the optical transient stripe (OTS), making it an exception. MyCn 18 does not appear energetic enough to be a ILOT event. They support the O’Connor et al. (2000) view that MyCn 18 was formed by a nova like explosion instead. However, in the light of the recent frequent discovery of hot Jupiter-type planets, it is possible to generate an ILOT event of significantly lower energy than envisaged by Soker & Kashi (2012). A planet engulfed at the AGB phase, surviving to spiral through the tenuous envelope to the dense core of the star and finally forming an accretion disk there (Nordhaus & Blackman, 2006), gives a natural mechanism for breaking the spherical symmetry of the AGB phase. Subsequently a nova-type explosion event on the degenerate core could have led to the generation of the hypersonic knots and the deviations from cylindrical symmetry of the nebula and the offset location of its central star.
A planet destruction event causing an asymmetric nova explosion could explain features as follows: on the AGB phase, a planet is engulfed and survives long enough to disrupt the symmetry of the nebula and cause its bipolar shape. As the planet spirals to the degenerate core an accretion disk forms and we speculate that the final accretion event of the planet onto the star generates an explosion that is localised on the stellar core. This asymmetric explosion gives a velocity kick to the star, generates the knotty outflow perpendicular to the disk, and causes the disruption to ring 1 in the opposite (NE) direction to the star’s movement (this is observed better in the composite colour image from Sahai et al., 1999).
Interestingly, despite the expectation that planets should be readily detectable around white dwarfs (Burleigh et al., 2001) they have not been observed yet (Mustill & Villaver, 2012), which may suggest that many hot Jupiter exoplanets are readily engulfed and destroyed at the AGB phase. Since there are not enough close binaries to shape the large fraction of non-spherical PNe, this strongly suggests some role for planets in their shaping (De Marco & Soker, 2011).
4.2 Morpho-kinematic modelling
Our long-slit spectra provided us with sufficient information about the 3-D structure of the nebula, which allowed us to generate a self-consistent 3-D model. Density distributions and velocity parameters were applied to the individual sub-systems in order to generate the synthetic P-V arrays needed for describing the kinematics of the nebula. This technique, along with the long-slit spectra, enabled us to reconstruct the shape of the nebula. The resultant 3-D shape model is in good agreement with that of Sahai et al. (1999); Dayal et al. (2000), specifically for the structure and kinematics of this gaseous nebula.
It has been shown, by use of the observed and synthetic P-V arrays, that the expansion rate of the nebula follows that of a Hubble-type expansion, i.e., the velocity of the ionised gas increases linearly with distance from the centre (Solf & Ulrich, 1985; Icke et al., 1989). Our values for the expansion rates correspond closely to those found by O’Connor et al. (2000). The kinematical age of MyCn 18 was then found to be 2700 yrs using these velocities. Although a distance of 3.2 kpc was used to help determine an age for MyCn 18, it is still not accepted as a confirmed distance, therefore, other techniques are required to narrow down the possible range.
An unambiguous distance measurement requires a proper motion study of the high velocity knots of MyCn 18 or hourglass edges. The proper motion for a given feature is , where is the velocity in units of and is the distance in units of kpc. The original HST images of MyCn 18 were taken in the mid 1990s so displacement of the knots should be detectable in a second epoch image even if the distance to MyCn 18 is up to 3.2 kpc. The second epoch which included the NTT EFOSC frames were analysed to determine the relative positions of the knots. Unfortunately, the exposure times were much too short to reveal any knots that might have moved.
5 Conclusions
We have carried out an optical and infrared study of MyCn 18 in order to understand the whole structure and dynamics of the nebula from the offset central star to the striking nebula morphology and the distant hypersonic knotty outflow. VLT IR observations of MyCn 18 were combined with earlier optical work, morpho-kinematic modelling, and a search for a close stellar binary companion. We consider that the conventional planetary nebula formation process has been significantly affected by an explosive event that has led to deviations from axial symmetry such as a displacement of the central star and the misalignment of the main nebular structures. We speculate that a hot Jupiter exoplanet was engulfed at the AGB phase of the star’s evolution and that the accretion of this material onto the core of the star led to a nova-type explosion that was ultimately responsible for the hypersonic knotty outflow. Given the common nature of hot Jupiters, it can even be suggested that this and other extreme bipolar morphology planetary nebulae are ultimately shaped by one or more exoplanets.
Acknowledgements.
We gratefully acknowledge the support of the College of Science, NUI Galway (under their PhD fellowship scheme). Based on observations collected at the European Southern Observatory, Chile, and proposal numbers are 071.D-0698 and 073.D-0359. Based on observations made with the NASA/ESA Hubble Space Telescope, obtained from the data archive at the Space Telescope Institute. STScI is operated by the association of Universities for Research in Astronomy, Inc. under the NASA contract NAS 5-26555. This paper makes use of data obtained from the Isaac Newton Group Archive which is maintained as part of the CASU Astronomical Data Centre at the Institute of Astronomy, Cambridge. We thank Eamonn Harvey for his assistance and guidance with the use of shape. We also thank the anonymous referee for their thorough review and highly appreciate their comments and suggestions, which significantly contributed to improving the quality of the publication.References
- Aleman & Gruenwald (2004) Aleman, I. & Gruenwald, R. 2004, ApJ, 607, 865
- Bains et al. (2002) Bains, I., Bryce, M., Calabretta, M., & Stirling, A. M. 2002, MNRAS, 337, 401
- Balick (1987) Balick, B. 1987, AJ, 94, 671
- Balick & Frank (2002) Balick, B. & Frank, A. 2002, ARA&A, 40, 439
- Bernard-Salas & Tielens (2005) Bernard-Salas, J. & Tielens, A. G. G. M. 2005, A&A, 431, 523
- Bryce et al. (1997) Bryce, M., Lopez, J. A., Holloway, A. J., & Meaburn, J. 1997, ApJ, 487, L161+
- Burleigh et al. (2001) Burleigh, M., Clarke, F., & Hodgkin, S. 2001, in Techniques for the Detection of Planets and Life beyond the Solar System, ed. W. R. F. Dent, 15
- Burton et al. (1992) Burton, M. G., Hollenbach, D. J., & Tielens, A. G. G. 1992, ApJ, 399, 563
- Cavanagh et al. (2008) Cavanagh, B., Jenness, T., Economou, F., & Currie, M. J. 2008, Astronomische Nachrichten, 329, 295
- Chevalier & Luo (1994) Chevalier, R. A. & Luo, D. 1994, ApJ, 421, 225
- Clark et al. (2013) Clark, D. M., López, J. A., Steffen, W., & Richer, M. G. 2013, AJ, 145, 57
- Corradi & Schwarz (1993) Corradi, R. L. M. & Schwarz, H. E. 1993, A&A, 268, 714
- Cox et al. (1998) Cox, P., Boulanger, F., Huggins, P. J., et al. 1998, ApJ, 495, L23+
- Currie & Berry (2000) Currie, M. J. & Berry, D. S. 2000, Starlink User Note 95
- Currie & Cavanagh (2004) Currie, M. J. & Cavanagh, B. 2004, ORAC-DR - imaging data reduction, starlink User Note 232.8
- Davis et al. (2003) Davis, C. J., Smith, M. D., Stern, L., Kerr, T. H., & Chiar, J. E. 2003, MNRAS, 344, 262
- Dayal et al. (1997) Dayal, A., Sahai, R., Trauger, J., et al. 1997, in Bulletin of the American Astronomical Society, Vol. 29, American Astronomical Society Meeting Abstracts, 1234
- Dayal et al. (2000) Dayal, A., Sahai, R., Watson, A. M., et al. 2000, AJ, 119, 315
- De Marco (2009) De Marco, O. 2009, PASP, 121, 316
- De Marco & Soker (2011) De Marco, O. & Soker, N. 2011, PASP, 123, 402
- Dekker et al. (1986) Dekker, H., Delabre, B., & Dodorico, S. 1986, in Society of Photo-Optical Instrumentation Engineers (SPIE) Conference Series, Vol. 627, Society of Photo-Optical Instrumentation Engineers (SPIE) Conference Series, ed. D. L. Crawford, 339–348
- Disney & Wallace (1982) Disney, M. J. & Wallace, P. T. 1982, QJRAS, 23, 485
- Douchin et al. (2012) Douchin, D., De, M. O., Jacoby, G. H., et al. 2012, in SF2A-2012: Proceedings of the Annual meeting of the French Society of Astronomy and Astrophysics, ed. S. Boissier, P. de Laverny, N. Nardetto, R. Samadi, D. Valls-Gabaud, & H. Wozniak, 325–327
- Eyermann & Speck (2004) Eyermann, S. E. & Speck, A. K. 2004, in Bulletin of the American Astronomical Society, Vol. 36, American Astronomical Society Meeting Abstracts, 138.11
- García-Díaz et al. (2012) García-Díaz, M. T., López, J. A., Steffen, W., & Richer, M. G. 2012, ApJ, 761, 172
- García-Segura et al. (1999) García-Segura, G., Langer, N., Różyczka, M., & Franco, J. 1999, ApJ, 517, 767
- Guerrero et al. (2013) Guerrero, M. A., Miranda, L. F., Ramos-Larios, G., & Vázquez, R. 2013, A&A, 551, A53
- Hadrava (2006) Hadrava, P. 2006, A&A, 448, 1149
- Han et al. (1995) Han, Z., Podsiadlowski, P., & Eggleton, P. P. 1995, MNRAS, 272, 800
- Henney et al. (2007) Henney, W. J., Williams, R. J. R., Ferland, G. J., Shaw, G., & O’Dell, C. R. 2007, ApJ, 671, L137
- Hora & Latter (1996) Hora, J. L. & Latter, W. B. 1996, in Bulletin of the American Astronomical Society, Vol. 28, American Astronomical Society Meeting Abstracts, 1402
- Hora et al. (2005) Hora, J. L., Latter, W. B., Marengo, M., et al. 2005, in Bulletin of the American Astronomical Society, Vol. 37, American Astronomical Society Meeting Abstracts #206, 493
- Icke et al. (1989) Icke, V., Preston, H. L., & Balick, B. 1989, AJ, 97, 462
- Jones et al. (2010) Jones, D., Lloyd, M., Santander-García, M., et al. 2010, MNRAS, 408, 2312
- Jones et al. (2012) Jones, D., Mitchell, D. L., Lloyd, M., et al. 2012, MNRAS, 420, 2271
- Jordan et al. (2012) Jordan, S., Bagnulo, S., Werner, K., & O’Toole, S. J. 2012, A&A, 542, A64
- Kastner et al. (2000) Kastner, J. H., Gatley, I., & Weintraub, D. A. 2000, in Astronomical Society of the Pacific Conference Series, Vol. 199, Asymmetrical Planetary Nebulae II: From Origins to Microstructures, ed. J. H. Kastner, N. Soker, & S. Rappaport, 355
- Kastner et al. (1998) Kastner, J. H., Henn, L., Weintraub, D. A., Gatley, I., & Siebenmorgen, R. 1998, in Bulletin of the American Astronomical Society, Vol. 30, American Astronomical Society Meeting Abstracts, 1274
- Koller & Kimeswenger (2000) Koller, J. & Kimeswenger, S. 2000, Thermal Emission Spectroscopy and Analysis of Dust, Disks, and Regoliths, 196, 23
- Kwok (1982) Kwok, S. 1982, ApJ, 258, 280
- Kwok et al. (1978) Kwok, S., Purton, C. R., & Fitzgerald, P. M. 1978, ApJ, 219, L125
- Lee et al. (2007) Lee, T.-H., Stanghellini, L., Ferrario, L., & Wickramasinghe, D. T. 2007, in Astronomical Society of the Pacific Conference Series, Vol. 372, 15th European Workshop on White Dwarfs, ed. R. Napiwotzki & M. R. Burleigh, 173
- Lenzen et al. (2003) Lenzen, R., Hartung, M., Brandner, W., et al. 2003, in Society of Photo-Optical Instrumentation Engineers (SPIE) Conference Series, Vol. 4841, Society of Photo-Optical Instrumentation Engineers (SPIE) Conference Series, ed. M. Iye & A. F. M. Moorwood, 944–952
- Likkel et al. (2000) Likkel, L., Kindt, A., Dinerstein, H. L., & Lester, D. F. 2000, in Astronomical Society of the Pacific Conference Series, Vol. 199, Asymmetrical Planetary Nebulae II: From Origins to Microstructures, ed. J. H. Kastner, N. Soker, & S. Rappaport, 333
- Maihara et al. (1993) Maihara, T., Iwamuro, F., Yamashita, T., et al. 1993, PASP, 105, 940
- Matsuura et al. (2007) Matsuura, M., Speck, A. K., Smith, M. D., et al. 2007, MNRAS, 382, 1447
- Matsuura & Zijlstra (2005) Matsuura, M. & Zijlstra, A. 2005, in High Resolution Infrared Spectroscopy in Astronomy, ed. H. U. Käufl, R. Siebenmorgen, & A. Moorwood, 423–426
- Meaburn et al. (1984) Meaburn, J., Blundell, B., Carling, R., et al. 1984, MNRAS, 210, 463
- Moorwood et al. (1999) Moorwood, A., Cuby, J.-G., Ballester, P., et al. 1999, The Messenger, 95, 1
- Morris (1987) Morris, M. 1987, PASP, 99, 1115
- Mustill & Villaver (2012) Mustill, A. J. & Villaver, E. 2012, ApJ, 761, 121
- Nordhaus & Blackman (2006) Nordhaus, J. & Blackman, E. G. 2006, MNRAS, 370, 2004
- O’Connor et al. (2000) O’Connor, J. A., Redman, M. P., Holloway, A. J., et al. 2000, ApJ, 531, 336
- Oliva & Origlia (1992) Oliva, E. & Origlia, L. 1992, A&A, 254, 466
- Pascoli & Lahoche (2008) Pascoli, G. & Lahoche, L. 2008, PASP, 120, 1267
- Pickles (1998) Pickles, A. J. 1998, PASP, 110, 863
- Ramos-Larios et al. (2008) Ramos-Larios, G., Guerrero, M. A., & Miranda, L. F. 2008, AJ, 135, 1441
- Ramos-Larios et al. (2012a) Ramos-Larios, G., Guerrero, M. A., Suárez, O., Miranda, L. F., & Gómez, J. F. 2012a, A&A, 545, A20
- Ramos-Larios et al. (2012b) Ramos-Larios, G., Vázquez, R., Guerrero, M. A., et al. 2012b, MNRAS, 423, 3753
- Rousselot et al. (2000) Rousselot, P., Lidman, C., Cuby, J.-G., Moreels, G., & Monnet, G. 2000, A&A, 354, 1134
- Rousset et al. (2003) Rousset, G., Lacombe, F., Puget, P., et al. 2003, in Society of Photo-Optical Instrumentation Engineers (SPIE) Conference Series, Vol. 4839, Society of Photo-Optical Instrumentation Engineers (SPIE) Conference Series, ed. P. L. Wizinowich & D. Bonaccini, 140–149
- Sahai et al. (1999) Sahai, R., Dayal, A., Watson, A. M., et al. 1999, AJ, 118, 468
- Sahai et al. (2009) Sahai, R., Sugerman, B. E. K., & Hinkle, K. 2009, ApJ, 699, 1015
- Sahai & Trauger (1998) Sahai, R. & Trauger, J. T. 1998, AJ, 116, 1357
- Schwarz et al. (1992) Schwarz, H. E., Corradi, R. L. M., & Melnick, J. 1992, A&AS, 96, 23
- Sellgren et al. (2008) Sellgren, K., Bromm, V., & Dinerstein, H. 2008, Spitzer Proposal, 50179
- Soker & Harpaz (1992) Soker, N. & Harpaz, A. 1992, PASP, 104, 923
- Soker & Kashi (2012) Soker, N. & Kashi, A. 2012, ApJ, 746, 100
- Soker & Rappaport (2000) Soker, N. & Rappaport, S. 2000, ApJ, 538, 241
- Soker & Rappaport (2001) Soker, N. & Rappaport, S. 2001, ApJ, 557, 256
- Solf & Ulrich (1985) Solf, J. & Ulrich, H. 1985, A&A, 148, 274
- Stanghellini et al. (2008) Stanghellini, L., Shaw, R. A., & Villaver, E. 2008, ApJ, 689, 194
- Steffen et al. (2011) Steffen, W., Koning, N., Wenger, S., Morisset, C., & Magnor, M. 2011, IEEE Transactions on Visualization and Computer Graphics, 17, 454
- Tenenbaum et al. (2009) Tenenbaum, E. D., Milam, S. N., Woolf, N. J., & Ziurys, L. M. 2009, ApJ, 704, L108
- Trammell et al. (1995) Trammell, S. R., Dinerstein, H. L., & Goodrich, R. W. 1995, in Annals of the Israel Physical Society, Vol. 11, Asymmetrical Planetary Nebulae, ed. A. Harpaz & N. Soker, 37
- Tyndall et al. (2012) Tyndall, A. A., Jones, D., Lloyd, M., O’Brien, T. J., & Pollacco, D. 2012, MNRAS, 422, 1804
- Vlemmings (2012) Vlemmings, W. 2012, in IAU Symposium, Vol. 283, IAU Symposium, 176–179
- Vlemmings (2011) Vlemmings, W. H. T. 2011, in Asymmetric Planetary Nebulae 5 Conference
- Volk (2003) Volk, K. 2003, in IAU Symposium, Vol. 209, Planetary Nebulae: Their Evolution and Role in the Universe, ed. S. Kwok, M. Dopita, & R. Sutherland, 281
- Wang et al. (2006) Wang, M.-Y., Muthumariappan, C., & Kwok, S. 2006, in IAU Symposium, Vol. 234, Planetary Nebulae in our Galaxy and Beyond, ed. M. J. Barlow & R. H. Méndez, 537–538
- Whitelock (1985) Whitelock, P. A. 1985, MNRAS, 213, 59
- Yungelson et al. (1993) Yungelson, L. R., Tutukov, A. V., & Livio, M. 1993, ApJ, 418, 794
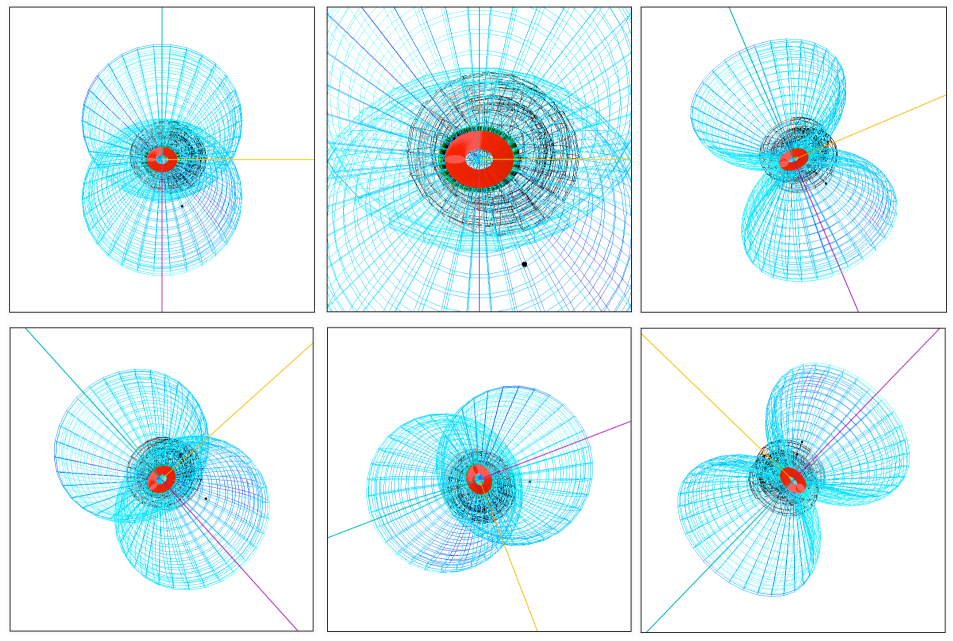
Appendix A: shape images of MyCn 18
Shown above is the shape model for MyCn 18 from different viewing angles. The green, yellow, and purple line represent the top view, right view, and axis of symmetry of the nebula, respectively. The top left view shows the nebula with its southern pole tilted towards us at an angle of 52∘ with respect to the plane of the sky. From top to bottom on this view represents a NW to SE direction. The view on the top middle is a close in of the first showing detail of the inner part of the nebula.