Class I Methanol (CH3OH) Maser Conditions near Supernova Remnants
Abstract
We present results from calculations of the physical conditions necessary for the occurrence of 36.169 (), 44.070 (), 84.521 (), and 95.169 () GHz methanol (CH3OH) maser emission lines near supernova remnants (SNRs), using the MOLPOP-CEP program. The calculations show that given a sufficient methanol abundance, methanol maser emission arises over a wide range of densities and temperatures, with optimal conditions at cm-3 and K. The 36 GHz and 44 GHz transitions display more significant maser optical depths compared to the 84 GHz and 95 GHz transitions over the majority of physical conditions. It is also shown that line ratios are an important and applicable probe of the gas conditions. The line ratio changes are largely a result of the -type transitions becoming quenched faster at increasing densities. The modeling results are discussed using recent observations of CH3OH and hydroxyl (OH) masers near the supernova remnants G1.40.1, W28, and Sgr A East.
Subject headings:
Supernova Remnants masers (stars:) supernovae: individual (G1.4, W28, Sgr A East) (ISM): supernova remnants radio lines: ISM methods: numerical1. Introduction
Studying maser lines is useful in order to explore the physical and chemical conditions in interstellar gas. Maser pumping occurs under specific conditions, and modeling of the maser formation can provide estimates of the required environmental parameters. If more than one transition can be observed at the same location, predictions of line ratios can be used to place tight constraints on the physical conditions. A suitable species for studies is therefore the methanol (CH3OH) molecule, which displays several maser transitions that can be found in the interstellar medium (Cragg et al., 1992). Methanol masers were first discovered by Barrett et al. (1971) at frequencies around 25 GHz near Orion. Since then, methanol maser emission has been discovered in hundreds of star forming regions (e.g., Bachiller et al., 1990; Beuther et al., 2002; Kurtz et al., 2004). As originally suggested by Batrla et al. (1987), and later labelled by Menten (1991), methanol masers are divided into two classes which depend on their pumping mechanism. Class I methanol masers are collisionally pumped, whereas the Class II masers are pumped by radiation (e.g., Cragg et al., 1992, 2002). Both classes can be found associated with massive star forming regions (SFRs). Consistent with the pumping classification, Class II methanol masers are typically located close to the protostars, often associated with UC and HC HII regions, while the Class I masers instead are related to outflows and molecular shock fronts (Plambeck & Menten 1990; Kurtz et al. 2004; Voronkov et al. 2006).
Masers are not only excited in SFRs but also in regions shocked by supernova remnants (SNRs). For instance, the collisionally pumped 1720 MHz OH masers are associated with the interaction regions between SNRs and molecular clouds (e.g., Clausssen et al. 1997; Frail & Mitchell 1998; Yusef-Zadeh et al. 2003). A comparison of the OH and methanol molecule excitation mechanism indicates that conditions conducive for 1720 MHz OH masers may also be favorable for Class I methanol masers (Lockett et al., 1999; Pihlström et al., 2008; Pratap et al., 2008). Based on these results it would not be unreasonable to expect methanol masers to occur near SNRs that sustain OH masers. Consistent with this prediction, 36 GHz and 44 GHz methanol masers have been found near the SNR Sgr A East in the Galactic center region (Yusef-Zadeh et al. 2008; Sjouwerman et al. 2010; Pihlström et al. 2011a). Additionally, in a recent study by Pihlström et al. (2014), the same methanol transitions were discovered toward the SNRs G1.40.1 and W28. These three SNRs all harbor OH masers, and therefore readily provide a testbed for combined modeling with observations of several maser species to determine local densities and density gradients. Constraining density estimates in these interaction regions may be of interest for, e.g., modeling of cosmic ray acceleration in SNRs. Such models estimate the expected resulting -ray emission due to neutral pion decay, which is a function of the number density (e.g., Drury et al., 1994; Abdo et al., 2010; Cristofari et al., 2013).
In this paper, modeling of the methanol maser transitions is used to predict under what physical conditions masers will occur, specific to a SNR environment. These results are used to interpret recent observational results on methanol masers near SNRs.
2. Model Parameters
Given that methanol typically has been searched for and found associated with hot dense cores of newly forming massive stars (Müller et al., 2004), most theoretical work on the methanol molecule and its excitation has been focused on conditions in SFRs and Class II masers. For the Class I masers, an early statistical equilibrium calculation for the 36 GHz and 44 GHz lines detected in Sgr B2 showed that high kinetic temperatures were required for maser action (Morimoto et al., 1985). Later, more detailed modeling of the general behaviour of both Class I and II masers were performed by Cragg et al. (1992). Their work concluded that the brightest collisionally pumped Class I methanol masers are expected at the transitions at 36.169 GHz () and 44.070 GHz (), with slightly weaker masers for the 84.521 GHz () and 95.169 GHz () transitions. These four transitions have been observed associated with outflows in SFRs (e.g., Kurtz et al. 2004; Fish et al. 2011; Fontani et al. 2010; Kalenskii et al. 2013). In SNRs, the 84 GHz line has not yet been reported, but the 36 GHz, 44 GHz, and 95 GHz lines have all been detected (Yusef-Zadeh et al., 2008; Sjouwerman et al., 2010; Pihlström et al., 2011a; Shulga et al., 2012). The occurrence of these lines, and the relative line intensities for spatially coincident emission allows the physical conditions of the gas to be probed.
In this paper, we examine the conditions regulating maser activity near SNRs. This environment includes radiation due to the cosmic microwave background (CMB), and a dust generated radiation field that is weaker than in SFRs. The optical depths of the four Class I transitions were calculated using the MOLPOP-CEP222Available at http://www.iac.es/proyecto/magnetism/pages /codes/molpop-cep.php program (Elitzur & Asensio Ramos, 2006). MOLPOP-CEP is a Fortran 90 code that solves the molecular level population equations along with the radiative transfer equations for multi-level systems. It applies either the Coupled Escape Probability (CEP) method outlined in Elitzur & Asensio Ramos (2006) or the standard escape probability approximation for a homogeneous slab.
In order to calculate the masing conditions in MOLPOP-CEP, several variables can be adjusted. These include the number of energy levels considered, the kinetic gas temperature (), the molecular hydrogen density (), the fractional abundance of a trace molecule (, here methanol), and radiation fields due to dust and the CMB. SNR dust temperatures are estimated to be approximately between 20-80 K (e.g., Andersen et al., 2011; Lee et al., 2011), but a change within this modest range of dust temperatures does not significantly affect our model results. An external radiation field of 2.725 K from the CMB and a 30 K dust radiation field is therefore applied in each model presented here. Energy levels for the methanol molecule were incorporated using the Leiden Atomic and Molecular Database (LAMDA)333Available at http://home.strw.leidenuniv.nl/moldata/, which includes close to 300 rotational energy levels for each of the A- and E-type species in the torsional ground state up to about 350 cm-1 () (Schöier et al., 2011). The collision rate coefficients used for methanol colliding with H2 were also adopted from LAMDA, originally calculated by Pottage et al. (2004) for temperatures ranging from 5 to 200 K. Since methanol masers are predicted to be excited under similar, though not identical, conditions as the OH masers, the initial input parameters to the models were those optimally producing 1720 MHz OH maser emission in SNRs: cm-3 and K (Lockett et al., 1999; Pihlström et al., 2008).
| Transition | n Range | T Range | Max |
|---|---|---|---|
| (GHz) | (cm-3) | (K) | (inverted) |
| 36 | 20 | 3.3 | |
| 40 - 100 | 6.3 | ||
| 120 - 200 | 6.8 | ||
| 44 | 40 | 4.5 | |
| 60 | 5.0 | ||
| 80 | 5.3 | ||
| 100 - 180 | 5.8 | ||
| 200 | 5.9 | ||
| 84 | 20 | 0.6 | |
| 40 | 1.8 | ||
| 60 - 180 | 4.2 | ||
| 200 | 4.2 | ||
| 95 | 40 | 2.0 | |
| 60 | 2.5 | ||
| 80 - 100 | 3.0 | ||
| 120 - 180 | 3.5 | ||
| 200 | 3.6 |
3. Results
3.1. Modeling Results
To determine the full range of conditions under which masing occurs for each transition, different combinations of , , and were modeled. The models covered a temperature range of 20 to 200 K, a density range of 10 to 109 cm-3, and a fraction range of 10-5 to 10-8. Even though was varied in the calculations, this value only affects the absolute value of the optical depth, and does not alter the range of temperatures and densities under which masers form. A value of is therefore used in the remainder of this paper. All parameters were varied successively by factors of 10, covering an extensive combination of parameters. The number of transitions involved in the calculations can also be varied, but this has no significant effect on our modeling outcome since the conditions modeled here predominantly affect the lower energy transitions only.
For OH maser excitation, line overlap is an important factor (e.g., Gray et al., 1991; Pavlakis & Kylafis, 1996; Gray et al., 2001), which may drastically change the relative excitation population of the OH main line masers (Cragg et al., 2002). Line overlap in methanol is expected to be much less important, as has been previously confirmed through modeling by Röllig et al. (1999) and Cragg et al. (2002). Due to the dominant collisional excitation mechanism in SNRs, only small changes in the resulting calculated emission would be expected due to IR line overlap given the weak dust radiation field of 30K. In fact, using line overlap for a linewidth of 1 km s-1 causes a slight shift of the peak optical depth to higher column densities by a factor of or less. No other major differences in our modeling output are found, in agreement with the earlier modeling of methanol masers in SFRs. In the description of the results below, line overlaps are excluded.
Varying the main parameters and results in a wide set of optical depths, summarized in Table 1. The values in Table 1 emphasize the broad range of conditions under which the methanol maser may be formed. The lower energy level transitions at 36 GHz and 44 GHz typically show more significant optical depths compared to 84 GHz and 95 GHz. An example of this general behavior can been seen in Fig. 1 which shows the inverted optical depths (i.e., ) at a specific set of conditions ( cm-3 and K).

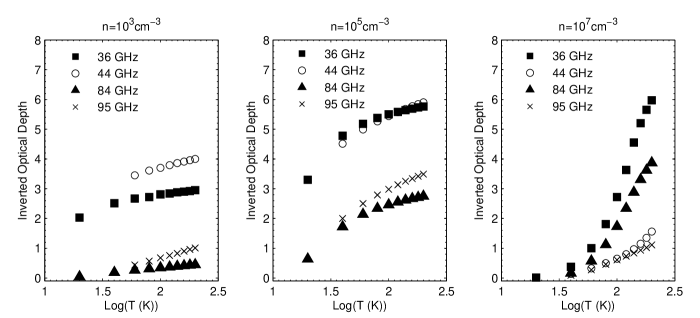
Figure 2 demonstrates how the peak inverted optical depth increases with density between cm-3, maximizes at cm-3, and lastly decreases drastically above cm-3. From the same plot it can also be noted that the -type 44 GHz and 95 GHz transitions have the highest inverted optical depth at a density of cm-3, while this occurs at a slightly higher density of cm-3 for the -type 36 GHz and 84 GHz lines. Consequently, the -type transitions get quenched at a smaller density than the -type transitions.
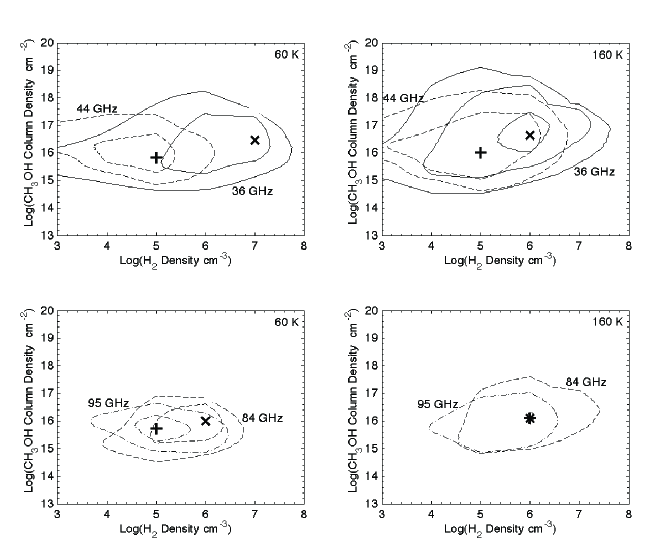
These trends occur for each value of the temperature, and is clearly visible in Fig. 3 showing contour plots of the optical depth as a function of the H2 density and the methanol column density at two different temperatures. The 36 GHz and 84 GHz lines show optimal maser output at higher densities and at a slightly larger column density compared to the 44 GHz and 95 GHz lines respectively. This figure also shows that at higher temperatures, the peak densities approach each other, indicated by the cross and plus signs.

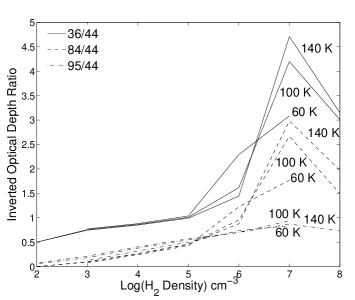
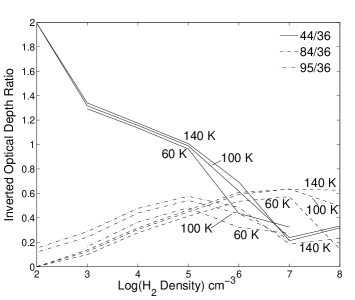
The temperature dependence is illustrated in Fig. 4, using three different densities. Overall, for a given density the optical depth increases with increasing temperature. However, there are parameter regions where the relative strength of the lines changes, which is an important observational diagnostic of the region. In particular, the -type transitions become quenched at lower densities than the -type transitions, leaving strong masers at 36 GHz and 85 GHz at densities cm-3. At lower densities the 44 GHz line will dominate. For more detailed diagnostic purposes, illustrating this behavior, the optical depth ratios with respect to the 44 GHz and 36 GHz lines at three different temperatures are plotted in Fig. 5.
4. Discussion
Typically, for cm-3, the brightest masers occur at 36 GHz and 44 GHz and therefore are most likely the most useful observational diagnostic for probing physical conditions in the observed region.
4.1. Comparison between 36 GHz and 44 GHz
Optimal masing conditions at 36 GHz occurs at temperatures K and at densities between cm-3, while optimal conditions for the 44 GHz line are found at temperatures K and at slightly lower densities between cm-3. The large overlap in the density range for the two transitions suggests that 36 GHz and 44 GHz masers can be expected to be found co-spatially (Pihlström et al., 2011a). If only 36 GHz masers are detected, the density is most likely too high for the formation of 44 GHz masers. If the two transitions are found jointly, their relative brightness may be used to constrain the density and temperature at that position (see Sect. 4.3.3).
4.2. Comparison to Methanol in SFRs
Pratap et al. (2008) mention the results of unpublished methanol maser modeling in SFRs suggesting that the 36 GHz transitions occur for gas temperatures that range from about 30100 K and densities on the order of cm-3. The same unpublished modeling results reported for the 44 GHz transitions are found to occur at higher temperatures (80200 K) and densities ( cm-3). They predict that in SFRs the density trend is opposite to that of our modeling results in SNRs, as we find that 44 GHz masers tend to occur at slightly lower densities than the 36 GHz masers. We note, however, that the unpublished Pratap et al. (2008) results should be verified before being used in a detailed quantitative analysis.
Although 84 GHz and 95 GHz methanol masers have been detected in SFRs (e.g., Plambeck & Menten 1990; Kalenskii et al. 2013), there are less details available for estimates of the density and temperature for these transitions (Cragg et al., 1992). The results presented here show that these transitions may be found under the same range of conditions as the 36 GHz and 44 GHz lines. These higher frequency masers are generally less bright, but they still provide complimentary information about the interstellar conditions.
4.3. 36 GHz and 44 GHz Methanol Masers in SNRs
The broad range of conditions under which methanol masers can form encompasses those of the 1720 MHz OH maser line. This suggests that the methanol lines may be readily detectable near SNRs, and perhaps especially near those harboring OH masers. In a targeted search towards a sample of 21 SNRs displaying the 1720 MHz OH maser line, which may indicate a molecular-cloud interaction, three SNRs (G1.4, W28, and Sgr A East) were found to have 36 GHz and/or 44 GHz methanol masers (Pihlström et al., 2014). While the low number of sources detected in any of the methanol transitions were somewhat surprising, Pihlström et al. (2014) discuss some possible explanations. The most selective one is the small angular area covered in the search, due to the small field-of-view at those high frequencies. Also the limited range in line-of-sight velocity may have played a role. Alternatively, the methanol abundance or path-length may simply be insufficient for maser amplification. Finally, if the conditions across the pre-shock to post-shock regions changes significantly, the formation and destruction mechanisms of the different molecules could result in a significant spatial/angular and velocity offset between OH and methanol, and the search was targeting the OH maser positions specifically. Nevertheless, for the three SNRs with methanol maser emission, the nature of the masers and the gas conditions are discussed using the modeling results (Sect. 4.3.1-4.3.3).
4.3.1 G1.4-0.1
Close to 40 methanol masers were detected in G1.40.1 at 36 GHz. This SNR is one of the smaller angular scale SNRs observed by Pihlström et al. (2014), which may have increased the chance of detection. However, most pointings contained several maser spots, indicating there may be more masers outside the pointing areas and that this SNR may be particularly rich in methanol masers. Consistent with this, G1.40.1 is overlapping with two molecular clouds along the line of sight, as probed by both CO and CS observations showing emission concentrated around and km s-1 for the two clouds respectively (Oka et al., 1998; Tsuboi et al., 1999). Given the close agreement of the CO, CS, and 36 GHz methanol emission velocities it is therefore reasonable to assume the methanol maser emission is associated with gas in these clouds, presumably pumped by the interaction between the SNR and the molecular clouds. The velocity of the G1.40.1 OH maser is offset from the two main methanol velocities, perhaps because it arises in a region of the gas where the velocities have been disturbed on the post-shocked region (Pihlström et al., 2011a, 2014). Using the MOLPOP-CEP results (Sect. 3), regions where 36 GHz masers are much brighter than the 44 GHz transition correspond to high density and temperatures, cm-3 and K (Fig. 4). The non detection of the 44 GHz masers can be used to further constrain the density and temperature, using the 36 GHz maser flux densities and rms sensitivity quoted in Pihlström et al. (2014). The average flux density of the 36 GHz masers is 0.21 Jy beam-1, and with a 10 mJy rms sensitivity a 3- detection limit on the 44 GHz masers would correspond to a minimum optical depth ratio of 7. From Fig. 5, this best corresponds to the peak region at cm-3 and K. The presence of high density regimes in this source is confirmed by rich emission from both SiO (Riquelme et al., 2010) and NH3. Likewise, Fig. 5 can be used to predict masers in the 84 GHz transition of mJy beam-1. Confirming this observationally would be a good test of the model calculations.
4.3.2 W28
W28 and G1.4-0.1 are similar in linear sizes (27.9 and 24.7 pc respectively), but W28 is closer (2 kpc compared to 8.5 kpc for G1.4-0.1) and therefore W28 has a substantially larger angular size ( versus ). Consequently, a smaller angular area of W28 (2) was searched for 36 and 44 GHz methanol masers (Pihlström et al., 2014). Two 36 GHz and four 44 GHz masers were found, in contrast to the wealth of 36 GHz methanol emission seen in G1.40.1. The 44 GHz and 36 GHz masers are not co-spatial but instead observed in two distinct groups. Each group is offset from, but nearby, known OH masers, consistent with the methanol masers being associated with a shocked environment.
The clumping of the two transitions implies one lower- and one higher-density region. First, the 44 GHz maser region corresponds to a position of bright NH3 (3,3) inversion line emission (Nicholas et al., 2011) with a critical density close to 104 cm-3. This limits the density regime to cm-3, since at higher densities 36 GHz masers would be expected with similar brightness as the 44 GHz masers. For the clump of 36 GHz emission, the density may be higher ( cm-3), suppressing the 44 GHz transition. Both of these regions are associated via shocks as shown by the presence of OH masers as well as SiO emission (Goss & Robinson, 1968; Frail et al., 1994; Nicholas et al., 2011), and the grouping of methanol masers implies the presence of clumps and/or density gradients.
4.3.3 The Galactic Center Region
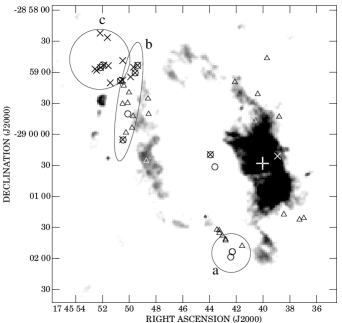
The Galactic Center (GC) is a complex region where at least two SNRs are present (Sgr A East and G359.020.09). The Sgr A East SNR is interacting with the two main molecular clouds, M0.020.07 (a.k.a. the 50 km s-1 cloud) and M0.130.08 (a.k.a. the 20 km s-1 cloud), providing collisionally compressed regions. In this rich environment, four different collisionally excited maser types have been found: 22 GHz H2O, 1720 MHz OH, 36 GHz CH3OH, and 44 GHz CH3OH (Yusef-Zadeh & Mehringer, 1995; Yusef-Zadeh et al., 2008; Sjouwerman et al., 2010; Pihlström et al., 2011a, b). Figure 6 outlines the distribution of methanol and OH masers in the GC as published originally by Pihlström et al. (2011a), using five selected pointing positions. Three regions of methanol masers may be identified, to be discussed in turn: the southern part with a couple of 36 GHz masers (a), a line of co-spatial 36 GHz and 44 GHz masers in the north-east (b), and finally a region in the north-east corner dominated by 44 GHz emission (c).
Region a) in the south, which as in the case of G1.40.1 (Sect. 4.3.1), can be interpreted as a high density, high temperature region with cm-3 and K (Figs. 4 and 5).
Region b) is identified in Pihlström et al. (2011a) as a sharp line following the edge of the radio continuum contour found delineating the SNR shock front. Here, the 36 GHz masers are always much brighter than the 44 GHz masers, with flux density ratios between 10-75. Based on our modeling, this implies that the densities of the region are relatively high, close to cm-3, and thus closely corresponding to values found in region a) as well as in G1.40.1 (Sect. 4.3.1).
Region c) differs somewhat from the previous cases but resembles the group of 44 GHz masers found in W28 (Sect. 4.3.2). One possibility is that these masers originate closer to the inner regions of the molecular cloud, not yet disturbed by the shock with densities cm-3. In this case, they may be associated with star formation. However, an alternative scenario is offered by the recent discovery of a dense molecular shell in this region, outlined by observations in the CS (J=1-0) line (Tsuboi et al., 2012). This shell is also identified via a high SiO/H13CO+ ratio (Tsuboi et al., 2011), indicating a shocked shell. Tsuboi et al. (2011) suggest that this is a young ( years) SNR expanding at a velocity of about 25 km s-1. Such a shock velocity is consistent with a C-shock, allowing the formation of methanol molecules. To detect CS, the density has to exceed the critical density of around cm-3. The positions of the 44 GHz methanol masers follow the dense ridge of this molecular shell (Sjouwerman et al., 2010; Pihlström et al., 2011a), suggesting that these masers may be excited collisionally by a different SNR shock front than those in a) and b). This scenario is currently being investigated in more detail by mapping a more complete region of the GC in both 36 and 44 GHz methanol transitions.
Both methanol transitions in the high-density regions a) and b) are offset spatially (and in velocity) from the 1720 MHz OH, which can be understood by the OH maser being most effective at more intermediate densities of cm-3. However, the optical depth calculations presented in Figs. 4 and 5 allow equally bright 36 GHz and 44 GHz methanol at these intermediate densities, which is not observed. The lack of 36 GHz and 44 GHz masers agrees with the notion that OH molecules are being formed downstream the shock wave, and consequently OH masers are found in the post-shock region where methanol molecules may have been destroyed. The passage of a shock can efficiently enable O atoms for the production of H2O molecules. The formation of OH is a secondary step caused by photo-dissociation of H2O by internally produced UV photons.
Similarly, the high-density regions a) and b) do not harbor any 1612 MHz OH masers (Pihlström et al., 2008). This is expected since when the density in the OH region increases towards values of 10 cm-3, the 1720 MHz OH masers becomes quenched, and the 1612 MHz transition instead becomes strongly inverted (Lockett et al., 1999; Pihlström et al., 2008). The lack of 1612 MHz masers in these regions instead implies a chemistry where the OH abundance is low. This may be explained by gas that is too dense for UV photons to penetrate sufficiently deeply to create large amounts of OH from the photo-dissociation of H2O but keeping the methanol abundance intact.
The above reasoning suggests that the relative distribution of maser species is also a question of relative molecular abundance, rather than simply density differences, emphasizing the need of observing several different molecular transitions to probe the conditions across these regions.
4.4. 84 GHz and 95 GHz Methanol Masers in SNRs
To date, 84 GHz CH3OH maser emission has not been detected toward any SNR, and there appears to be no published systematic searches for this transition towards SNRs. Shulga et al. (2012) report a 95 GHz maser detection toward the SNR Kes 79, speculating that the maser emission is produced from the interaction of the SNR and a neighboring molecular cloud. The 95 GHz emission is brightest at densities around cm-3, but observations of additional transitions will be necessary in order to further constrain the density and temperature. Kes 79 has been detected in the 1720 MHz OH line, although not confirmed as maser emission (Green et al., 1999). The 95 GHz detection is a good example of methanol being a complimentary shock tracer to the OH maser line.
5. Summary
Recent observations of methanol maser lines in SNRs have lacked a more detailed understanding of the density regimes under which the transitions occur. In this paper we presented level population calculations of the 36, 44, 84, and 95 GHz methanol lines. These calculations are used as a diagnostic tool to interpret detections and the relative strength of methanol transitions in SNRs.
While the results can be used for probing the physical conditions of individual regions where methanol masers are detected, they also provide a few summarizing results:
-
•
Given a sufficient methanol abundance, methanol maser emission is obtained over a large range of densities and temperatures.
-
•
Line ratios are significantly changing with altering physical conditions, and regions where multiple transitions are observed allow firmer constraints on the physical parameters.
-
•
Detection of these methanol lines may serve as a complimentary shock tracer in SNRs to the commonly used 1720 MHz OH line. Compared to the OH masers, the velocities of the methanol masers are also more in alignment with the velocities of the cloud.
-
•
By using the calculated line ratios, observations of methanol masers in G1.40.1, W28, and Sgr A East illustrate that a wide range of physical conditions may exist between different SNR/molecular cloud interaction regions, and also within individual interaction regions.
Future work with observing 84 GHz and 95 GHz transitions towards regions where 36 GHz and 44 GHz emission is observed may help confirm these modeling results and conclusions.
References
- Abdo et al. (2010) Abdo, A.A., Ackermann, M., Ajello, M., et al. 2010, ApJ, 718, 348
- Andersen et al. (2011) Andersen, M., Rho, J., Reach, W. T., Hewitt, J. W., & Bernard, J. P. 2011, ApJ, 742, 7
- Bachiller et al. (1990) Bachiller, R., Gomez-Gonzalez, J., Barcia, A., & Menten, K. M. 1990, A&A, 240, 116
- Barrett et al. (1971) Barrett, A. H., Schwartz, P. R., & Waters, J. W. 1971, ApJ, 168, L101
- Batrla et al. (1987) Batrla, W., Matthews, H. E.,Menten, K. M., & Walmsley, C. M. 1987, Nature, 326, 49
- Beuther et al. (2002) Beuther, H., Walsh, A., Schilke, P., et al. 2002, A&A, 390, 289
- Clausssen et al. (1997) Claussen, M.J., Frail,D.A., Goss, W.M., & Gaume, R.A. 1997, ApJ, 489, 143
- Cragg et al. (1992) Cragg, D. M., Johns, K. P., Godfrey, P. D., & Brown, R. D. 1992, MNRAS, 259, 203
- Cragg et al. (2002) Cragg, D. M., Sobolev, A. M., & Godfrey, P. D. 2002, MNRAS, 331, 521
- Cristofari et al. (2013) Cristofari, P., Gabici, S., Casanova, S., Terrier, R., & Parizot, E., 2013, MNRAS, 434, 2748
- Drury et al. (1994) Drury, L. O’C., Aharonian, F.A., & Voelk, H.J., 1994, A&A, 287, 959
- Elitzur & Asensio Ramos (2006) Elitzur, M., & Asensio Ramos, A. 2006, MNRAS, 365, 779
- Fish et al. (2011) Fish, V. L., Muehlbrad, T. C., Pratap, P., et al. 2011, ApJ, 729, 14
- Fontani et al. (2010) Fontani, F., Cesaroni, R., & Furuya, R. S. 2010, A&A, 517, A56
- Frail et al. (1994) Frail, D.A., Goss, W.M., & Slysh, V.I., 1994, ApJ, 424, L11
- Frail & Mitchell (1998) Frail, D.A., & Mitchell, G.F., 1998, ApJ, 508, 690
- Goss & Robinson (1968) Goss, W.M. & Robinson, B.J., 1968, ApJ, 2, L81
- Gray et al. (1991) Gray, M. D., Doel, R. C., & Field, D., 1991, MNRAS, 252, 30
- Gray et al. (2001) Gray, M. D., Cohen, R. J., Richards, A.M.S., Yates, J. A., & Field, D., 2001, MNRAS, 324, 643
- Green et al. (1999) Green, A.J., Frail, D.A., Goss, W.M., & Otrupcek, R., 1999, AJ, 114, 2058
- Kalenskii et al. (2013) Kalenskii, S. V., Kurtz, S., & Bergman, P. 2013, Astronomy Reports, 57, 120
- Hartquist et al. (1995) Hartquist, T. W., Menten, K. M., Lepp, S., & Dalgarno, A. 1995, MNRAS, 272, 184
- Kurtz et al. (2004) Kurtz, S., Hofner, P., & Álvarez, C. V. 2004, ApJS, 155, 149
- Lee et al. (2011) Lee, H.-G.; M,, Dae-Sik, Koo, B.-C., Onaka, T., Jeong, W.-S.; Shinn, J.-H.; & Sakon, I., 2011, ApJ, 740, 31
- Lockett et al. (1999) Lockett, P., Gauthier, E., & Elitzur, M. 1999, ApJ, 511, 235
- Menten (1991) Menten, K. M. 1991, ApJ, 380, L75
- Morimoto et al. (1985) Morimoto, M., Kanzawa, T., & Ohishi, M. 1985, ApJ, 288, L11
- Müller et al. (2004) Müller, H. S. P., Menten, K. M., Mälder, H. 2004, A&A, 428, 1019
- Nicholas et al. (2011) Nicholas, B., Rowell, G., Burton, M. G., et al., 2011, MNRAS, 411, 1367
- Oka et al. (1998) Oka, T., Hasegawa, T., Sato, F., Tsuboi, F., & Miyasaki, A., 1998, ApJSS, 111, 455
- Pavlakis & Kylafis (1996) Pavlakis, K.G., & Kylafis, N.D., 1996, ApJ, 467, 309
- Pihlström et al. (2008) Pihlström, Y. M., Fish, V. L., Sjouwerman, L. O., et al. 2008, ApJ, 676, 371
- Pihlström et al. (2011a) Pihlström, Y. M., Sjouwerman, L. O., & Fish, V. L. 2011a, ApJ, 739, L21
- Pihlström et al. (2011b) Pihlström, Y. M., Sjouwerman, L. O., & Mesler, R. A. 2011b, ApJ, 740, 66
- Pihlström et al. (2014) Pihlström, Y. M., Sjouwerman, L. O., Frail, D.A., et al. 2014, AJ, 147, 73
- Plambeck & Menten (1990) Plambeck, R. L., & Menten, K. M. 1990, ApJ, 364, 555
- Pottage et al. (2004) Pottage, J. T., Flower, D. R., & Davis, S. L. 2004, MNRAS, 352, 39
- Pratap et al. (2008) Pratap, P., Shute, P. A., Keane, T. C., Battersby, C., & Sterling, S. 2008, AJ, 135, 171
- Riquelme et al. (2010) Riquelme, D., Bronfman, L., Mauersberger, R., May, J., & Wilson, T.L., 2010, A&A, 523, 45
- Röllig et al. (1999) Röllig, M., Kegel, W.H., Mauersberger, R., & Doerr, C., 1999, A&A, 343, 939
- Schöier et al. (2011) Schöier, F.L., van der Tak, F.F.S., van Dishoeck E.F., Black, J.H., 2005, A&A, 432, 369
- Shulga et al. (2012) Shulga, V. M., Zubrin, S. Y., & Myshenko, V. V. 2012, Radio Physics and Radio Astronomy, 3, 19
- Sjouwerman et al. (2010) Sjouwerman, L. O., Pihlström, Y. M., & Fish, V. L. 2010, ApJ, 710, L111
- Tsuboi et al. (1999) Tsuboi, M., Handa, T., & Ukita, N., 1999, ApJSS, 120,1
- Tsuboi et al. (2011) Tsuboi, M., Tadaki, K., Miyazaki, A., & Handa, T., 2011, PASJ, 63, 763
- Tsuboi et al. (2012) Tsuboi, M., & Miyazaki, A., 2012, PASJ, 64, 111
- Voronkov et al. (2006) Voronkov, M. A., Brooks, K. J., Sobolev, A. M., et al. 2006, MNRAS, 373, 411
- Yusef-Zadeh & Mehringer (1995) Yusef-Zadeh, F., & Mehringer, D. M. 1995, ApJ, 452, L37
- Yusef-Zadeh et al. (2003) Yusef-Zadeh, F., Wardle, M., Rho, J., & Sakano, M., 2003, ApJ, 585, 319
- Yusef-Zadeh et al. (2008) Yusef-Zadeh, F., Braatz, J., Wardle, M., & Roberts, D. 2008, ApJ, 683, L147