Cell resolved, multiparticle model of plastic tissue deformations and morphogenesis
Abstract
We propose a three dimensional mechanical model of embryonic tissue dynamics. Mechanically coupled adherent cells are represented as particles interconnected with elastic beams which can exert non-central forces and torques. Tissue plasticity is modeled by a stochastic process consisting of a connectivity change (addition or removal of a single link) followed by a complete relaxation to mechanical equilibrium. In particular, we assume that (i) two non-connected, but adjacent particles can form a new link; and (ii) the lifetime of links is reduced by tensile forces. We demonstrate that the proposed model yields a realistic macroscopic elasto-plastic behavior and we establish how microscopic model parameters affect the material properties at the macroscopic scale. Based on these results, microscopic parameter values can be inferred from tissue thickness, macroscopic elastic modulus and the magnitude and dynamics of intercellular adhesion forces. In addition to their mechanical role, model particles can also act as active simulation agents and modulate their connectivity according to specific rules. As an example, anisotropic link insertion and removal probabilities can give rise to local cell intercalation and large scale convergent extension movements. The proposed stochastic simulation of cell activities yields fluctuating tissue movements which exhibit the same autocorrelation properties as empirical data from avian embryos.
1 Introduction
Tissue engineering, the controlled construction of tissues – cells and their extracellular matrix (ECM) environment – is a promising avenue for future biomedical innovations. To realize this possibility, the dynamic and mutually interdependent relationship between cell and tissue movements has to be understood. The cytoskeleton as well as embryonic tissues are dynamic structures, capable of both relaxing and generating mechanical stress. A key, and little explored mechanical component of sustained tissue movement is plastic behavior [1, 2, 3, 4] – irreversible alteration of the driving force-free tissue shape. Plasticity is clearly important during embryonic development as stresses do not accumulate in embryonic tissues, despite the large deformations.
Deformation of physical objects subjected to external or internal forces are usually calculated by the partial differential equations (PDE) of continuum mechanics – this approach uses spatially resolved mechanical stress and strain tensors as model variables [5]. Active biomechanical processes are usually modeled using a spatial decomposition and re-assembly method [6]: if the behavior (growth, shape change) of specific parts of the structure are known in mechanical isolation (free boundary conditions), then constraining adjacent parts to form a smooth continuum can yield the deformation of the whole composite structure. In this manner, one can evaluate how autonomous shape changes in one part of the embryo (prescribed “growth laws”) can drive tissue movements elsewhere [7, 8]. In this approach, the cellular origin of the “growth laws” is not explained. Yet, this is a challenging problem as most often the cellular changes are not just the scaled-down reflections of tissue deformations. For example, vertebrate embryos elongate substantially during early development, yet cells of the epiblast maintain their isotropic aspect ratio. Therefore, several tissue-level effects are puzzling outcomes of cellular activities, which are “purposeful” changes in cell-cell and cell-ECM contacts.
To connect cell activity such as active intercalation or collective migration to tissue movements it is often advantageous to model individual cells and obtain the tissue scale behavior through computer simulations. Widely used models for cell-cell interactions represent individual adherent cells as “fluid” droplets, like the cellular Potts model [9, 10] and its grid-free version, the subcellular element model [11, 12]. These model choices are motivated by the demonstrated non-Newtonian fluid-like behavior of simple cell aggregates [13]. Cell-based models have been used to formulate hypotheses for cell activity (such as chemotactic guidance) and used to develop simulations to obtain tissue movements [14, 15, 16]. Such models are, however, not yet used to predict mechanical stresses. Furthermore, as discussed recently [17] these simulations often include biomechanical artifacts such as friction with a non-existing reference frame. In particular, within the freely floating embryonic cell mass the momentum is conserved (while the momentum is not conserved when cells can exert traction on an underlying surface).
Another class of models used to model epithelial morphogenesis is termed “vertex models”, in which each cell is represented by a polygon corresponding to the cell membrane [18, 19]. The polygon vertices are usually points belonging to the boundary of three adjacent cells. Cell movements are due to the motion of these vertices, which in turn are often assumed to be driven by cortical cytoskeletal contractivity, surface tension due to intercellular adhesion and hydrostatic pressure difference between adjacent cells [20]. Such models can also include cell neighbor exchange, perhaps the most significant is the T1 transition in which two adjacent cells are separated by the contact of their immediate lateral neighbors. These models are extremely suitable to describe morphogenetic movements in Drosophila [21] and zebrafish [22], where the contractile cytoskelton is localized in a thin cortical layer adjacent the cell membrane. While most studies utilizing the vertex models are confined to two dimensions, a generalized vertex model which describes cells as three dimensional prisms was also proposed [23].
In this paper we introduce a cell-resolved, three dimensional off-lattice model of tissue layers that (i) does not assume that cytoskeletal contractility is localized in the cortical cytoskeleton, and (ii) is computationally simpler than the 3D vertex models. In the model proposed here, one particle represents a single cell, but in contrast with similar cell-center or spheroid models [24, 25], the mechanical connectivity of the cells are explicitly represented as elastic beams connecting adjacent particles. The beams can be compressed, stretched, bent and twisted. Therefore, instead of central forces, these links can exert torques and forces that are not parallel to the line connecting the particles. We assume that the tissue is always in mechanical equilibrium, i.e., cellular activity (contraction, rearrangement of the links) is slow compared to the time needed for the environment to accommodate these changes. The great advantage of explicit cell-cell contact representation is that we can formulate certain cell activities or plastic stress relaxation as rule sets that specify probabilities for the removal and insertion of links, or alter the equilibrium properties of existing links. Thus, as we demonstrate, convergent-extension movements can be simulated by preferentially creating new links along one direction while removing links in the perpendicular direction.
2 Model
2.1 Mechanics
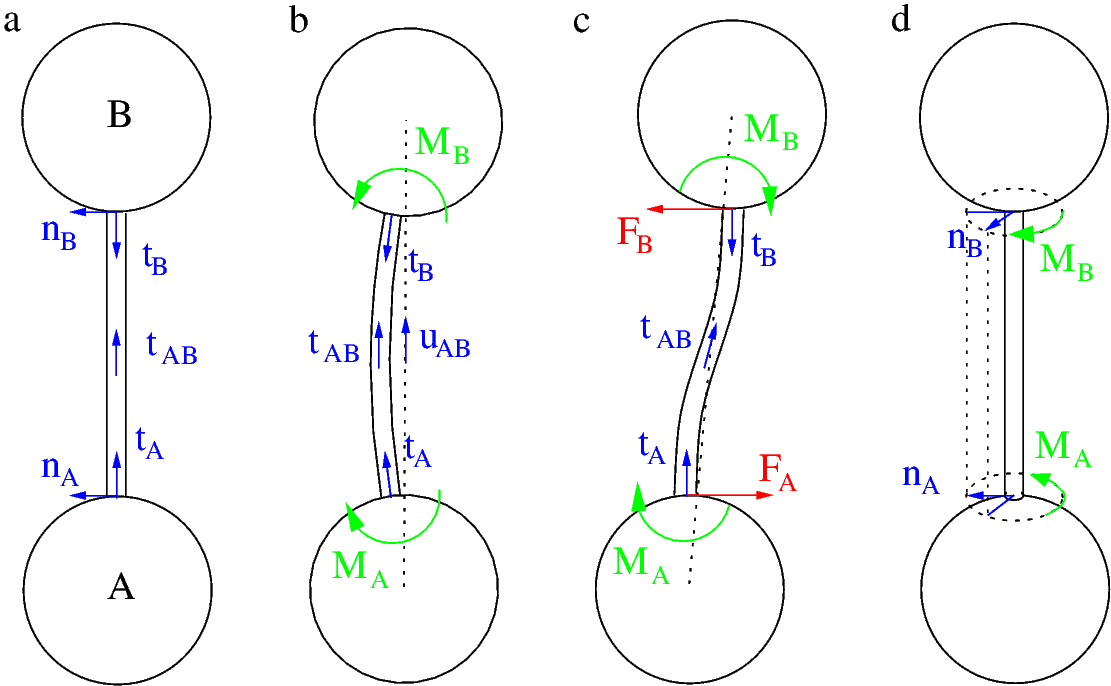
In our model cells are represented as particles, characterized by their position and orientation ( and for particle , respectively). The mechanical connection between cells is modeled with links that can exert non-central forces and torques. As we focus on mechanical equilibrium, the inertia (mass) of these model objects are irrelevant.
Torques are exerted if links are deformed: we envision a behavior similar to that of coil springs. A pair of unit vectors, and , specify the mechanically neutral link direction and orientation of link at particle (Fig. 1a). These vectors co-rotate with the particle:
| (1) |
and
| (2) |
where is the rotation operator and and denote the neutral link directions in the initial configuration where .
A link is bent if its preferred direction at the particle is distinct from its actual direction , the unit vector pointing from particle to (Fig. 1). We assume that the torque exerted by such a link on particle is
| (3) |
where the microscopic bending rigidity is a model parameter. Thus, a stress-free (“straight”) link is pointing in a direction . In general, the torque (3) rotates particle so that aligns with (Figs. 1b and c).
We choose Eq. (3) due to its simplicity. However, a real mechanical system composed of flexible beams would exert similar torques if particles are much smaller than the length of the interconnecting beams, and beams are softer at their ends hence deformations are localized to the vicinity of the particles. In such cases the preferred link direction is the tangent vector of the link at the surface of particle , and the tangent vector at the midpoint, , is well approximated by .
Torsion of link is characterized by two normal vectors, and , assigned to each end of the link (Figs. 1a and d). Their specific orientation (normal to the link) is irrelevant, but in the undeformed state . For small deformations the torque is assumed to be proportional to the torsion angle, measured as the angle between the normal vectors as:
| (4) |
where the model parameter is the microscopic torsional stiffness.
We assume, that in a general situation the net torque of link acting on particle is a superposition of the torques associated with bending and torsion:
| (5) |
Similarly, for particle at the other end of the link :
| (6) |
where .
If a link exerts forces and as well as torques and at its endpoints (Fig. 1c), the link is in mechanical equilibrium if
| (7) |
and
| (8) |
To determine the force , we introduce a unit vector orthogonal both to and as
| (9) |
We decompose the forces into orthogonal components as
| (10) |
Substituting the composition (10) into Eq. (8) yields
| (11) |
After evaluating the cross products we obtain
| (12) |
hence
| (13) |
and
| (14) |
Finally, is determined by Hook’s law as
| (15) |
where is the equilibrium length of link and is the microscopic elastic modulus, the third model parameter.
2.2 Mechanical equilibrium
A particle may be attached to multiple links and also be the subject of external forces or torques. Net forces
| (16) |
and torques
| (17) |
are calculated by summation over , the set of links associated with particle . In mechanical equilibrium and are zero for each particle . The equilibrium configuration, however, is difficult to obtain directly due to the nonlinear dependence of the forces on particle positions. Instead, we utilized the following overdamped relaxation process:
| (18) |
and
| (19) |
where and are projector matrices to constrain the movement and rotation of node , respectively. For unconstrained particles and are identity matrices. As the particles rotate, the unit vectors of neutral link direction and orientation associated to link and particle are updated according to (1) and (2).
For a given initial condition, the configuration corresponding to mechanical equilibrium is calculated by solving the coupled ordinary differential equations (18) and (19) by a fourth order Runge-Kutta method. The relaxation was terminated when the magnitude of the net total force and torque in the system fell below a threshold value.
2.3 Initial condition, connectivity
Two dimensional initial conditions were generated by randomly positioning particles in a square of size . Thus, the spatial scale unit of the simulations is set as the average cell size, 10 m and the simulated 2D cell density is 1 cell/unit area. In the initial condition we enforced that the distance of two adjacent particles is greater than . Particles that are Voronoi neighbors are connected by links when their distance is less than . This rule yields a mean link length of . For a stress-free initial configuration we set the , vectors as well as the equilibrium link lengths so that no internal forces or torques are exerted in the system.
2.4 Plasticity
Tissue plasticity is modeled by specific rules that reconfigure the links. As cells can both form new intercellular adhesions and remodel existing ones, in our model the topology of connections changes in time. In particular, we assume that the lifetime of a link is reduced by tensile forces. For a given link, , the probability of its removal during a short time interval follows Bell’s rule [26] as
| (20) |
where is a threshold value, and is a scaling factor which sets the fragility of the connections.
Two adjacent particles (Voronoi neighbors), and , can establish new contacts if their distance is less than . During a short time interval , the probability of this event is a decreasing function of the distance:
| (21) |
The scaling factor represents the level of cellular protrusive activity devoted to scanning the environment and the ability to form intercellular contacts.
Simulations are event-driven: using the probability distributions (20) and (21), we generate the next event and waiting time according to the stochastic Gillespie algorithm [27]. The waiting time until the next event is chosen from the distribution
| (22) |
where the sums are evaluated using all possible particle pairs not connected by a link as well as enumerating existing links .
After each event, the system is relaxed into a mechanical equilibrium. A new link is assumed to be stress free immediately after insertion. Cells, however, are expected to maintain a certain area or volume, characterized by the mean stress free link length . To reflect this process in our model, the equilibrium length of each link evolves in time according to the stochastic dynamics
| (23) |
where is an uncorrelated white noise with variance .
The simulation time is set by the and parameters. We set our time unit as s, the time needed for two adjacent cells to establish a mechanical link. The time needed for a cell-cell contact to mature is min. We also set the lifetime of an unloaded link to min, thus two cells pulled away by a force separate in s.
3 Results
3.1 Elastic parameters
To establish the connection between the macroscopic material parameters such as Young’s modulus and the microscopic model parameters , and , we simulated elastic deformations in response to uniaxial tension, in-plane shear and (three dimensional) plate bending. The simulations started from a stress-free initial condition and the same microscopic parameters were assigned to each particle. During these simulations the connectivity of the particles and the equilibrium link properties do not change, hence the system exhibits a pure elastic behavior. The forces and torques exerted by the links are proportional to the microscopic parameters , and . Thus, in the simulations we set the scale of forces as , i.e., the force required to extend a cell twofold along one direction. This choice of force unit allowed us to perform the simulations with .
3.1.1 Uniaxial tension.
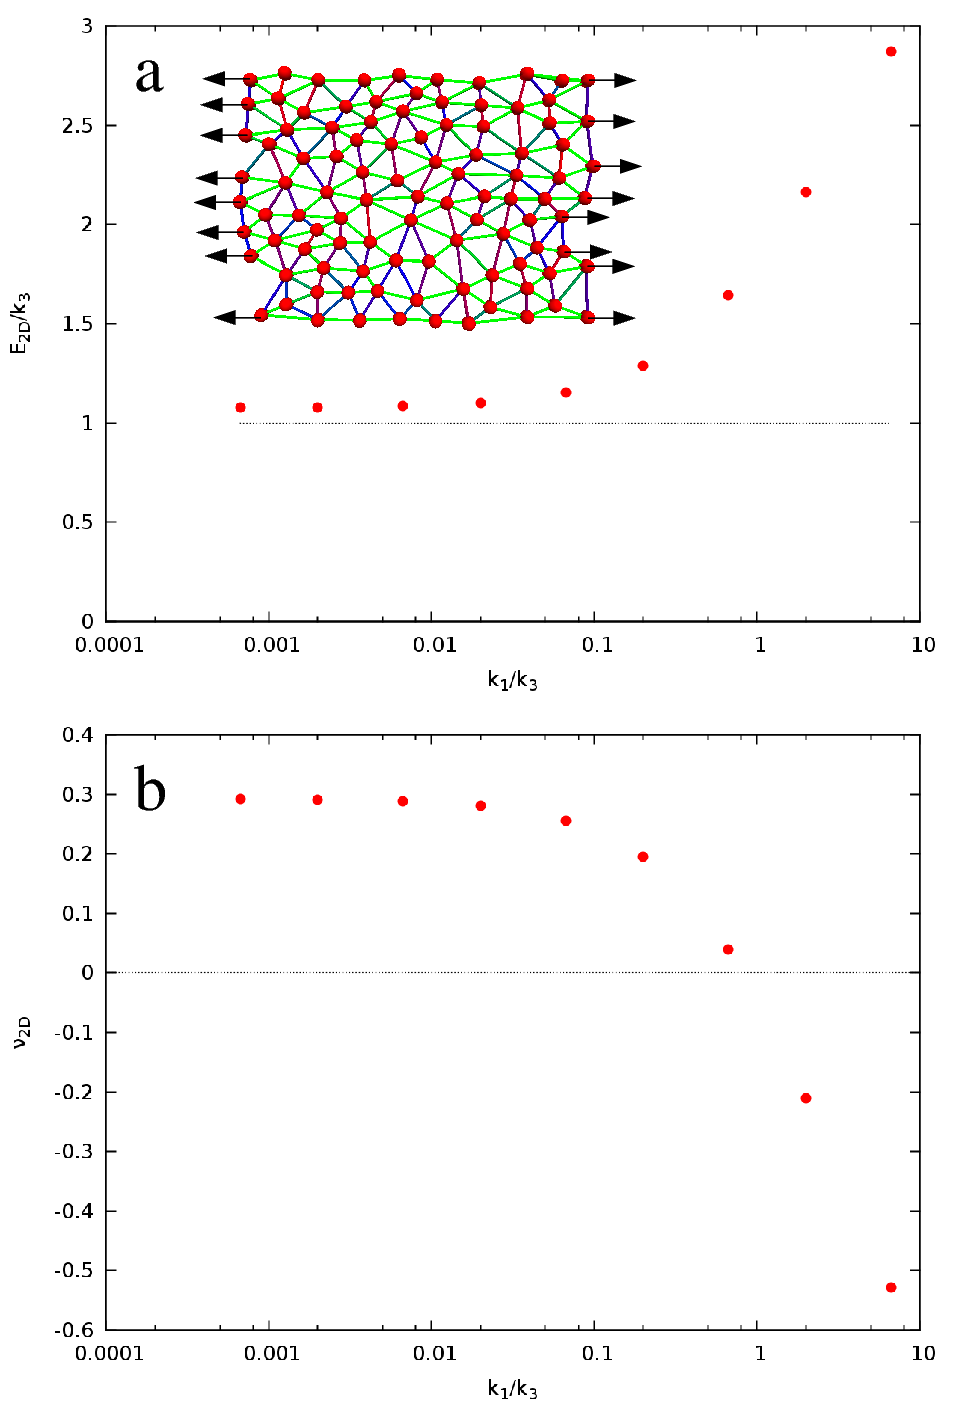
We applied external, outward-directed forces on particles that are on the left and right side of the test object (Fig. 2a, inset). The external force acting on particle is
| (24) |
Parameters and are chosen in such a way that the net external force is zero and the magnitude of external forces acting on either side is
| (25) |
After obtaining mechanical equilibrium, we determined the axial elongation and transverse contraction . The 2D elastic (Young’s) modulus was calculated from the engineering stress and strain as
| (26) |
where is the slope of a linear fit over the vs data points, obtained in the range of . Similarly, the 2D Poisson’s ratio is obtained as
| (27) |
where is the slope of a linear fit over the vs data points.
Since the deformation is planar, interparticle links do not twist. Therefore, and do not depend on the value of . The bending rigidity parameter , however, can substantially influence both material parameters (Fig. 2). For , the external forces are mainly balanced by the elongation of the interparticle links. In this regime thus . The 2D Poisson’s ratio is well approximated by , the change in the aspect ratio of a triangular lattice when stretched in one direction while keeping the length unchanged for the rest of lattice links. In contrast, for bending rigidity of the nodes substantially influences the elastic behavior of the system. Interestigly, for as link angles are maintained to such an extent that uniaxial stretching will result in an isotropic expansion of the entire mesh. As this regime is biophysically implausible, we restrict the bending rigidity parameter in the
| (28) |
regime.
3.1.2 In-plane shear.
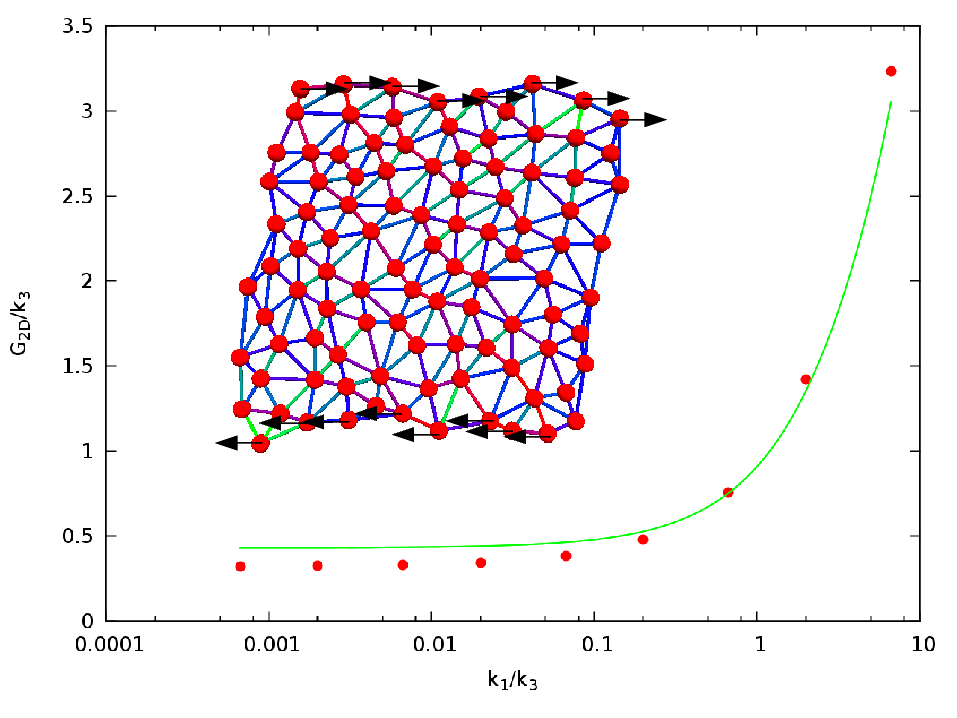
In these simulations external shear forces were applied in two layers as
| (29) |
so that the net external force is zero, and the total force is given by (25). To avoid rotation of the simulated system, particles subjected to external forces were also constrained to move along the x axis.
The shear deformation was quantified using the mean displacements of the stripes where forces were acting. The 2D shear modulus was calculated as
| (30) |
where is the slope of a linear fit over the vs data points. The obtained shear moduli are well approximated by
| (31) |
the relation expected for an isotropic homogeneous linear elastic solid (Fig. 3).
3.1.3 Bending.
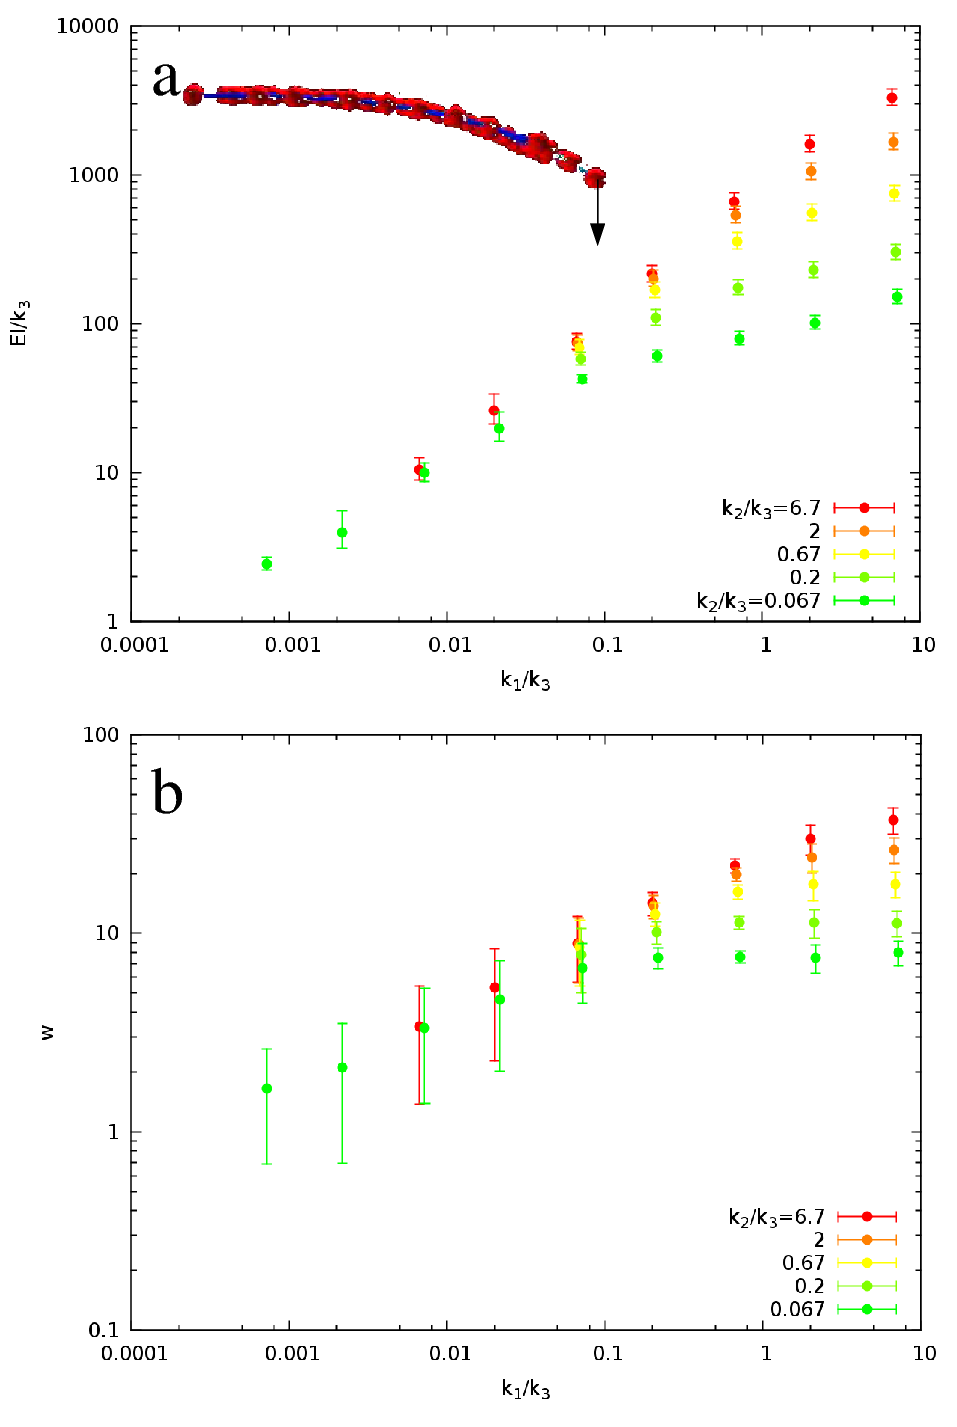
To calibrate the bending rigidity of the modeled tissue layer, we simulated a plate immobilized along one side and bent by a perpendicular force exerted at the opposite side. The loading force was localized at the rightmost 10% of the particles, acting in a direction perpendicular to the plane of the particles (Fig. 4).
Simulations revealed that the longitudinal cross section of the deflected monolayer is well approximated by a cubic function – as expected from a beam with finite thickness. Thus, despite the fact that in our model bending rigidity does not arise through the Euler-Bernoulli/Love-Kirchhoff mechanism, we defined and used the modulus to relate the deflection to the loading force as
| (32) |
This “effective” bending modulus can be tuned over several orders of magnitude, and it is a monotonic, nonlinear function of the microscopic model parameters and (Fig. 4). When torsion of the links is negligible (), the bending modulus is proportional to the microscopic bending modulus . In contrast, when the macroscopic curvature of the simulated sheet is mainly accommodated by torsion of the links, hence in this regime depends less on the value of .
The bending modulus also allows one to associate an effective layer thickness to a set of microscopic model parameters. For a homogenous elastic material of thickness and the same lateral size the second moment of the cross-sectional area is
| (33) |
If the stretch data shown in Fig. 2 were measured on the same material with a cross section of , then its (three dimensional) Young’s modulus was
| (34) |
Using the bending modulus values shown in Fig. 4, and substituting and into (32) we obtain
| (35) |
yielding
| (36) |
As an example, the parameters are consistent with a plate that is composed of columnar cells with an aspect ratio of 1:3 (Fig. 4b).
These results allow further refinement of our force scale as follows. According to Fig. 2, the 2D Young’s modulus is well approximated by in the regime. The corresponding 3D elastic modulus is then . For the avian epiblast both and values are reported in the literature. Using the values of kPa [28] and m [29], we obtain
| (37) |
for the value of our force unit.
3.2 Plastic behavior
Link remodeling allows the simulation of elasto-plastic behavior. As the probability of link removal depends on its load, mechanical stresses are thus accommodated and relaxed in an irreversible process. To characterize macroscopic plastic behavior, we simulated two standard, external force-driven processes: force relaxation within a pre-stressed configuration and creep under uniaxial tension. In both scenarios the initial condition involved external forces that pulled longitudinal links with an average force of .
3.2.1 Relaxation of mechanical tension.
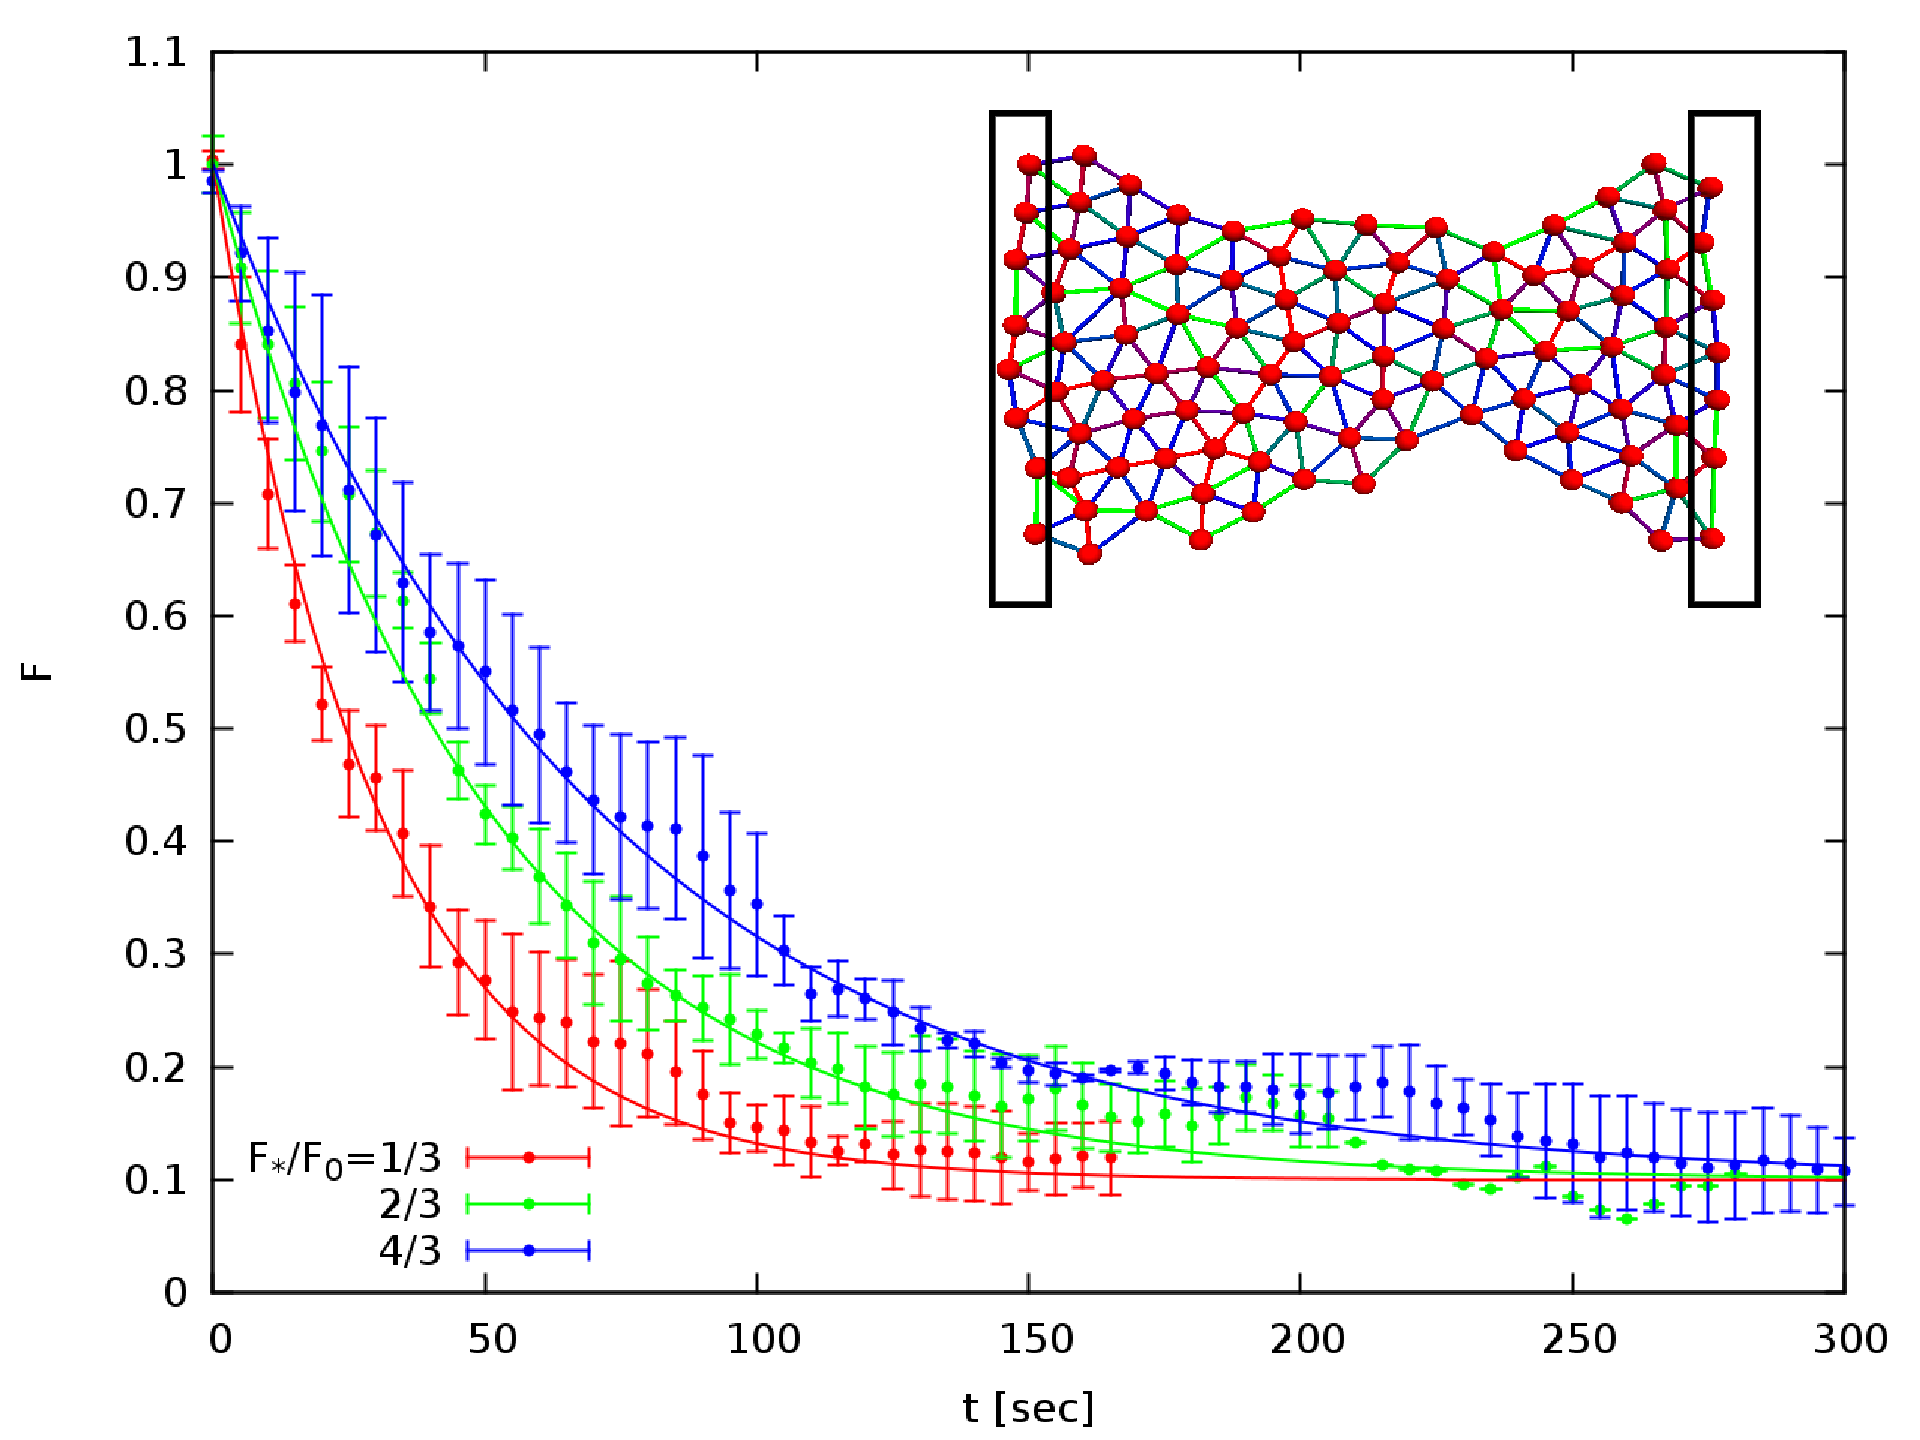
To investigate how the simulated structure can relax mechanical stresses, first an elastic mechanical equilibrium was obtained in the presence of external uniaxial tensile forces according to (24). Then, both sides of the stretched sample were fixed in space by replacing the external forces of Eq (24) by stiff springs as
| (38) |
where the parameter sets the stiffness of the constraint and denotes the position of particle at the onset of the plastic relaxation process. This initial condition was used for the plasticity algorithm that generated a series of link removal and insertion events, each followed by updating the configuration to reflect the new mechanical equilibrium. In each configuration, we evaluated the external forces that were needed to maintain the pre-set extension. As Fig. 5 demonstrates, the net force exerted at either side decays in time as an exponential function to a positive value (the yield stress), and the characteristic time is approximately proportional to the critical force parameter . The magnitude of the characteristic times are in good agreement with the experimental data of [13]. During the process particles are rearranged in such a way that the isotropy of link lengths (i.e. cell shape) is restored. The shortening of the longitudinal links was achieved by intercalation: cells in adjacent rows moved into a single row. Hence, in this setting cell intercalation is driven by an external mechanical load. Forces do not diminish completely as the stressed bonds are likely to form again if the mechanical stress within the simulated tissue is too small to move particles further apart.
3.2.2 Creep under constant tension.
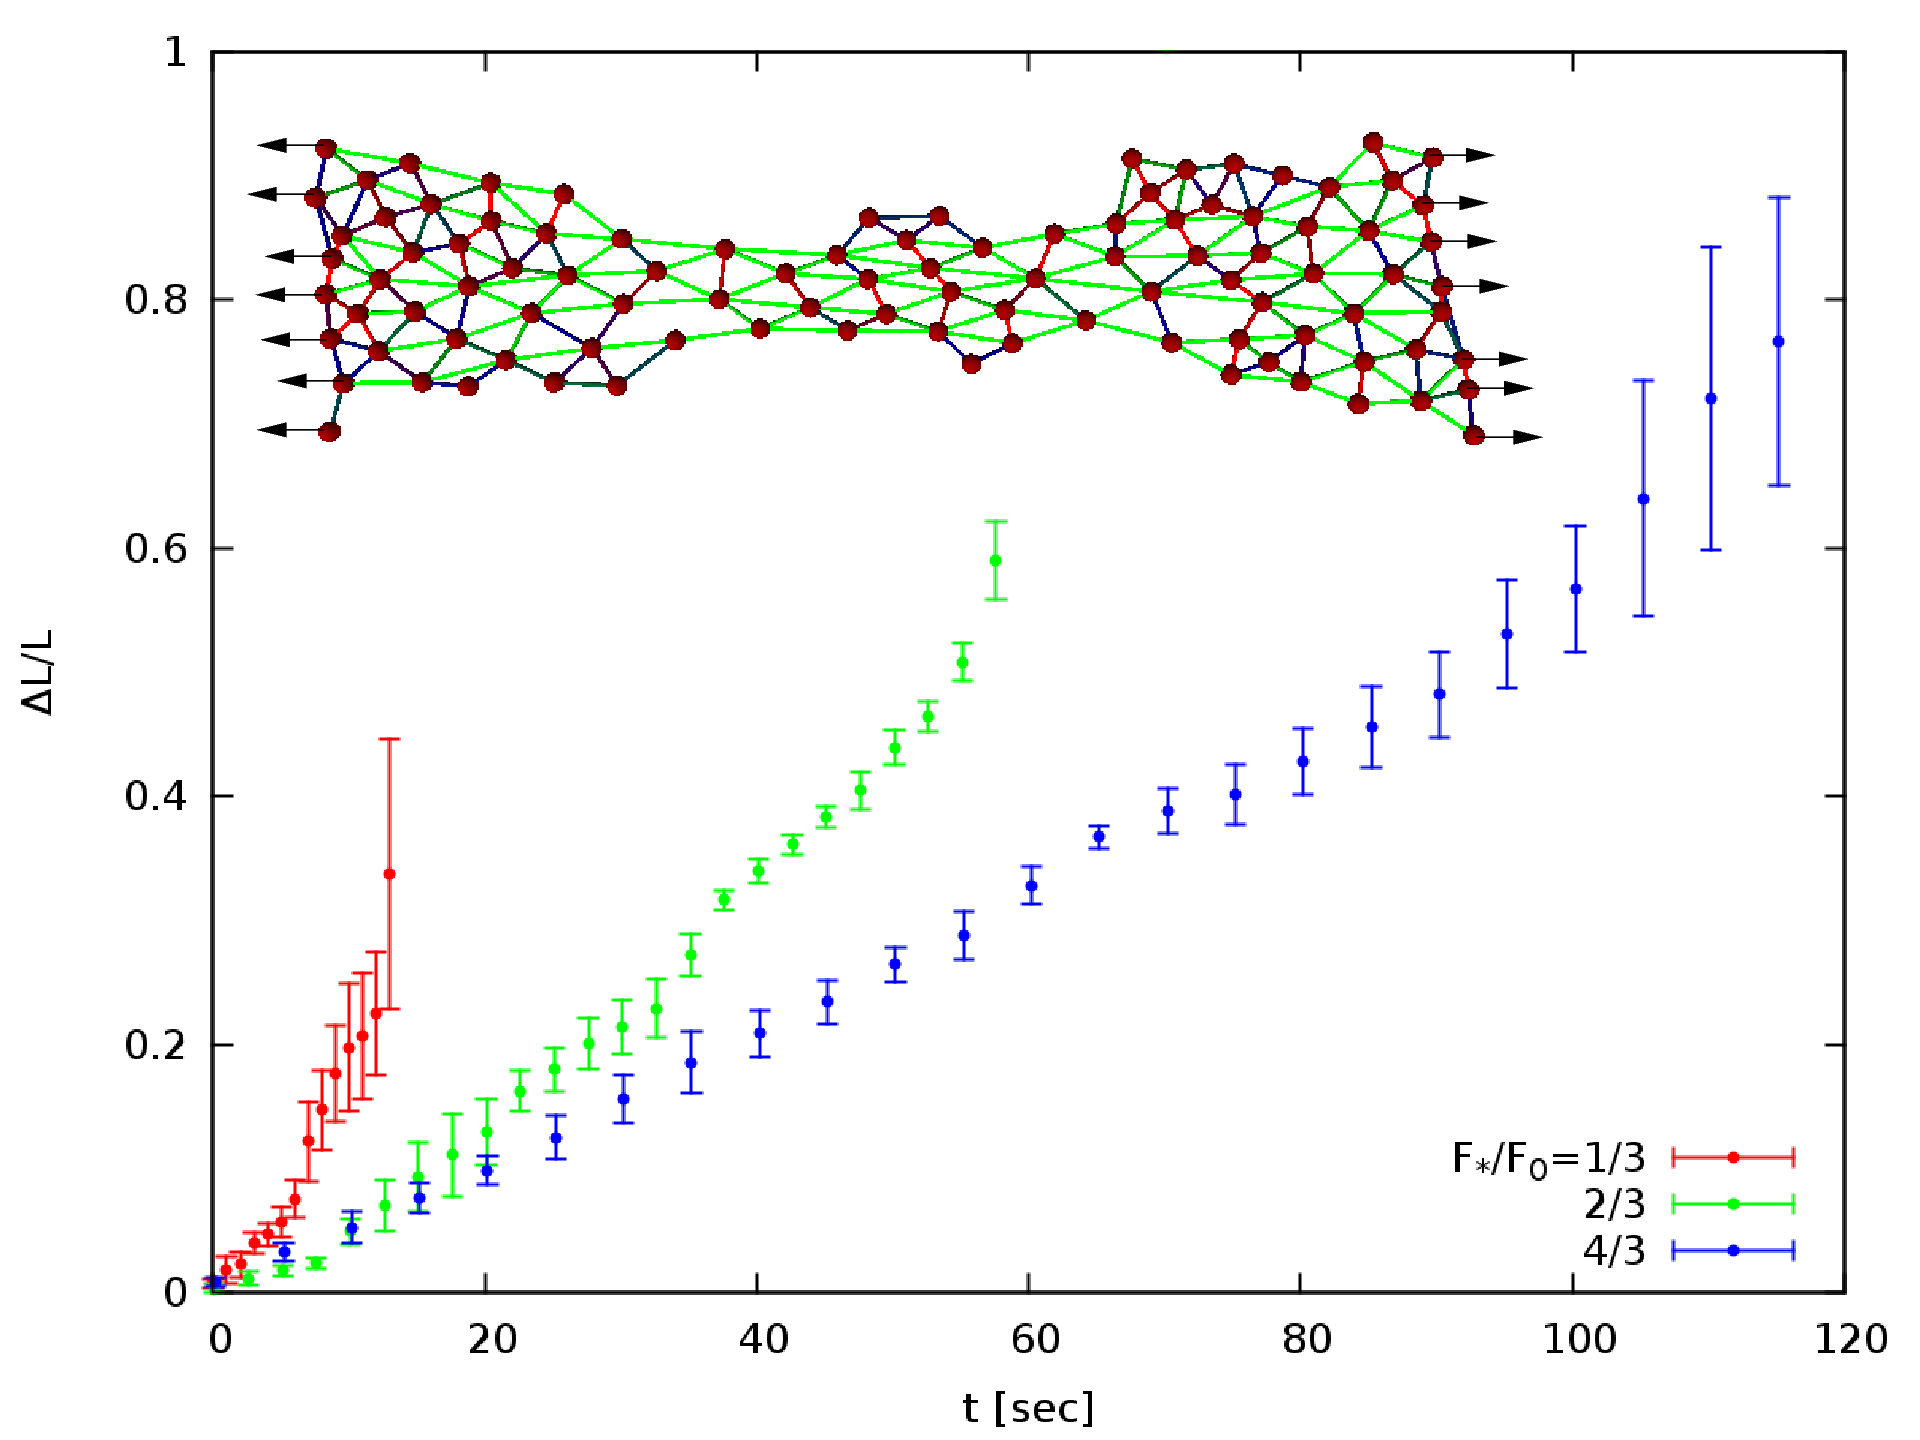
In a set of complementary simulations the loaded edges were hardened to prevent detachment of the particles. Thus, particles exposed to external forces maintained their orientation by setting to null matrices in Eq. (19) and were connected by more stable links (i.e., links with increased parameter). In these simulations the sample gradually extends and narrows (Fig. 6). The initial strain rate is set by the magnitude of the external load and . However, as links are removed faster than new ones are inserted, the strain rate increases with time (necking).
3.3 Cell movements and active cell adhesion control
Model particles can be also considered as simulation agents, executing certain prescribed actions in addition to passively responding to the mechanical forces exerted. Such actions may involve the modulation of link parameters such as the equilibrium link length or the neutral link direction. Furthermore, the probabilities associated with the formation or severance of links may also be controlled. These potential control mechanisms allow the simulation of various cell autonomous behavior and their collective effects.
3.3.1 Active intercalation.
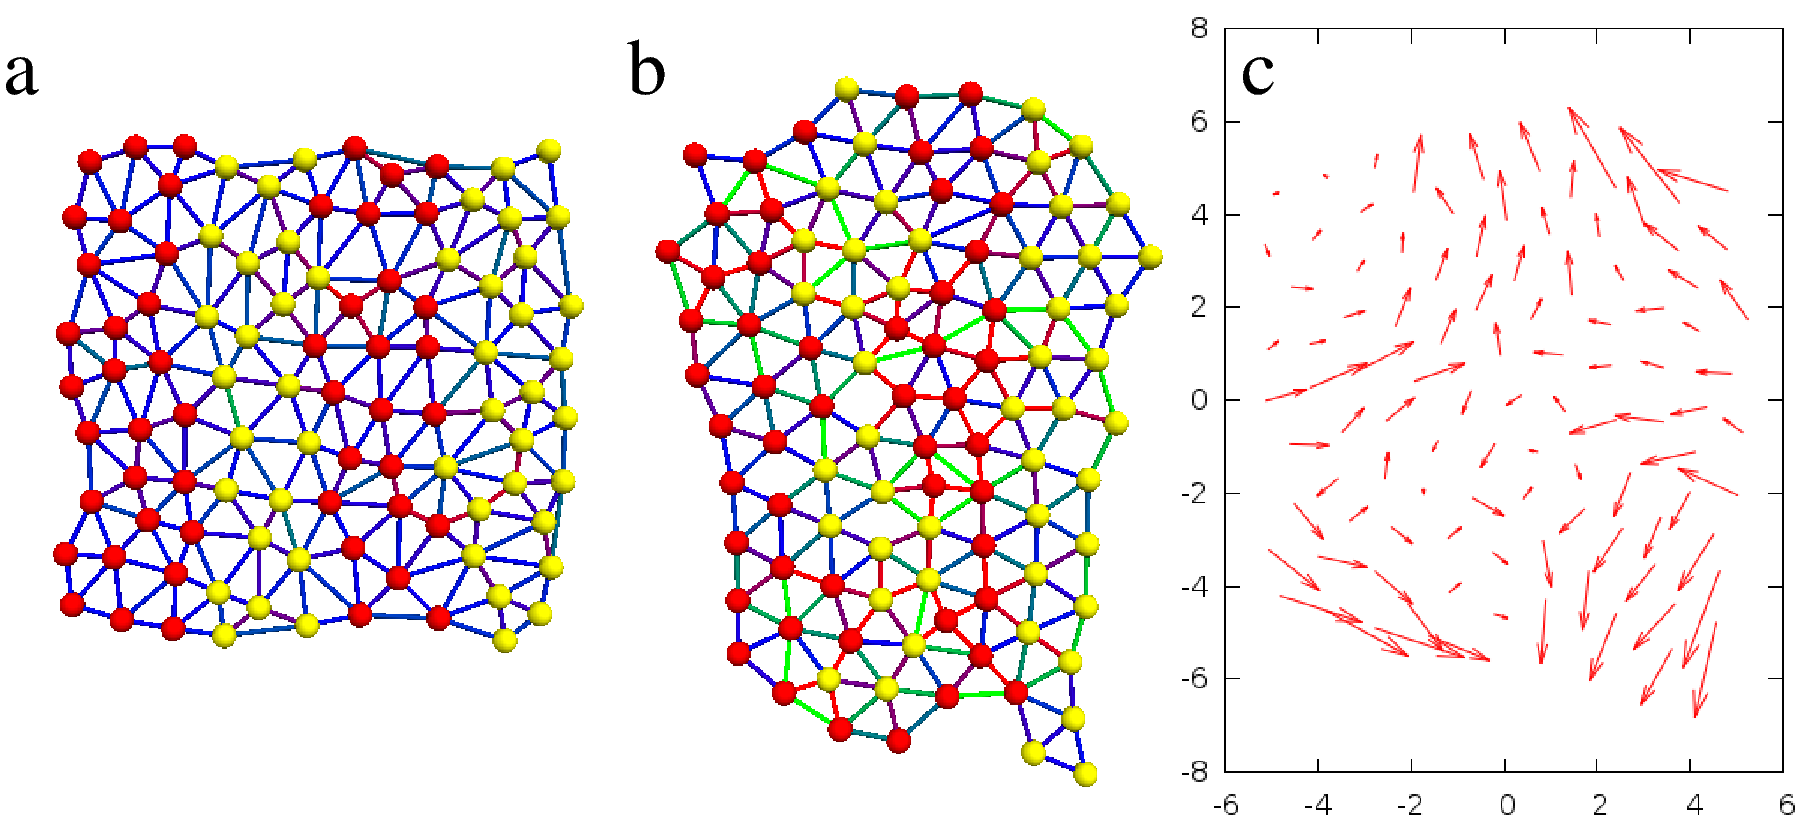
Anisotropic cell activities were suggested to drive active intercalation movements of early vertebrate embryos [30]. In our model link removal events allow adjacent particles to rearrange their connections. To model active intercalation we assume that cells are more likely to extend processes and establish intercellular contacts along a selected direction (). Thus Eq. (21) is expanded as
| (39) |
where is a parameter tuning the strength of anisotropy. Similarly, links perpendicular to are expected to be less stable, reflected by the modified expression (20)
| (40) |
Simulations performed with orientation-dependent link probabilities (), and with random cell detachments as a driving mechanism, yield both the local cell intercalation and the gradual elongation and lateral contraction (i.e., convergent-extension movements) of the tissue (Fig. 7).
3.3.2 Autocorrelation functions.
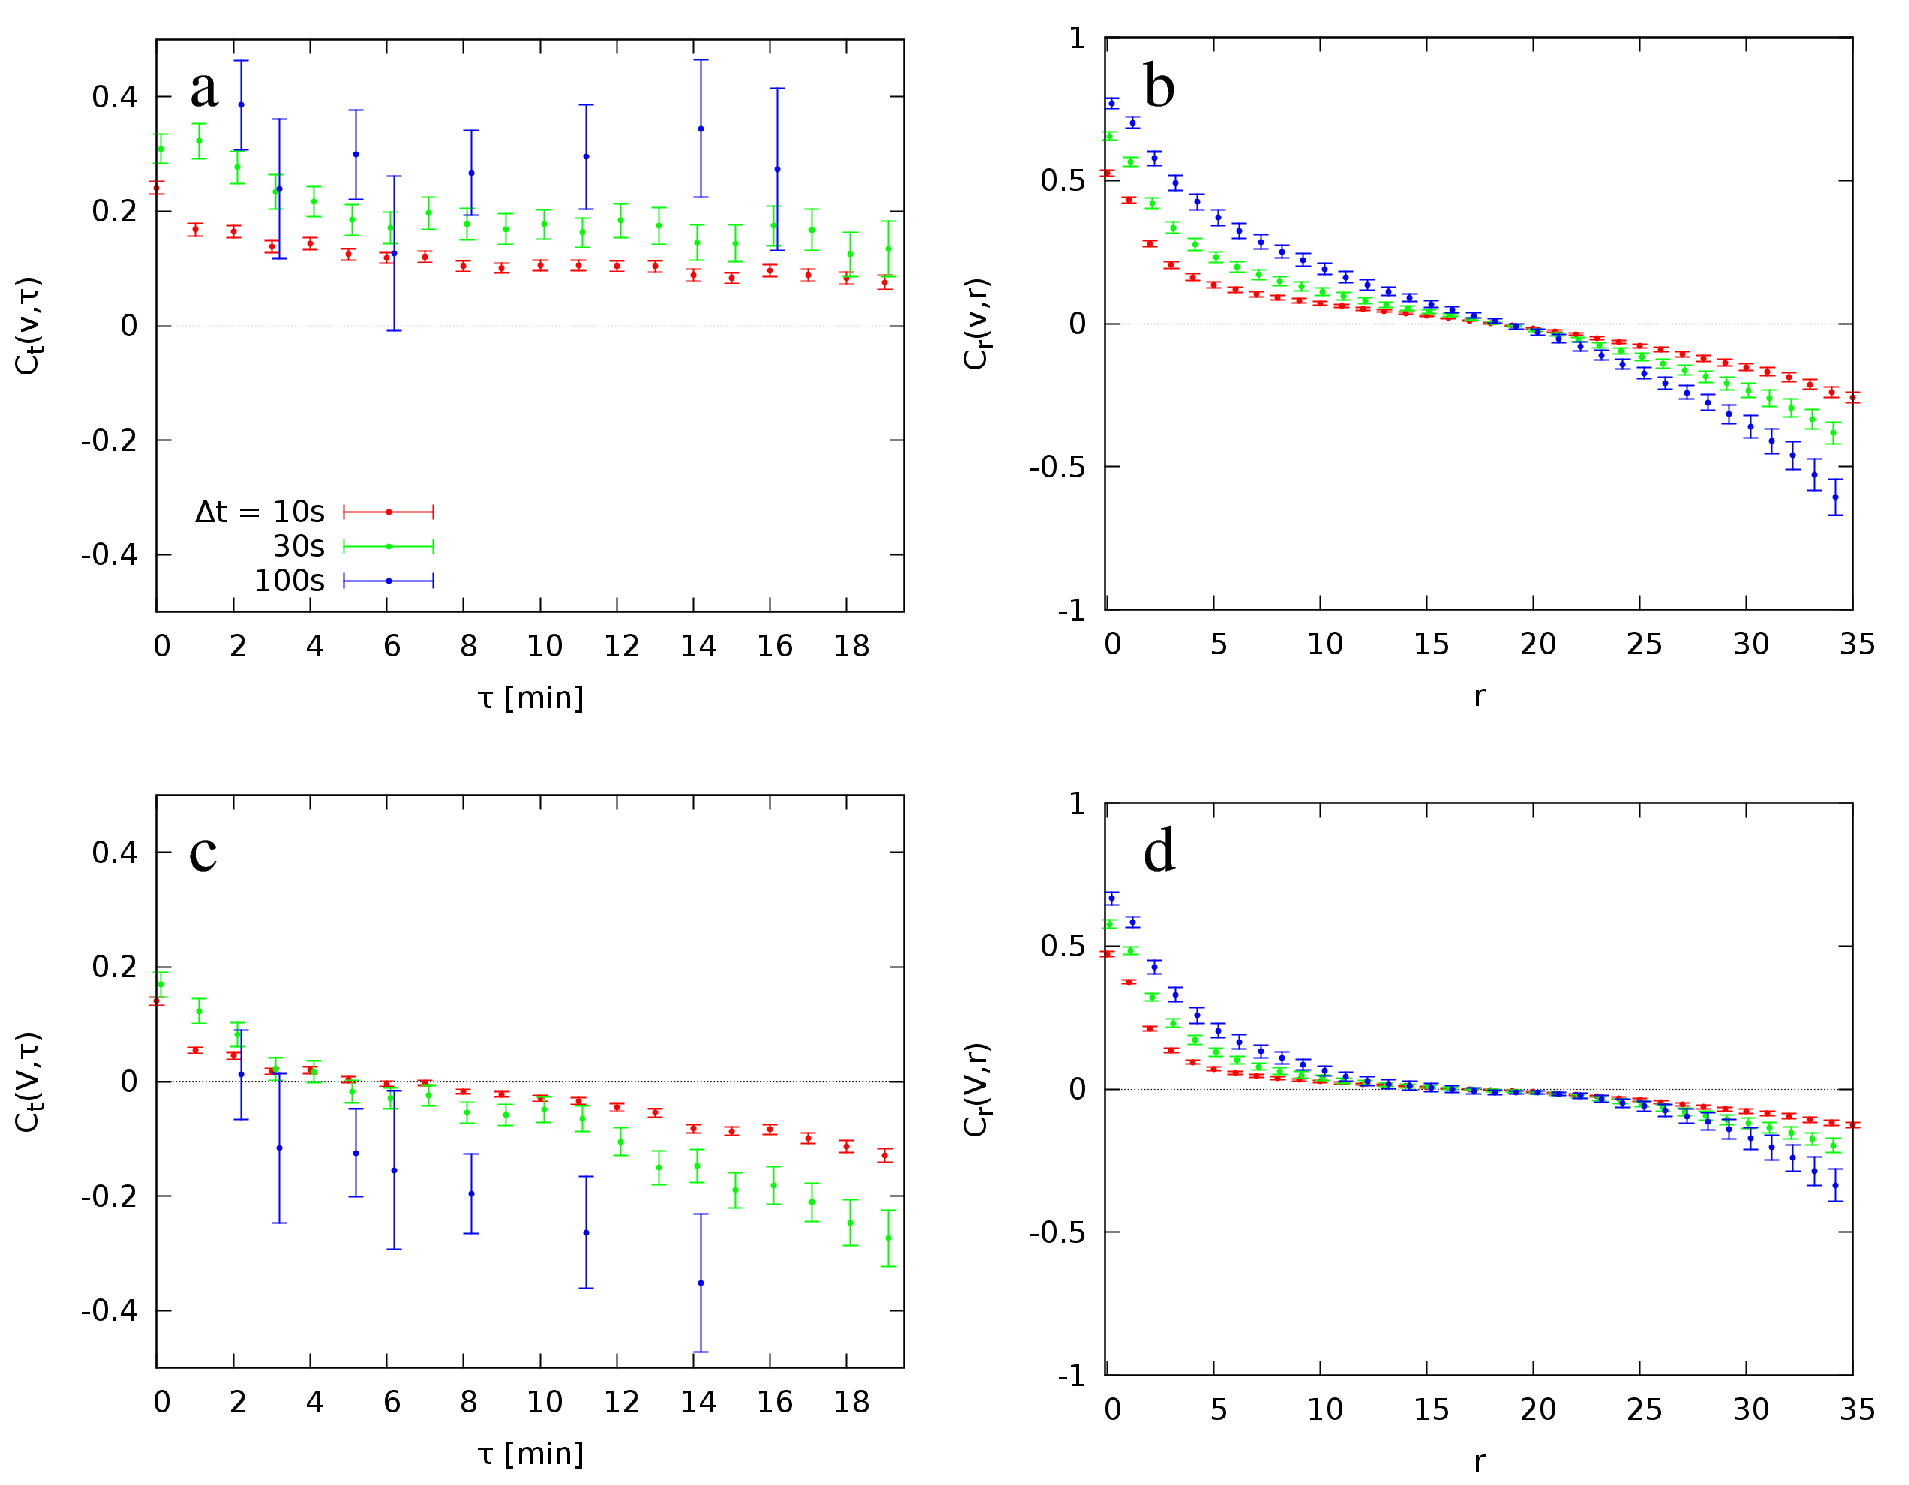
The spatial and temporal correlations of tissue movements can be used to characterize both simulations (Fig. 8) and empirical data [17]. For an arbitrary quantity , temporal autocorrelations are calculated using
| (41) |
where denotes averaging over all possible locations and time points . In the nominator of (41) the time points and are restricted so that their difference falls into a bin . Similarly, for spatial autocorrelations we evaluate
| (42) |
Velocities were obtained as
| (43) |
where the time interval is a parameter. Particle velocities, driven by link remodeling events and subsequent relaxation to mechanical equilibrium, exhibit both sustained temporal and long-range spatial correlations (Fig. 8). The latter extend over distances comparable to the size of the simulated system. Correlations increase for velocities calculated with longer values. Hence, instantaneous velocity fields are dominated by mechanical adaptation to random link remodeling events. However, a longer time lag suppresses the noise and the resulting velocity fields are characteristic for the overall tissue movements that are highly correlated both in time and space. Thus, our stochastic simulation rules yield persistent large-scale (multi-cellular) motion patterns.
The presence of a sustained movement pattern motivates to define velocity fluctuations as
| (44) |
where is the sustained drift velocity of particle . The velocity fluctuations, mainly adjustments due to changes in connectivity, do not show long range temporal correlations (Fig. 8c). The finite correlation time min reflects the link length adjustment rule (23). Velocity fluctuations, however, continue to exhibit long-range spatial correlations (Fig. 8d), due to the strong mechanical coupling within the system.
4 Discussion
4.1 Tissue plasticity
The plastic behavior of cell aggregates was well studied in a series of experiments where aggegates were compressed in an apparatus where both the compression force as well as the shape of the deformed sample could be precisely monitored [13]. Under these circumstances, a short compression elicits an elastic (reversible) deformation. In this elastic regime the deformation is homogenous within the aggregate: individual cells are also compressed along one direction. In contrast, when the compression is maintained for several hours, the force needed to maintain the deformation decreases in time. This decrease is close to exponential, and the behavior is plastic in the sense that after removing the compression force, the aggregate remains in the new equilibrium shape for several hours. Confocal microscopy revealed that cells within the aggregate regained their isotropic shapes – hence they remodeled their intercellular connections. These empirical findings, including the time scale of the plastic relaxation process, are well reproduced by our model (Fig. 5).
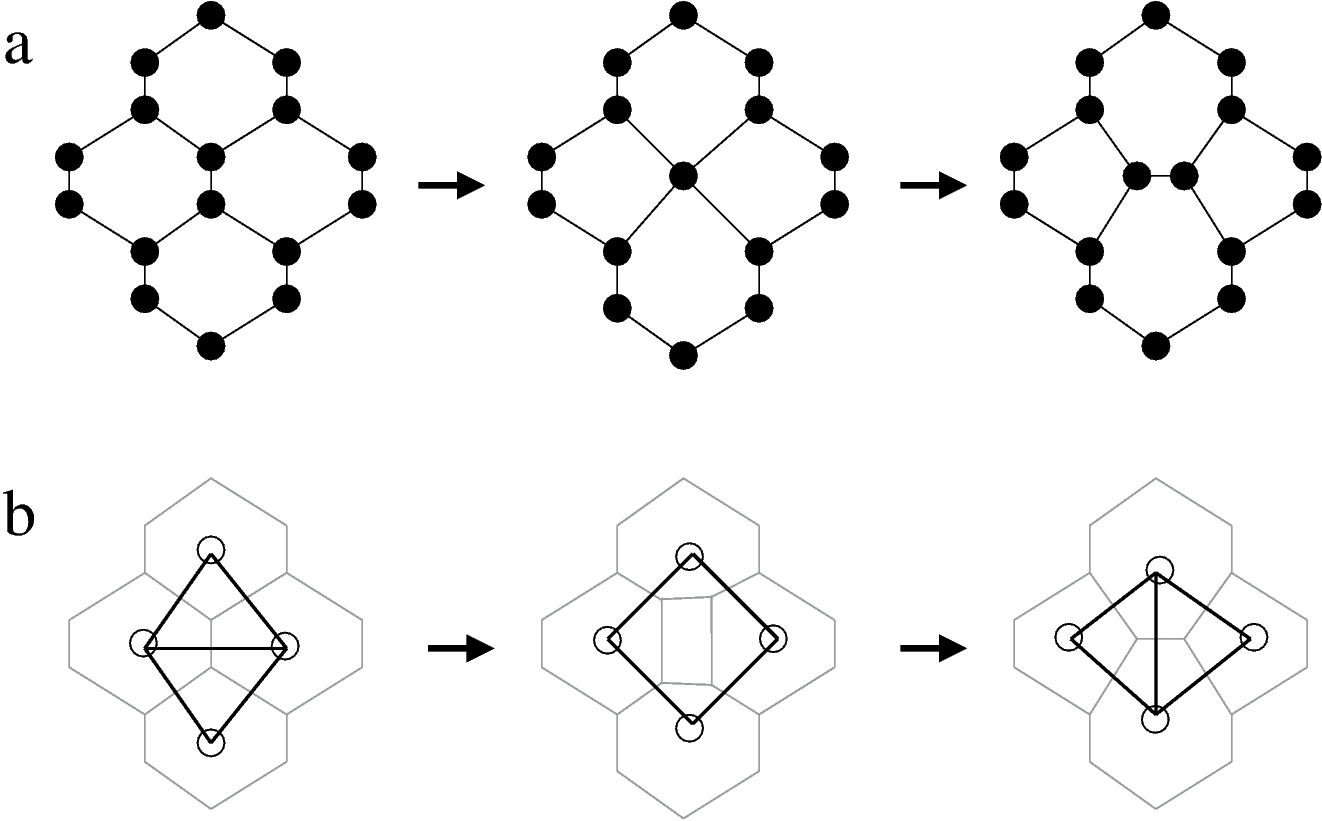
Exponential relaxation of shear stress, characteristic for the Maxwell fluid, has been proposed to model embryonic tissues. Such behavior can arise by a sufficient number of cell divisions or apoptoses within the tissue [3], or by a mechanical load-dependent remodeling of intercellular connections [1, 2]. In our simulations, in accord with the continuum theory by Preziosi et al [1, 2], the stress does not diminish completely. We attribute this effect to an inherent granularity within the model. A stretched link is replaced in a T1 transition (Fig. 9) by the following sequence of events: 1) a stretched link is removed. 2) The distance between the previously interconnected particles is increased in the new mechanical equilibrium. 3) The resulting “gap” (or soft patch) is filled in by a new link connecting cells in the orthogonal direction. This last step occurs only if the local deformation in step 2 alters distances to an extent that the two particles that were interconnected by the removed link do not remain Voronoi neighbors. Thus, in our model a yield stress, below which the tissue response is elastic, arises naturally.
4.2 Intercellular forces
Bell’s rule of force-mediated bond dissociation (20) and the corresponding exponential lifetime of adhesion links [26] is supported by dynamic force microscopy experiments [31]. The reported studies indicated a single molecule rupture force (corresponding to for a single molecule) around 10 pN. As a cell may display adhesion molecules on its membrane [32], two adjacent cells may be linked by adhesion molecules. Thus, the rupture force needed to separate two cells is 100 nN if we assume that separation breaks each adhesion bond between the two cells. When cells are pulled apart slowly, a much lower force is sufficient as adhesion molecules can spontaneously unbind: for example, embryonic zebrafish cells can be separated by 10 nN forces [22]. In our model the separation of a strained intercellular contact is assumed to be instantaneous (not resolved by the dynamics), we estimate , which in our force units translates into , a value used for simulations in Figs. 5-7.
4.3 Tissue movements
The emergence of tissue movements from the collective action of its constituent cells is one of the central questions of developmental biology. Imaging studies established that during later stages of development involving a well-crosslinked matrix the cells and their immediate extracellular matrix surroundings move as a composite material [33, 34], while during earlier stages individual cell motility is superimposed on a larger scale tissue movement [35, 36]. Hence the body plan of early amniote embryos do not appear to be established by “conventional” cell motility – i.e., cells migrating on an external substrate to pre-defined positions following environmental cues. Instead, germ layers and the entire embryo morphology are molded to a large extent by cell-exerted mechanical forces (stresses) and their controlled dissipation/relaxation.
Anisotropic cell behavior has been proposed previously to explain convergent-extension movements [14, 37, 21, 15, 16]. Here we demonstrated that anisotropic cell activity can be formulated within our proposed model, and the simulations yield velocity autocorrelations comparable with those reported for avian embryos [17]. In particular, particle image velocimetry revealed that the displacements of morphogenetic tissue movements are smooth in space and tissue movements are correlated even at locations separated by several hundred micrometers, comparable to the size of the embryo. Velocity vectors, however, strongly fluctuate in time. The autocorrelation time of the velocity fluctuations was reported to be less than a minute. Our model suggest that fluctuations with a short correlation time can be generated by sudden cellular detachment/reattachment events occurring at random positions – the driving mechanism of tissue movements. The long correlation length is consistent with the idea that the tissue is in mechanical equilibrium, therefore a local change in cell traction is expected to immediately alter tissue deformations elsewhere.
In summary, we demonstrated that the proposed model yields a realistic elasto-plastic behavior with exponential relaxation of tensile stresses above an intrinsic threshold value. Due to the simplicity of the model, microscopic parameter values can be inferred from tissue thickness, its macroscopic elastic modulus and Poisson’s number and the magnitude and dynamics of intercellular adhesion forces. The proposed stochastic simulation of cell activities gives rise to fluctuating tissue movements, which exhibit the same autocorrelation properties as the empirically obtained data. This model, therefore, can serve as a mechanically correct basis for cell-resolved or agent-based future studies focusing on tissue morphogenesis.
Acknowledgements
This work was supported by the NIH (grant HL085694 to Dr Brenda Rongish), the Hungarian Development Agency (KTIA AIK 12-1-2012-0041), the Hungarian Research Fund (OTKA K72664) and the G. Harold & Leila Y. Mathers Charitable Foundation. We are most grateful for Drs Sandra Rugonyi, Brenda Rongish and Charles Little for fruitful discussions and comments on the manuscript.
References
References
- [1] L. Preziosi, D. Ambrosi, and C. Verdier. An elasto-visco-plastic model of cell aggregates. J Theor Biol, 262(1):35–47, Jan 2010.
- [2] L Preziosi and Guido Vitale. A multiphase model of tumor and tissue growth including cell adhesion and plastic reorganization. Mathematical Models and Methods in Applied Sciences, 21(09):1901–1932, September 2011.
- [3] Jonas Ranft, Markus Basan, Jens Elgeti, Jean-Francois Joanny, Jacques Prost, and Frank Jülicher. Fluidization of tissues by cell division and apoptosis. Proc Natl Acad Sci U S A, 107(49):20863–20868, Dec 2010.
- [4] C. Giverso and L. Preziosi. Modelling the compression and reorganization of cell aggregates. Math Med Biol, 29(2):181–204, Jun 2012.
- [5] Y. C. Fung. Biomechanics: mechanical properties of living tissues. Springer-Verlag, New York, 1993.
- [6] Magdalena A Stolarska, Yangjin Kim, and Hans G Othmer. Multi-scale models of cell and tissue dynamics. Philos Trans A Math Phys Eng Sci, 367(1902):3525–3553, Sep 2009.
- [7] Larry A Taber. Towards a unified theory for morphomechanics. Philos Transact A Math Phys Eng Sci, 367(1902):3555–3583, Sep 2009.
- [8] Victor D Varner, Dmitry A Voronov, and Larry A Taber. Mechanics of head fold formation: investigating tissue-level forces during early development. Development, 137(22):3801–3811, Nov 2010.
- [9] Graner and Glazier. Simulation of biological cell sorting using a two-dimensional extended potts model. Phys Rev Lett, 69(13):2013–2016, Sep 1992.
- [10] J. A. Izaguirre, R. Chaturvedi, C. Huang, T. Cickovski, J. Coffland, G. Thomas, G. Forgacs, M. Alber, G. Hentschel, S. A. Newman, and J. A. Glazier. Compucell, a multi-model framework for simulation of morphogenesis. Bioinformatics, 20(7):1129–1137, 2004.
- [11] T.J. Newman. Modeling multicellular systems using subcellular elements. Math. Biosci. Eng., 2:611–622, 2005.
- [12] Sebastian A Sandersius, Manli Chuai, Cornelis J Weijer, and Timothy J Newman. Correlating cell behavior with tissue topology in embryonic epithelia. PLoS One, 6(4):e18081, 2011.
- [13] G. Forgacs, R. A. Foty, Y. Shafrir, and M. S. Steinberg. Viscoelastic properties of living embryonic tissues: a quantitative study. Biophys J, 74(5):2227–2234, 1998.
- [14] M Zajac, G L Jones, and J A Glazier. Model of convergent extension in animal morphogenesis. Phys. Rev. Lett., 85:2022–5, 2000.
- [15] Bakhtier Vasiev, Ariel Balter, Mark Chaplain, James A Glazier, and Cornelis J Weijer. Modeling gastrulation in the chick embryo: formation of the primitive streak. PLoS One, 5(5):e10571, 2010.
- [16] S. A. Sandersius, M. Chuai, C. J. Weijer, and T. J. Newman. A ’chemotactic dipole’ mechanism for large-scale vortex motion during primitive streak formation in the chick embryo. Phys Biol, 8(4):045008, Aug 2011.
- [17] A. Szabó, P. A. Rupp, B. J. Rongish, C. D. Little, and A. Czirók. Extracellular matrix fluctuations during early embryogenesis. Phys Biol, 8(4):045006, Aug 2011.
- [18] H. Honda and G. Eguchi. How much does the cell boundary contract in a monolayered cell sheet? J Theor Biol, 84(3):575–588, Jun 1980.
- [19] Alexander G Fletcher, Miriam Osterfield, Ruth E Baker, and Stanislav Y Shvartsman. Vertex models of epithelial morphogenesis. Biophys J, 106(11):2291–2304, Jun 2014.
- [20] Reza Farhadifar, Jens-Christian Röper, Benoit Aigouy, Suzanne Eaton, and Frank Jülicher. The influence of cell mechanics, cell-cell interactions, and proliferation on epithelial packing. Curr Biol, 17(24):2095–2104, Dec 2007.
- [21] Matteo Rauzi, Pascale Verant, Thomas Lecuit, and Pierre-François Lenne. Nature and anisotropy of cortical forces orienting drosophila tissue morphogenesis. Nat Cell Biol, 10(12):1401–1410, Dec 2008.
- [22] Jean-Léon Maitre, Hélène Berthoumieux, Simon Frederik Gabriel Krens, Guillaume Salbreux, Frank Jülicher, Ewa Paluch, and Carl-Philipp Heisenberg. Adhesion functions in cell sorting by mechanically coupling the cortices of adhering cells. Science, 338(6104):253–256, Oct 2012.
- [23] Hisao Honda, Masaharu Tanemura, and Tatsuzo Nagai. A three-dimensional vertex dynamics cell model of space-filling polyhedra simulating cell behavior in a cell aggregate. J Theor Biol, 226(4):439–453, Feb 2004.
- [24] D. Drasdo and G. Forgacs. Modeling the interplay of generic and genetic mechanisms in cleavage, blastulation, and gastrulation. Dev Dyn, 219(2):182–191, Oct 2000.
- [25] Ignacio Ramis-Conde, Dirk Drasdo, Alexander R A Anderson, and Mark A J Chaplain. Modeling the influence of the e-cadherin-beta-catenin pathway in cancer cell invasion: a multiscale approach. Biophys J, 95(1):155–165, Jul 2008.
- [26] G. I. Bell. Models for the specific adhesion of cells to cells. Science, 200(4342):618–627, May 1978.
- [27] Daniel T. Gillespie. Exact stochastic simulation of coupled chemical reactions. The Journal of Physical Chemistry, 81(25):2340–2361, 1977.
- [28] Ubirajara Agero, James A Glazier, and Michael Hosek. Bulk elastic properties of chicken embryos during somitogenesis. Biomed Eng Online, 9:19, 2010.
- [29] R. Bellairs and M. Osmond. The atlas of chick development. Academic Press, San Diego, CA, 1998.
- [30] Octavian Voiculescu, Federica Bertocchini, Lewis Wolpert, Ray E Keller, and Claudio D Stern. The amniote primitive streak is defined by epithelial cell intercalation before gastrulation. Nature, 449(7165):1049–1052, Oct 2007.
- [31] Xiaohui Zhang, Susan E Craig, Hishani Kirby, Martin J Humphries, and Vincent T Moy. Molecular basis for the dynamic strength of the integrin alpha4beta1/vcam-1 interaction. Biophys J, 87(5):3470–3478, Nov 2004.
- [32] Ramsey A Foty and Malcolm S Steinberg. Cadherin-mediated cell-cell adhesion and tissue segregation in relation to malignancy. Int J Dev Biol, 48(5-6):397–409, 2004.
- [33] Bertrand Benazeraf, Paul Francois, Ruth E Baker, Nicolas Denans, Charles D Little, and Olivier Pourquie. A random cell motility gradient downstream of fgf controls elongation of an amniote embryo. Nature, 466(7303):248–252, Jul 2010.
- [34] Anastasiia Aleksandrova, Andras Czirok, Andras Szabo, Michael B Filla, M. Julius Hossain, Paul F Whelan, Rusty Lansford, and Brenda J Rongish. Convective tissue movements play a major role in avian endocardial morphogenesis. Dev Biol, 363(2):348–361, Mar 2012.
- [35] Evan A Zamir, Andras Czirok, Cheng Cui, Charles D Little, and Brenda J Rongish. Mesodermal cell displacements during avian gastrulation are due to both individual cell-autonomous and convective tissue movements. Proc Natl Acad Sci U S A, 103(52):19806–19811, Dec 2006.
- [36] Evan A Zamir, Brenda J Rongish, and Charles D Little. The ecm moves during primitive streak formation–computation of ecm versus cellular motion. PLoS Biol, 6(10):e247, Oct 2008.
- [37] Mark Zajac, Gerald L Jones, and James A Glazier. Simulating convergent extension by way of anisotropic differential adhesion. J Theor Biol, 222(2):247–259, 2003.