Evidence of Titan’s Climate History from Evaporite Distribution
Abstract
Water-ice-poor, 5-m-bright material on Saturn’s moon Titan has previously been geomorphologically identified as evaporitic. Here we present a global distribution of the occurrences of the 5-m-bright spectral unit, identified with Cassini’s Visual Infrared Mapping Spectrometer (VIMS) and examined with RADAR when possible. We explore the possibility that each of these occurrences are evaporite deposits. The 5-m-bright material covers 1% of Titan’s surface and is not limited to the poles (the only regions with extensive, long-lived surface liquid). We find the greatest areal concentration to be in the equatorial basins Tui Regio and Hotei Regio. Our interpretations, based on the correlation between 5-m-bright material and lakebeds, imply that there was enough liquid present at some time to create the observed 5-m-bright material. We address the climate implications surrounding a lack of evaporitic material at the south polar basins: if the south pole basins were filled at some point in the past, then where is the evaporite?
keywords:
Titan , Titan surface , Spectroscopy , Infrared observations , Geological processes1 Introduction
Titan, unique among other satellites in our solar system, has a thick atmosphere in which a volatile (methane, though ethane is thought to also play an important role) precipitates and evaporates in the same fashion as water in Earth’s hydrological cycle (Roe, 2012). Our understanding of Titan’s surface and climate has evolved from the once widely expected global surface ocean thought to sustain the photolytic processes in the atmosphere (e.g., Lunine et al., 1983; Flasar, 1983) to a world only sparsely covered by liquid deposits but hosting a collection of strikingly Earth-like surface morphologies (e.g., dunes and channels) thanks to data now available from Cassini-Huygens. These observations reveal Titan to be generally wet at the poles and dry at the equator.
At the poles, Titan’s liquid bodies range from seas (surface area greater than 100,000 km2, only in the north) to smaller lakes (Stofan et al., 2007; Hayes et al., 2008; Sotin et al., 2012), to fluvial features thought to be drainage networks (e.g., Lorenz et al., 2008a; Lunine et al., 2008; Burr et al., 2009; Langhans et al., 2012; Burr et al., 2013). The equatorial region, however, is characterized by expansive dune fields (e.g. Elachi et al., 2006; Soderblom et al., 2007; Lunine et al., 2008; Radebaugh et al., 2008; Rodriguez et al., 2014), intermittent mountain chains (e.g., Radebaugh et al., 2007; Cook et al., submitted), and a noticeable lack of permanent surface liquid (but see Griffith et al. (2012)). Rain has been observed to wet the midlatitude and near-equatorial surface (Turtle et al., 2011a), but standing bodies similar in extent and stability to the polar lakes have yet to be conclusively identified. The most equator-ward lake candidates, Sionscaig and Urmia, are located between 39∘S and 42∘S and, while hypothesized to have standing liquid, are yet to be confirmed as either long-lived or ephemeral (Vixie et al., submitted). Mitchell (2008) were able to reproduce a dry equatorial climate with a global circulation model (GCM) where a limited reservoir of methane exchanges between the atmosphere and surface.
And yet, sizable volumes of liquid are still thought to have played an important role in forming the equatorial region. As Huygens discovered during its descent to the Titanian surface on January 14, 2005, fluvial features such as rounded cobbles, channels, and valleys also dot the equatorial landscape (Tomasko et al., 2005). The subsurface structure controlling fluvial drainage networks in southwestern Xanadu(Burr et al., 2009) agrees with the wind flow derived from aeolian driven dune morphology (Lorenz and Radebaugh, 2009). Rainfall has been proposed as the source the liquid responsible for carving fluvial features (Lorenz and Lunine, 2005; Turtle et al., 2011b). While storms have been observed in the equatorial region (Turtle et al., 2011a), Cassini has yet to directly observe actively flowing channels. The average global rainfall on Titan has been suggested to be 1 cm/yr (Lorenz and Lunine, 1996; Rannou et al., 2006), but such a low rate could be reconciled with the observed fluvial features if precipitation were to occur in intense but infrequent storms (“methane monsoons” akin to what terrestrial deserts experience though an order of magnitude smaller (Jaumann et al., 2008; Schneider et al., 2012)).
Clouds have been frequently observed in the active atmosphere of Titan, ranging from the enormous winter polar vortex, to bands of tropospheric clouds around certain latitudes (e.g. Griffith, 2009; Hirtzig et al., 2009; Rodriguez et al., 2009; Brown et al., 2010; Rodriguez et al., 2011; Le Mouélic et al., 2012), to the low lying fog (Brown et al., 2009). Stratospheric and high tropospheric clouds have been deduced to be composed of methane and ethane, but fog is necessarily made of methane alone (Brown et al., 2009). Precipitation has been indirectly observed after cloud coverage via the surface darkening, brightening, and subsequent return to the original spectrum by Cassini’s Visual Infrared Mapping Spectrometer (VIMS) (Barnes et al., 2013) and Imaging Science Subsystem (ISS) (Turtle et al., 2009, 2011a; Barnes et al., 2013).
The present distribution of Titan’s lakes is asymmetric: there are more in number and extent at the north pole than at the south (Aharonson et al., 2009). In the north, for example, the largest body is Kraken Mare, a sea covering 400,000 km2 (Turtle et al., 2009), while in the south, the largest is Ontario Lacus which covers only 15,000 km2 (Hayes et al., 2010). Global Circulation Models (GCMs) have found that some kind of seasonal exchange or link between the north and south poles may be taking place (e.g., Tokano, 2005; Mitri et al., 2007; Rannou et al., 2006; Mitchell et al., 2009; Tokano, 2009). While changes in the size of the northern lakes and seas were not observed before equinox (Hayes et al., 2011; Sotin et al., 2012), Cassini has begun to witness signs of seasonal transport as Titan approaches northern summer. The Composite Infrared Spectrometer (CIRS) has recorded evidence that subsidence has just started above the south pole (Teanby et al., 2012) while the cloud distribution observed by VIMS is indicative of a pole-to-pole meteorological turnover (Rodriguez et al., 2011; Le Mouélic et al., 2012).
On a longer than seasonal timescale, it has been proposed that the observed dichotomy actually reverses every 50,000 years with a Titanian Milankovich cycle (Aharonson et al., 2009). This cycle would be driven by changes in solar insolation as to which hemisphere receives a more intense summer. A GCM by Schneider et al. (2012) shows that an asymmetry in solar insolation can explain the difference in liquid distribution between the north and the south poles. That work, however, assumes a static amount of methane in the surface-atmosphere system, which may not be the case on Titan, as indicated by other models (Nixon et al., 2012) and empirical estimates for the age of the atmosphere (Niemann et al., 2005; Mandt et al., 2012).
Dry and partially filled lakes have been identified with the Cassini RADAR mapper (RADAR) (Hayes et al., 2008; Barnes et al., 2011) both in isolation and near filled lakes. Hayes et al. (2011) also observed ephemeral lakes in the south polar region. These dry beds imply that the distribution of Titan’s liquid is not static. Moore and Howard (2010) propose that the landscape elements with crenulated margins and small lacustrine features similar to those identified by Hayes et al. (2008, 2011) observed in RADAR images of Tui and Hotei Regiones indicate that the previous presence of liquid, i.e. that the two equatorial features may be fossil seas. Thus, because the small lacustrine features observed within Tui and Hotei would require long-lived surface liquid for their creation, there seems to be evidence for a previous global liquid distribution that differs from what is presently observed.
The 5-m-bright VIMS spectral unit has been observed on Titan since the first Cassini flybys where Tui Regio is clearly differentiated from other surface features (Barnes et al., 2005). However, from observations of a region of small lakes and dry lake beds by VIMS during T69 (2010 June 5), Barnes et al. (2011) established the connection between lakebeds and 5-m-bright material: this unique spectral unit coincided with the shores of filled lakes and the bottoms of dry lakes identified by RADAR (Hayes et al., 2008). Within this small region, there are also examples of dry and filled lakes that do not exhibit a 5-m-bright signature. Barnes et al. (2011) demonstrated how evaporite formation would be consistent with these observations of the water-ice poor, uniquely 5-m-bright material: the compounds making up the deposits would have re-crystalized upon solute evaporation (accounting for the uniquely bright, water-ice poor spectrum) and the formation process would only occur in saturated solutions (explaining the spectral differences between such geographically close lakes and lakebeds). While we prefer this evaporitic interpretation for 5-m-bright material formation, other, lacustrine-related explanations could be possible, such as sedimentary deposits forming at the bottom of lakebeds. Thus, we discuss the 5-m-bright material as “evaporite candidates” to reinforce the connection between lakebeds and 5-m-bright material for ease of comprehension.
In this paper, we identify all other examples of the 5-m-bright spectral unit in the VIMS data. While brightness at 5 m alone is not diagnostic enough to say definitively that an observed signature is from specifically evaporitically formed material, the strength of the geomorphological correlation between lakebeds and this spectral unit (first demonstrated by Barnes et al. (2011) and bolstered in this work with available RADAR images) gives us enough ground to explore the implications for the global liquid distribution on Titan if each localized 5-m-bright signature were indeed indicative of some previous presence of surface liquid. Isolating the specific chemical compounds of evaporite is beyond the scope of this paper. In Section 2, we describe the 5-m-bright spectral unit, define our candidate selection criteria, and detail the mapping process. Our results are given in Section 3 and their implications on the past climate on Titan are discussed in Section 4. We conclude with a summary of our interpretations, scenarios inspired by the evaporite candidate distribution for GCMs to consider, and propositions for future study.
2 Methods
2.1 Selection Criteria
In a hydrological cycle111Here we refer to any cycle similar to that of water on Earth as “hydrological” to avoid clumsy and somewhat inaccurate terminology; “methanological” would seem to belie the role of liquid ethane, for example., surface liquid evaporates into the atmosphere where it eventually condenses and rains down onto the surface. There the liquid can dissolve surface material if the solvent is in contact with the solute long enough. For liquid reservoirs that are saturated, the evaporation of the liquid will cause the solute to precipitate out and deposit as evaporite either onto the surface exposed after the liquid has left or at the bottom of the bed of saturated liquid.
On Titan, the surface liquid is a predominately methane-ethane mixture (Brown et al., 2008). It is expected that while the formation processes of evaporite on Titan are similar to those on Earth, the composition will be different because, unlike water, methane and ethane are non-polar. Most of the suggested candidates for compounds that would be soluble in such a mixture are organic (Cordier et al., 2009; Barnes et al., 2011; Cordier et al., 2013). It could be that the organic compound has a finite vapor pressure such that it could itself evaporate and condense nearby. However, we build upon the geomorphological evidence of Barnes et al. (2011) and use this 5-m-bright spectral unit to identify possible evaporitic deposits.
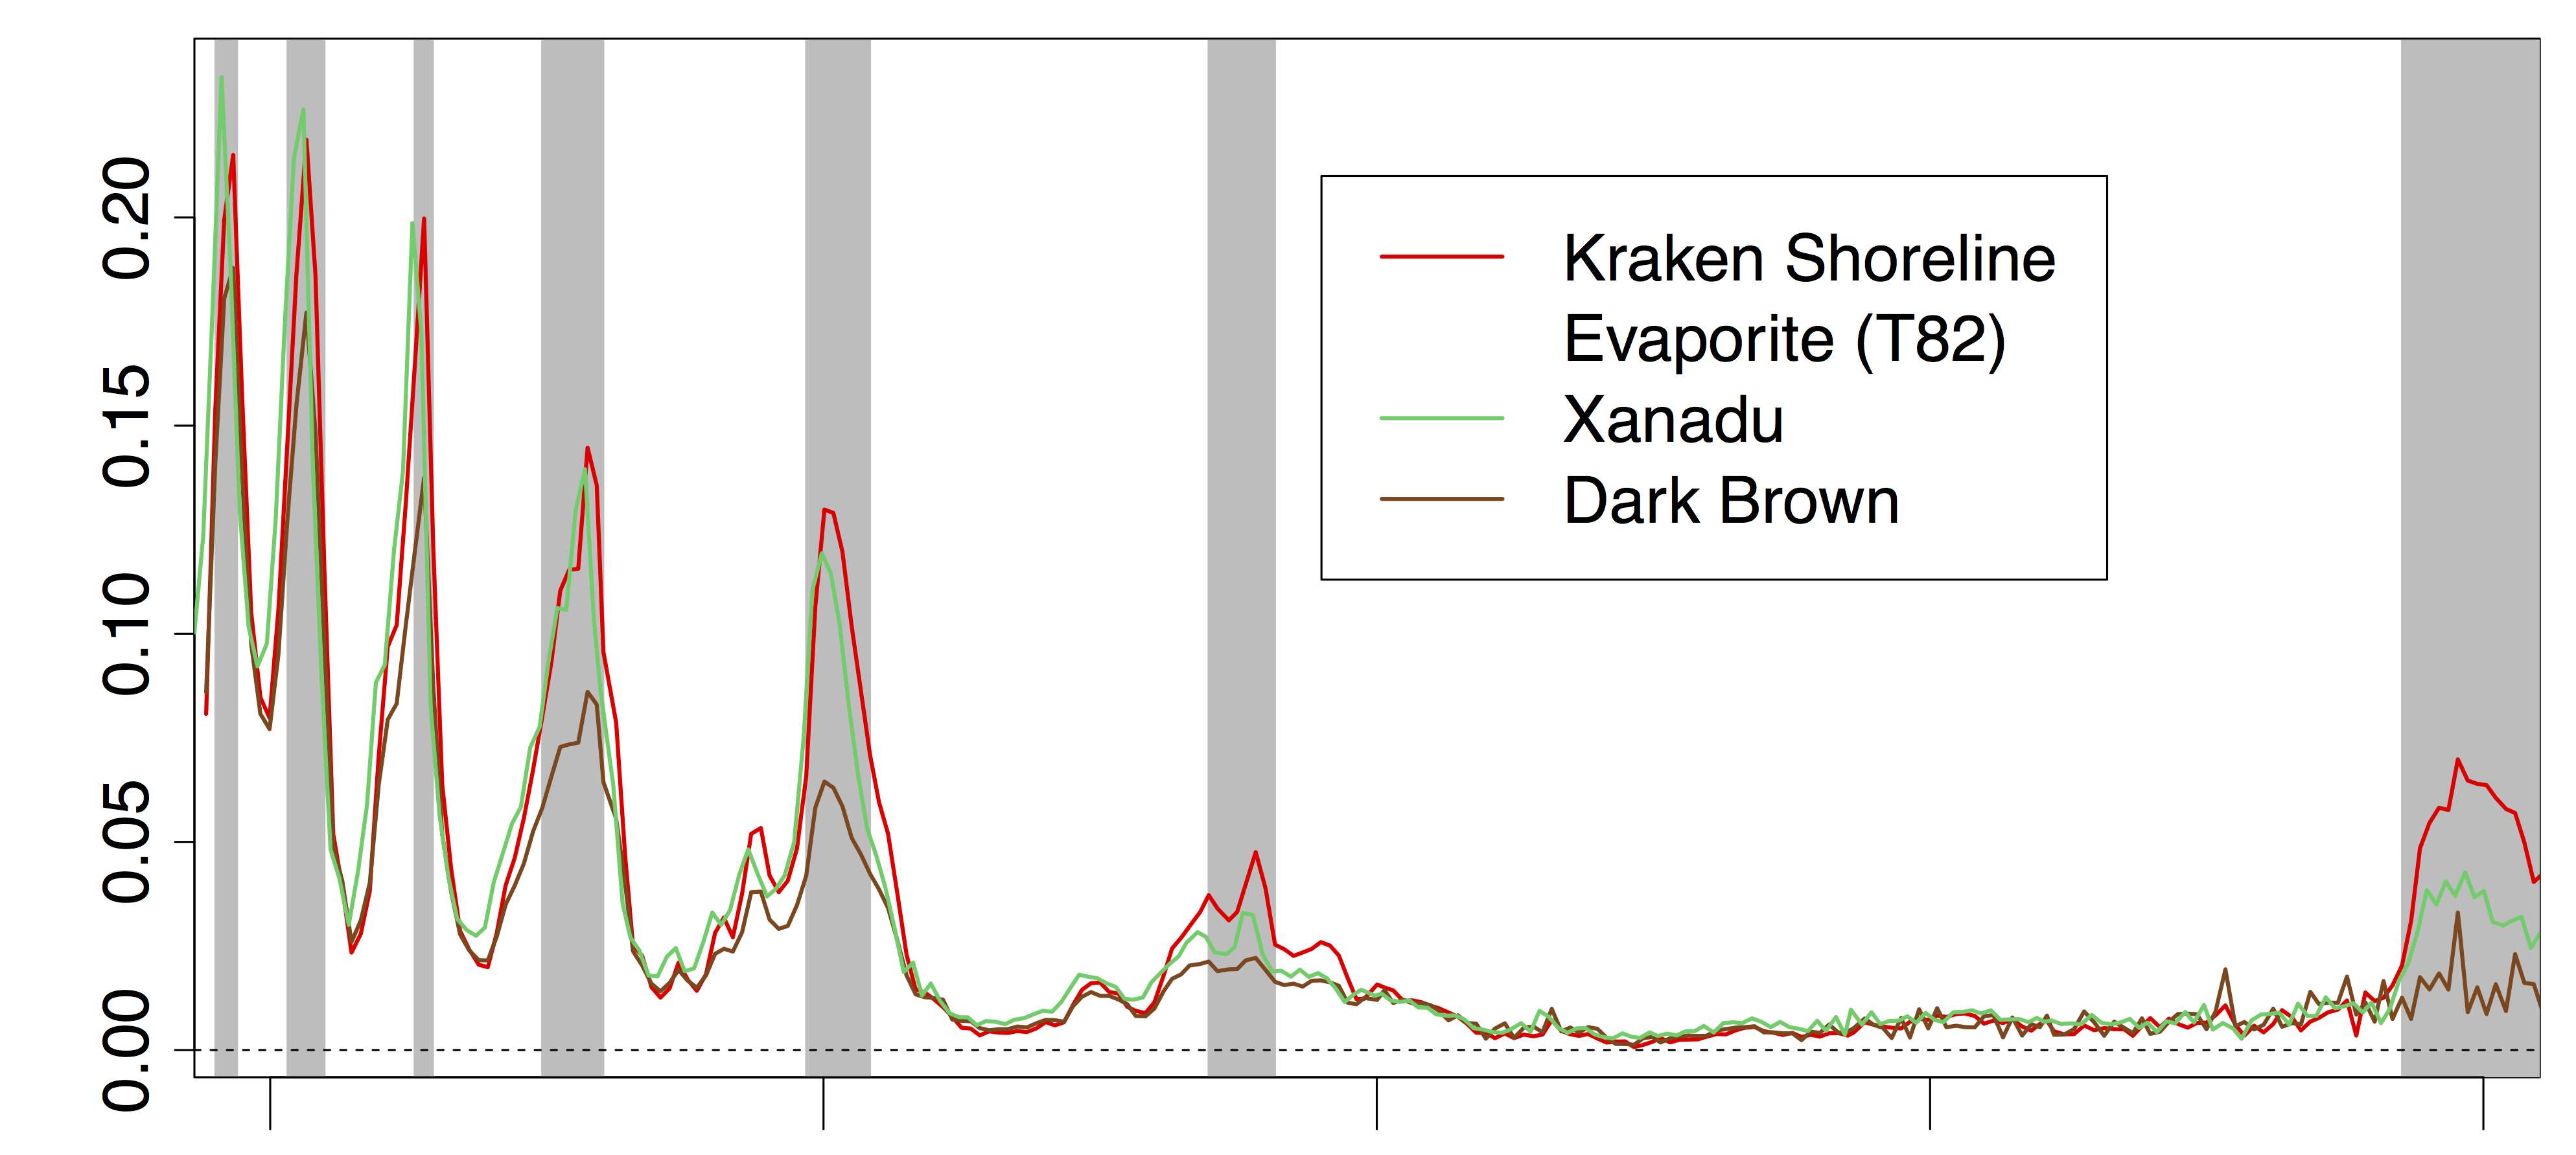
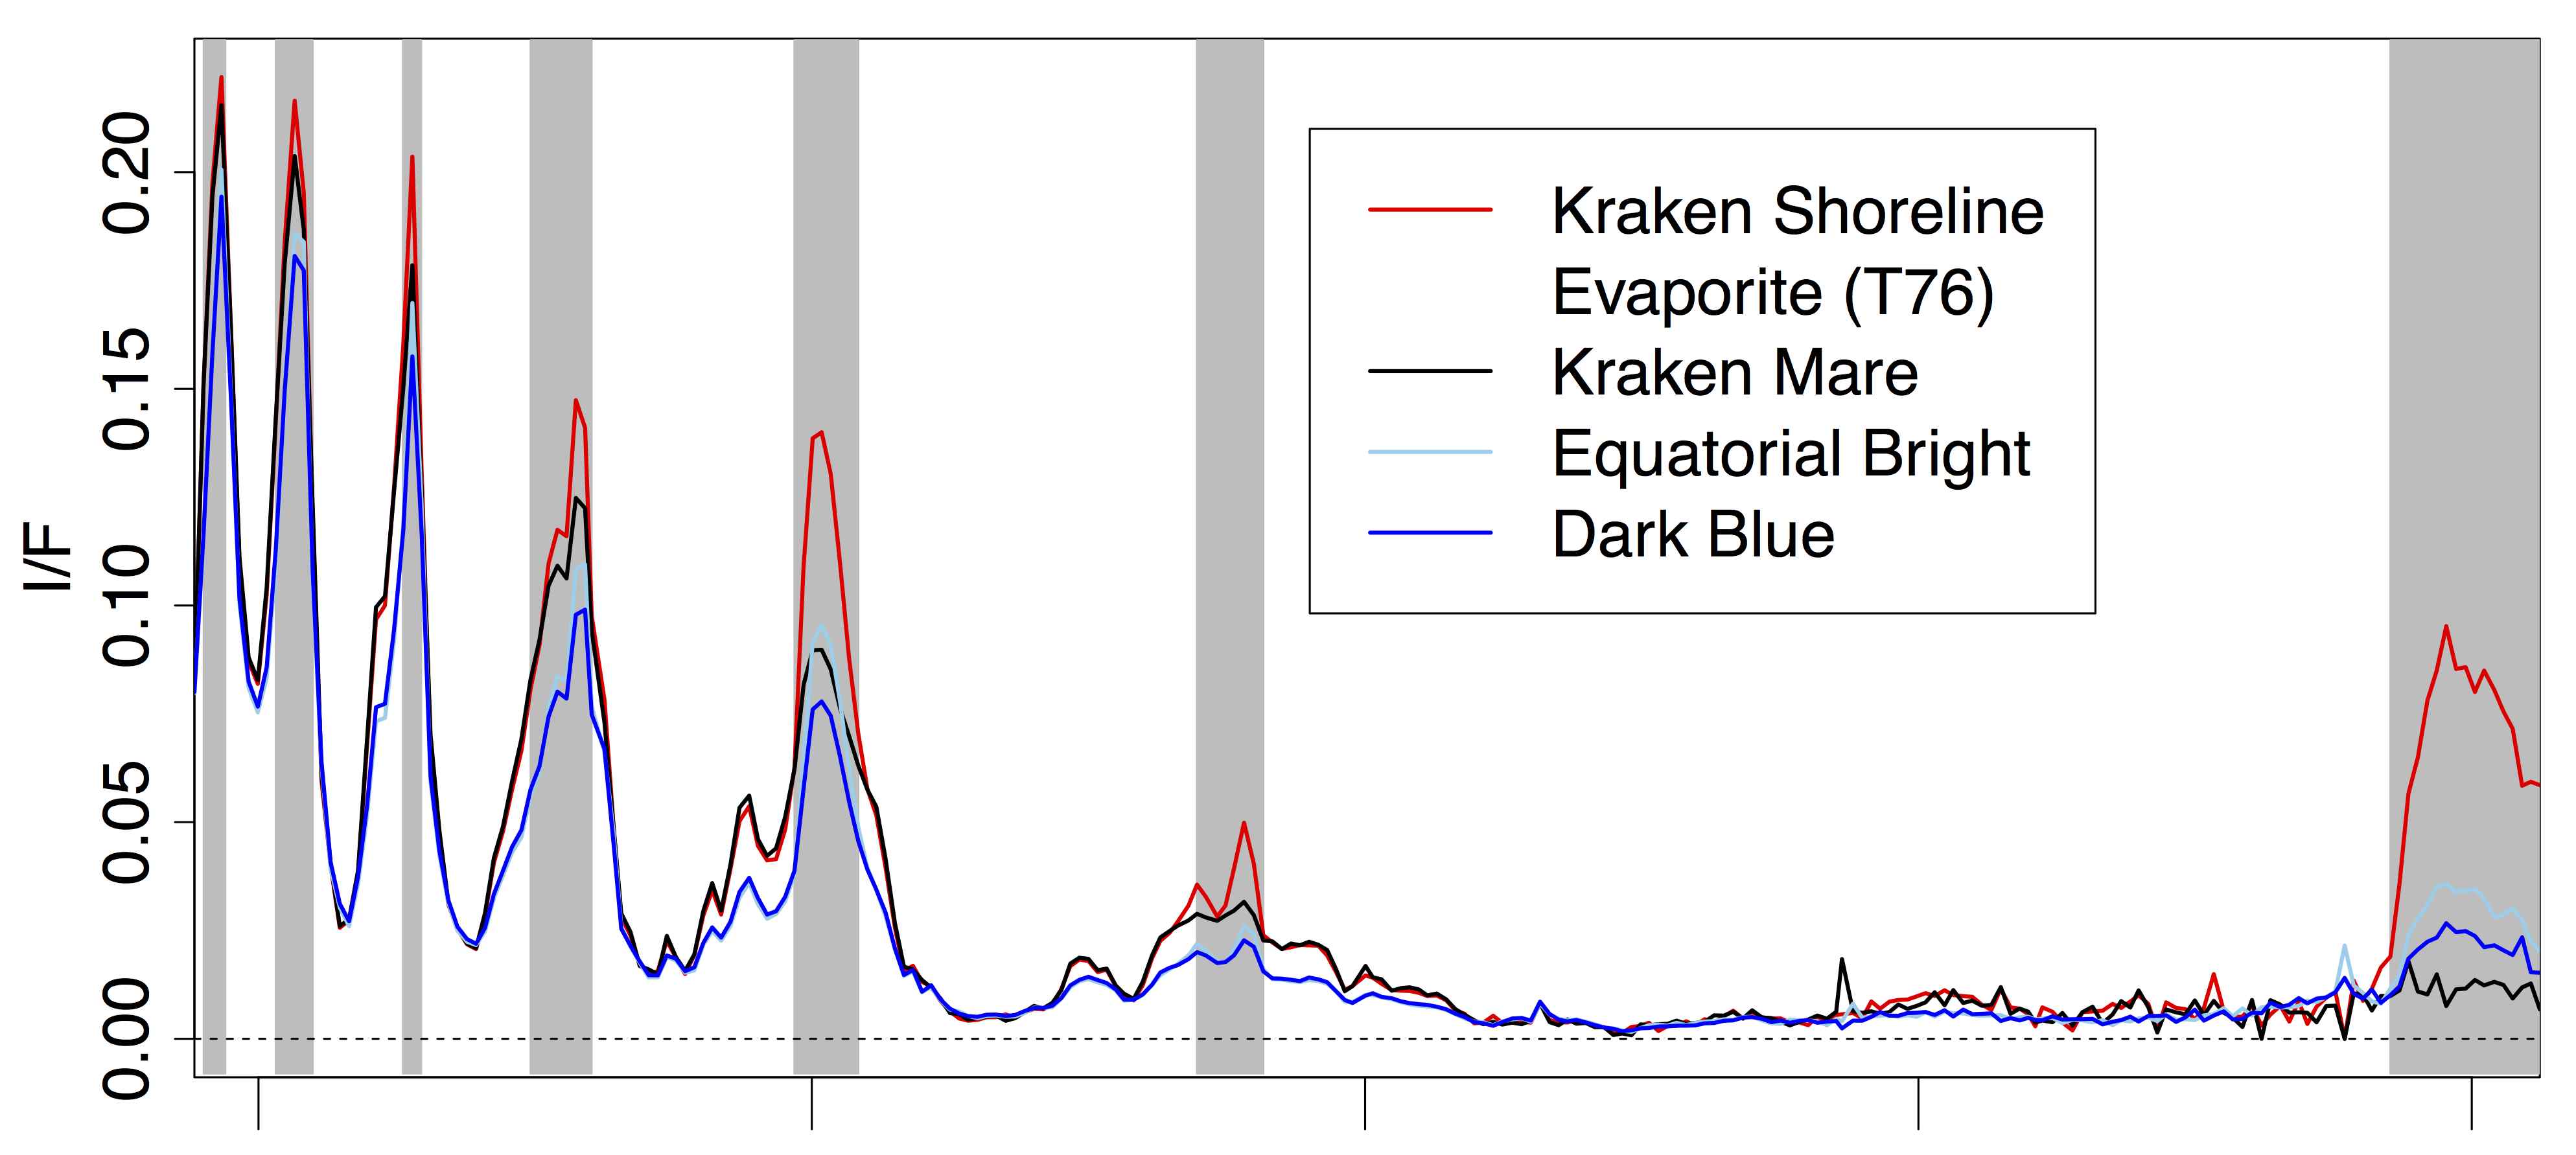
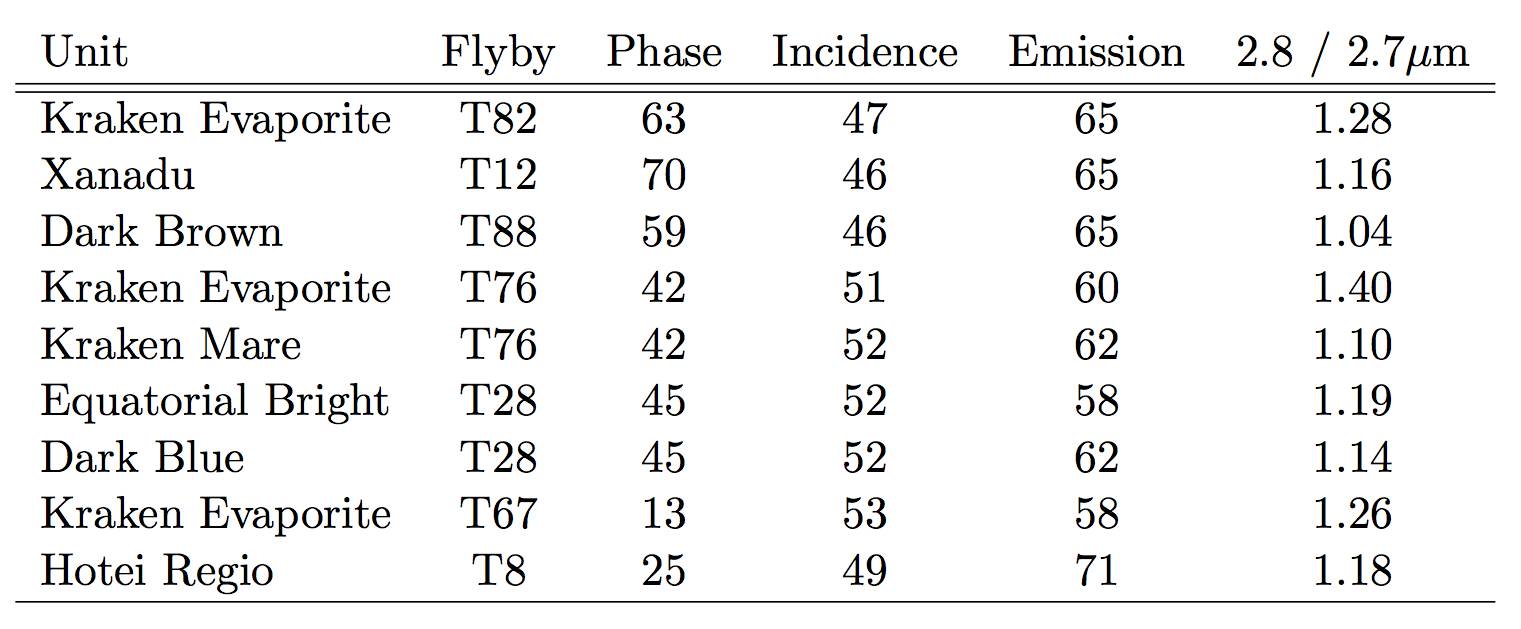
In Figure LABEL:spectra, we show examples of the 5-m-bright spectral unit (red line, all panels) in the context of other surface spectral units: the dark brown dunes (brown line, panel a), the bright terrain of Xanadu (green, panel a), the liquid of Kraken Mare (blue, panel b), the non-Xanadu equatorial bright material (light blue, panel b), the dark blue material (dark blue, panel b). We also show the spectral correlation between shoreline evaporite and Hotei Regio (black) in panel c. To compare individual spectra, it is necessary to take into account viewing geometry which necessarily has an effect on the observed signal intensity (as discussed in Solomonidou et al. (submitted)). Spectra of the same region taken near the limb will look different from one at nadir as the former’s signal must travel through more atmosphere, for example. Thus, in Figure LABEL:spectra, we group the data based on viewing angles, which are summarized in panel d, along with the ratio of I/F at 2.8 and 2.7 m (affected by the presence of pure water ice (Rodriguez et al., 2006)). For the behavior of the 5-m-bright material in the 5 m window, we refer the reader to Section 7.2 and Figure 27 of McCord et al. (2008), where outlying pixels are compared to the scene average of Tui Regio.
 |
 |
 |
 |
The 5-m-bright unit is named after its most dramatic characteristic: material of this composition is brighter than all other spectral units at 5 m. However, the titular specular feature is not the unit’s only distinction. 5-m-bright material has a high ratio of I/F at 2.8/2.7. Generally, in the wavelength windows greater than 2 m, the 5-m-bright unit is brighter than any other surface unit. The I/F of the 5-m-bright unit is on the order of other spectral units (and even darker than Xanadu) in the shortest wavelength windows. Instead of working in the spectral domain, we consider the data spatially by assigning to the VIMS data a color scheme that exploits the spectral characteristics of the 5-m-bright unit. With R = 5 m, G = 2 m, and B = 1.3 m, the evaporite-correlated unit appears as a very bright, reddish-orange color. This method facilitates quick identification of 5-m-bright material in VIMS maps, enabling our search to encompass the breadth of available data.
Titan’s clouds also appear bright at 5 m but can be generally distinguished from evaporite. Clouds exhibit a distinctive spectral signature in the wings of the 2 m peak due to their altitude (Griffith et al., 1998, 2006, 2005; Rodriguez et al., 2011), allowing for identification of tropospheric and stratospheric clouds (that is, at least 40 km above Titan’s surface). Additionally, clouds demonstrate a simultaneous increase in all windows, particularly evident at the 2.75 m and 5 m windows (Rodriguez et al., 2009) and are ephemeral.
Low lying vapor, what we broadly refer to as fog, does not demonstrate the 2 m wing signature but otherwise has the spectral signature of a cloud. Hence, to identify fog and check the longevity of an evaporite candidate, we compare between VIMS coverage of the same area at different flybys. For each case we ask: Is the 5-m-bright material present? Does it change shape and extent? Admittedly, such criteria are less robust than the spectral characteristic of higher altitude clouds. After all, it could be that an evaporitic deposit is no longer seen (or no longer has the same shape) at a different time because the surface has been wetted; the evaporite is either submerged or even dissolved again into the covering liquid. The persistence of an evaporitic deposit is more telling than any “sudden” disappearance. Low altitude clouds would not statically endure for long timescales, thus the persisting signature would seem to be evaporite. Indeed, if no disappearances were observed over a long enough time scale, for example, one could surmise something about the lack of sufficient rainfall to re-dissolve the evaporite into solution. Realistically, however, such a measurement would require coverage more extensive and more frequent than currently available. We therefore require that a 5-m-bright feature be seen at the same location and of the same shape in at least two flybys in order to be considered an evaporite candidate. The grey polygons of Figure 2 represent surface features that could not be identified as candidates due to lack or repeat data of sufficient quality.
2.2 Mapping
To identify evaporite candidates, we searched through images taken by VIMS from T0-T94 (July 3, 2004 - January 1, 2014). The spectroscopic data were reduced using the VIMS pipeline detailed in Barnes et al. (2007a) and geometrically projected with software developed for Barnes et al. (2008). Color images were then created by assigning individual wavelengths the RGB= 5, 2, 1.3 m color scheme to capitalize on the unique spectral characteristics of the 5-m-bright unit as discussed above. (This color scheme was also used by Barnes et al. (2007a) and Barnes et al. (2011)). For topographical and geological context, we use data from the RADAR instrument taken in either Synthetic Aperture RADAR (SAR) or high altitude Synthetic Aperture RADAR (HiSAR) modes that spatially coincides with 5-m-bright material observed by VIMS.
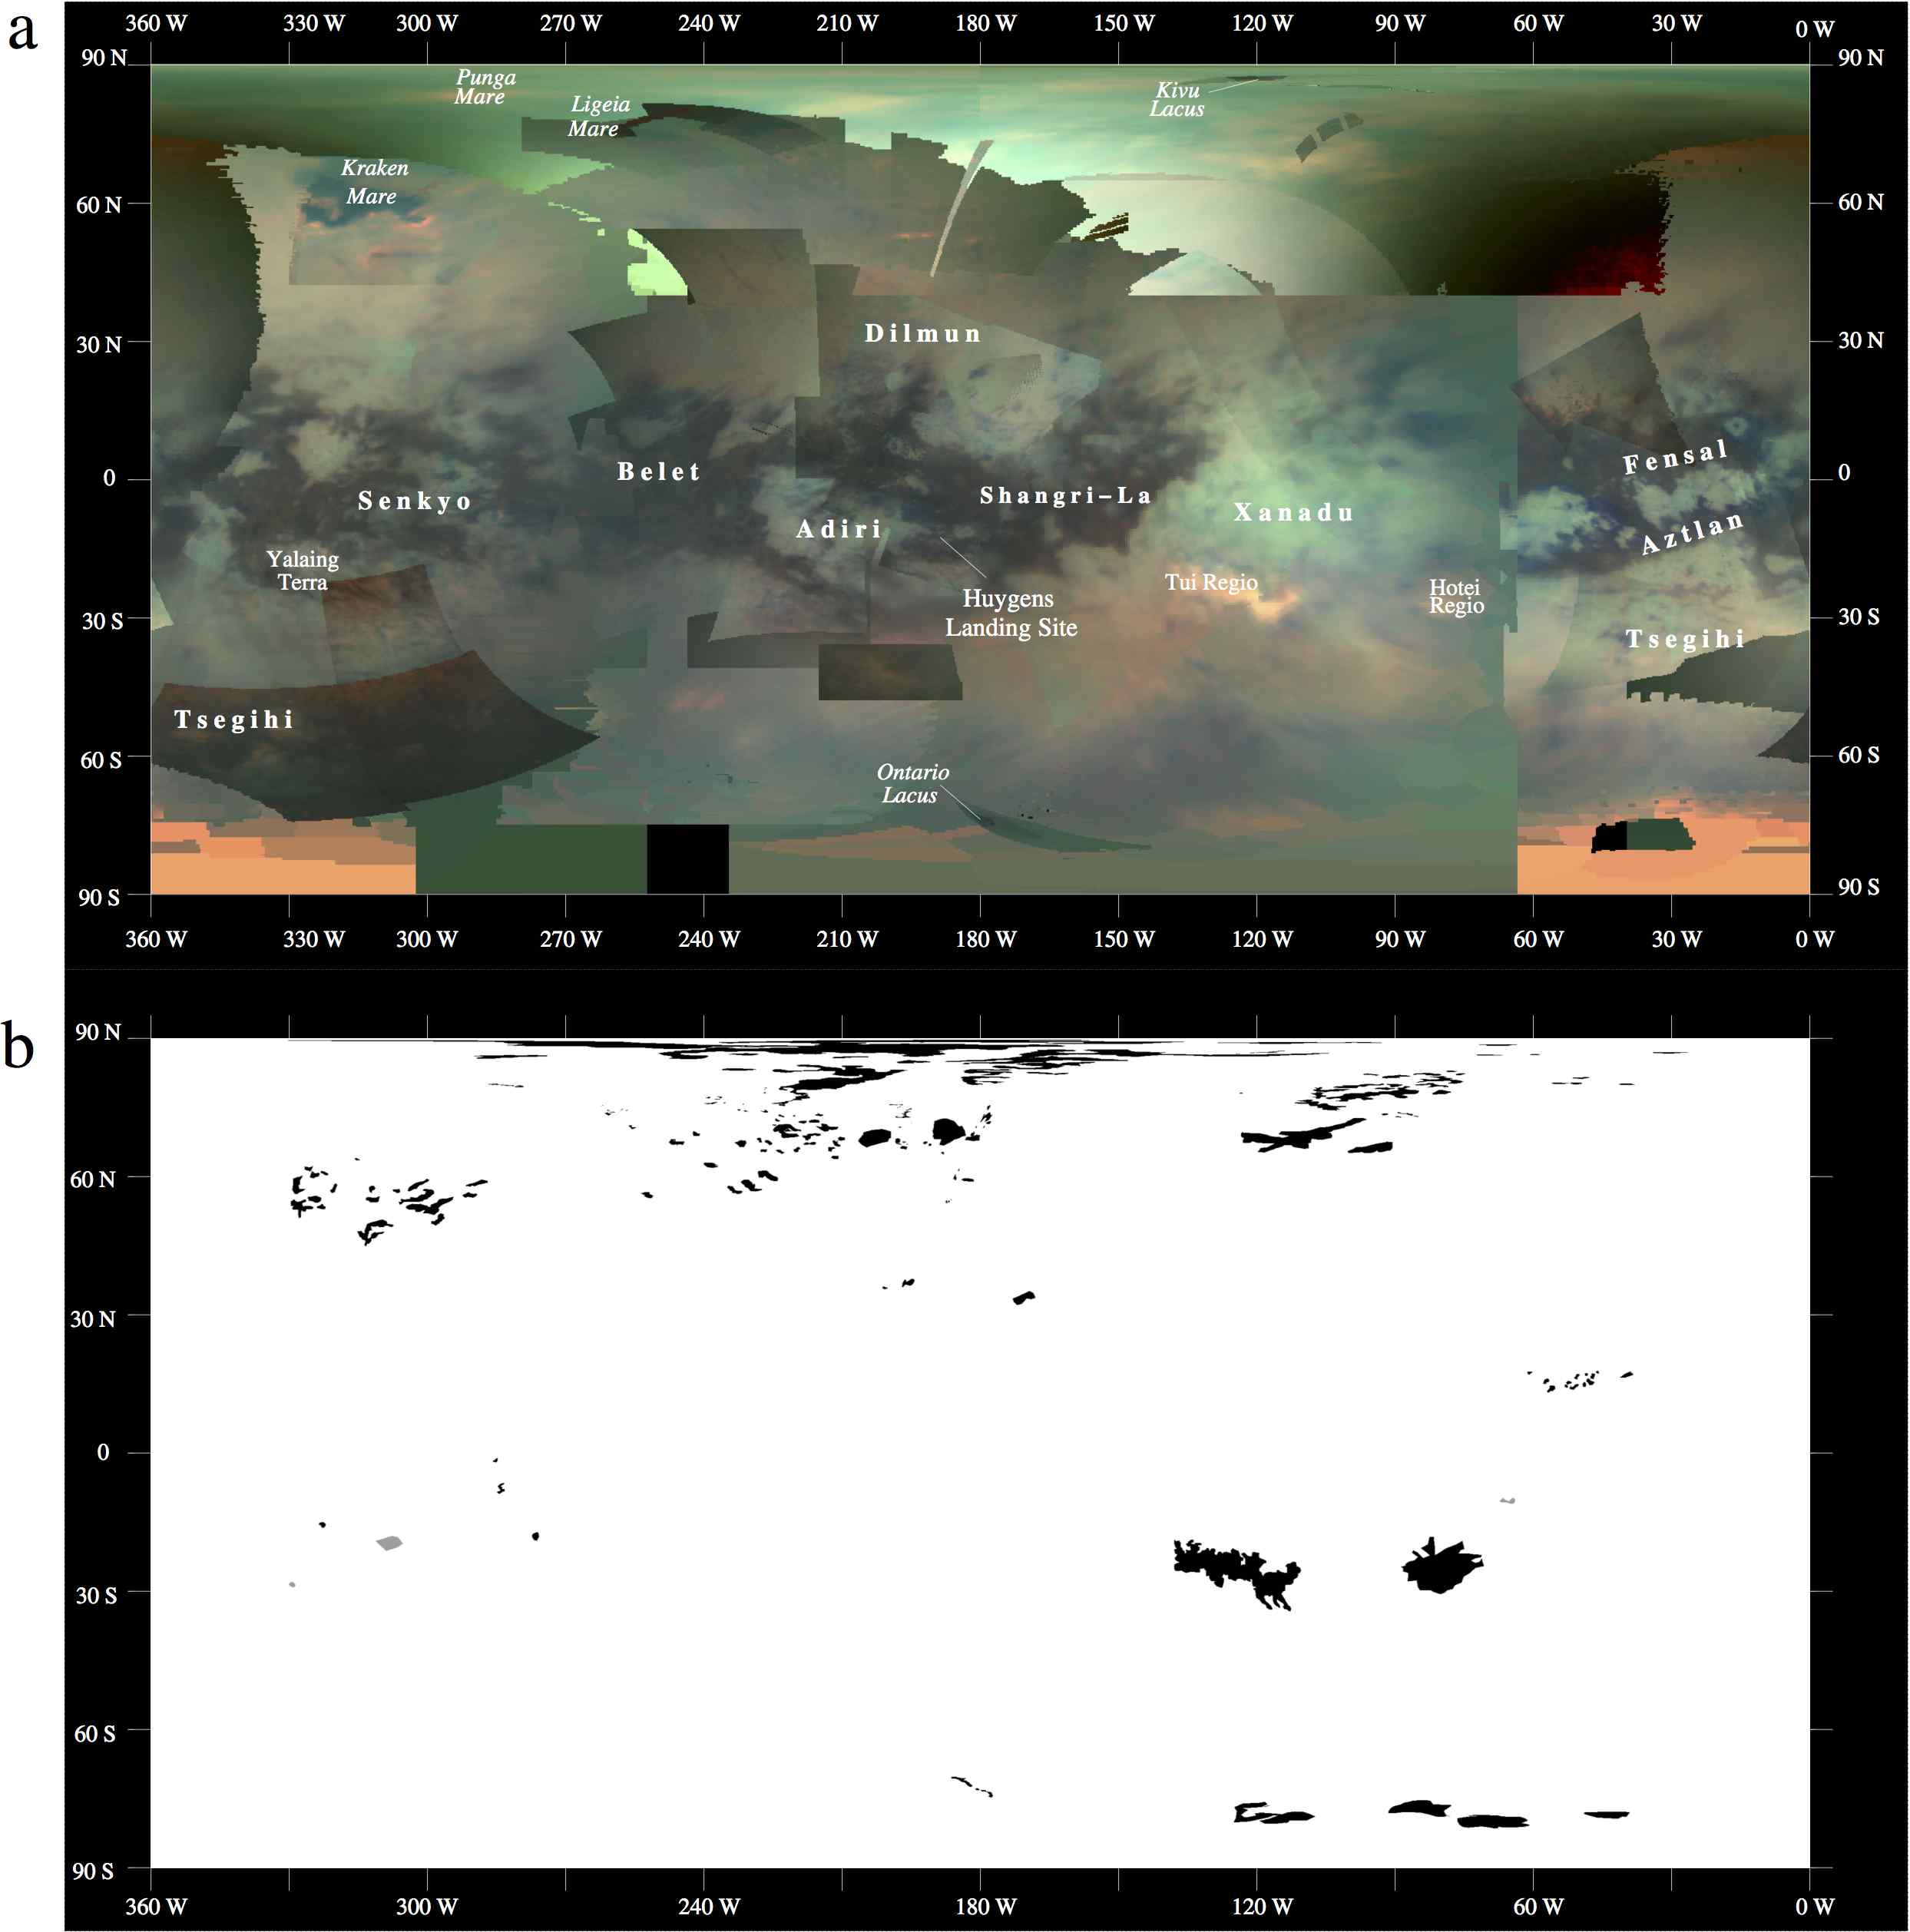
In Table 1, we list the locations of each evaporite deposit that is mapped in this work, as well as the calculated surface area. Polygons representing the outline of each evaporite candidate are plotted as a global distribution in the bottom half of Figure 2. We also include a cylindrical map of Titan as seen by VIMS in Figure 2 to provide global context for each candidate’s location. From the surface areas, we estimate the volumes of liquid bodies, as well as the hypothetically filled liquid bodies corresponding to evaporite deposits. The depths are estimated from the assumption that depth is proportional to surface area using the measured values for Ligeia Mare (Mastrogiuseppe et al., 2014).
| Central | Central | Total Evaporite | Best VIMS | Best | Emission | |
|---|---|---|---|---|---|---|
| Latitude | Longitude | Area | Flyby | Resolution | Angle | |
| (Positive west) | (km2) | (km/pixel) | (∘) | |||
| 90 N - 80 N | 21,500 | T90-T94 | ||||
| Punga Mare | 88 | 150 | 1,220 | T93, T94 | 6 | 16 - 22 |
| Kutch | 88 | 222 | 13,800 | T93, T94 | 7 | 17 - 22 |
| Ligeia Mare | 75 | 170 | 4,250 | T69, T94 | 1 | 14 - 60 |
| Kivu Lacus | 87.02 | 118 | 88 | T85, T93, T94 | 1 | 47 |
| Muggel Lacus | 83 | 170 | 30,000 | T93, T94 | 7 | 15 - 34 |
| 80 N - 70 N | 16,800 | |||||
| MacKay Lacus | 77 | 96 | 14,600 | T94 | 8 | 5 - 21 |
| Lake District | 64-83 | 183 - 125 | 55,900 | T97 | 15 | 5 |
| 70 N - 60 N | 18,300 | |||||
| Cardiel Lacus | 68 | 203 | 7,100 | T90 | 62 | 70 |
| Woytchugga Lacuna | 69 | 110 | 66,700 | T97 | 13 | 9 |
| Nakuru Lacuna | 65.5 | 92.38 | 2,580 | T97 | 13 | 18 |
| Vanern Lacus | 69.9 | 223.2 | 7,060 | T69 | 14 | 63 |
| Towada Lacus | 69.3 | 242 | 782 | T69 | 10 | 63 |
| Atacama Lacuna | 67.6 | 226.1 | 799 | T69 | 13 | 62 |
| Djerid Lacuna | 65.8 | 219.7 | 808 | T69 | 13 | 59 |
| Uyuni Lacuna | 65.7 | 223.8 | 700 | T69 | 13 | 59 |
| Ngami Lacuna | 67.2 | 211.2 | 1,020 | T69 | 13 | 60 |
| 60 - 50 | 6,020 | |||||
| Kraken Shores | 60 | 305 | 32,300 | T76 | 20 | 73 |
| South of Kraken | 42,000 | T76 | ||||
| 50 N - 40 N | 2,810 | T76 | ||||
| Hammar Lacus | 47 | 313.49 | 18,600 | T76 | 31 | 55 |
| 40 N - 30 N | 17,200 | |||||
| West Fensal | 15 | 52 | 18,300 | T5 | 9 | 22-37 |
| East Fensal | 17.4 | 39.5 | 3,660 | T5 | 37 | 18 |
| West Belet North | -1.5 | 284.9 | 1,160 | T61 | 15 | 48 |
| West Belet South | -8.2 | 283.9 | 3,650 | T61 | 15 | 48 |
| Southwest Belet | -18.2 | 276.6 | 3,930 | T61 | 22 | 57 |
| Hotei Regio | -25.8 | 81.2 | 211,000 | T48 | 14 | 73 |
| Tui Regio | -25.8 | 122 | 296,000 | T12 | 43 | |
| North Yalaing Terra | -15.2 | 322.46 | 2,300 | T58 | 20 | 16 |
| Ontario Lacus | -72 | 180 | 2,610 | T38, T51 | 1 | 28 - 75 |
| Arrakis Planitia | -78.1 | 110.5 | 27,500 | T51 | 6 | |
| 78 S - 82 S | 16,400 | T23 | ||||
| Total | 998,000 |
3 Results
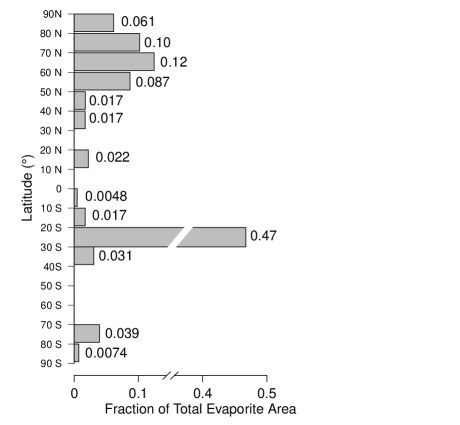
We identify new evaporite candidates in the north polar region, the northern midlatitudes, the equatorial band, and the south polar region, listed in Table LABEL:evapcandtable and shown in Figure 2. If the connection between 5-m-bright material and lakebeds in the north pole holds for other regions, then the areas outlined in Figure 2 would have been covered with enough liquid at least once to have created the 5-m-bright deposits. Interestingly, the largest evaporite candidates are not located in the poles, where the largest amount of surface liquid currently resides, but rather in the equatorial band (Figure 3). The following subsections discuss the deposits in detail by region.
3.1 North Pole
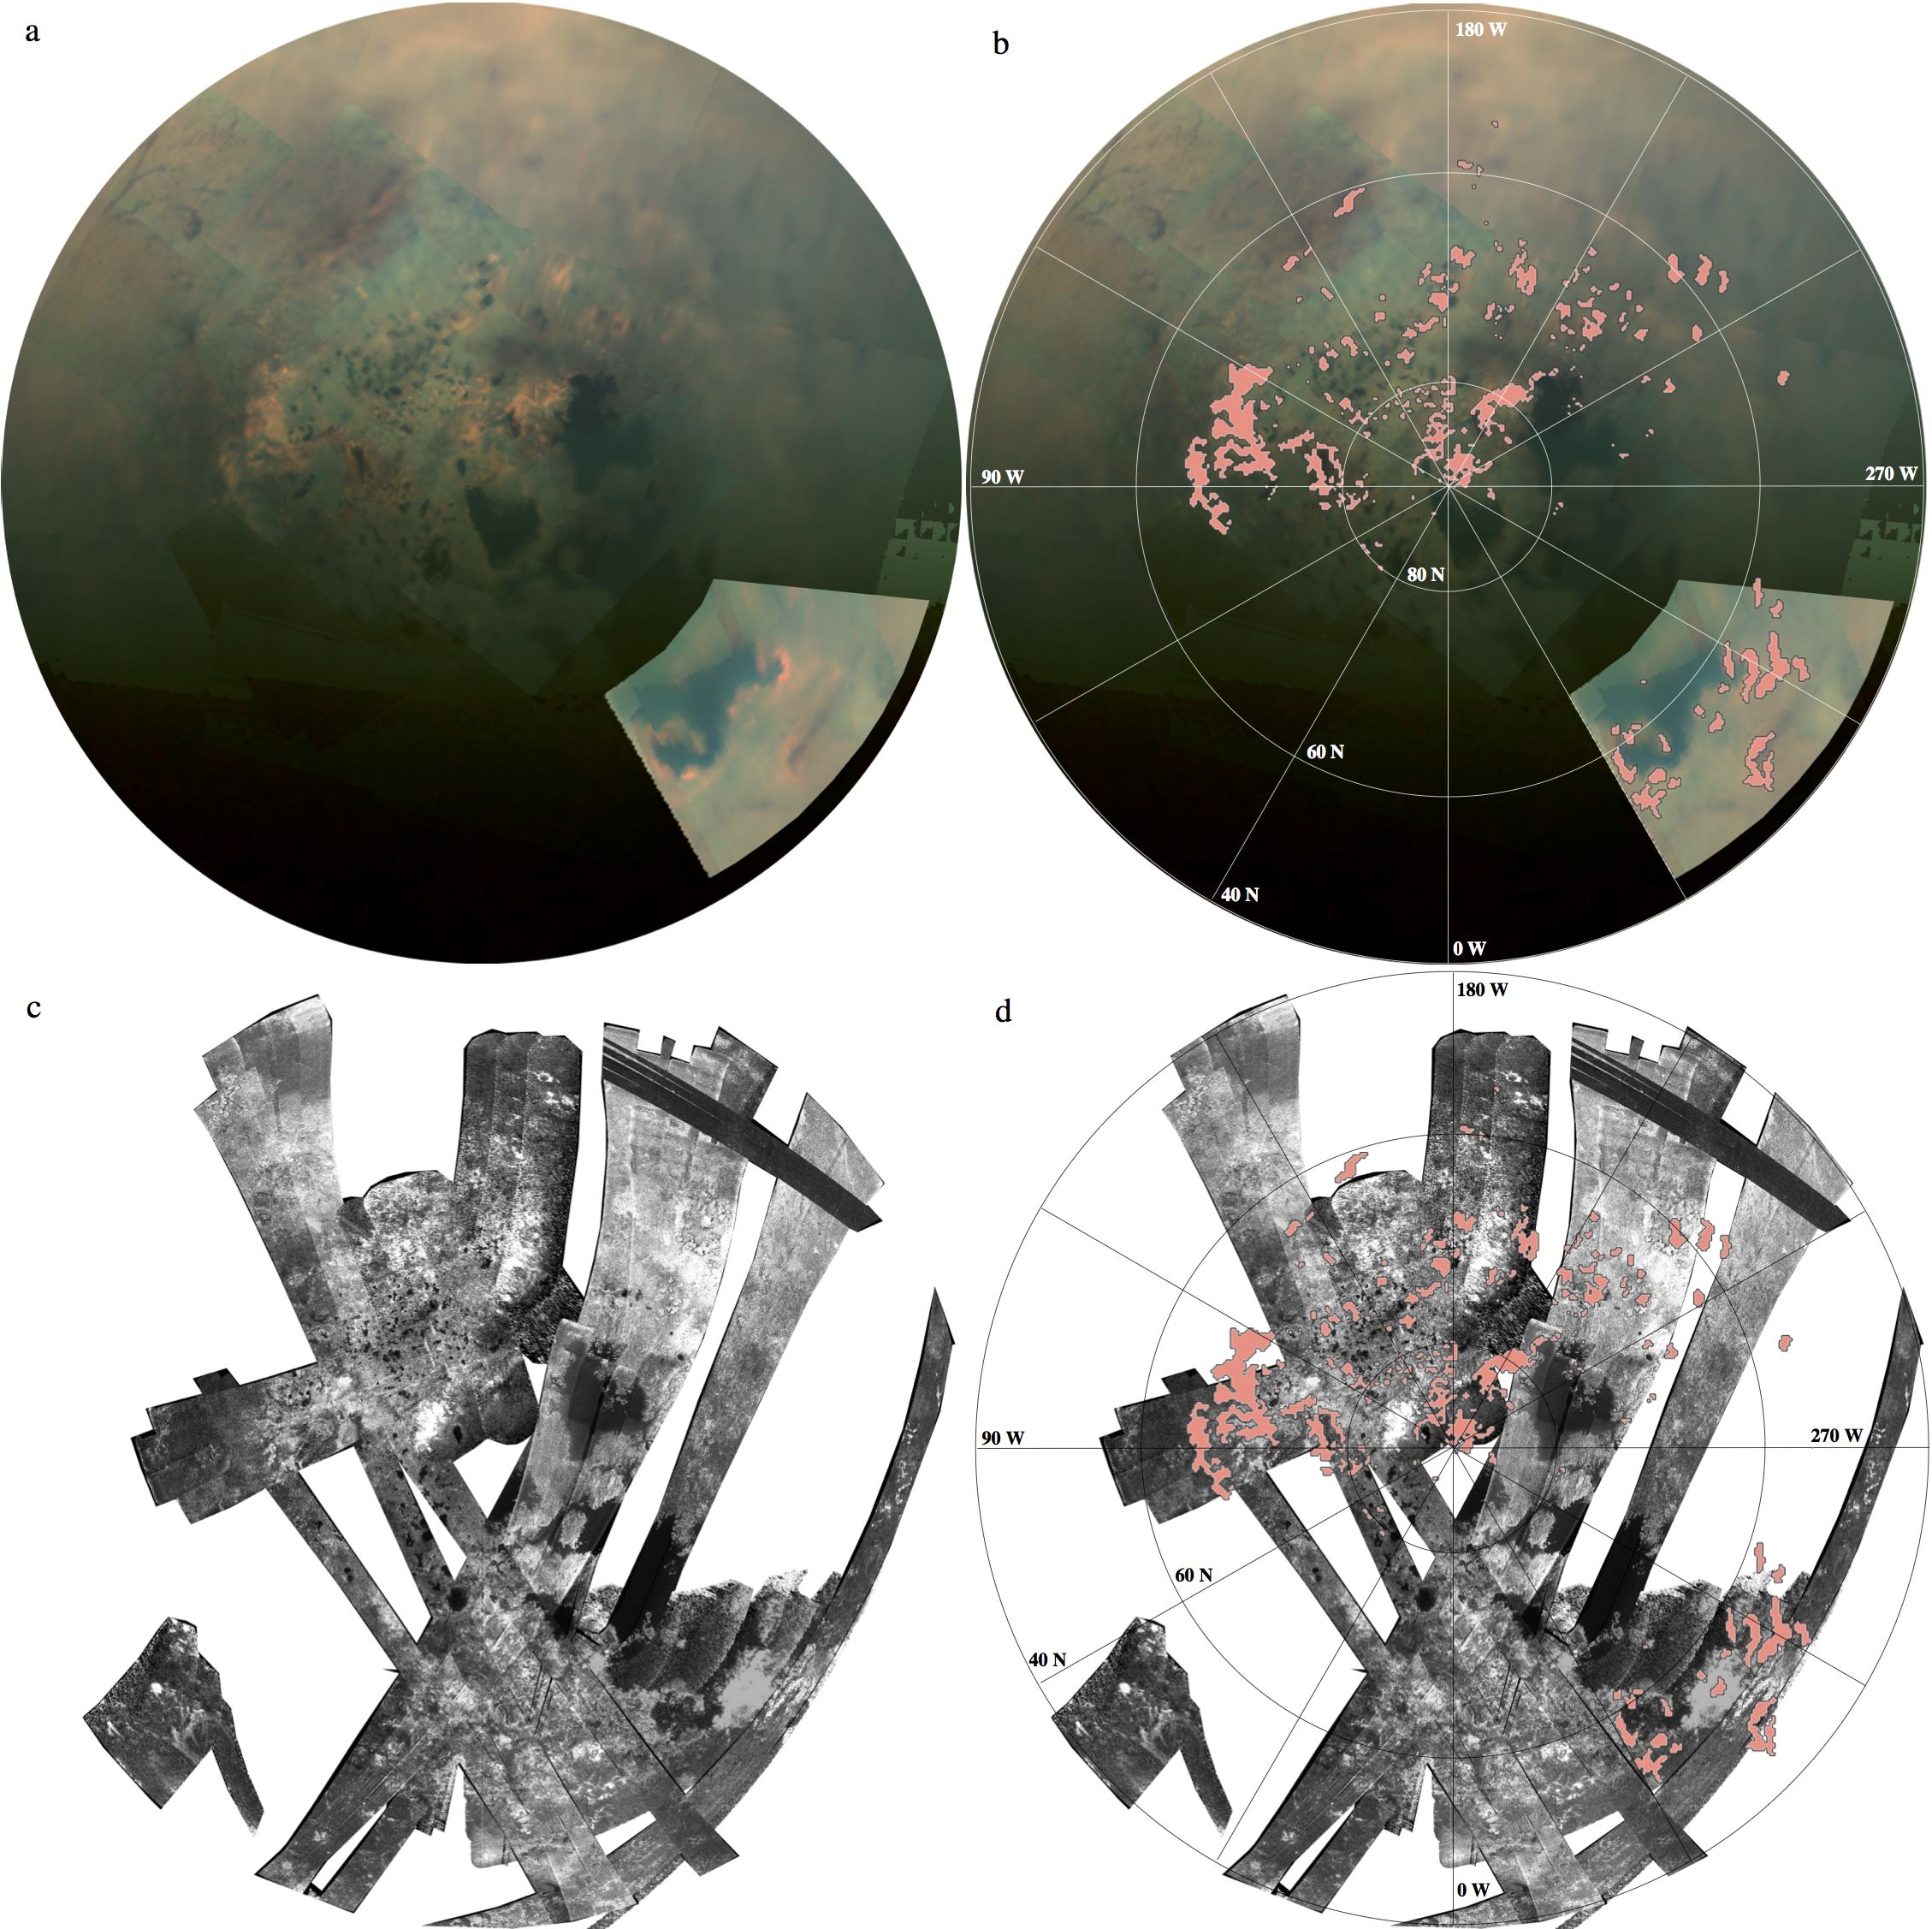
In Figure 4, the best VIMS coverage (panel a) of the north pole is compared to the RADAR coverage (panel c) and our mapped evaporite deposits (pink polygons of panels b and d). As Titan enters northern spring, VIMS has begun to explore the previously night-covered, near-polar surface. In addition, the dense cloud cover above the north pole that was present during northern winter has progressively vanished since equinox, allowing observations of the underlying lakes (Rodriguez et al., 2011; Le Mouélic et al., 2012). Notably, with flybys T90 and later, we were able to investigate the anti-Saturn half of the north polar region, including the extent of Punga Mare and a variety of yet unnamed lakes.
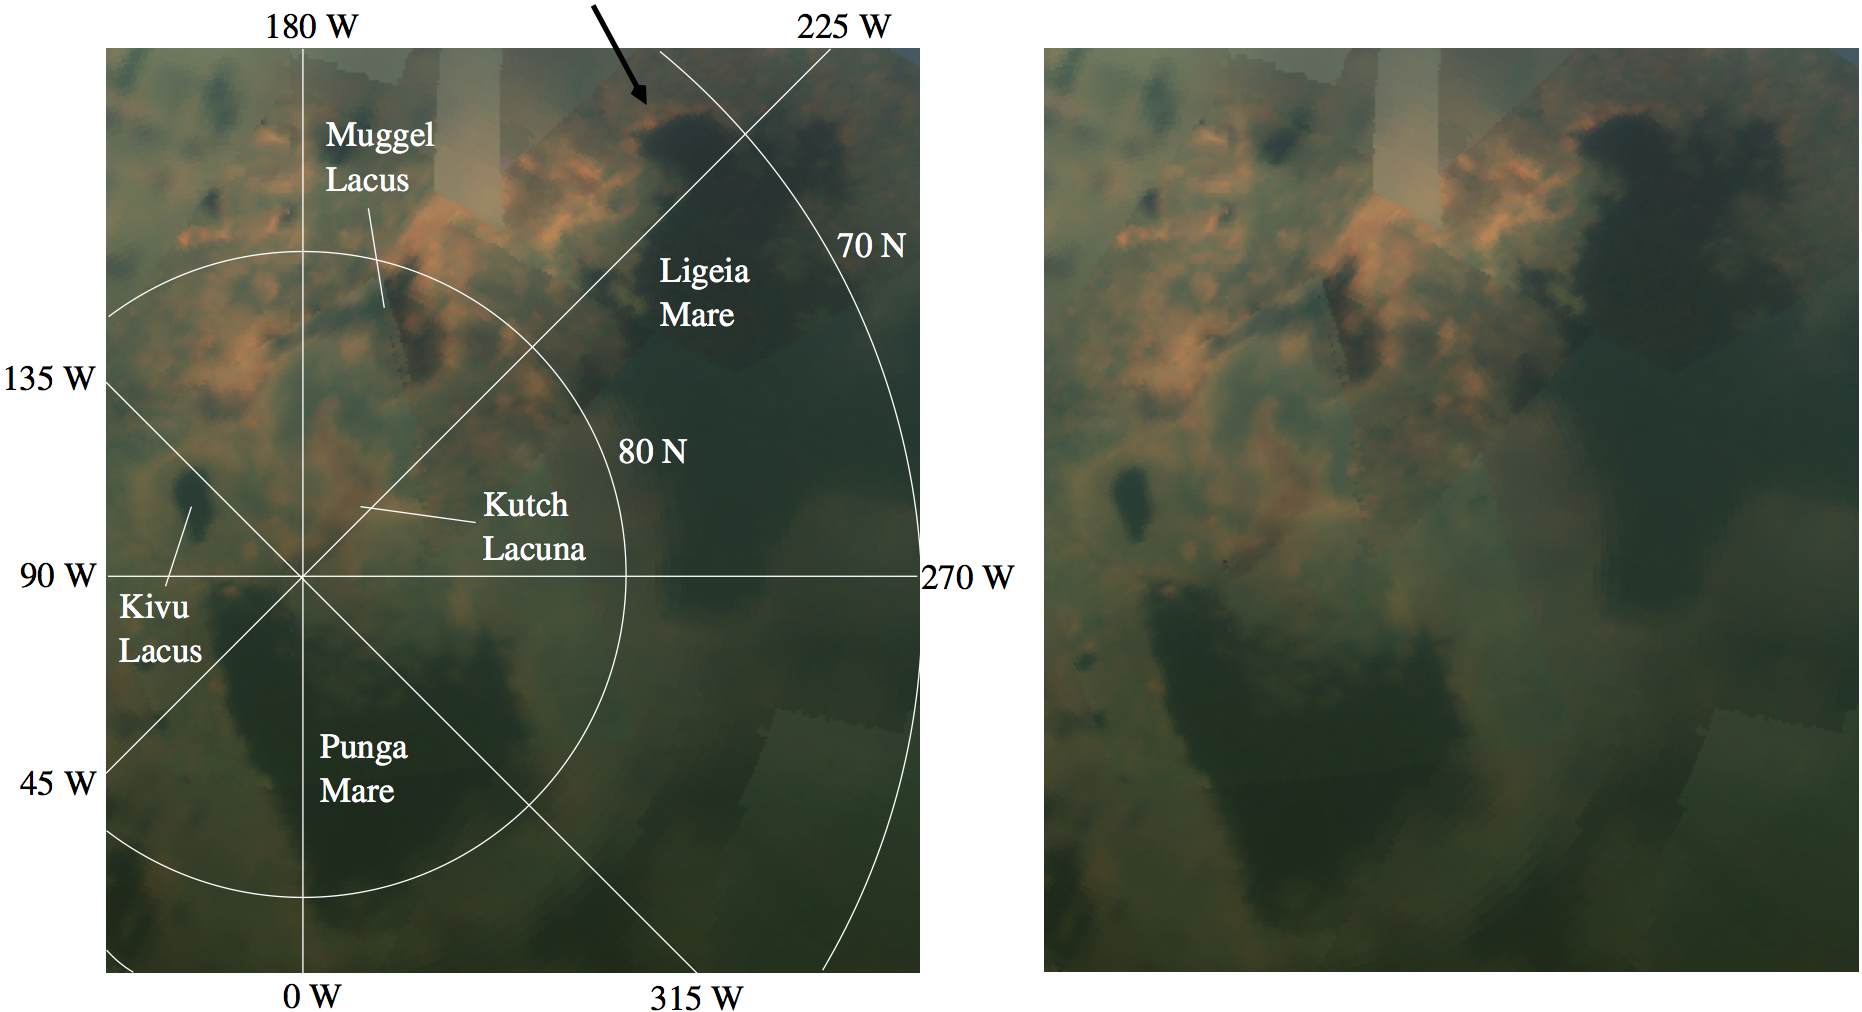
In the latest VIMS data, we see that Punga Mare and Kivu Lacus are not the only features surrounding the exact North Pole: a distinct evaporitic feature, Kutch Lacuna, exists independently. Shown in Figure 5, Kutch does not lie along the shorelines of either the lake or sea nearby. Interestingly, Punga has small evaporite deposits only visible in the high resolution shot of T93 (best sampling of 5 km/pixel). This is unusual, as the other three largest bodies (Kraken Mare, Ligeia Mare, and Ontario Lacus) have both small deposits and larger shoreline coverage of 5-m-bright material. Perhaps Punga’s liquid level is currently at its “high water” mark, or the sea could have steeper shores than its counterparts.
The southeastern shore of Kivu Lacus was seen at a fine sampling (roughly 1 km/pixel) by VIMS in the T85 flyby. In T85 (zoom in of Figure 6 a), 5-m-bright material hugs the south eastern shoreline. In panel b, we use a hue-saturation-value (HSV) scheme to combine RADAR and VIMS data. The RADAR data provide the combined image’s brightness (value), while VIMS data determine the color (hue) and degree of color (saturation) relative to the value. We also identify some non-shoreline 5-m-bright material (orangey-red in the color stretch of Figure 6) as deposits though no RADAR features are discernible. These deposits near the lake were observed in both T85 and T93, forming a half ring about 150 km wide a few kilometers from Kivu’s southern shore.
North of Ligeia, a large distribution of 5-m-bright material surrounds the uniquely shaped, VIMS dark blue lacustrine feature known as Muggel Lacus, shown in Figure 5. The morphology suggests either a paleo shoreline of Ligeia Mare or a previously more extensively filled lacustrine feature. In the former case, Ligeia would extend over an area of 136,000 km2, an increase of about 9%. Muggel Lacus was covered by what we assume to be fog in T91, but returned to the morphology seen in T90 by T93 and T94. The most northern extension of Muggel Lacus (near Kivu) was covered by a cloud in T93, but is cloud free in T94. We interpret Muggel to be a shallow evaporitic basin with a very shallow lake at its bottom– shallowness would be consistent with why the feature is difficult to see in RADAR.
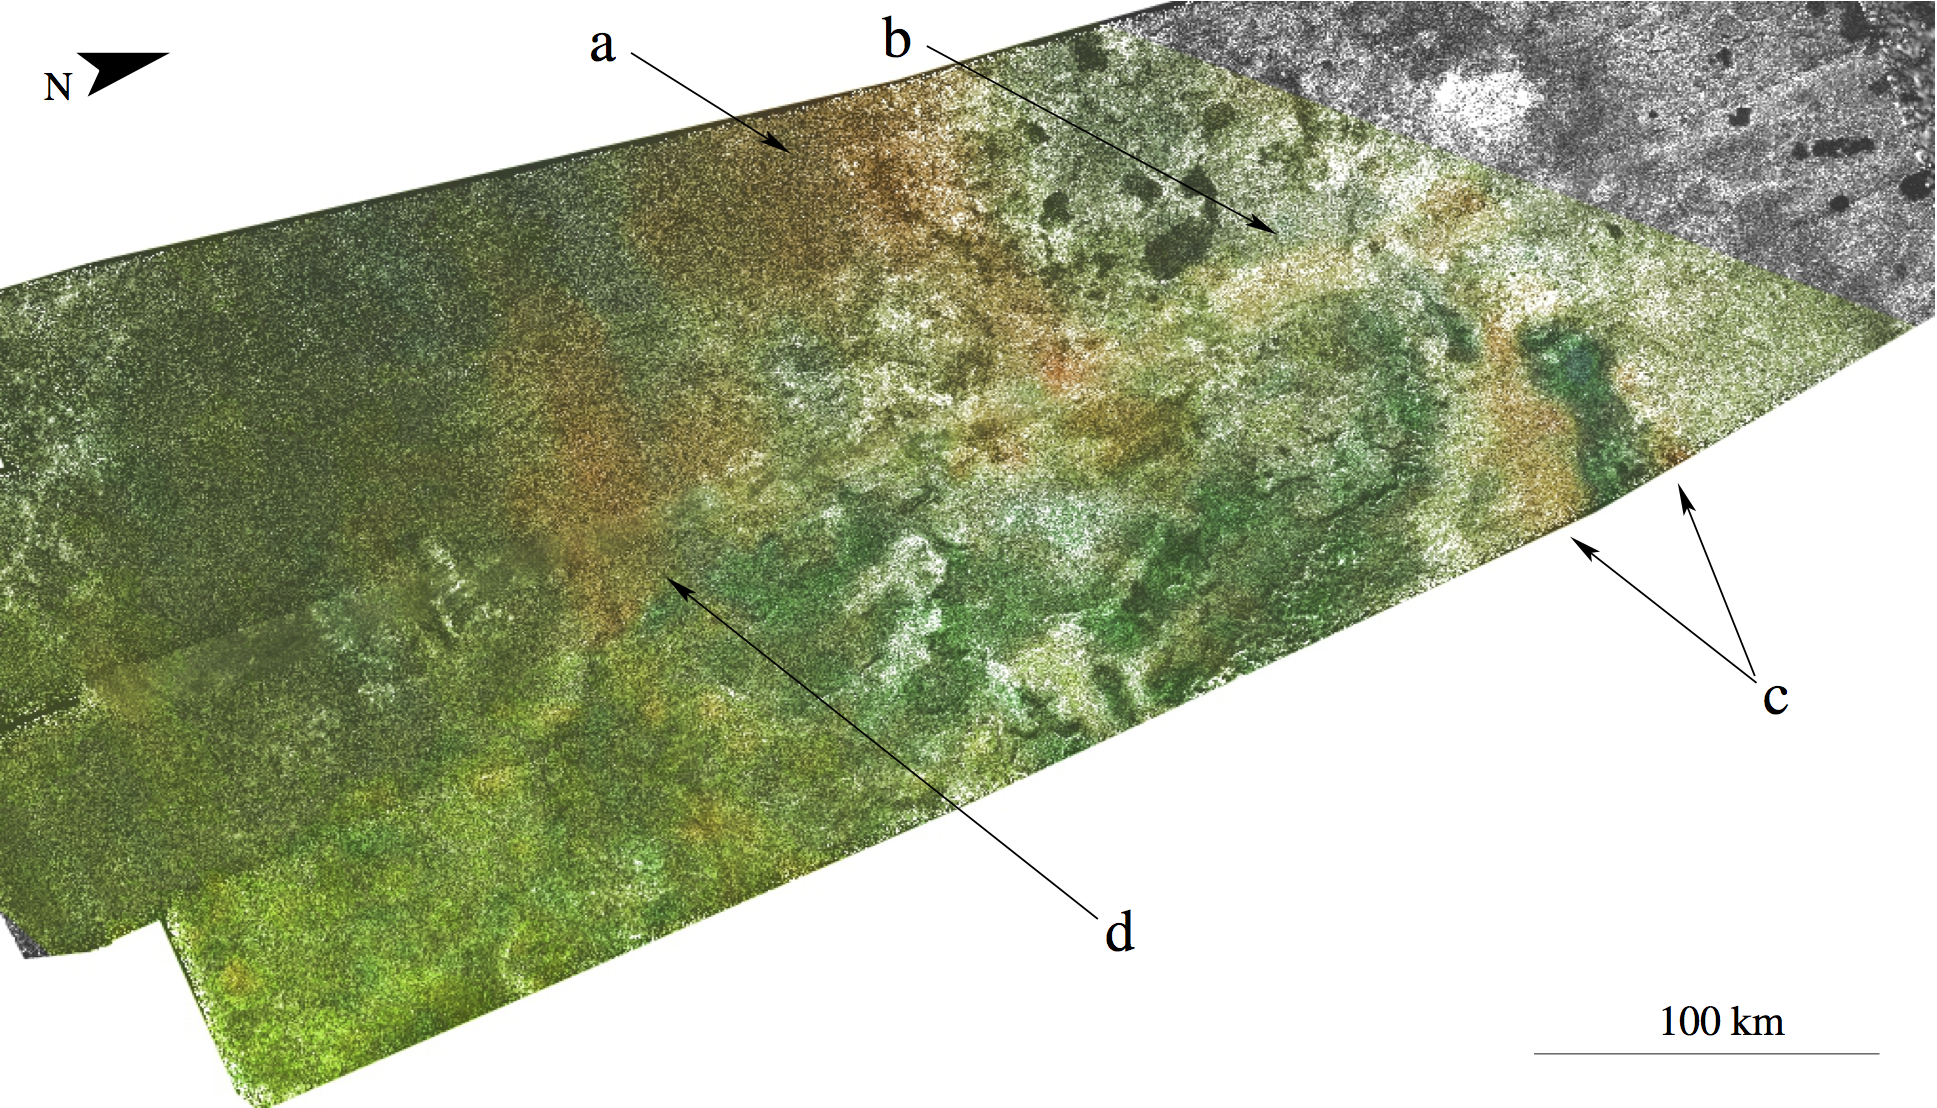
In Figure 7, we again combine VIMS and RADAR data and see that the expansive 5-m-bright region indicated by arrow a, Woytchugga Lacuna, is similar to Kutch. Neither are located in conjunction with currently filled liquid bodies. To the right of Woytchugga is another not-lake-bordering 5-m-bright deposit, Nakuru Lacuna, indicated by arrow d. The 5-m-bright signature of both candidates is consistent in shape between T90 through T97– they are thus unlikely to be patches of fog. The northeastern-most corner of Woytchugga even appears 5-m-bright in a small hi-res shot from T88. Smaller deposits identified from T88 also agree with the deposits identified in this T93 image, b and c. Arrow b points to a streak that does not seem to correspond with SAR-identifiable lacustrine features, though in VIMS data it borders the dark material typical of liquid filled lakes (blue in our color scheme) in the north pole. Arrow c, however, shows the often observed evaporite-covered shores of MacKay Lacus.
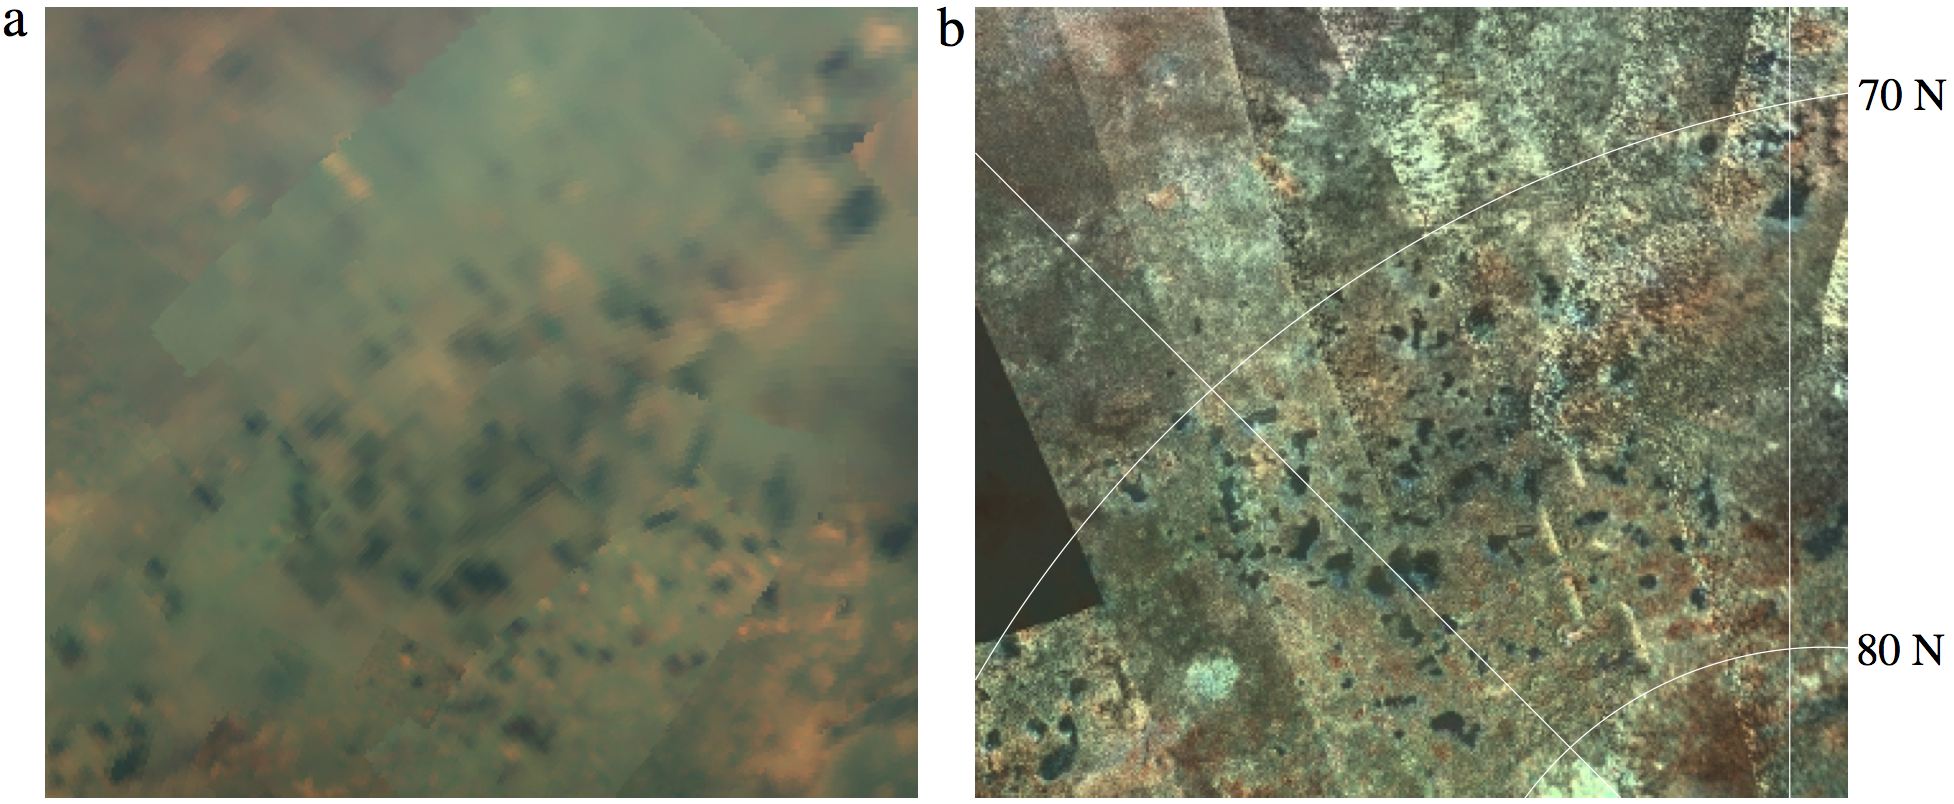
The region dense with small lakes identified by Hayes et al. (2008) around 80N, 140W was seen by VIMS during T96 and T97. Figure 8 shows the VIMS data on the left, and a VIMS-RADAR composite on the right. With few exceptions, the 5-m-bright material corresponds to the shores of filled lakes or the bottoms of dried lakebeds as discerned from RADAR. Thus, evaporite is found on the largest liquid bodies on Titan (notably, the large deposits along the shores of Kraken Mare), as well as lakes at the limit of detectability for VIMS. There seems to be a higher number of evaporite deposits in this region than elsewhere in the north pole, though we caution that this statement is observationally biased until the sub-Saturn half of the north pole has better VIMS coverage.
While we will show in this section that much of the correlation between RADAR and VIMS data is geomorphologically consistent with evaporite formation along lakebed bottoms or liquid filled shorelines, the remaining diversity of RADAR features corresponding to VIMS 5-m-bright material, especially in the liquid-abundant north pole region, is evidence for complex processes that are not yet understood. Woytchugga and Nakuru Lacunae, for example, are not located near current lacustrine features. Instead, the 5-m-bright areas seem to be located along a boundary between varying intensities in the RADAR signal (perhaps similar to Arrakis Planitia, discussed below).
The geomorphological interpretation by Wasiak et al. (2013) of the RADAR coverage of Ligeia Mare complements the evaporite candidates that we map in the region. The deposits are located in the kinds of terrains one would expect evaporite to form. Evaporites dotting the southern shoreline of Ligeia (identified in T69), for example, are small, isolated, and coincide with bays (possibly flooded) and mottled (erosion pattern lacking) landscapes. In the area between Kraken and Ligeia, where we identify evaporite along the shore of Kraken, Wasiak et al. (2013) interpret a dome structure to establish a watershed between the three seas. The “strip” of evaporite along the easternmost southern shore of Ligeia (viewed in T94 and pointed to by a black arrow in Figure 5) is located in a lower lying region than the hummocky terrain directly east.
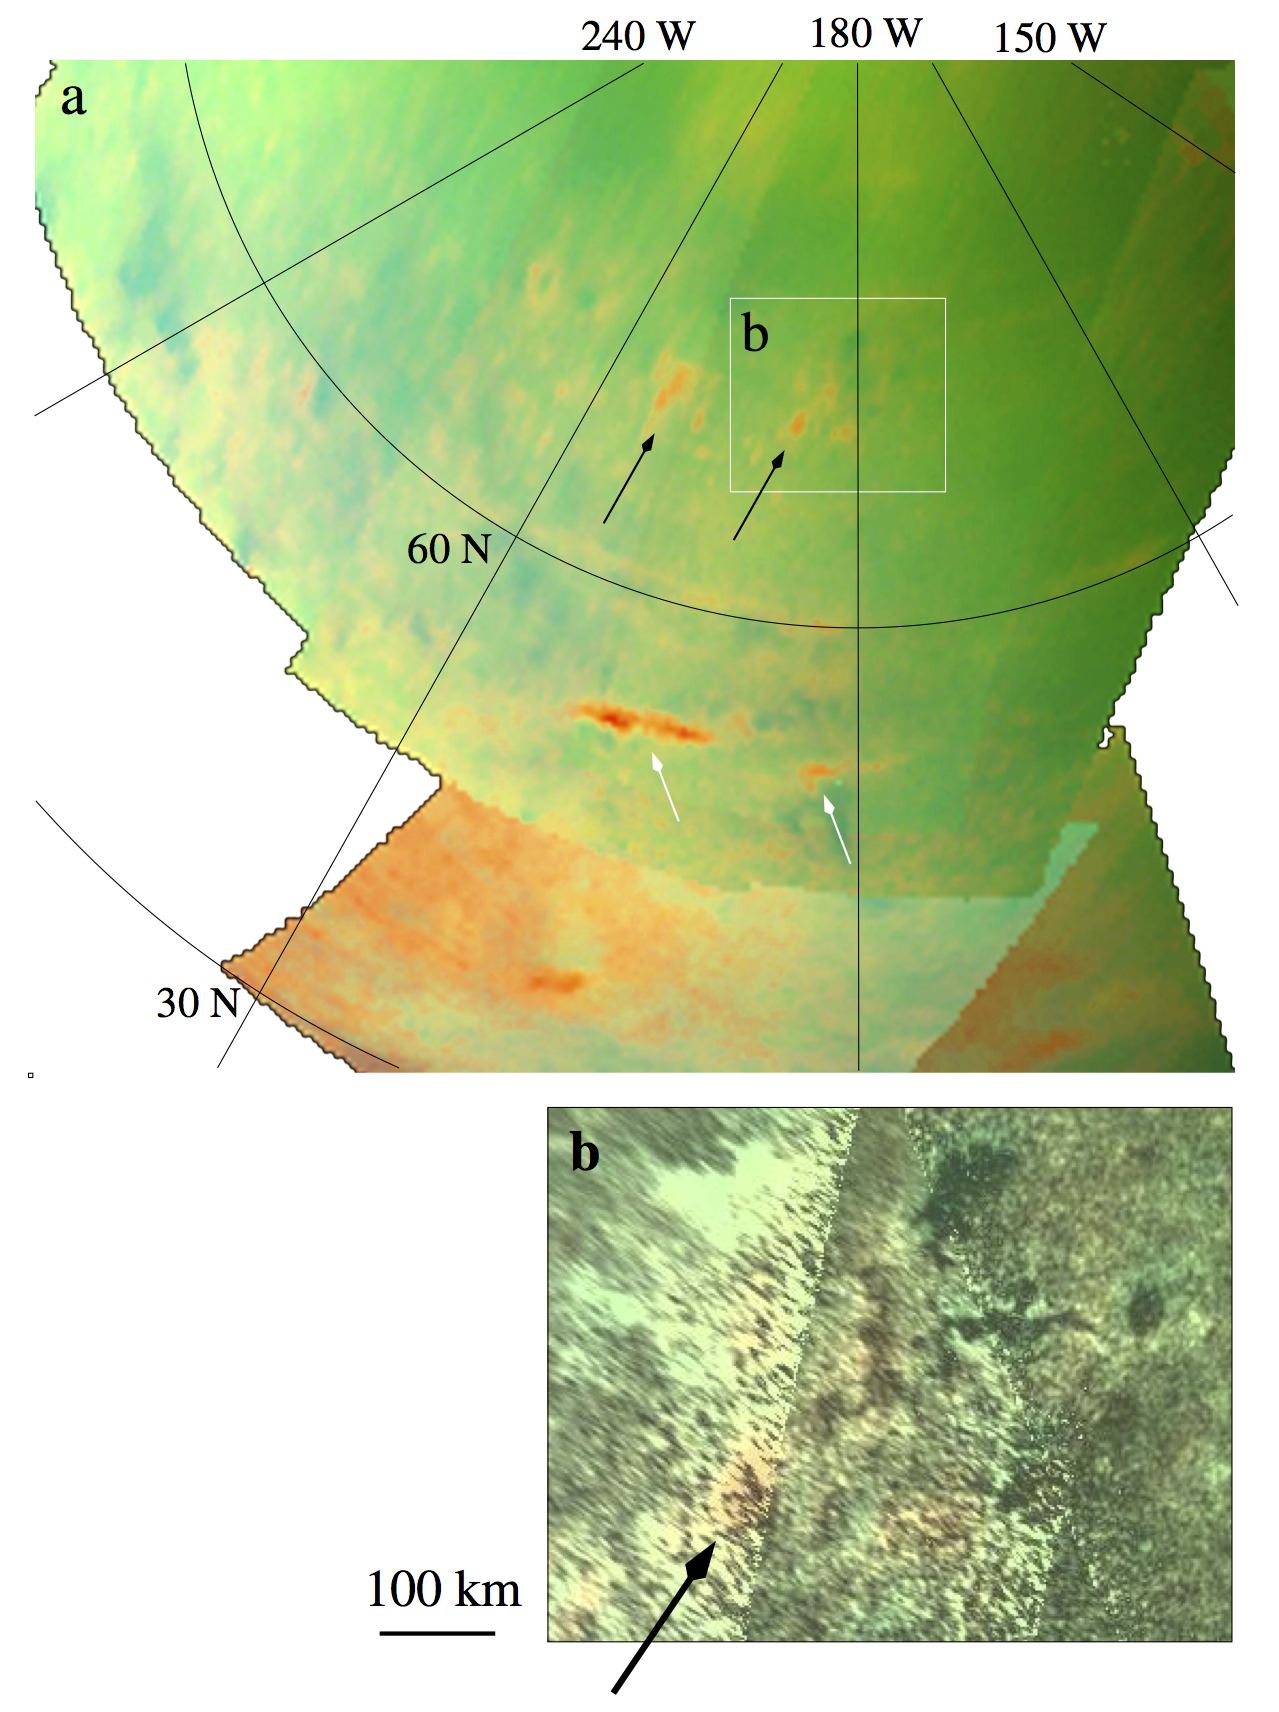
North of the region Dilmun, evaporite deposits continue eastward from those south of Ligeia identified by Barnes et al. (2011), shown in Figure 9. The two northern deposits indicated with black arrows appear in T69 as well as T90 and T97. The correlation between RADAR and VIMS data for this general area is ambiguous, as the HiSAR swath of T29 is noisy along the seams. The data do, however, provide enough qualitative context for the evaporite deposits outlined in b to again confirm that the 5-m-bright material coincides with a region in which lakes exist. Clouds are also active in this region: the white arrows of Figure 9 point to clouds that exhibit the specific 2 m wing, 2.75 m, and 5 m window signatures. Whether the lake desiccation process drives the clouds or the clouds drive the precipitation is beyond our present ability to determine.
Kraken Mare, Titan’s largest body of liquid, extends further south than any other sea. In fact, the highest resolution VIMS imaging of the liquid body covers its southernmost shore. In Figure 10 we again use HSV to compare VIMS and RADAR data. The difference in quality (mostly spatial resolution) between the middle RADAR swaths and those at the top and bottom is the difference between HiSAR and SAR modes, respectively. As with Ontario Lacus (Barnes et al., 2009), evaporite is not detected along the entirety of the shoreline seen at VIMS resolution. If the RADAR-bright material of the southwest is a mountain chain, then the steep shoreline could explain the apparent absence of evaporite along the middle of the southern coast. This would be a scenario similar to the northwest shore of Ontario, where mountain chains have been identified (Wall et al., 2010; Hayes et al., 2011; Turtle et al., 2011b; Cornet et al., 2012a). On the northwest shoreline above 60∘N, there is neither extensive evaporite coverage (only an isolated deposit viewed in T69) nor RADAR-bright material to explain the absence of 5-m-bright material, similar to the other mare shorelines. Unless there are small deposits beyond presently available VIMS resolution, some other process, like steeper shorelines or frequent flooding for example, could be responsible for preventing large scale evaporite formation there.
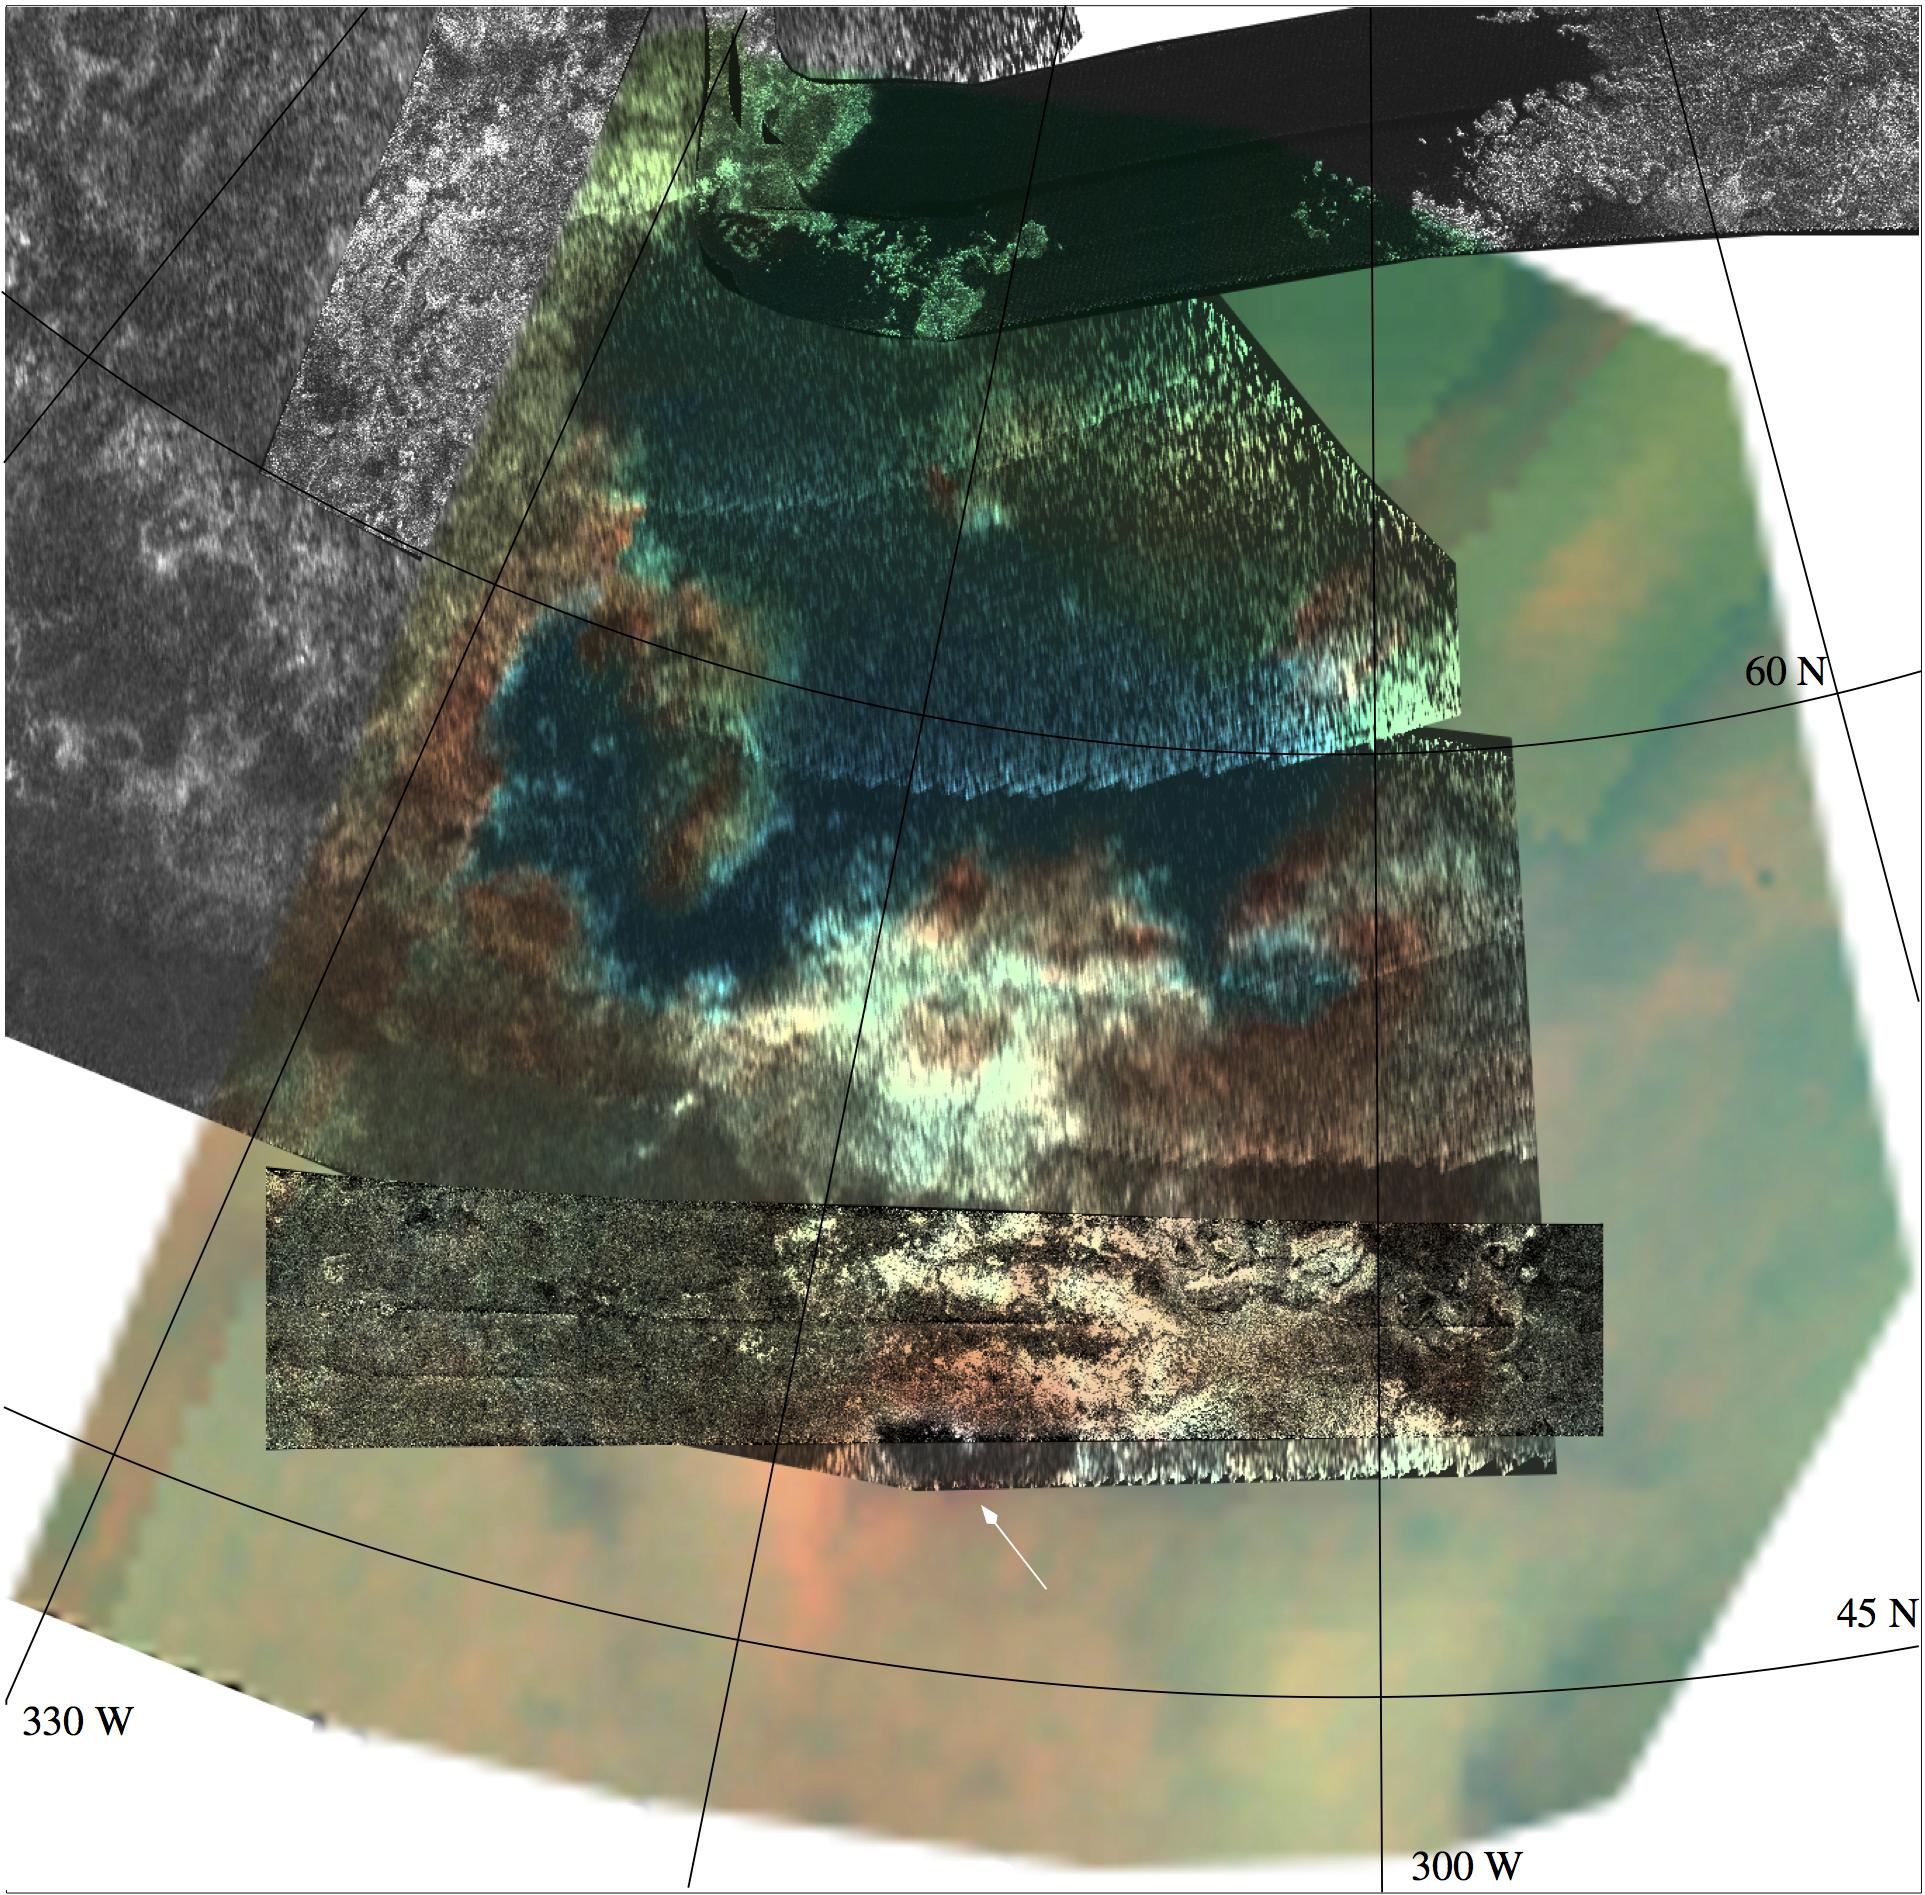
South of Kraken, there are several evaporite deposits not located along the sea’s shoreline. In the middle of the shoreline mountains, what may be a valley is seen to be 5-m-bright. To the east, the 5-m-bright material that appears to be separate from the very bright deposits on Kraken’s southeastern-most shore extends from 58∘N down to 50∘N. At the lower latitudes, where SAR data is available, this material is coincident with some discernible RADAR features. Hammar Lacus, indicated by the white arrow of Figure 10 is about 11,000 km2 in area with 5-m-bright material delineating all but its eastern shores. The lake itself is RADAR-dark and the evaporite is RADAR-neutral to the west, as expected. To the northeast of Hammar Lacus, however, evaporite extends into the increasingly RADAR-bright area, probably indicative of mountains or very rough terrain. Mountains typically appear dark blue in our VIMS color scheme (Barnes et al., 2007b). Thus, if the RADAR-bright features are mountains, then one mechanism for them to appear 5-m-bright would be if some erosional process was exhuming evaporite. If Kraken were to cover all these non-shoreline deposits (difficult if the RADAR-bright material is indeed mountainous), the sea would need to increase in area by about 10%.
3.2 Midlatitudes and Tropics
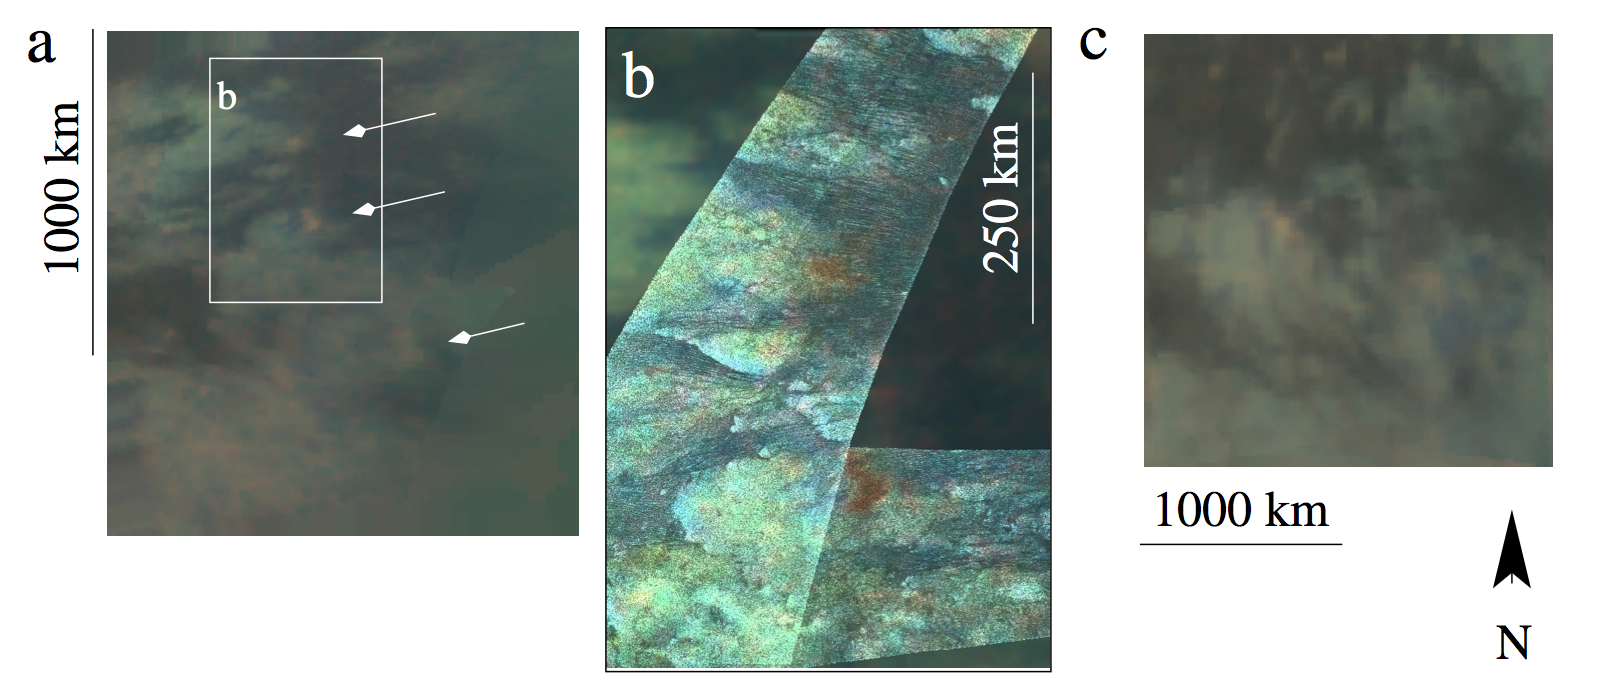
In the non-polar regions, despite the present-day lack of filled lakes or seas, we identify several evaporite candidates. West of Belet, there are three distinct deposits seen in VIMS data from T61, indicated by white arrows in Figure 11a: from top to bottom, West Belet North, West Belet South, and Southwest Belet. Each deposit seems to be located on the border between (non-Xanadu) equatorial bright and dark brown spectral units. In the equatorial band, the dark brown spectral unit, ascribed to water-ice-poor material and associated with organic material (atmospheric aerosol-like particles), corresponds to dunes (Soderblom et al., 2007; Barnes et al., 2007a; Le Mouélic et al., 2008; Rodriguez et al., 2014). When the RADAR image is colored according to the VIMS data (Figure 11b), the spectroscopic boundaries correspond to those in the RADAR data and West Belet North and South are located along such a boundary. It could be that lacustrine or fluvial features are present in the region, but beyond the resolution limit of SAR, VIMS, or ISS (as is the case for the Huygens Landing Site, where probe data reveal such features while Cassini instruments do not). On the other hand, the lack of fluvial features may be indicative of distinct processes responsible for creating or exhuming evaporite along the border of the two spectral units (perhaps dune induced convecting clouds, for example (Barth, 2010)).
Unique among 5-m-bright deposits not found at the poles, the evaporite candidate located on the north end of the land mass Yalaing Terra has been observed by VIMS several times. This evaporite candidate does not always appear 5-m-bright: for over a year, the surface experienced brightening in the shorter wavelengths that correspond to the Equatorial Bright spectral unit, then reverted to its original spectrum, which is shown Figure 11c. Based on the long time scale of reversion and the relative reflectivity behavior (between the brightened area and nearby unchanged dark and bright areas), this phenomenon was suggested by Barnes et al. (2013) to be due to the rainfall from the 2010 September cloudburst. Similar brightening/darkening was seen at locations of similar latitude: Heptet Regio, Concordia Regio, and Adiri. Turtle et al. (2011a) also attribute observed surface darkenings to a change in surface wetness. If rainfall is the cause for surface brightening, the evaporite may have dissolved, then precipitated out again as the liquid evaporated. Alternatively, there may have been just enough liquid accumulation to effectively mask the brightness at 5 m, without actual dissolution of the solute. In either case, this observation is evidence against short-term evaporite volatility, for the deposit reappears in the exact location where it was previously observed. Such behavior would be unusual for a vapor. As of yet there are no RADAR data to provide further evidence as to whether this 5-m-bright signature coincides with lacustrine or fluvial morphologies or is located along a RADAR bright/dark border in the same fashion as the other not-polar evaporite candidates.
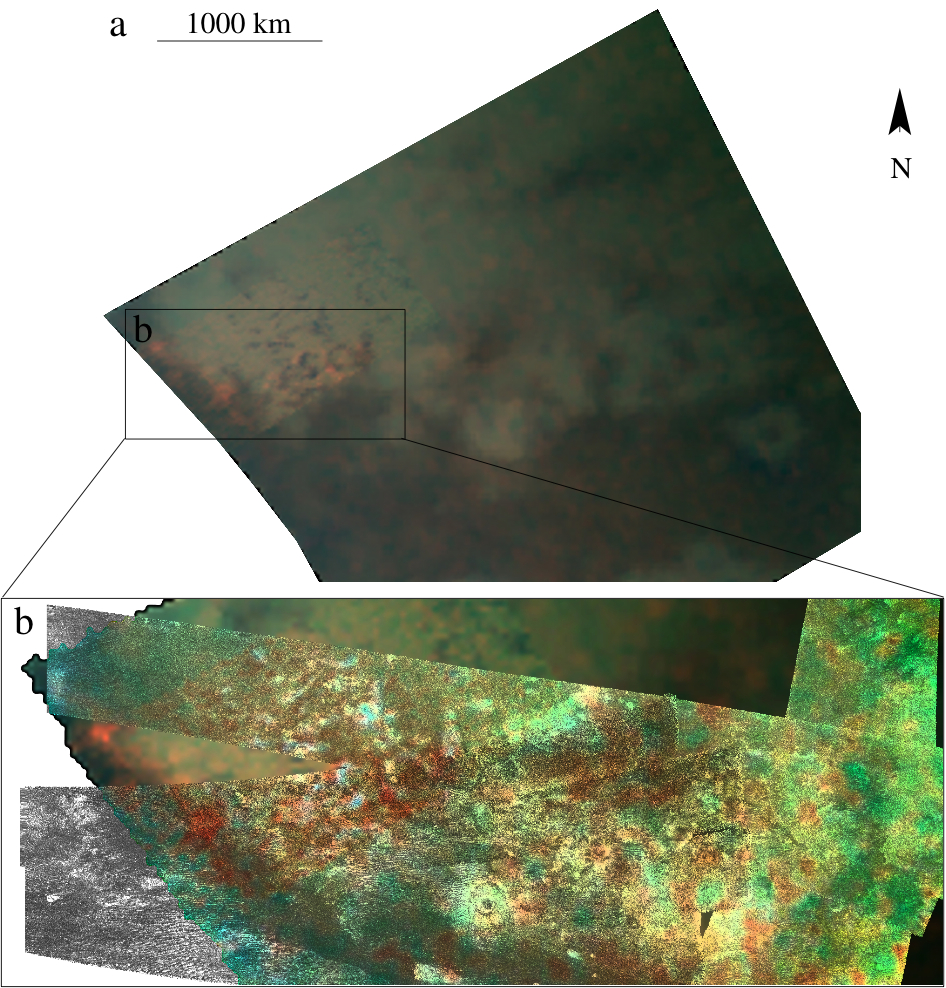
There is a particularly bright outcropping of 5-m-bright material north of the western part of the region known as Fensal, best seen by VIMS in T5 and encapsulated by a black box in Figure 12a. To the furthest west of this box, two deposits are located on the border between equatorial bright and dark brown material, similar to what we see in West Belet (Figure 11a). East of these features, there are a number of 5-m-bright patches nestled amongst VIMS dark blue spots. The VIMS dark blue unit, unlike the dark brown unit, is suspected to be water-ice rich (Rodriguez et al., 2006, 2014; Soderblom et al., 2007; Barnes et al., 2007a; Le Mouélic et al., 2008). Comparison between the VIMS and RADAR data in panel b is hindered by the high level of photon shot noise; that is, the low signal of this flyby is highly affected by random photon fluctuations. While the composite is not very useful for distinguishing the RADAR features corresponding to 5-m-bright deposits, we can discern that the dark blue VIMS unit coincides with RADAR bright material. These dark blue spots have a lacustrine-like morphology; liquid lakes could appear RADAR bright if there were enough waves to roughen the surface. However, SARtopo inferred relative altimetry (Stiles et al., 2009) indicates that peaks in this region correspond to the RADAR-bright and VIMS dark blue spots. While such altimetric evidence does not rule out the possibility of lakes (there are mountain lakes on Earth, such as tarns and cirques, that are formed in the basins excavated by glaciers and filled with rainwater or snow melt), the prevalence of the VIMS dark blue unit coinciding with mountains in the equatorial region as well as the putative absence of equatorial lakes makes such an explanation less likely. Thus, we prefer an interpretation in which the peaks are mountainous and evaporite candidates are either exhumed by crustal activity or is the remnant of liquid that pooled in slight depressions at the base of the mountains, where the mass of the peaks could deform the surface crust enough to create very localized basins.
Further east we see a larger but fainter 5-m-bright region (pointed to by the white arrow in Figure 12) once again bordering equatorial bright and dark brown VIMS spectral units. The spatial resolution of this part of the VIMS composite image is not as good as that of the smaller west Fensal deposits discussed above. SARtopo indicates that this region is of lower altitude than the RADAR bright spot bordering on the east– the topography expected for an evaporitic deposit as liquid could pool in the depression. If there was once enough liquid to form this evaporite candidate along the edges of this basin, perhaps there was also enough to wet the surface at the base of the VIMS dark blue mountains nearby.
3.3 Tui and Hotei Regiones
Recent work by Lopes et al. (2013) reestablishes the evidence for possible cryovolcanic features around Hotei from the most recent VIMS and RADAR data. While we maintain the hypothesis of Moore and Howard (2010) that the basins Tui Regio and Hotei Regio are 5-m-bright because they are fossil seabeds that were once filled with enough liquid from which evaporite could form, we note that cryovolcanic activity and a fossil seabed are not mutually exclusive. Isla Incahuasi, for example, is an ancient volcano in the middle of the Salar de Uyuni, Earth’s largest salt flat. However, since the 5-m-bright spectral unit is water-ice-poor, the formation of the 5-m-bright material is not consistent with cryovolcanism.
As shown in Figure 3, Tui and Hotei are the largest single outcroppings of 5-m-bright material on the surface of Titan, comprising 30% and 21% of the total area of mapped 5-m-bright material respectively. (For VIMS observations of the regiones, we refer to Figures 1 and 2 of Barnes et al. (2006) for Tui and Figure 1 of Soderblom et al. (2009) for Hotei.) We estimated the volume that the basins could hold by a simple approximation similar to Lorenz et al. (2008b) and Lorenz et al. (2014): we assumed that the depth/area ratio is constant for large bodies and scaled this ratio to the recently measured depth value for Ligeia Mare (Mastrogiuseppe et al., 2014). From this, the total volume in the seas was found to be 42,000 km3, a value within the range of those found independently by Lorenz et al. (2014) and Hayes et al. (2014) ( 32,000 km3 and 70,000 km3, respectively). Our total volume for Tui (ratio depth of 370 m) and Hotei (200 m) was 57,000 km3. To first order, there is enough liquid currently in the north pole to fill Tui and Hotei.
3.4 South Pole
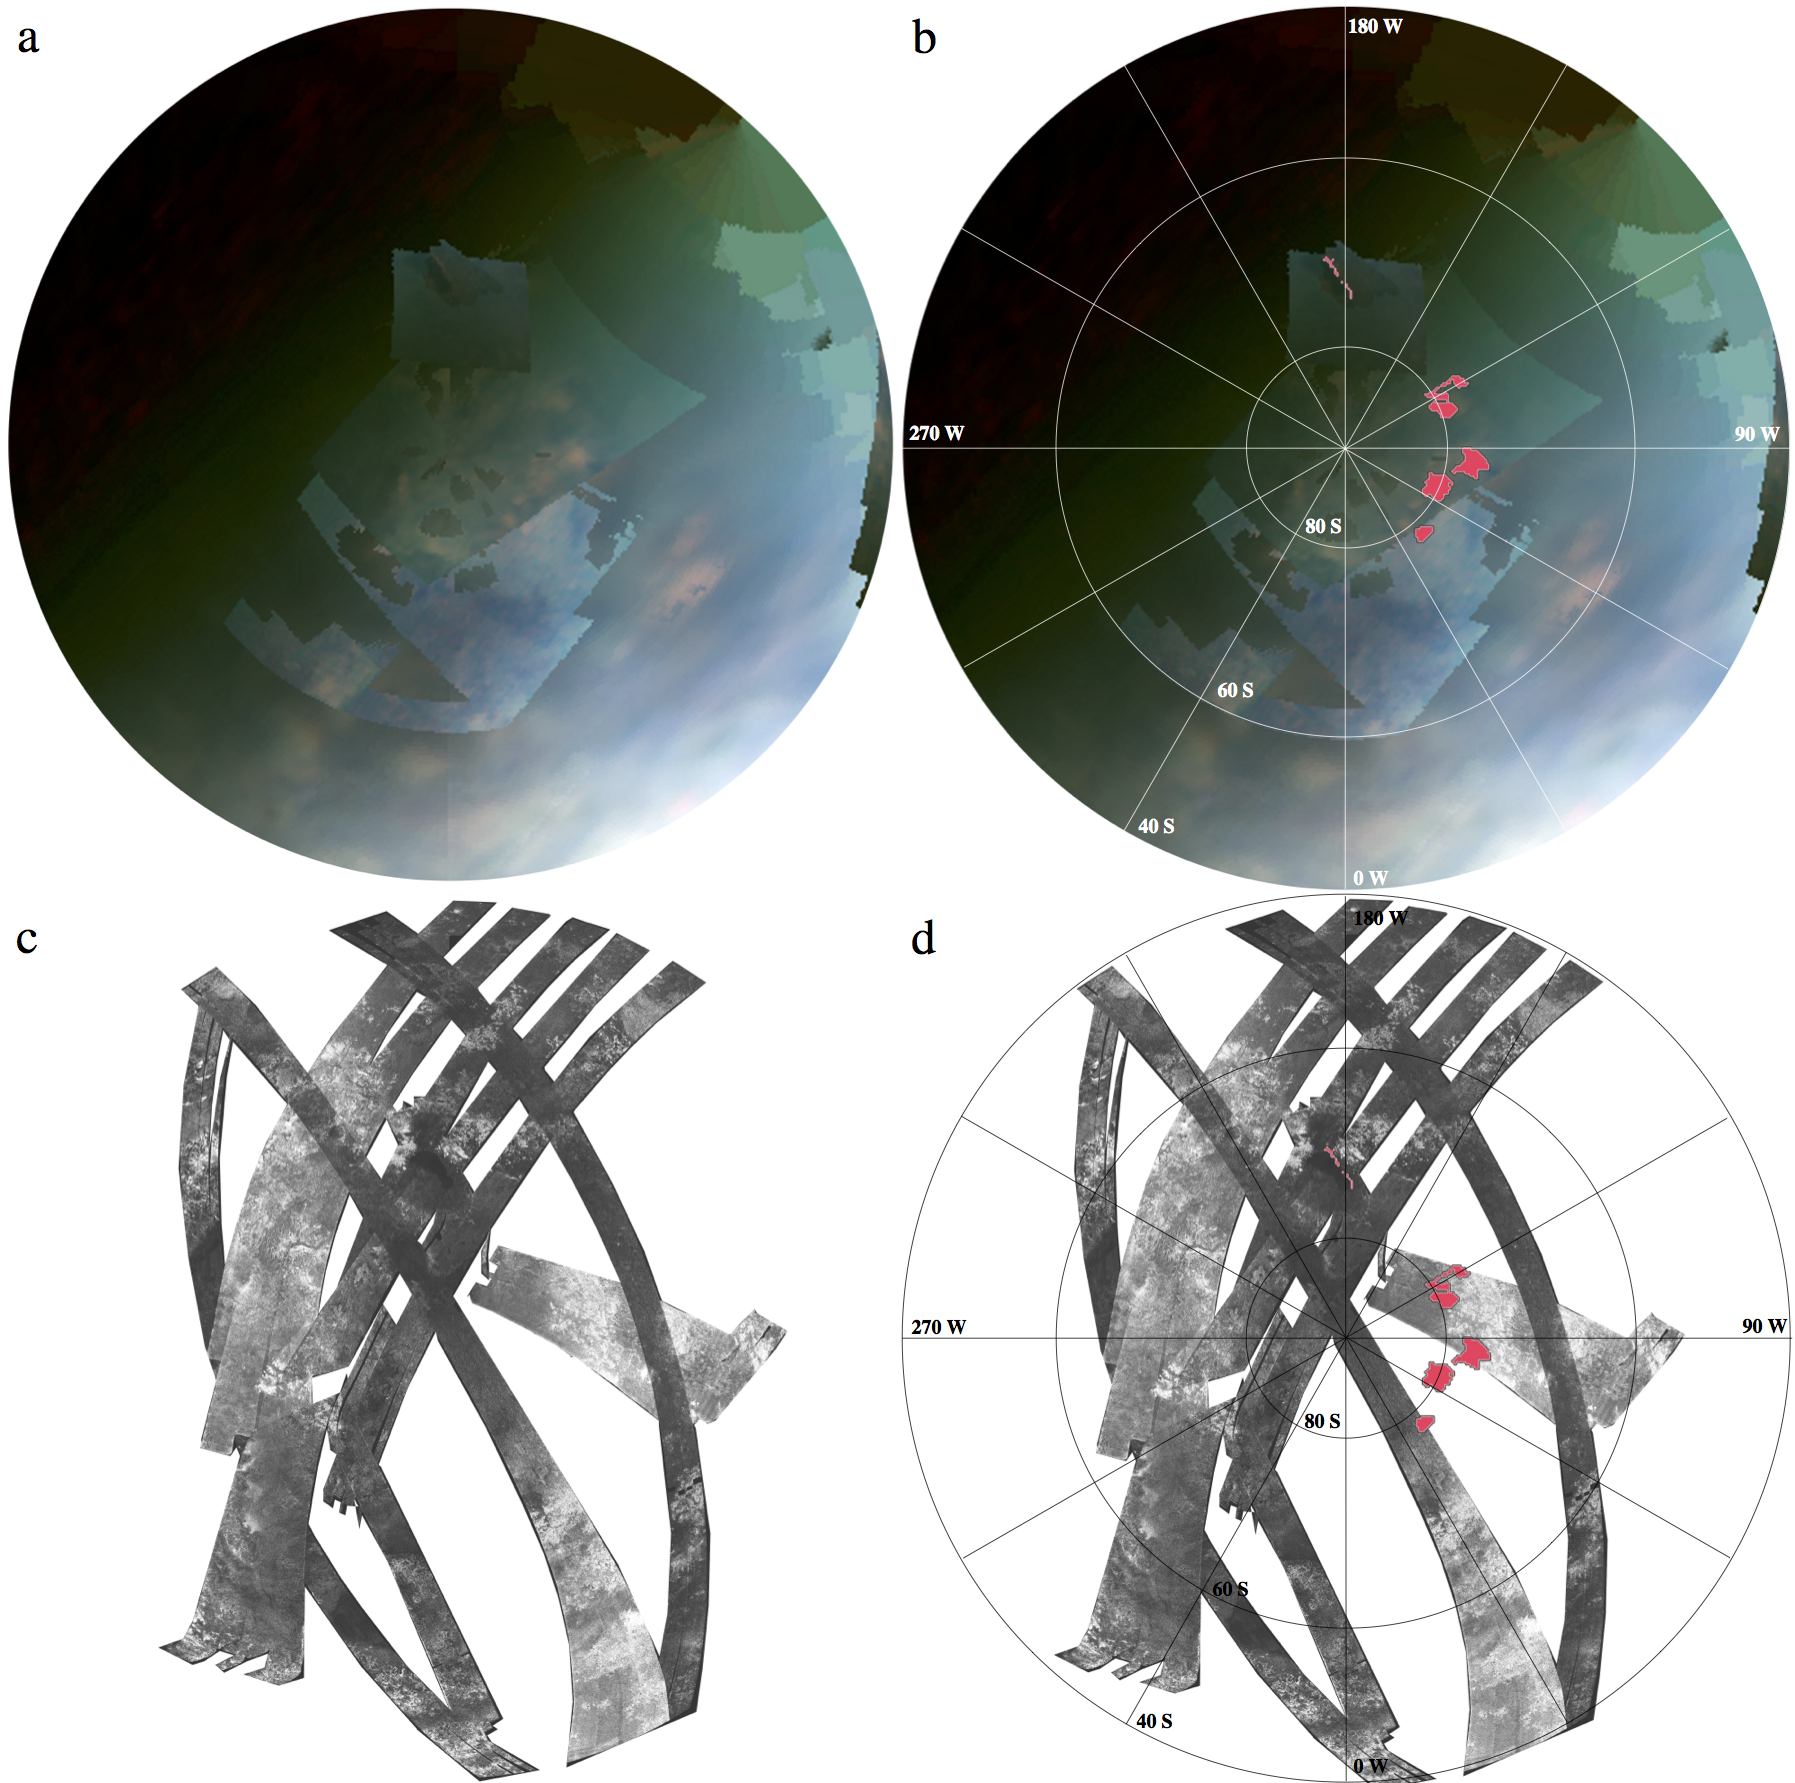
Cassini’s RADAR has revealed Titan’s south pole to have a geomorphology as complex as the north: hummocky terrain thought to be topographic highs (Lopes et al., 2010), fluvial networks (Burr et al., 2013), and lacustrine features both persistent and ephemeral (Hayes et al., 2011). Unlike the north pole, however, where lacustrine and evaporitic features are widely distributed and vary greatly in size, the southern polar region is dotted with only a handful of evaporite candidates large enough for VIMS to spectrally identify. Shown in Figure 13, these deposits are found along the shorelines of Ontario Lacus, isolated in the eastern half of the region, and on the edges of Arrakis Planitia.
The 5-m-bright material along the eastern shore of Ontario Lacus, the largest and most long-lived liquid filled body in the region (Brown et al., 2008; Turtle et al., 2009), has been well documented (Barnes et al., 2009; Wall et al., 2010; Turtle et al., 2011b; Cornet et al., 2012a, b)). The general geomorphological interpretation is that this area is an evaporite covered (Barnes et al., 2009) alluvial plane (Wall et al., 2010; Turtle et al., 2011b; Wall et al., 2010), though Cornet et al. (2012a) also propose lunette dunes. We estimate that evaporite covers an area equivalent to 17% of Ontario’s liquid filled portion and would require an increase in liquid volume of about 30% to cover it (using the same method described in Section 3.3).
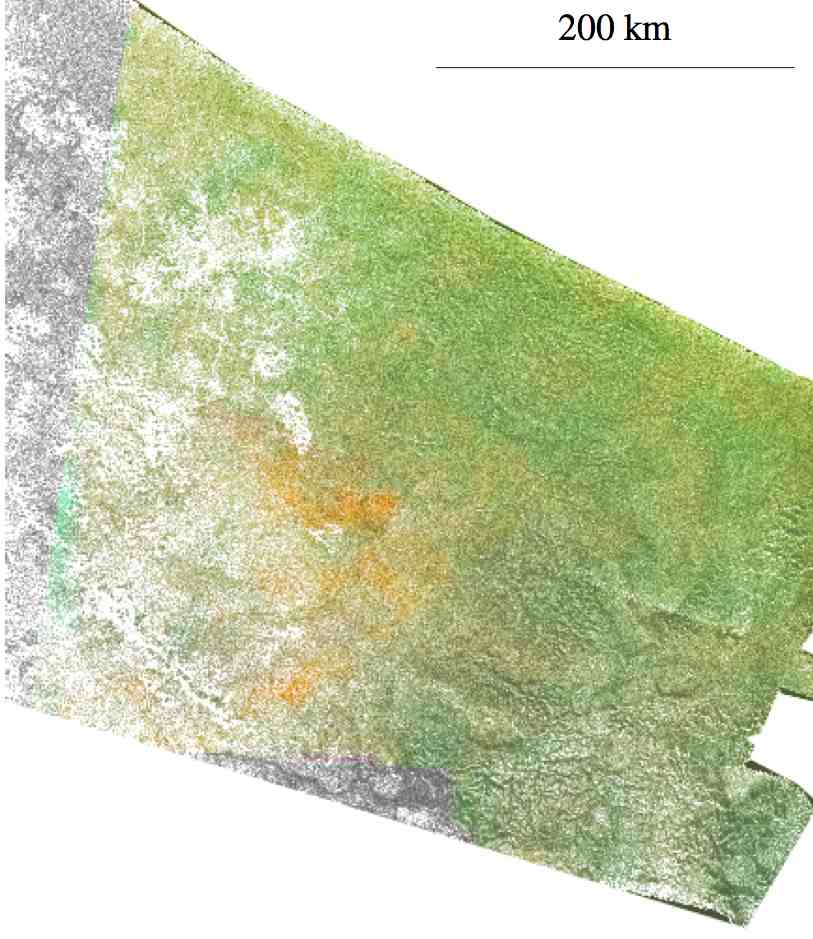
A darkening of Arrakis Planitia was observed from T0 (2004 July 3) to Rev009 (2005 June 6) by ISS coincident with cloud coverage in Ta (2004 October 6) (Turtle et al., 2009). The area was then seen to return to the lighter albedo observed in 2004 in ISS data procured in T50 (2009 February 6) (Turtle et al., 2011a). This surface change was interpreted by Turtle et al. (2009) and Turtle et al. (2011a) as precipitation driven wetting and subsequent drying by infiltration or evaporation. VIMS observed Arrakis Planitia in T20 (2006 October 25), T22 (2006 December 28), T23 (2007 January 13), T24 (2007 January 29), and T51 (2009 March 27), revealing some 5-m-bright signatures in the same area. In T20, the signature is small and faint. In T22, the area is covered by low altitude clouds, which seem to move or dissipate by T23. The 5-m-bright feature looks the same in T23 and T24, but by T51 extends over a somewhat larger area. We interpret these observations as complementary to the processes observed by ISS–the increase in 5-m-bright signature could be due to surface liquid (either still present from Ta or in connection to the cloud activity of T22) evaporating and leaving the 5-m-bright material behind. This would be similar to the scenarios explored by Barnes et al. (2013), where the evaporite deposit north of Yalaing Terra disappears after a rainfall event and reappears when (presumably) the surface liquid has evaporated again. Figure 14 shows the correlation between RADAR coverage from T49 and the VIMS data from T51. The evaporitic material lies along the border of the low plain. (The T24 coverage of Arrakis Planitia is shown in the VIMS composite of Figure 13.)
The other two candidates in the south pole do not coincide with any RADAR data, but are seen to be 5-m-bright in more than one flyby. We note that the locations of our evaporite candidates, except for that around Ontario Lacus, do not coincide with the pole’s large basins (Stofan et al., 2012; Lorenz et al., 2013) proposed by Wood et al. (2013) as large enough to be seas if they were filled. If the surface liquid transport were mostly seasonal, we would expect to see these basins filled to some extent during Cassini’s observations of southern summer. The absence of such filling in addition to the lack of evaporite would point to some longer than seasonal process of liquid exchange, if any ever occurred. The small lakes of the south pole (Hayes et al., 2011) could have a more seasonal cycle, though we anticipate that such a relatively short period of fill would not be enough to accumulate enough solute for evaporite formation.
3.5 Topography
 |
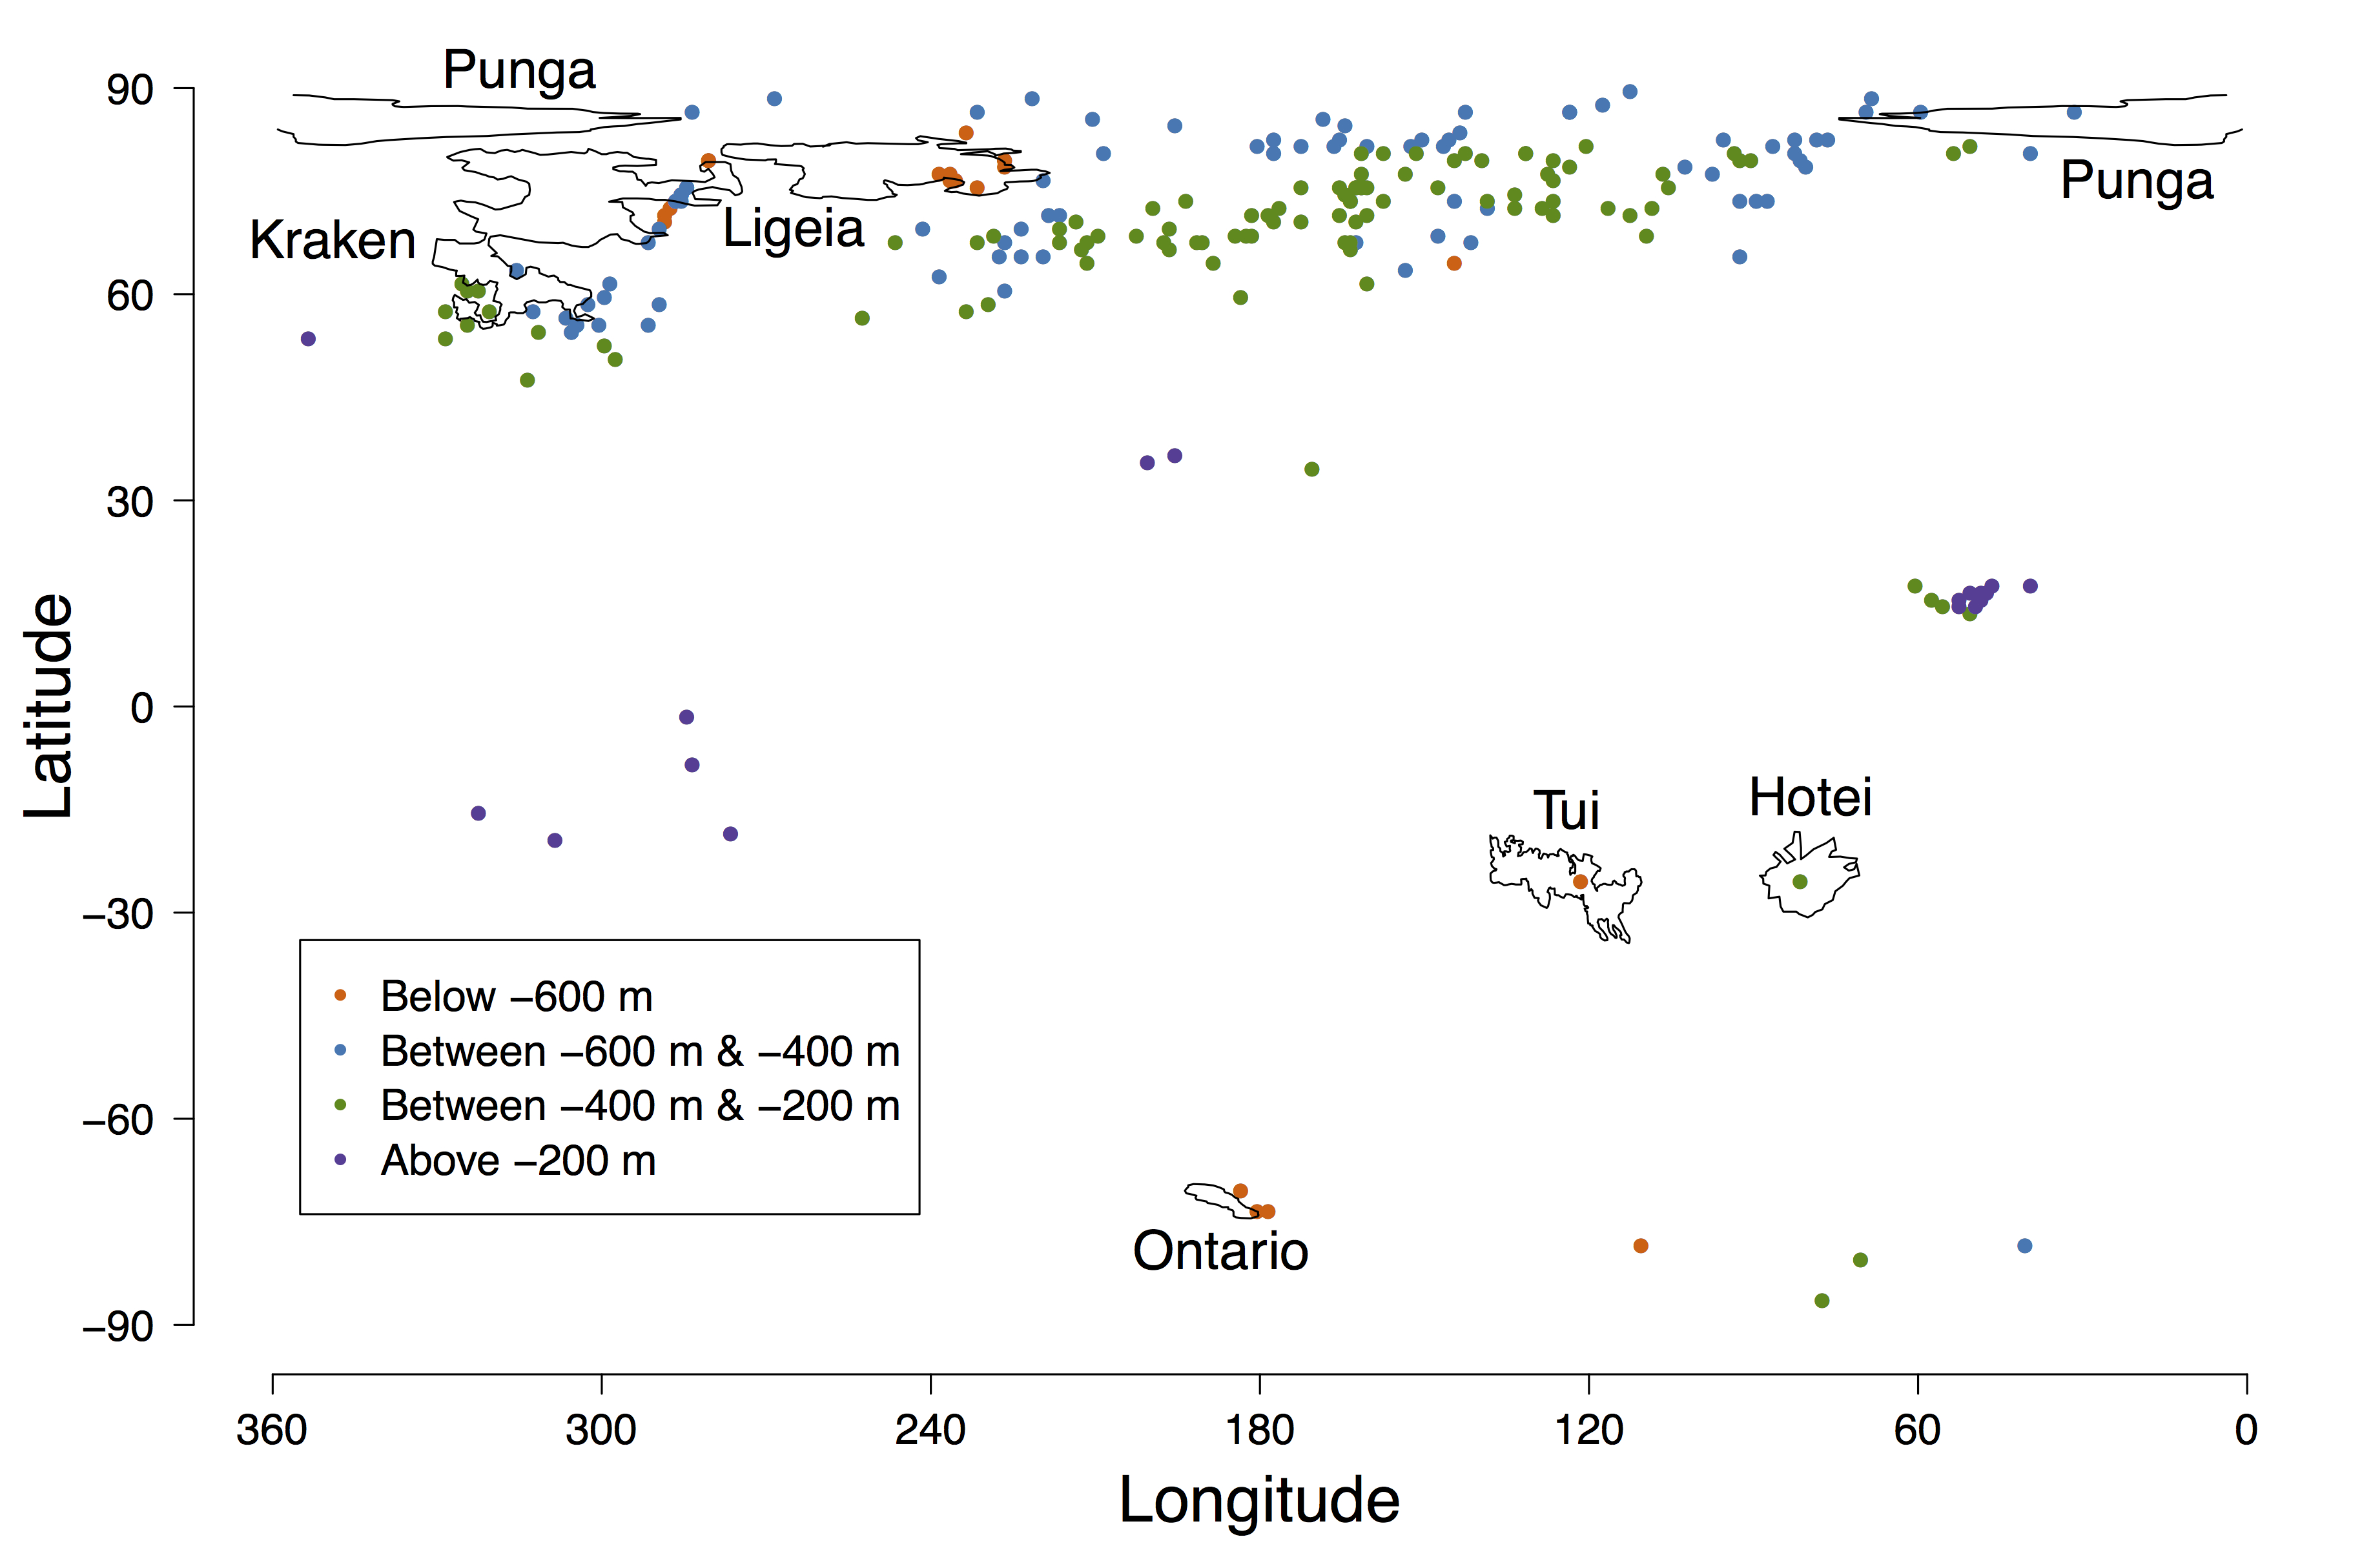 |
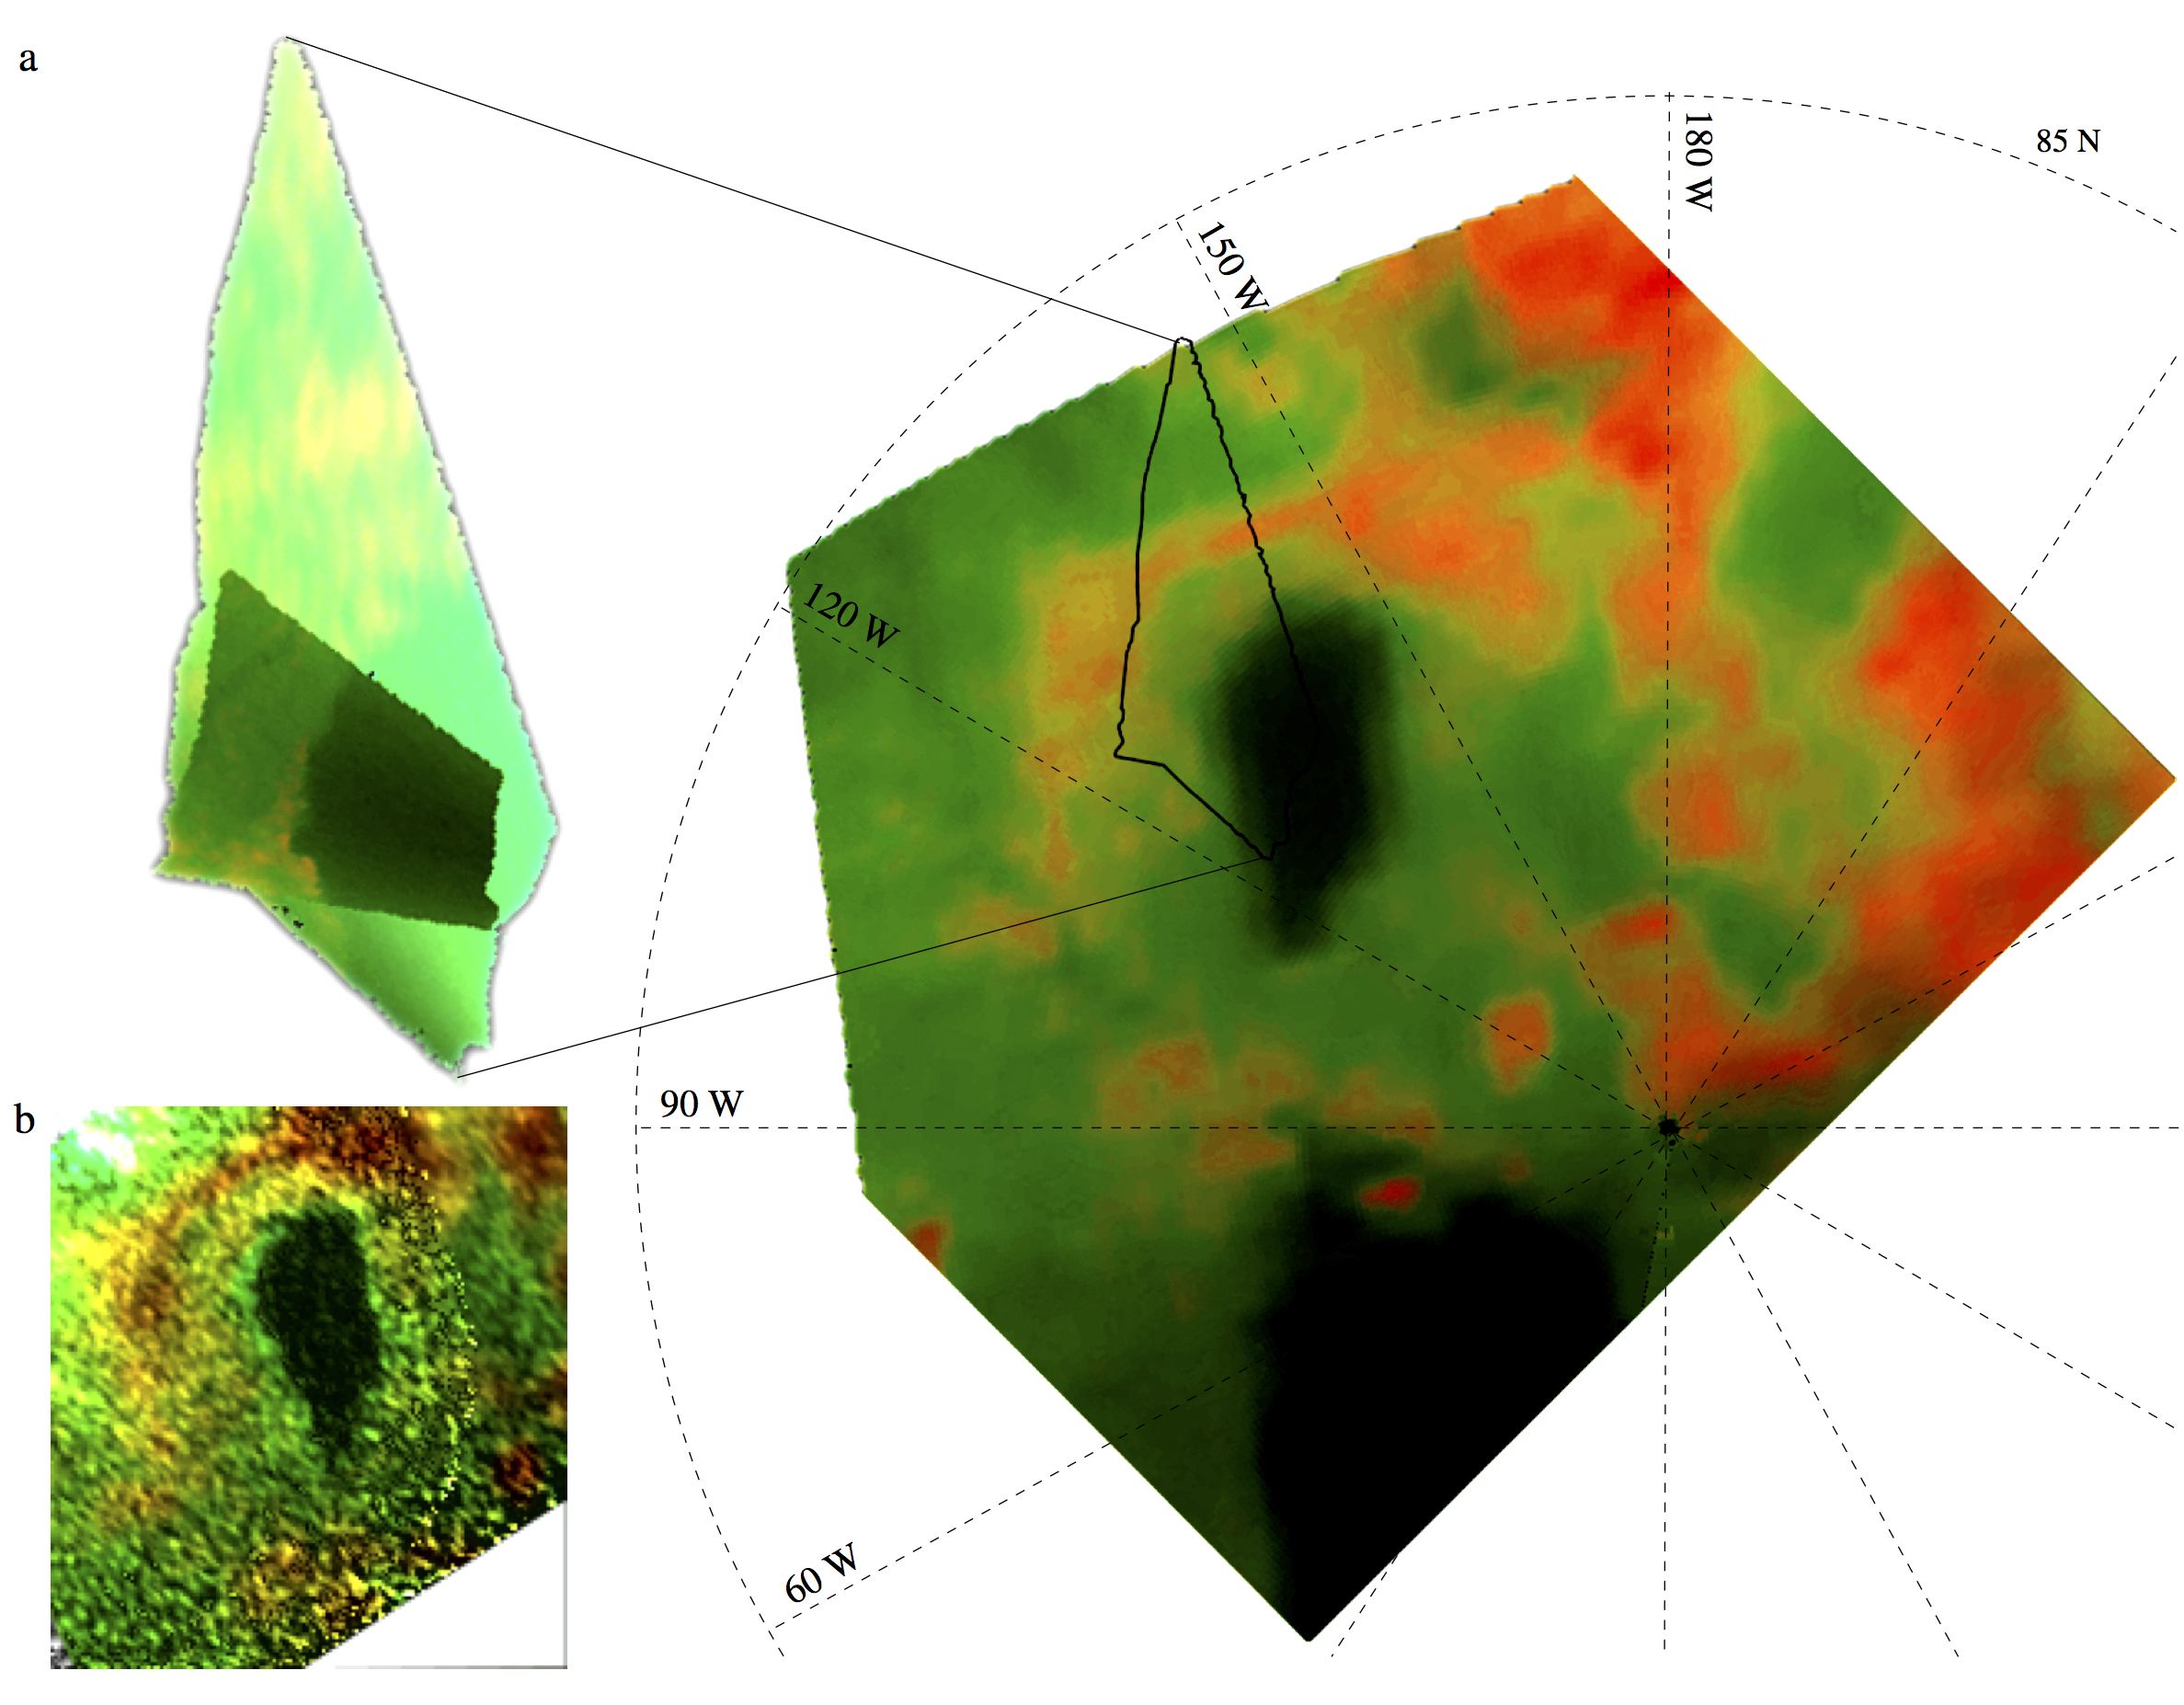
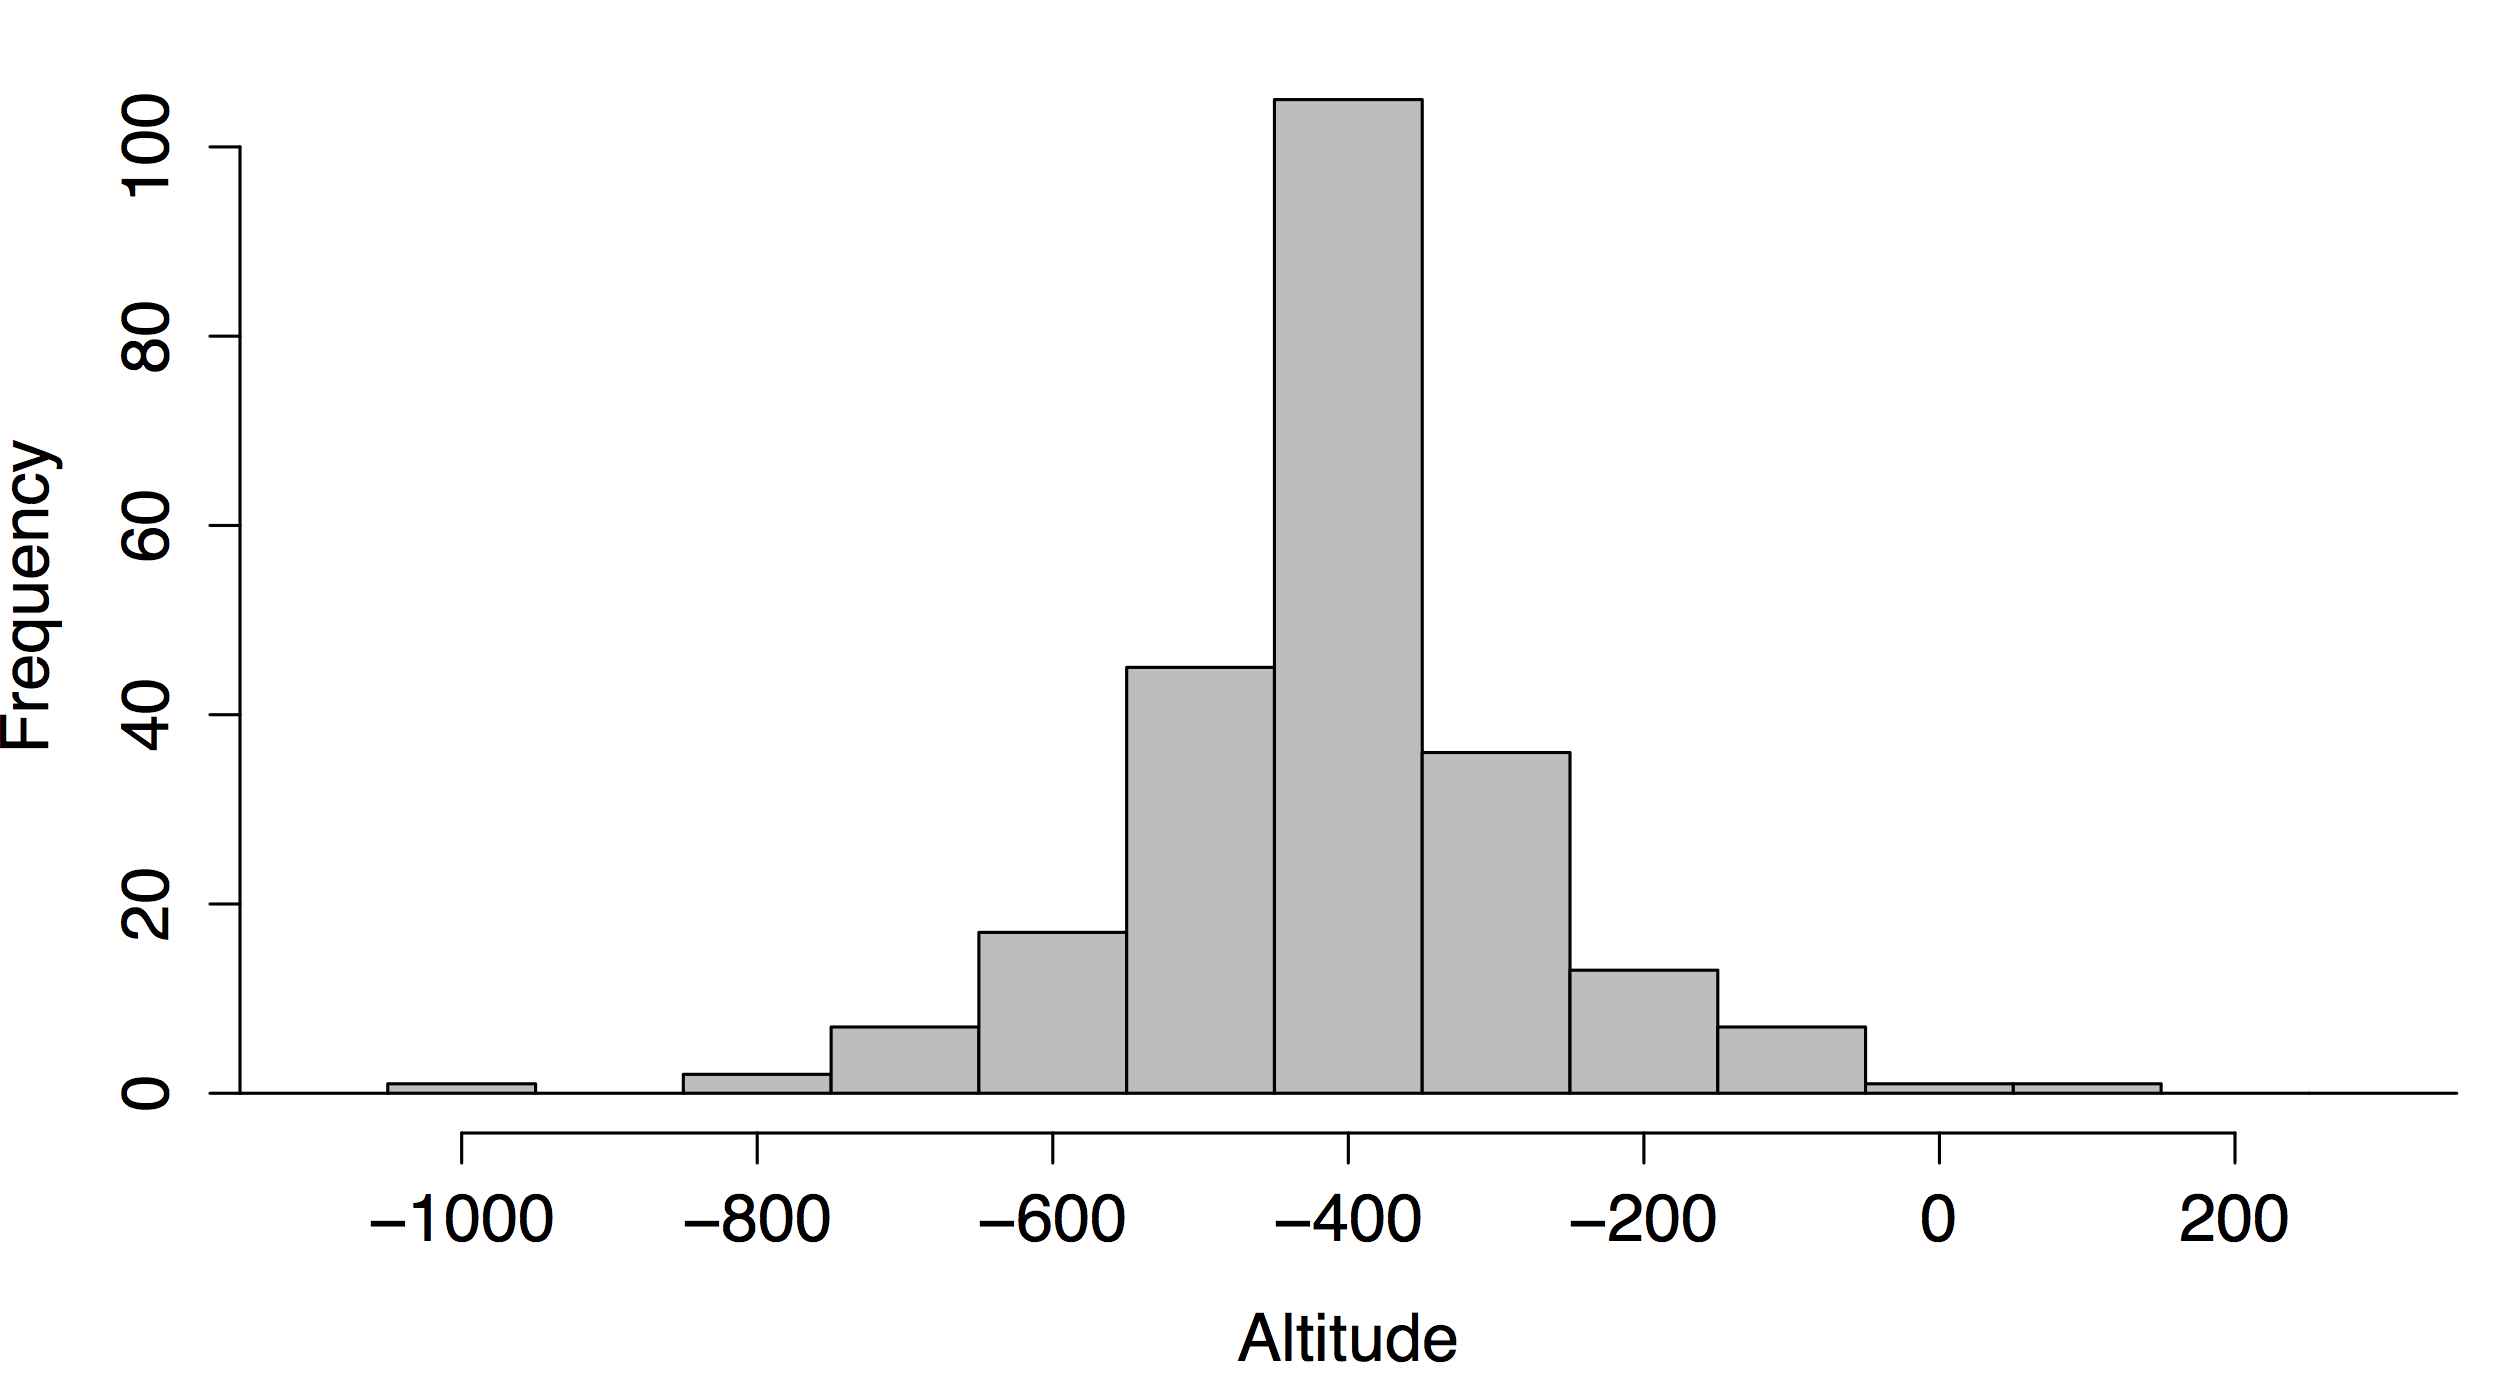
To date, the available topographic data for Titan cover only 11% (Lorenz et al., 2013) of the surface area. Recent work by Lorenz et al. (2013) interpolates a global topographic map for Titan based on these data from RADAR SAR, altimetry, and SARtopo (Stiles et al., 2009). To investigate the relative topography of our evaporite candidates, we transform the data of Lorenz et al. (2013) into altitudes relative to the degree-three geoid of Iess et al. (2012) by using the ellipsoid defined by . The results are shown in Figure 15: panel a shows the frequency of altitudes while panel b shows the global distribution of evaporite candidates binned by altitude.
The Gaussian shape of the histogram shows that the 5-m-bright material is not always at the overall lowest points on Titan. This is perhaps unsurprising in the case of evaporite formation. Liquid pools in local topographic lows, not necessarily global lows. After all, the largest salt basin on Earth today, Salar de Uyuni, was once a filled lake at 3,600 m above sea-level in the Andes Mountains. Additionally, salt deposits on Earth can be buried and later exhumed by tectonic activity. Comparing our evaporite candidate locations to the immediate vicinity indicates that the deposits are locally low-lying, at least at the resolution of the interpolated map. Further investigation and quantification of our proposed evaporite covered topography will therefore have to wait for a more conclusive topographic data set.
4 Discussion
Based on the correlation between 5-m-bright material and lakebeds shown in this work and by Barnes et al. (2011), we explore the implications of liquid having been present at some time in Titan’s history at the locations now covered with 5-m-bright material (with the caveat that more of this material may be present but buried under a thick enough layer to mask its spectral signature.) In this section, we begin with a discussion of explicitly evaporation-formed deposits, as the geomorphological evidence for 5-m-bright material on the shores of lakes in the north pole strongly suggests such a process has taken place on the surface (regardless of whether all our 5-m-bright deposits are formed in this exact manner or not). We then discuss the different scenarios implied by the absence of evaporite deposits in the south pole and the presence of such material in the equatorial basins Tui and Hotei. We conclude with a comment on the seasonality of these processes.
4.1 Evaporite Formation
The drying-up of a liquid body does not always involve the creation of evaporite: evaporite only forms when a solution becomes saturated and the dominant mechanism for liquid removal is evaporation. This is more likely to happen in closed systems where solute can’t be washed downstream or the solution can’t percolate through a porous regolith. In our discussion we describe such systems as long-lived, i.e. having been closed systems of surface liquid long enough to enable saturation of the solution. Short-lived surface liquids, such as those left after a rainfall, may come into contact with a large amount of dissolvable material as they flow across the surface. However, maintaining saturation and evaporation-dominant removal is probably more difficult, especially if the flow is fairly fast or in contact with other streams of liquid. We note that “short-lived” is an ambiguous term, referring to an amount of time that is simply less than that required for saturation to take place– the latter is a function of the chemical nature of both solute and solvent, as well as the terrain over which these surface processes are happening. For example, Malaska and Hodyss (2014) suggest that an ethane-rich Ontario Lacus should have reached saturation with benzene falling from the atmosphere within 3-20 million years.
Due to the yet-unknown exact chemical composition of Titan’s evaporites, we cannot definitively exclude the possibility that the deposits are themselves volatile. As Cassini has yet to capture even one full Titan year and data for particular regions are not continuous, it is difficult to observationally determine the rates of such processes. We expect, however, that they would have to operate on geological timescales based on the relative stability observed of the evaporite candidates: the shoreline deposits around Ontario Lacus are seen in T38 and T51 (a little over one terrestrial year); Kraken Mare’s shoreline deposits are observable from T61-T82 (two years); and Tui Regio is 5-m-bright from Ta-T51 (four and a half years). The evaporite deposit at the north end of Yalaing Terra did disappear for some time following a rain induced surface wetting event, but then returned to its original, 5-m-bright spectral signature. This would seem to imply that if the 5-m-bright material is volatile, it either recondenses onto the surface in the exact same location (within 3-11 months after the first observation of the evaporite’s disappearance) or is only volatile on longer time scales. There is no evidence from the Cassini data that the 5-m-bright material is volatile on a less than seasonal time scale, though we cannot rule out longer time scales without a better definition of the material’s chemical makeup.
4.2 South Polar Basins
Aharonson et al. (2009) argue that the periodicity of which pole receives the greater summer insolation (according to the behavior of Saturn’s orbit) is responsible for the migration of liquid between the north and south poles (a Milankovich cycle). Thus orbital influence driving the evaporation-to-precipitation ratio assumes that the south will at some time look like the north does today: the region where the majority of the surface liquid is concentrated. Why then, if the south at one time housed enough liquid to make seas from the dry basins observed today (Wood et al., 2013; Lorenz et al., 2013) are there no evaporite deposits similar in extent to the north pole? We offer two categories of answers to this question: either (1) evaporite formed but is no longer visible or (2) conditions were never suitable for evaporite formation.
The southern basins could be closed systems; they are probably the lowest points (Lorenz et al., 2013) in the region, so liquid would tend to pool there. Thus, evaporite formed at the south pole would have either been covered up since the liquid moved north or was itself volatile. If the evaporite is simply covered by settling atmospheric aerosols, a 0.15 -1.5 mm thick layer could build up over the 45 kyr period predicted for a Milankovich cycle. This is an upper limit– the time required to completely empty the southern seas is not taken into account. As VIMS only probes a few microns into the surface, this could be enough to mask an evaporite layer. It could also be that the 5-m-bright material is ephemeral: eroded away by weather, volatile enough to sublimate, or chemically altered while exposed on the surface. All of these processes could occur on Milankovich cycle timescales to remove 5-m-bright material.
And yet, another explanation for the lack of evaporites is that they never formed. Perhaps the basins were not filled long enough for the liquid to reach saturation. Or, some other mechanism may have been more dominant in removing liquid from the system– a porous regolith or connection to a subsurface reservoir could empty the basins without any evaporite deposition. These scenarios are inconsistent with Milankovich cycles, as there is no evidence of a subsurface connection to allow the liquid to get back to the north pole (Sotin et al., 2014).
Evaporite also wouldn’t form if the basins have never been filled (clearly not in agreement with a Milankovich cycle as described above). For example, if the total methane volume in Titan’s atmosphere and surface is not constant, then there might not have been enough methane available to fill the south seas at the periods of greatest solar insolation (i.e. heaviest rainfall). In one of the possible cases for Titan’s methane abundance modeled by Nixon et al. (2012), the supply increases over time, a process that is probably driven by the brightening of the Sun over time (Ribas et al., 2005) warming Titan’s crust (Nixon et al., 2012). In such a scenario, there may not have been enough liquid to fill the north pole lakes and seas, the equatorial basins, and the south polar basins.
4.3 Equatorial Basins
In light of the discussion above, what does the presence of 5-m-bright material imply for the histories of Tui and Hotei? Based on Earth analogs, we assume that such a large areal extent of evaporite lying at the bottom of a basin is more consistent with a long-lived body of liquid, where a saturated solution has been in a closed system long enough to undergo a few cycles of evaporite formation to deposit the material we observe today. While Xanadu is a neighboring, low-lying region, its paucity of 5-m-bright material is consistent with the requirement that liquid systems be sufficiently closed to form evaporite (at least on the order of the large scale deposits observable by VIMS): Xanadu is riddled with channels (Burr et al., 2009) that (probably) drain liquid into Tui and Hotei. Burr et al. (2013) discuss a variety of possible flow mechanisms that may be happening in Xanadu based on the observed fluvial features.
Assuming evaporite did form at the south pole and has subsequently been buried, why haven’t the deposits covering Tui and Hotei suffered the same fate? As noted by Sotin et al. (2012), the haze production rates of Rannou et al. (2003, 2004, 2006); Wahlund et al. (2009) span a range of values as do possible particle densities. If we use the lower estimate of the deposition rate of atmospheric particles to be about 0.1 m per Titan year, it would take a few thousand Earth years to build up a layer of atmospheric particles on the surface of Tui and Hotei thick enough to mask the signal from any 5-m-bright material. However, with higher estimates of haze production, on the order of 1 m per Titan year, deposition would sufficiently build up after only a few hundred Earth years. Either Tui and Hotei were filled more recently than this (and thus also more recently than the proposed south polar seas) or the basins experience enough rainfall to dissolve and reprecipitate the evaporite deposits on timescales comparable to those predicted for equatorial storms. However, there is as yet no observational evidence for rainfall reaching Tui and Hotei.
It is also unlikely that a single storm of the present climate could have created the amount of liquid necessary to create Tui and Hotei’s evaporites. The evaporites extend to the RADAR-identified boundaries of Tui and Hotei, thus the basins would have had to be completely filled to deposit evaporite at those farthest edges. According to the calculations of Section 3.3, we show that this is a sizable volume of liquid. Comparisons between possible flooding mechanisms on Earth, Mars, and Titan led Burr (2010) to conclude that monsoonal flooding of the equatorial region (and thus the resulting carving of fluvial features) could be linked to a methane cycle. Periods of heavy rainfall would deplete the atmosphere, creating a more arid climate that would slowly be replenished until saturation in the atmosphere triggered another monsoon event. Pluvial events like these are responsible for some of the largest salt pans on Earth: Devil’s Golf Course (Arizona, USA), Bonneville Salt Flats (Utah, USA), and the Lake Eyre (South Australia, Australia).
4.4 Seasonality
The most likely candidates for evaporitic compounds on Titan are the hydrocarbons that originate in the atmosphere that have been dissolved in the surface liquid. Titan’s surface liquid is probably a complex mixture of methane, ethane, nitrogen, and small amounts of alkanes (e.g. propane) (Cordier et al., 2013; Glein and Shock, 2013) (but see Mastrogiuseppe et al. (2014)). Experimental studies (Luspay-Kuti et al., 2012) and thermodynamic models (Glein and Shock, 2013) indicate that organic molecules have a higher solubility with liquid ethane than methane. While this affects the composition of the solution itself, it has less influence on the actual formation of evaporite. Evaporite can only form if the solution is saturated. Thus, regardless of the solubilities of the individual constituent solvents, solute will deposit when one evaporates.
The composition of the solution filling the lakes does raise questions concerning the seasonality of evaporation and evaporite formation. Methane is thought to be the only compound volatile enough to undergo evaporation over reasonable timescales; ethane has been proposed to be volatile on larger-than-seasonal timescales. Hence, if evaporation were the sole mechanism for evacuating both methane and ethane (as we expect for evaporite-bottomed lakes), the lake desiccation processes would take longer than methane evaporation alone. Alternatively, if an over-saturated, ethane-dominated lake were emptied of liquid via a regolith porous enough for the solution but not the undissolved solute to percolate through, then evaporite formed when the methane evaporated could be left behind. It is also possible to envision scenarios where different liquid-removing mechanisms have been dominant at different times. Infiltration could drain out some of the liquid and evaporation became the dominant mechanism after the subsurface liquid reaches the water-table, for example.
Thus, the evaporite formation timescale could be complex: formation associated with the evaporation of methane occurring seasonally and evaporation of the entire liquid body’s contents occurring over large enough timescales for ethane to evaporate, with allowances for rain influx. Presumably, such mechanisms would work faster with shallower bodies of liquid, such as those identified by Barnes et al. (2011), where the local timescales of evaporation would contribute to the observed dichotomy in surface liquid distribution on Titan. In the case that evaporation is the only liquid removal process in the lifetime of the lake, seasonal exchange of methane alone, as discussed above, is not enough to explain the observation of dry lakebeds with 5-m-bright bottoms.
5 Conclusion
Operating under the hypothesis put forth by Barnes et al. (2011) that coherent, 5-m-bright signatures on Titan’s surface are evaporitic in origin, we map the global distribution of 5-m-bright material and thus present newly-identified evaporite candidates. These evaporite candidates cover a little over 1% of Titan’s surface area and are mostly concentrated in Tui and Hotei Regiones (proposed fossil seas of the equatorial region) and at the north pole (around the giant seas and dry, filled, or wetted lakebeds). Unlike those at their northern counterparts, the south polar basins are noticeably void of 5-m-bright material, prompting the following possible explanations: evaporite deposits at the south pole have been subsequently covered or removed, or conditions were never suitable for evaporite formation. In these two scenarios, Tui and Hotei were then either filled more recently than the south polar basins or the processes responsible for making evaporite in the north pole also took place at the equatorial basins (but not at the south). As climate models seek to address the currently observed asymmetry in surface liquid distribution between the north and south polar regions, we encourage the consideration of each of these scenarios and their implications, including the more active role of the equatorial region implied by the evaporitic evidence for Tui and Hotei having once been filled seas.
Without the benefit of a lander, Titan’s surface composition must be constrained through other, less direct means. We present this distribution of evaporite candidates as the first in a series of works investigating the 5-m-bright spectral unit. Having now cataloged the total and best occurrences of each isolated deposit, we will next be able to construct spectra of high enough signal-to-noise to facilitate inter-flyby comparison. In particular, we will look for the absorption feature at 4.92 m exhibited by Tui and Hotei in the spectra of other evaporite candidates (McCord et al., 2008). Especially in comparison to the spectra of 5-m-bright deposits observed on the shores of filled lakes or dried lake beds, a sharing of this absorption feature would strengthen the case of the 5-m-bright unit as diagnostic of material of evaporitic-origin.
6 Acknowledgements
The authors would like to thank an anonymous reviewer for constructive suggestions to the manuscript. This work was supported by NASA Cassini Data Analysts and Participating Scientists (CDAPS) grant #NNX12AC28G to JWB. CS acknowledges support from the NASA Astrobiology Institute. Part of this work was conducted at JPL/Caltech under contract with NASA.
References
- Aharonson et al. (2009) Aharonson, O., Hayes, A. G., Lunine, J. I., Lorenz, R. D., Allison, M. D., Elachi, C., Dec. 2009. An asymmetric distribution of lakes on Titan as a possible consequence of orbital forcing. Nature Geoscience 2, 851–854.
- Barnes et al. (2011) Barnes, J. W., Bow, J., Schwartz, J., Brown, R. H., Soderblom, J. M., Hayes, A. G., Vixie, G., Le Mouélic, S., Rodriguez, S., Sotin, C., Jaumann, R., Stephan, K., Soderblom, L. A., Clark, R. N., Buratti, B. J., Baines, K. H., Nicholson, P. D., Nov. 2011. Organic sedimentary deposits in Titan’s dry lakebeds: Probable evaporite. Icarus 216, 136–140.
- Barnes et al. (2006) Barnes, J. W., Brown, R. H., Radebaugh, J., Buratti, B. J., Sotin, C., Le Mouelic, S., Rodriguez, S., Turtle, E. P., Perry, J., Clark, R., Baines, K. H., Nicholson, P. D., Aug. 2006. Cassini observations of flow-like features in western Tui Regio, Titan. GRL 33, L16204.
- Barnes et al. (2009) Barnes, J. W., Brown, R. H., Soderblom, J. M., Soderblom, L. A., Jaumann, R., Jackson, B., Le Mouélic, S., Sotin, C., Buratti, B. J., Pitman, K. M., Baines, K. H., Clark, R. N., Nicholson, P. D., Turtle, E. P., Perry, J., May 2009. Shoreline features of Titan’s Ontario Lacus from Cassini/VIMS observations. Icarus 201, 217–225.
- Barnes et al. (2007a) Barnes, J. W., Brown, R. H., Soderblom, L., Buratti, B. J., Sotin, C., Rodriguez, S., Le Mouèlic, S., Baines, K. H., Clark, R., Nicholson, P., Jan. 2007a. Global-scale surface spectral variations on Titan seen from Cassini/VIMS. Icarus 186, 242–258.
- Barnes et al. (2008) Barnes, J. W., Brown, R. H., Soderblom, L., Sotin, C., Le Mouèlic, S., Rodriguez, S., Jaumann, R., Beyer, R. A., Buratti, B. J., Pitman, K., Baines, K. H., Clark, R., Nicholson, P., May 2008. Spectroscopy, morphometry, and photoclinometry of Titan’s dunefields from Cassini/VIMS. Icarus 195, 400–414, doi:10.1016/j.icarus.2007.12.006.
- Barnes et al. (2005) Barnes, J. W., Brown, R. H., Turtle, E. P., McEwen, A. S., Lorenz, R. D., Janssen, M., Schaller, E. L., Brown, M. E., Buratti, B. J., Sotin, C., Griffith, C., Clark, R., Perry, J., Fussner, S., Barbara, J., West, R., Elachi, C., Bouchez, A. H., Roe, H. G., Baines, K. H., Bellucci, G., Bibring, J.-P., Capaccioni, F., Cerroni, P., Combes, M., Coradini, A., Cruikshank, D. P., Drossart, P., Formisano, V., Jaumann, R., Langevin, Y., Matson, D. L., McCord, T. B., Nicholson, P. D., Sicardy, B., Oct. 2005. A 5-Micron-Bright Spot on Titan: Evidence for Surface Diversity. Science 310, 92–95.
- Barnes et al. (2013) Barnes, J. W., Buratti, B. J., Turtle, E. P., Bow, J., Dalba, P. A., Perry, J. E., Brown, R. H., Rodriguez, S., Le Mouélic, S., Baines, K. H., Sotin, C., Lorenz, R. D., Malaska, M. J., McCord, T. B., Clark, R. N., Jaumann, R., Hayne, P. O., Nicholson, P. D., Soderblom, J. M., Soderblom, L. A., Jan. 2013. Precipitation-Induced Surface Brightenings Seen on Titan by Cassini VIMS and ISS. Planetary Science 2.
- Barnes et al. (2007b) Barnes, J. W., Radebaugh, J., Brown, R. H., Wall, S., Soderblom, L., Lunine, J., Burr, D., Sotin, C., Le Mouélic, S., Rodriguez, S., Buratti, B. J., Clark, R., Baines, K. H., Jaumann, R., Nicholson, P. D., Kirk, R. L., Lopes, R., Lorenz, R. D., Mitchell, K., Wood, C. A., Nov. 2007b. Near-infrared spectral mapping of Titan’s mountains and channels. JGR Planets 112, 11006.
- Barth (2010) Barth, E. L., Nov. 2010. Cloud formation along mountain ridges on Titan. P&SS 58, 1740–1747.
- Brown et al. (2010) Brown, M. E., Roberts, J. E., Schaller, E. L., Feb. 2010. Clouds on Titan during the Cassini prime mission: A complete analysis of the VIMS data. Icarus 205, 571–580.
- Brown et al. (2009) Brown, M. E., Smith, A. L., Chen, C., Ádámkovics, M., Nov. 2009. Discovery of Fog at the South Pole of Titan. ApJ-L 706, L110–L113.
- Brown et al. (2008) Brown, R. H., Soderblom, L. A., Soderblom, J. M., Clark, R. N., Jaumann, R., Barnes, J. W., Sotin, C., Buratti, B., Baines, K. H., Nicholson, P. D., Jul. 2008. The identification of liquid ethane in Titan’s Ontario Lacus. Nature 454, 607–610.
- Burr (2010) Burr, D. M., Feb. 2010. Palaeoflood-generating mechanisms on Earth, Mars, and Titan. Global and Planetary Change 70, 5–13.
-
Burr et al. (2013)
Burr, D. M., Drummond, S. A., Cartwright, R., Black, B. A., Perron, J. T.,
2013. Morphology of fluvial networks on titan: Evidence for structural
control. Icarus 226 (1), 742 – 759.
URL http://www.sciencedirect.com/science/article/pii/S0019103513002728 - Burr et al. (2009) Burr, D. M., Jacobsen, R. E., Roth, D. L., Phillips, C. B., Mitchell, K. L., Viola, D., Nov. 2009. Fluvial network analysis on Titan: Evidence for subsurface structures and west-to-east wind flow, southwestern Xanadu. GRL 36, 22203.
-
Burr et al. (2013)
Burr, D. M., Perron, T., Lamb, M. P., Irwin, R. P., Collins, G. C.,
Howard, A. D., Sklar, L. S., Moore, J. M., , Adamkovics, M., Baker,
V. R. Drummond, S., Black, B. A., 2013. Fluvial features on Titan:
Insights from morphology and modeling. Bulletin of the Geological Society of
America 125, 229 – 321.
URL http://www.sciencedirect.com/science/article/pii/S0019103513002728 - Cook et al. (submitted) Cook, C., Barnes, J. W., Kattenhorn, S. A., Radebaugh, J., Beuthe, M., submitted. Evidence for Global Contraction on Titan from Patterns of Tectonism. JGRP.
- Cordier et al. (2013) Cordier, D., Barnes, J. W., Ferreira, A. G., Nov. 2013. On the chemical composition of Titan’s dry lakebed evaporites. Icarus 226, 1431–1437.
- Cordier et al. (2009) Cordier, D., Mousis, O., Lunine, J. I., Lavvas, P., Vuitton, V., Dec. 2009. An Estimate of the Chemical Composition of Titan’s Lakes. ApJ-L 707, L128–L131.
- Cornet et al. (2012a) Cornet, T., Bourgeois, O., Le Mouélic, S., Rodriguez, S., Lopez Gonzalez, T., Sotin, C., Tobie, G., Fleurant, C., Barnes, J. W., Brown, R. H., Baines, K. H., Buratti, B. J., Clark, R. N., Nicholson, P. D., Apr. 2012a. Geomorphological significance of Ontario Lacus on Titan: Integrated interpretation of Cassini VIMS, ISS and RADAR data and comparison with the Etosha Pan (Namibia). Icarus 218, 788–806.
- Cornet et al. (2012b) Cornet, T., Bourgeois, O., Le Mouélic, S., Rodriguez, S., Sotin, C., Barnes, J. W., Brown, R. H., Baines, K. H., Buratti, B. J., Clark, R. N., Nicholson, P. D., Jul. 2012b. Edge detection applied to Cassini images reveals no measurable displacement of Ontario Lacus’ margin between 2005 and 2010. JGR Planets 117, 7005.
- Elachi et al. (2006) Elachi, C., Wall, S., Janssen, M., Stofan, E., Lopes, R., Kirk, R., Lorenz, R., Lunine, J., Paganelli, F., Soderblom, L., Wood, C., Wye, L., Zebker, H., Anderson, Y., Ostro, S., Allison, M., Boehmer, R., Callahan, P., Encrenaz, P., Flamini, E., Francescetti, G., Gim, Y., Hamilton, G., Hensley, S., Johnson, W., Kelleher, K., Muhleman, D., Picardi, G., Posa, F., Roth, L., Seu, R., Shaffer, S., Stiles, B., Vetrella, S., West, R., Jun. 2006. Titan Radar Mapper observations from Cassini’s T3 fly-by. Nature 441, 709–713.
- Flasar (1983) Flasar, F. M., Jul. 1983. Oceans on Titan? Science 221, 55–57.
- Glein and Shock (2013) Glein, C. R., Shock, E. L., Aug. 2013. A geochemical model of non-ideal solutions in the methane-ethane-propane-nitrogen-acetylene system on Titan. Geochimica et Cosmochimica Acta 115, 217–240.
-
Griffith (2009)
Griffith, C. A., 2009. Storms, polar deposits and the methane cycle in Titan’s
atmosphere. Philosophical Transactions of the Royal Society A: Mathematical,
Physical and Engineering Sciences 367 (1889), 713–728.
URL http://rsta.royalsocietypublishing.org/content/367/1889/713.abstract - Griffith et al. (2012) Griffith, C. A., Lora, J. M., Turner, J., Penteado, P. F., Brown, R. H., Tomasko, M. G., Doose, L., See, C., Jun. 2012. Possible tropical lakes on Titan from observations of dark terrain. Nature 486, 237–239.
- Griffith et al. (1998) Griffith, C. A., Owen, T., Miller, G. A., Geballe, T., 1998. Transient clouds in Titan’s lower atmosphere. Nature 395, 575–578.
- Griffith et al. (2005) Griffith, C. A., Penteado, P., Baines, K., Drossart, P., Barnes, J., Bellucci, G., Bibring, J., Brown, R., Buratti, B., Capaccioni, F., Cerroni, P., Clark, R., Combes, M., Coradini, A., Cruikshank, D., Formisano, V., Jaumann, R., Langevin, Y., Matson, D., McCord, T., Mennella, V., Nelson, R., Nicholson, P., Sicardy, B., Sotin, C., Soderblom, L. A., Kursinski, R., Oct. 2005. The Evolution of Titan’s Mid-Latitude Clouds. Science 310, 474–477.
- Griffith et al. (2006) Griffith, C. A., Penteado, P., Rannou, P., Brown, R., Boudon, V., Baines, K. H., Clark, R., Drossart, P., Buratti, B., Nicholson, P., McKay, C. P., Coustenis, A., Negrao, A., Jaumann, R., Sep. 2006. Evidence for a Polar Ethane Cloud on Titan. Science 313, 1620–1622.
- Hayes et al. (2008) Hayes, A., Aharonson, O., Callahan, P., Elachi, C., Gim, Y., Kirk, R., Lewis, K., Lopes, R., Lorenz, R., Lunine, J., Mitchell, K., Mitri, G., Stofan, E., Wall, S., May 2008. Hydrocarbon lakes on Titan: Distribution and interaction with a porous regolith. Geophysical Research Letters 35, L9204.
- Hayes et al. (2011) Hayes, A. G., Aharonson, O., Lunine, J. I., Kirk, R. L., Zebker, H. A., Wye, L. C., Lorenz, R. D., Turtle, E. P., Paillou, P., Mitri, G., Wall, S. D., Stofan, E. R., Mitchell, K. L., Elachi, C., the Cassini RADAR Team, Jan. 2011. Transient surface liquid in Titan’s polar regions from Cassini. Icarus 211, 655–671.
- Hayes et al. (2014) Hayes, A. G., Michaelides, R. J., Turtle, E. P., Barnes, J. W., Soderblom, J. M., Masrtogiuseppe, M., Lorenz, R. D., Kirk, R. L., Lunine, J. I., Mar. 2014. The Distribution and Volume of Titan’s Hydrocarbon Lakes and Seas. In: Lunar and Planetary Science Conference. Vol. 45 of Lunar and Planetary Science Conference. p. 2341.
- Hayes et al. (2010) Hayes, A. G., Wolf, A. S., Aharonson, O., Zebker, H., Lorenz, R., Kirk, R. L., Paillou, P., Lunine, J., Wye, L., Callahan, P., Wall, S., Elachi, C., Sep. 2010. Bathymetry and absorptivity of Titan’s Ontario Lacus. Journal of Geophysical Research (Planets) 115, 9009.
- Hirtzig et al. (2009) Hirtzig, M., Tokano, T., Rodriguez, S., Le Mouélic, S., Sotin, C., Jun. 2009. A review of Titan’s atmospheric phenomena. JGR Planets 17, 105–147.
- Iess et al. (2012) Iess, L., Jacobson, R. A., Ducci, M., Stevenson, D. J., Lunine, J. I., Armstrong, J. W., Asmar, S. W., Racioppa, P., Rappaport, N. J., Tortora, P., Jul. 2012. The Tides of Titan. Science 337, 457–.
- Jaumann et al. (2008) Jaumann, R., Brown, R. H., Stephan, K., Barnes, J. W., Soderblom, L. A., Sotin, C., Le Mouélic, S., Clark, R. N., Soderblom, J., Buratti, B. J., Wagner, R., McCord, T. B., Rodriguez, S., Baines, K. H., Cruikshank, D. P., Nicholson, P. D., Griffith, C. A., Langhans, M., Lorenz, R. D., Oct. 2008. Fluvial erosion and post-erosional processes on Titan. Icarus 197, 526–538.
- Langhans et al. (2012) Langhans, M. H., Jaumann, R., Stephan, K., Brown, R. H., Buratti, B. J., Clark, R. N., Baines, K. H., Nicholson, P. D., Lorenz, R. D., Soderblom, L. A., Soderblom, J. M., Sotin, C., Barnes, J. W., Nelson, R., Jan. 2012. Titan’s fluvial valleys: Morphology, distribution, and spectral properties. P&SS 60, 34–51.
- Le Mouélic et al. (2008) Le Mouélic, S., Paillou, P., Janssen, M. A., Barnes, J. W., Rodriguez, S., Sotin, C., Brown, R. H., Baines, K. H., Buratti, B. J., Clark, R. N., Crapeau, M., Encrenaz, P. J., Jaumann, R., Geudtner, D., Paganelli, F., Soderblom, L., Tobie, G., Wall, S., Apr. 2008. Mapping and interpretation of Sinlap crater on Titan using Cassini VIMS and RADAR data. JGR Planets 113, 4003.
- Le Mouélic et al. (2012) Le Mouélic, S., Rannou, P., Rodriguez, S., Sotin, C., Griffith, C. A., Le Corre, L., Barnes, J. W., Brown, R. H., Baines, K. H., Buratti, B. J., Clark, R. N., Nicholson, P. D., Tobie, G., Jan. 2012. Dissipation of Titan’s north polar cloud at northern spring equinox. P&SS 60, 86–92.
- Lopes et al. (2013) Lopes, R. M. C., Kirk, R. L., Mitchell, K. L., Legall, A., Barnes, J. W., Hayes, A., Kargel, J., Wye, L., Radebaugh, J., Stofan, E. R., Janssen, M. A., Neish, C. D., Wall, S. D., Wood, C. A., Lunine, J. I., Malaska, M. J., Mar. 2013. Cryovolcanism on Titan: New results from Cassini RADAR and VIMS. JGR Planets 118, 416–435.
- Lopes et al. (2010) Lopes, R. M. C., Stofan, E. R., Peckyno, R., Radebaugh, J., Mitchell, K. L., Mitri, G., Wood, C. A., Kirk, R. L., Wall, S. D., Lunine, J. I., Hayes, A., Lorenz, R., Farr, T., Wye, L., Craig, J., Ollerenshaw, R. J., Janssen, M., Legall, A., Paganelli, F., West, R., Stiles, B., Callahan, P., Anderson, Y., Valora, P., Soderblom, L., Cassini RADAR Team, Feb. 2010. Distribution and interplay of geologic processes on Titan from Cassini radar data. Icarus 205, 540–558.
-
Lorenz et al. (2014)
Lorenz, R. D., Kirk, R. L., Hayes, A. G., Anderson, Y. Z., Lunine, J. I.,
Tokano, T., Turtle, E. P., Malaska, M. J., Soderblom, J. M., Lucas, A., zg r
Karatekin, Wall, S. D., 2014. A radar map of titan seas: Tidal dissipation
and ocean mixing through the throat of kraken. Icarus 237 (0), 9 – 15.
URL http://www.sciencedirect.com/science/article/pii/S0019103514001973 - Lorenz et al. (2008a) Lorenz, R. D., Lopes, R. M., Paganelli, F., Lunine, J. I., Kirk, R. L., Mitchell, K. L., Soderblom, L. A., Stofan, E. R., Ori, G., Myers, M., Miyamoto, H., Radebaugh, J., Stiles, B., Wall, S. D., Wood, C. A., Jun. 2008a. Fluvial channels on Titan: Initial Cassini RADAR observations. P&SS 56, 1132–1144.
- Lorenz and Lunine (1996) Lorenz, R. D., Lunine, J. I., Jul. 1996. Erosion on Titan: Past and Present. Icarus 122, 79–91.
- Lorenz and Lunine (2005) Lorenz, R. D., Lunine, J. I., Apr. 2005. Titan’s surface before Cassini. P&SS 53, 557–576.
- Lorenz et al. (2008b) Lorenz, R. D., Mitchell, K. L., Kirk, R. L., Hayes, A. G., Aharonson, O., Zebker, H. A., Paillou, P., Radebaugh, J., Lunine, J. I., Janssen, M. A., Wall, S. D., Lopes, R. M., Stiles, B., Ostro, S., Mitri, G., Stofan, E. R., Jan. 2008b. Titan’s inventory of organic surface materials. GRL 35, 2206.
- Lorenz and Radebaugh (2009) Lorenz, R. D., Radebaugh, J., Feb. 2009. Global pattern of Titan’s dunes: Radar survey from the Cassini prime mission. GRL 36, 3202.
- Lorenz et al. (2013) Lorenz, R. D., Stiles, B. W., Aharonson, O., Lucas, A., Hayes, A. G., Kirk, R. L., Zebker, H. A., Turtle, E. P., Neish, C. D., Stofan, E. R., Barnes, J. W., Jul. 2013. A global topographic map of Titan. Icarus 225, 367–377.
- Lunine et al. (2008) Lunine, J. I., Elachi, C., Wall, S. D., Janssen, M. A., Allison, M. D., Anderson, Y., Boehmer, R., Callahan, P., Encrenaz, P., Flamini, E., Franceschetti, G., Gim, Y., Hamilton, G., Hensley, S., Johnson, W. T. K., Kelleher, K., Kirk, R. L., Lopes, R. M., Lorenz, R., Muhleman, D. O., Orosei, R., Ostro, S. J., Paganelli, F., Paillou, P., Picardi, G., Posa, F., Radebaugh, J., Roth, L. E., Seu, R., Shaffer, S., Soderblom, L. A., Stiles, B., Stofan, E. R., Vetrella, S., West, R., Wood, C. A., Wye, L., Zebker, H., Alberti, G., Karkoschka, E., Rizk, B., McFarlane, E., See, C., Kazeminejad, B., May 2008. Titan’s diverse landscapes as evidenced by Cassini RADAR’s third and fourth looks at Titan. Icarus 195, 415–433.
- Lunine et al. (1983) Lunine, J. I., Stevenson, D. J., Yung, Y. L., Dec. 1983. Ethane ocean on Titan. Science 222, 1229–1230.
- Luspay-Kuti et al. (2012) Luspay-Kuti, A., Chevrier, V. F., Wasiak, F. C., Roe, L. A., Welivitiya, W. D. D. P., Cornet, T., Singh, S., Rivera-Valentin, E. G., Dec. 2012. Experimental simulations of CH4 evaporation on Titan. GRL 39, 23203.
-
Malaska and Hodyss (2014)
Malaska, M. J., Hodyss, R., 2014. Dissolution of benzene, naphthalene, and
biphenyl in a simulated titan lake. Icarus (0), –.
URL http://www.sciencedirect.com/science/article/pii/S0019103514004072 - Mandt et al. (2012) Mandt, K. E., Waite, J. H., Teolis, B., Magee, B. A., Bell, J., Westlake, J. H., Nixon, C. A., Mousis, O., Lunine, J. I., Apr. 2012. The 12C/13C Ratio on Titan from Cassini INMS Measurements and Implications for the Evolution of Methane. Astrophysical Journal 749, 160.
- Mastrogiuseppe et al. (2014) Mastrogiuseppe, M., Poggiali, V., Hayes, A., Lorenz, R., Lunine, J., Picardi, G., Seu, R., Flamini, E., Mitri, G., Notarnicola, C., Paillou, P., Zebker, H., Mar. 2014. The bathymetry of a Titan sea. GRL 41, 1432–1437.
- McCord et al. (2008) McCord, T. B., Hayne, P., Combe, J.-P., Hansen, G. B., Barnes, J. W., Rodriguez, S., Le Mouélic, S., Baines, E. K. H., Buratti, B. J., Sotin, C., Nicholson, P., Jaumann, R., Nelson, R., the Cassini VIMS Team, Mar. 2008. Titan’s surface: Search for spectral diversity and composition using the Cassini VIMS investigation. Icarus 194, 212–242.
- Mitchell (2008) Mitchell, J. L., Aug. 2008. The drying of Titan’s dunes: Titan’s methane hydrology and its impact on atmospheric circulation. Journal of Geophysical Research (Planets) 113, 8015.
- Mitchell et al. (2009) Mitchell, J. L., Pierrehumbert, R. T., Frierson, D. M. W., Caballero, R., Sep. 2009. The impact of methane thermodynamics on seasonal convection and circulation in a model Titan atmosphere. Icarus 203, 250–264.
- Mitri et al. (2007) Mitri, G., Showman, A. P., Lunine, J. I., Lorenz, R. D., Feb. 2007. Hydrocarbon lakes on Titan. Icarus 186, 385–394.
- Moore and Howard (2010) Moore, J. M., Howard, A. D., Nov. 2010. Are the basins of Titan’s Hotei Regio and Tui Regio sites of former low latitude seas? GRL 37, L22205.
- Niemann et al. (2005) Niemann, H. B., Atreya, S. K., Bauer, S. J., Carignan, G. R., Demick, J. E., Frost, R. L., Gautier, D., Haberman, J. A., Harpold, D. N., Hunten, D. M., Israel, G., Lunine, J. I., Kasprzak, W. T., Owen, T. C., Paulkovich, M., Raulin, F., Raaen, E., Way, S. H., Dec. 2005. The abundances of constituents of Titan’s atmosphere from the GCMS instrument on the Huygens probe. Nature 438, 779–784.
- Nixon et al. (2012) Nixon, C. A., Temelso, B., Vinatier, S., Teanby, N. A., Bézard, B., Achterberg, R. K., Mandt, K. E., Sherrill, C. D., Irwin, P. G. J., Jennings, D. E., Romani, P. N., Coustenis, A., Flasar, F. M., Apr. 2012. Isotopic Ratios in Titan’s Methane: Measurements and Modeling. Astrophysical Journal 749, 159.
- Radebaugh et al. (2007) Radebaugh, J., Lorenz, R. D., Kirk, R. L., Lunine, J. I., Stofan, E. R., Lopes, R. M. C., Wall, S. D., the Cassini Radar Team, Dec. 2007. Mountains on Titan observed by Cassini Radar. Icarus 192, 77–91.
- Radebaugh et al. (2008) Radebaugh, J., Lorenz, R. D., Lunine, J. I., Wall, S. D., Boubin, G., Reffet, E., Kirk, R. L., Lopes, R. M., Stofan, E. R., Soderblom, L., Allison, M., Janssen, M., Paillou, P., Callahan, P., Spencer, C., The Cassini Radar Team, Apr. 2008. Dunes on Titan observed by Cassini Radar. Icarus 194, 690–703.
- Rannou et al. (2004) Rannou, P., Hourdin, F., McKay, C. P., Luz, D., Aug. 2004. A coupled dynamics-microphysics model of Titan’s atmosphere. Icarus 170, 443–462.
- Rannou et al. (2003) Rannou, P., McKay, C. P., Lorenz, R. D., Dec. 2003. A model of Titan’s haze of fractal aerosols constrained by multiple observations. P&SS 51, 963–976.
- Rannou et al. (2006) Rannou, P., Montmessin, F., Hourdin, F., Lebonnois, S., Jan. 2006. The Latitudinal Distribution of Clouds on Titan. Science 311, 201–205.
-
Ribas et al. (2005)
Ribas, I., Guinan, E. F., Gudel, M., Audard, M., 2005. Evolution of the
solar activity over time and effects on planetary atmospheres. i. high-energy
irradiances (1-1700 a). The Astrophysical Journal 622 (1), 680.
URL http://stacks.iop.org/0004-637X/622/i=1/a=680 -
Rodriguez et al. (2014)
Rodriguez, S., Garcia, A., Lucas, A., App r , T., Le Gall, A.,
Reffet, E., Le Corre, L., Le Mou lic, S., Cornet, T., Courrech du
Pont, S., Narteau, C., Bourgeois, O., Radebaugh, J., Arnold, K.,
Barnes, J., Stephan, K., Jaumann, R., Sotin, C., Brown, R.,
Lorenz, R., Turtle, E., 2014. Global mapping and characterization of
Titan’s dune fields with Cassini: correlation between RADAR and VIMS
observations . Icarus.
URL http://www.sciencedirect.com/science/article/pii/S0019103513004892 - Rodriguez et al. (2011) Rodriguez, S., Le Mouélic, S., Rannou, P., Sotin, C., Brown, R. H., Barnes, J. W., Griffith, C. A., Burgalat, J., Baines, K. H., Buratti, B. J., Clark, R. N., Nicholson, P. D., Nov. 2011. Titan’s cloud seasonal activity from winter to spring with Cassini/VIMS. Icarus 216, 89–110.
- Rodriguez et al. (2009) Rodriguez, S., Le Mouélic, S., Rannou, P., Tobie, G., Baines, K. H., Barnes, J. W., Griffith, C. A., Hirtzig, M., Pitman, K. M., Sotin, C., Brown, R. H., Buratti, B. J., Clark, R. N., Nicholson, P. D., Jun. 2009. Global circulation as the main source of cloud activity on Titan. Nature 459, 678–682.
- Rodriguez et al. (2006) Rodriguez, S., Le Mouélic, S., Sotin, C., Clénet, H., Clark, R. N., Buratti, B., Brown, R. H., McCord, T. B., Nicholson, P. D., Baines, K. H., the VIMS Science Team, Dec. 2006. Cassini/VIMS hyperspectral observations of the HUYGENS landing site on Titan. P&SS 54, 1510–1523.
- Roe (2012) Roe, H. G., May 2012. Titan’s Methane Weather. Annual Review of Earth and Planetary Sciences 40, 355–382.
- Schneider et al. (2012) Schneider, T., Graves, S. D. B., Schaller, E. L., Brown, M. E., Jan. 2012. Polar methane accumulation and rainstorms on Titan from simulations of the methane cycle. Nature 481, 58–61.
- Soderblom et al. (2009) Soderblom, L. A., Brown, R. H., Soderblom, J. M., Barnes, J. W., Kirk, R. L., Sotin, C., Jaumann, R., MacKinnon, D. J., Mackowski, D. W., Baines, K. H., Buratti, B. J., Clark, R. N., Nicholson, P. D., Dec. 2009. The geology of Hotei Regio, Titan: Correlation of Cassini VIMS and RADAR. Icarus 204, 610–618.
- Soderblom et al. (2007) Soderblom, L. A., Kirk, R. L., Lunine, J. I., Anderson, J. A., Baines, K. H., Barnes, J. W., Barrett, J. M., Brown, R. H., Buratti, B. J., Clark, R. N., Cruikshank, D. P., Elachi, C., Janssen, M. A., Jaumann, R., Karkoschka, E., Mouélic, S. L., Lopes, R. M., Lorenz, R. D., McCord, T. B., Nicholson, P. D., Radebaugh, J., Rizk, B., Sotin, C., Stofan, E. R., Sucharski, T. L., Tomasko, M. G., Wall, S. D., Nov. 2007. Correlations between Cassini VIMS spectra and RADAR SAR images: Implications for Titan’s surface composition and the character of the Huygens Probe Landing Site. P&SS 55, 2025–2036.
- Solomonidou et al. (submitted) Solomonidou, A., Hirtzig, M., Coustenis, E. B., Bratsolis, E., Le Mouelic, S., Rodriguez, S., Stephan, K., Drossart, P., Sotin, C., Jaumann, R., Brown, R. H., Kyriakopoulos, K., Lopes, R. M. C., Bampasidis, G., Stamatelopoulou-Seymour, K., Moussas, X., submitted. Surface albedo spectral properties of geologically interesting areas on Titan. JGR Planets.
- Sotin et al. (2012) Sotin, C., Lawrence, K. J., Reinhardt, B., Barnes, J. W., Brown, R. H., Hayes, A. G., Le Mouélic, S., Rodriguez, S., Soderblom, J. M., Soderblom, L. A., Baines, K. H., Buratti, B. J., Clark, R. N., Jaumann, R., Nicholson, P. D., Stephan, K., Nov. 2012. Observations of Titan’s Northern lakes at 5 m: Implications for the organic cycle and geology. Icarus 221, 768–786.
- Sotin et al. (2014) Sotin, C., Seignovert, B., Lawrence, K. J., MacKenzie, S. M., Barnes, J. W., Brown, R. H., 2014. Titan’s geoid and hydrology: implications for Titan’s geological evolution. in prep.
- Stiles et al. (2009) Stiles, B. W., Hensley, S., Gim, Y., Bates, D. M., Kirk, R. L., Hayes, A., Radebaugh, J., Lorenz, R. D., Mitchell, K. L., Callahan, P. S., Zebker, H., Johnson, W. T. K., Wall, S. D., Lunine, J. I., Wood, C. A., Janssen, M., Pelletier, F., West, R. D., Veeramacheneni, C., Cassini RADAR Team, Aug. 2009. Determining Titan surface topography from Cassini SAR data. Icarus 202, 584–598.
- Stofan et al. (2012) Stofan, E. R., Aharonson, O., Hayes, A. G., Kirk, R., Lopes, R., Lorenz, R. D., Lucas, A., Lunine, J. I., Malaska, M., Radebaugh, J., Stiles, B. W., Turtle, E. P., Wall, S. D., Wood, C. A., Cassini Radar Team, Oct. 2012. Searching for the Remnants of Southern Seas: Cassini Observations of the South Pole of Titan. In: AAS/Division for Planetary Sciences Meeting Abstracts. Vol. 44 of AAS/Division for Planetary Sciences Meeting Abstracts. p. #201.08.
- Stofan et al. (2007) Stofan, E. R., Elachi, C., Lunine, J. I., Lorenz, R. D., Stiles, B., Mitchell, K. L., Ostro, S., Soderblom, L., Wood, C., Zebker, H., Wall, S., Janssen, M., Kirk, R., Lopes, R., Paganelli, F., Radebaugh, J., Wye, L., Anderson, Y., Allison, M., Boehmer, R., Callahan, P., Encrenaz, P., Flamini, E., Francescetti, G., Gim, Y., Hamilton, G., Hensley, S., Johnson, W. T. K., Kelleher, K., Muhleman, D., Paillou, P., Picardi, G., Posa, F., Roth, L., Seu, R., Shaffer, S., Vetrella, S., West, R., Jan. 2007. The lakes of Titan. Nature 445, 61–64.
- Teanby et al. (2012) Teanby, N. A., Irwin, P. G. J., Nixon, C. A., de Kok, R., Vinatier, S., Coustenis, A., Sefton-Nash, E., Calcutt, S. B., Flasar, F. M., Nov. 2012. Active upper-atmosphere chemistry and dynamics from polar circulation reversal on Titan. Nature 491, 732–735.
- Tokano (2005) Tokano, T., Jan 2005. Meteorological assessment of the surface temperatures on titan: constraints on the surface type. Icarus 173, 222–242.
- Tokano (2009) Tokano, T., Dec. 2009. Impact of seas/lakes on polar meteorology of Titan: Simulation by a coupled GCM-Sea model. Icarus 204, 619–636.
- Tomasko et al. (2005) Tomasko, M. G., Archinal, B., Becker, T., Bézard, B., Bushroe, M., Combes, M., Cook, D., Coustenis, A., de Bergh, C., Dafoe, L. E., Doose, L., Douté, S., Eibl, A., Engel, S., Gliem, F., Grieger, B., Holso, K., Howington-Kraus, E., Karkoschka, E., Keller, H. U., Kirk, R., Kramm, R., Küppers, M., Lanagan, P., Lellouch, E., Lemmon, M., Lunine, J., McFarlane, E., Moores, J., Prout, G. M., Rizk, B., Rosiek, M., Rueffer, P., Schröder, S. E., Schmitt, B., See, C., Smith, P., Soderblom, L., Thomas, N., West, R., Dec. 2005. Rain, winds and haze during the Huygens probe’s descent to Titan’s surface. Nature 438, 765–778.
- Turtle et al. (2011a) Turtle, E. P., Perry, J. E., Hayes, A. G., Lorenz, R. D., Barnes, J. W., McEwen, A. S., West, R. A., Del Genio, A. D., Barbara, J. M., Lunine, J. I., Schaller, E. L., Ray, T. L., Lopes, R. M. C., Stofan, E. R., Mar. 2011a. Rapid and Extensive Surface Changes Near Titan’s Equator: Evidence of April Showers. Science 331, 1414–1417.
- Turtle et al. (2011b) Turtle, E. P., Perry, J. E., Hayes, A. G., McEwen, A. S., Apr. 2011b. Shoreline retreat at Titan’s Ontario Lacus and Arrakis Planitia from Cassini Imaging Science Subsystem observations. Icarus 212, 957–959.
- Turtle et al. (2009) Turtle, E. P., Perry, J. E., McEwen, A. S., Del Genio, A. D., Barbara, J., West, R. A., Dawson, D. D., Porco, C. C., Jan. 2009. Cassini imaging of Titan’s high-latitude lakes, clouds, and south-polar surface changes. Geophysical Research Letters 36, L2204.
- Vixie et al. (submitted) Vixie, G., Barnes, J., Jackson, B., Rodriguez, S., Le Mouelic, S., Sotin, C., Wilson, P., submitted. Temperate Lakes on Titan. Icarus.
- Wahlund et al. (2009) Wahlund, J.-E., Galand, M., Müller-Wodarg, I., Cui, J., Yelle, R. V., Crary, F. J., Mandt, K., Magee, B., Waite, J. H., Young, D. T., Coates, A. J., Garnier, P., Ågren, K., André, M., Eriksson, A. I., Cravens, T. E., Vuitton, V., Gurnett, D. A., Kurth, W. S., Dec. 2009. On the amount of heavy molecular ions in Titan’s ionosphere. P&SS 57, 1857–1865.
- Wall et al. (2010) Wall, S., Hayes, A., Bristow, C., Lorenz, R., Stofan, E., Lunine, J., Le Gall, A., Janssen, M., Lopes, R., Wye, L., Soderblom, L., Paillou, P., Aharonson, O., Zebker, H., Farr, T., Mitri, G., Kirk, R., Mitchell, K., Notarnicola, C., Casarano, D., Ventura, B., Mar. 2010. Active shoreline of Ontario Lacus, Titan: A morphological study of the lake and its surroundings. GRL 37, L5202.
- Wasiak et al. (2013) Wasiak, F. C., Androes, D., Blackburn, D. G., Tullis, J. A., Dixon, J., Chevrier, V. F., Aug. 2013. A geological characterization of Ligeia Mare in the northern polar region of Titan. P&SS 84, 141–147.
- Wood et al. (2013) Wood, C. A., Stofan, E. R., Hayes, A. G., Kirk, R. K., Lunine, J. I., Radebaugh, J., Malaska, M., Mar. 2013. Morphological Evidence for Former Seas Near Titan’s South Pole. In: Lunar and Planetary Institute Science Conference Abstracts. Vol. 44 of Lunar and Planetary Institute Science Conference Abstracts. p. 1764.